2012-13 Publicly Reported Assessment Results for Students with Disabilities and ELLs with DisabilitiesDeb Albus, Sheryl S. Lazarus, and Martha L. Thurlow May 2015 All rights reserved. Any or all portions of this document may be reproduced and distributed without prior permission, provided the source is cited as: Albus, D., Lazarus, S. S., & Thurlow, M. L. (2015). 2012-13 publicly reported assessment results for students with disabilities and ELLs with disabilities (Technical Report 70). Minneapolis, MN: University of Minnesota, National Center on Educational Outcomes.Acknowledgments Executive SummaryThis is the sixteenth report by the National Center on Educational Outcomes (NCEO) that analyzes how states publicly report online assessment data for students with disabilities in K-12 schools in the United States. The Individuals with Disabilities Education Act (IDEA) and the Elementary and Secondary Education Act (ESEA) require states to disaggregate participation and performance data at the state level. The ESEA flexibility waivers that many states received also require states to report data on assessments used for Title I accountability for the "all students" group as well as for all of the subgroups, including special education, as long as the number of students in a subgroup is equal to or above the minimum reporting number defined by the state. This report presents information on publicly reported participation and performance data for the 50 regular states and the 11 unique states (American Samoa, Bureau of Indian Education, Commonwealth of Northern Mariana Islands, U.S. Department of Defense Education Activities, District of Columbia, Federated States of Micronesia, Guam, Palau, Puerto Rico, Republic of the Marshall Islands, and U.S. Virgin Islands). For the 2012-13 school year, 52 of the 61 regular and unique states reported participation and performance data for students with disabilities for all general and alternate assessments based on alternate achievement standards (AA-AAS) that were used for Title I within the ESEA accountability system. Information about state assessments not used for Title I is also presented. Information on public reporting for English Language Learners (ELLs) with disabilities is also included in this report. As in the previous year, only seven states reported both participation and performance for ELLs with disabilities for the general assessment. And again, more states (N=21) reported these same data for ELLs with disabilities on the AA-AAS. A majority of states reported some participation and performance data by individual grade and test for students with disabilities, though a few only reported these data by merged grades or tests. Among regular and unique states for participation, 42 states reported number assessed and 38 states reported percent participating. For performance, 46 of the regular states and unique states reported student performance by achievement level, and 42 reported the percent proficient. This report also includes an analysis of the ease of finding these publicly reported assessment data for students with disabilities on states' department of education websites. This involved counting the number of mouse clicks that it took to arrive at public reports for students with disabilities on the general assessment and AA-AAS. For 34 of the regular states it took 3-4 clicks to arrive at the general assessment data; 5 or more clicks were required for 15 states. For AA-AAS data, 30 regular states required 3-4 clicks; 5 or more clicks were required for 17 states. Although states may make changes via waivers or other processes, the public reporting of data will continue to be an essential part of accountability systems. And, as states make transitions to new assessments based on College- and Career-Ready Standards, it will be important to continue to strive for clear reporting of student data. The following recommendations are offered to states for the public reporting of disaggregated data for students with disabilities:
OverviewUnder the Individuals with Disabilities Education Act (IDEA) and the Elementary and Secondary Education Act (ESEA), states receiving funding, including unique states, are required to report Reading, Mathematics, and Science assessment data used for Title I accountability to the federal government for all students and student subgroups. They are also to report these for the general public. Types of public reports found online include school "report cards," state assessment reports, and customized reports on state education websites (Albus, Lazarus, & Thurlow, 2014). Additionally, the ESEA flexibility waivers that many states received require states to report on their report cards, for the "all students" group and for all of the subgroups, including special education (U.S. Department of Education, 2013). The purpose of this report is to analyze the extent to which states report data for students with disabilities "to the public with the same frequency and in the same detail as it reports on the assessment of nondisabled children," as required by IDEA (Wiley, Thurlow, & Klein, 2005). It also describes how states report participation and performance data to the public, with additional analyses focusing on average performance gaps across years. The report also summarizes the extent that states report participation and performance for ELLs with disabilities and the ease of accessing public reporting reports. The National Center on Educational Outcomes (NCEO) has been tracking and analyzing public reporting for the special education subgroup since 1997. In 2012-13, the total number of regular and unique states reporting disaggregated participation and performance data online for students with disabilities was 52 states (Albus et al., 2014). This showed an increase of 3 states over 49 reported in the previous year for 2011-12. Before that, the number had been 45, thus showing a steady increase in the number of states reporting these data over recent years, though the number in some previous years (2007-08, 2008-08, and 2010-11) were near 45 states(Albus & Thurlow, 2013; Albus, Thurlow, & Bremer, 2009; Thurlow, Bremer, & Albus, 2011). Prior to 2006-07, starting in 2002-03, this count of states ranged between 35 states and 39 states (Albus, Thurlow, & Bremer, 2009; Klein, Wiley, & Thurlow, 2006; Thurlow, Bremer, & Albus, 2008; Thurlow & Wiley, 2004; Thurlow, Wiley, & Bielinski, 2003; Wiley, Thurlow, & Klein, 2005; VanGetson & Thurlow, 2007). In 2011-12, the number of states that reported disaggregated participation and performance data for alternate assessments based on alternate achievement standards (AA-AAS) was 51 states. This was an increase from 48 states in 2010-11. The number reporting for the AA-AAS had been as low as 36 states in 2006-07 and 2007-08. Top of Page | Table of Contents MethodIn January and February 2014, state department of education websites were searched for publicly available reports that disaggregated participation and performance data for students with disabilities for the 2012-13 school year (i.e., state assessment reports, state report cards, customized report generators, and other report formats). States included in the search were the 50 "regular" states and the 11 "unique" states (American Samoa, Bureau of Indian Education, Commonwealth of Northern Mariana Islands, U.S. Department of Defense Education Activities, District of Columbia, Federated States of Micronesia, Guam, Palau, Puerto Rico, Republic of the Marshall Islands, and U.S. Virgin Islands). Participation and performance data were collected, as well as information about how states reported those data. Data collection included all general and alternate assessments whether or not they were used for Title I, including those assessments designed for bilingual or English language learners (ELLs) that were either general or alternate assessments. The information gathered about how states reported participation and performance data were then summarized into individual state summary tables for verification. Verification materials were sent to state assessment directors and state directors of special education in July 2014. Twenty-two regular states and no unique states responded to the verification requests. After the verification process was completed, the participation and performance data were analyzed as well as information on how states reported those data. Double checks of the data were completed for accuracy. See Appendix A for a sample email sent to the state directors and sample tables used in the verification process. There are different types of assessments that states can give, each serving one or more purposes. For example, some are given for accountability, while others are for diploma or graduation purposes. Some assessments may serve dual purposes within a state. Although the data collected for this report included all state level administered assessments presented on state websites, this report focuses on how states publicly reported participation and performance data for students with disabilities on general assessments and AA-AAS. For this analysis the following terms are defined as follows.
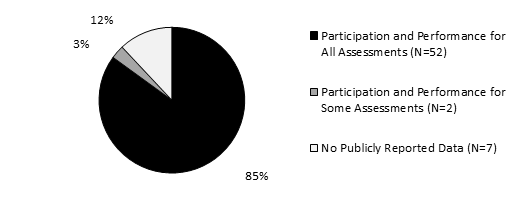
This report also provides additional information on alternates based on other achievement standards such as modified achievement standards and grade level achievement standards. Detailed information is not provided about these assessments in this report. Changes in federal policies for reporting to the U.S. Department of Education, as well as our own criteria, which narrowed after 2004-05, likely affected the changes in the numbers of states reporting on the general and AA-AAS assessments. APR data were not counted as publicly reported data after 2004-05 because these data were not necessarily reported with the same frequency and detail as public reporting for all students (see Thurlow et al., 2008). Top of Page | Table of Contents ResultsResults are presented in five sections. The first section presents information about how participation and performance data for students with disabilities were reported by states for general and alternate assessments used for Title I accountabiity or not, and how these same data were reported for ELLs with disabilities. The second section describes the approaches states used to communicate participation data. The third section describes the approaches states used to report performance data for general assessments. The fourth section presents select general assessment performance data at the elementary, middle school, and high school levels for reading and mathematics, including information about average achievement gaps. The final section provides information about routes taken to locate data on state websites. How States Reported Participation and Performance DataGeneral Assessment Data for Students with DisabilitiesFigure 1 shows that 52 of the 61 states reported participation and performance for all general assessments used for Title I accountability for students with disabilities. Eighty-five percent of states reported participation and performance for all general assessments, 3% reported participation and performance for some general assessments, and 12% had no publicly reported data. Figure 1. Extent of Reporting for Students with Disabilities on General Assessments Used for Title I [N=61]
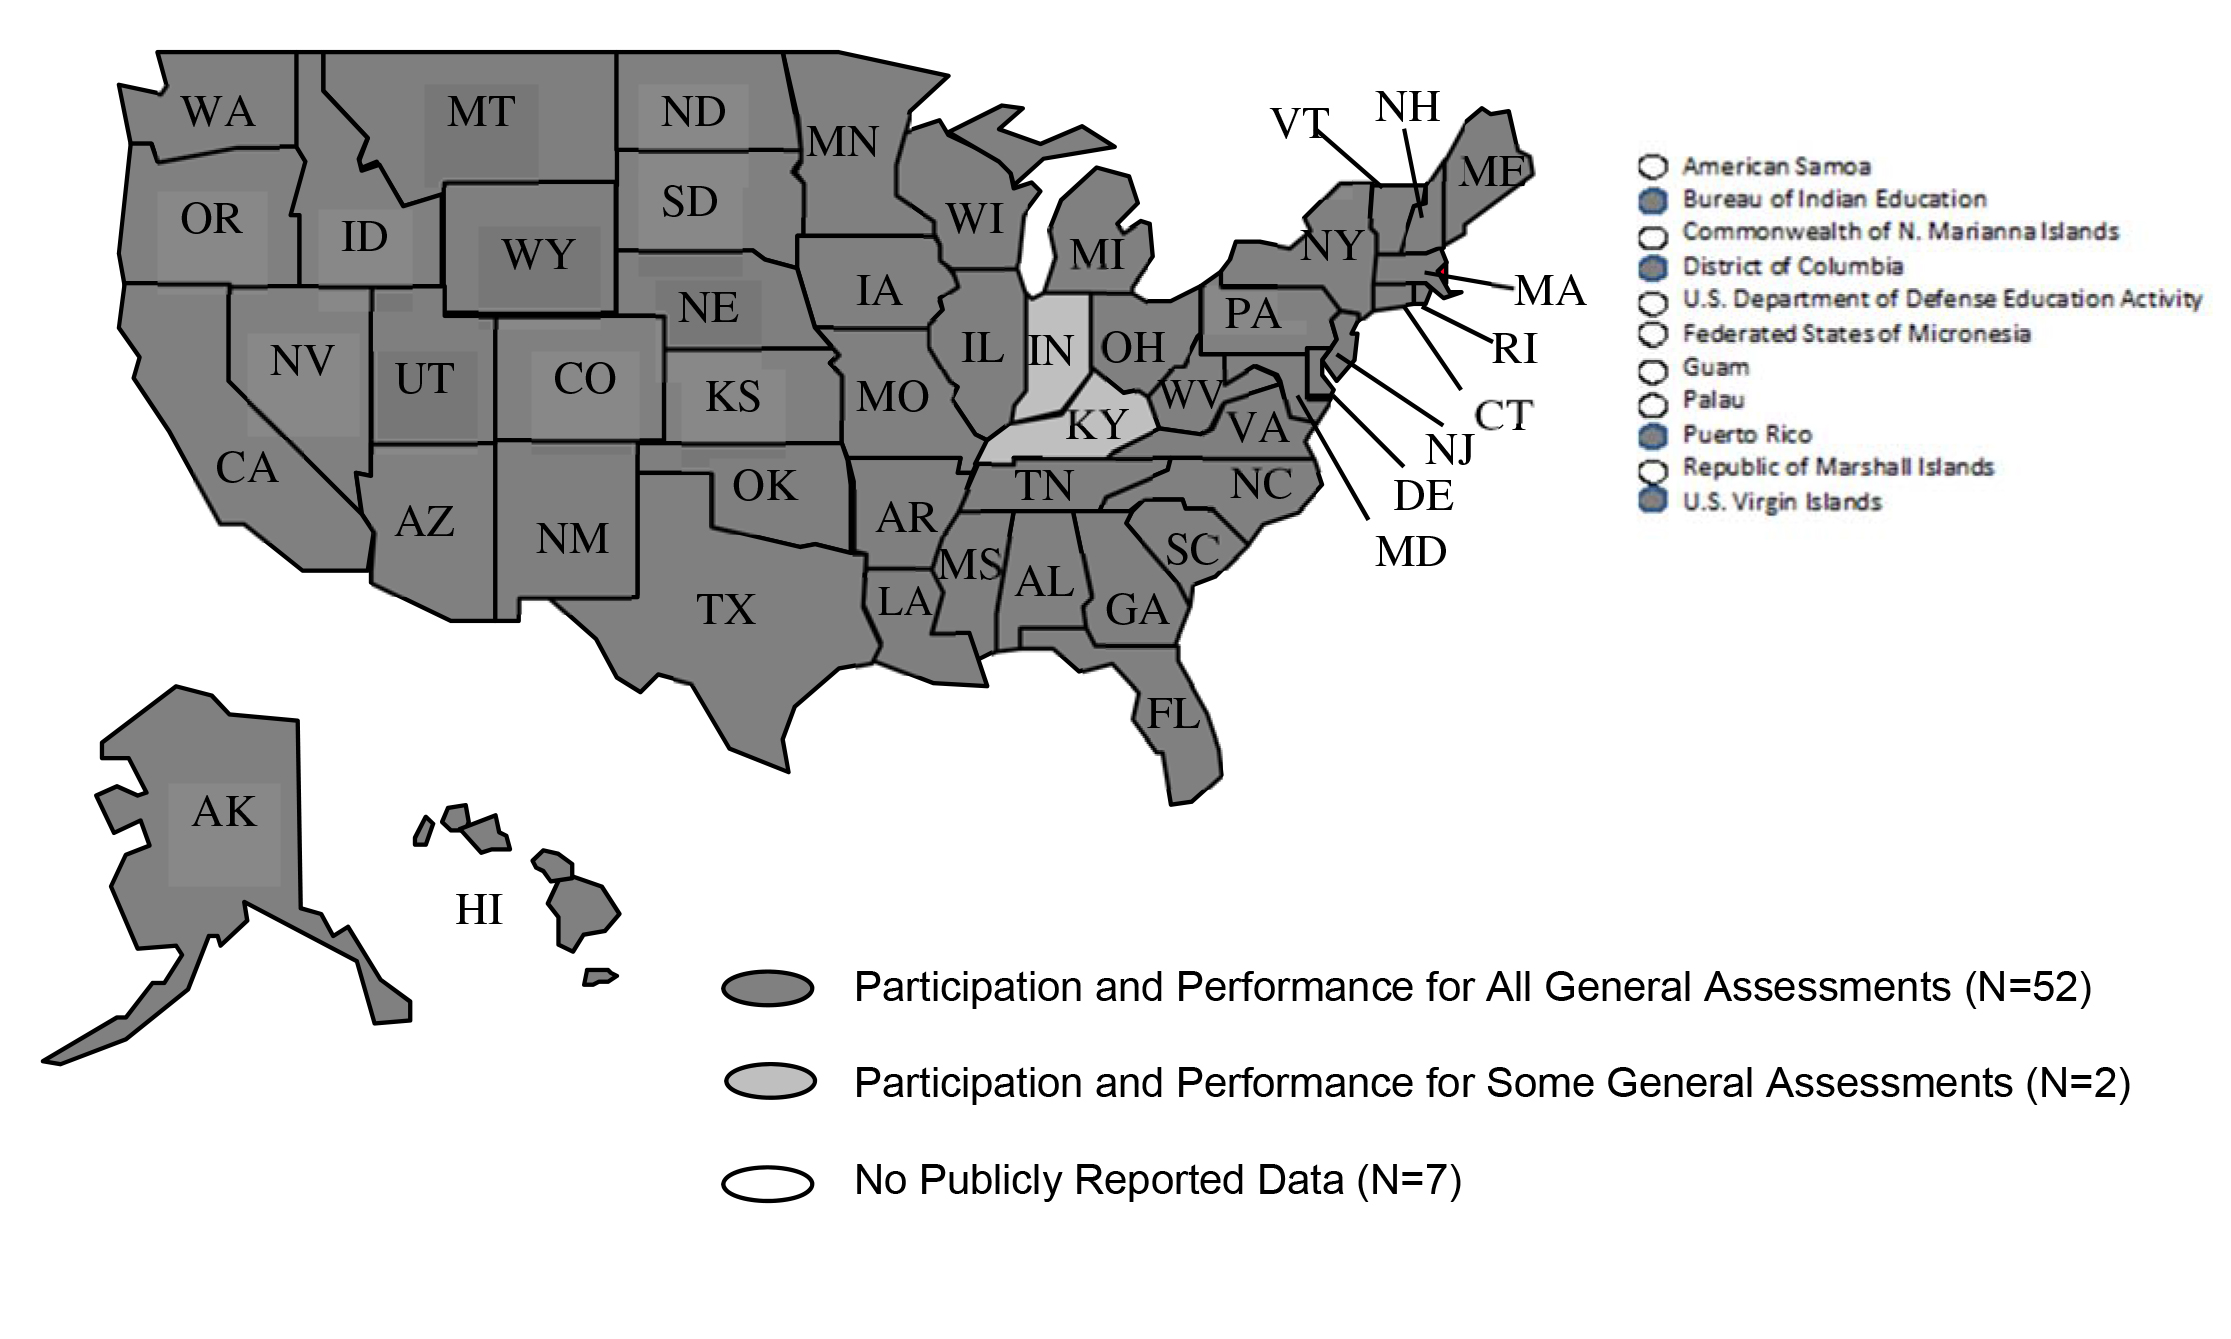
Figure 2 portrays the participation and performance reporting for the general assessment by state. This map shows that nearly all states had full reporting of participation and performance for students with disabilities on the general assessment used for Title I accountability systems. For details, see Table B-1 in Appendix B. Figure 2. States Reporting 2012-13 Disaggregated Participation or Performance Data for Students with Disabilities on General State Assessments in ESEA Accountability System*
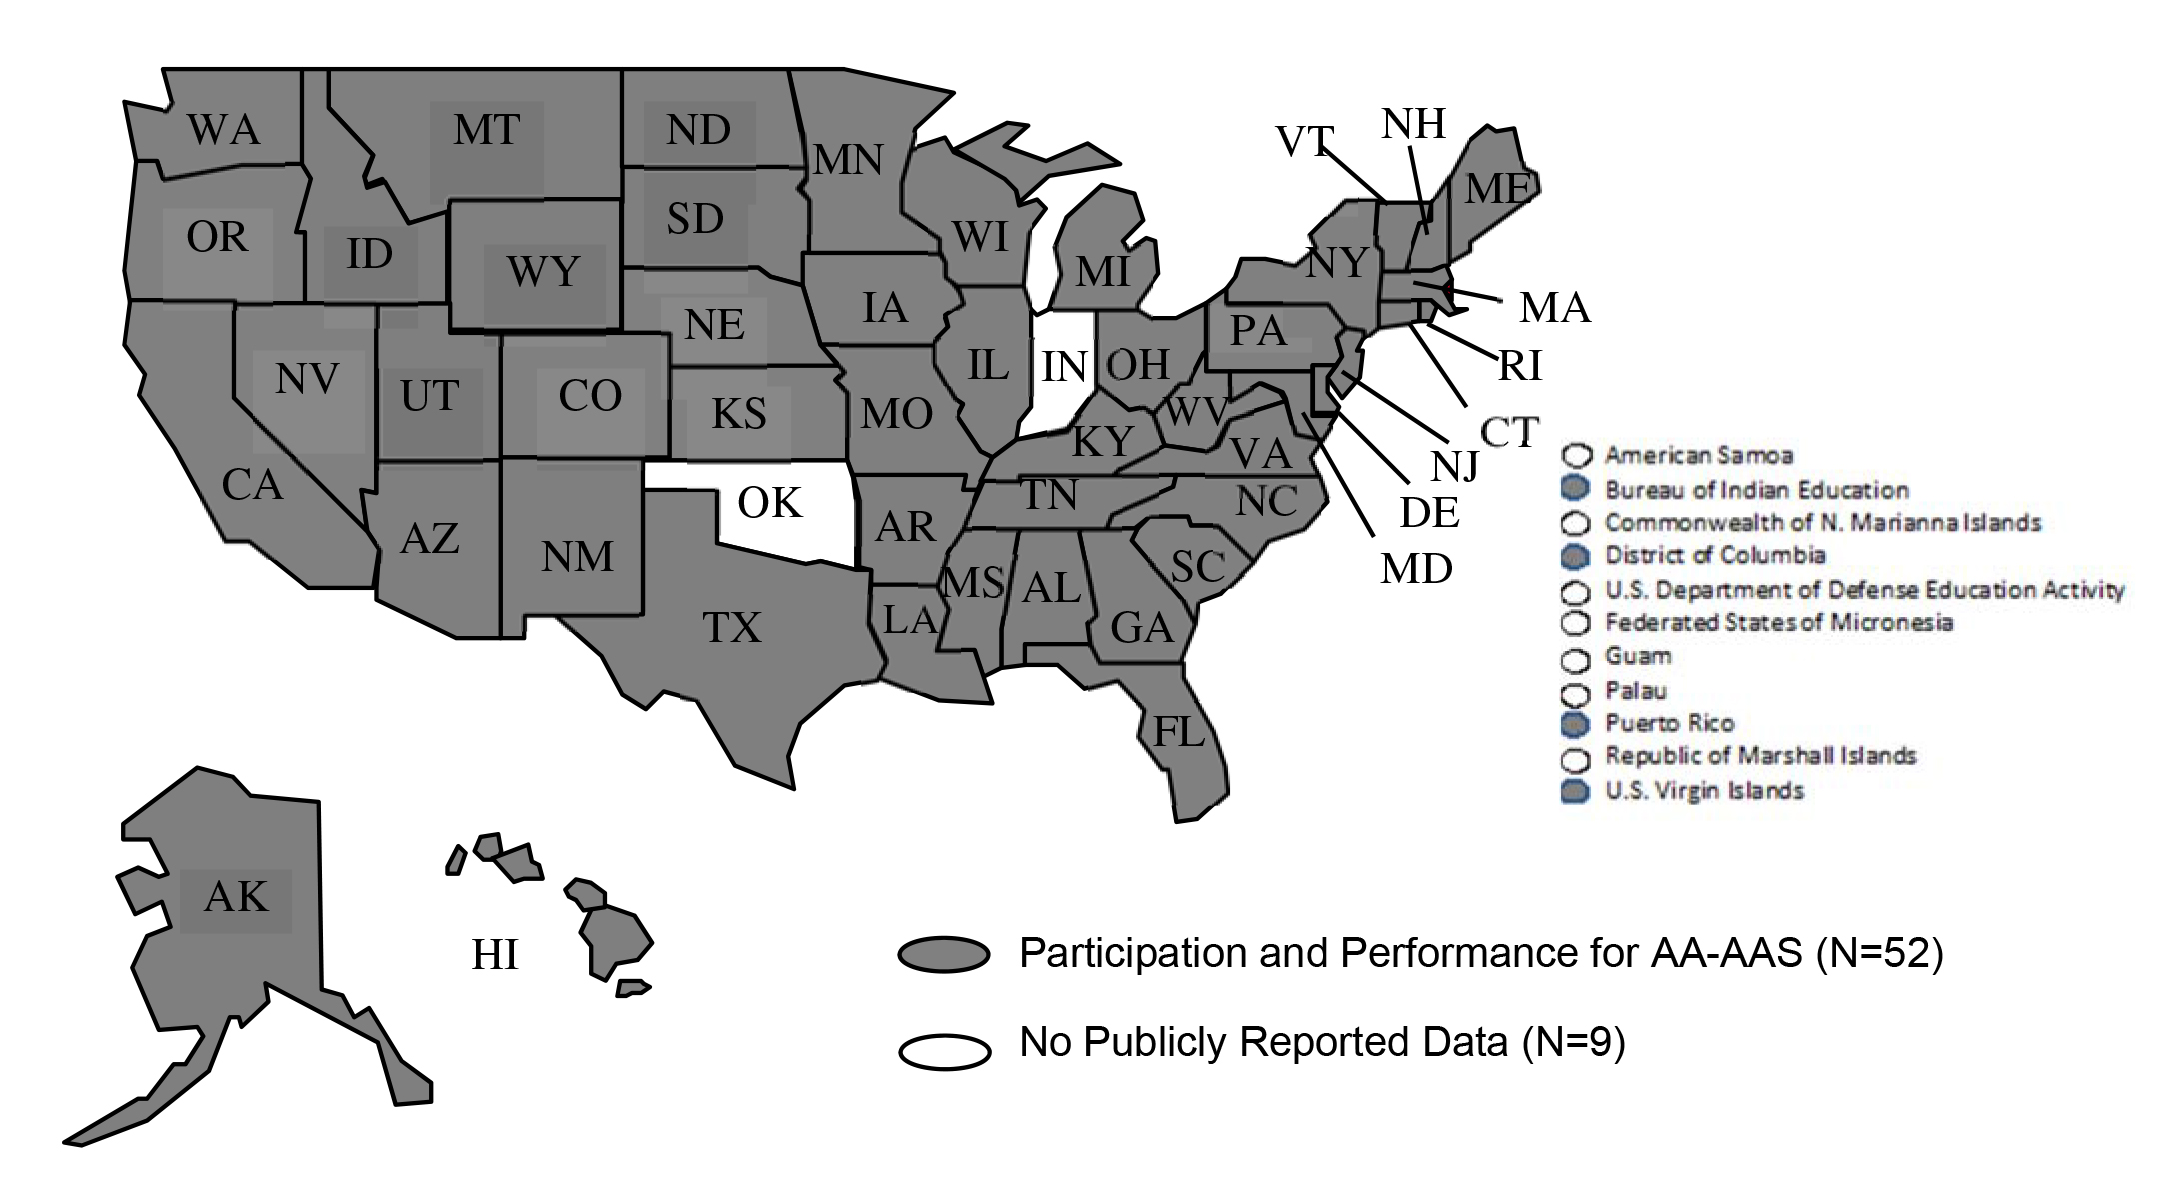
*Note: The figure does not include state APR data. A broad definition was used to determine whether a state reported data. States were included if they had any data reported for the assessment (regardless of whether it was across all grades, by grade range, or for specific grades).States also reported participation and performance for students with disabilities on general assessments not used for Title I accountability. Figure 3 shows that of the 16 states that had general assessments not used for Title I, 6 states reported participation and performance data for all tests, 2 reported these data for some tests, and 8 states did not publicly report data. For 45 states, this was not applicable because all of their general assessments were used for Title I accountability. Figure 3. Extent of Reporting for Students with Disabilities in General Assessments Not Used for Title I [N=61]
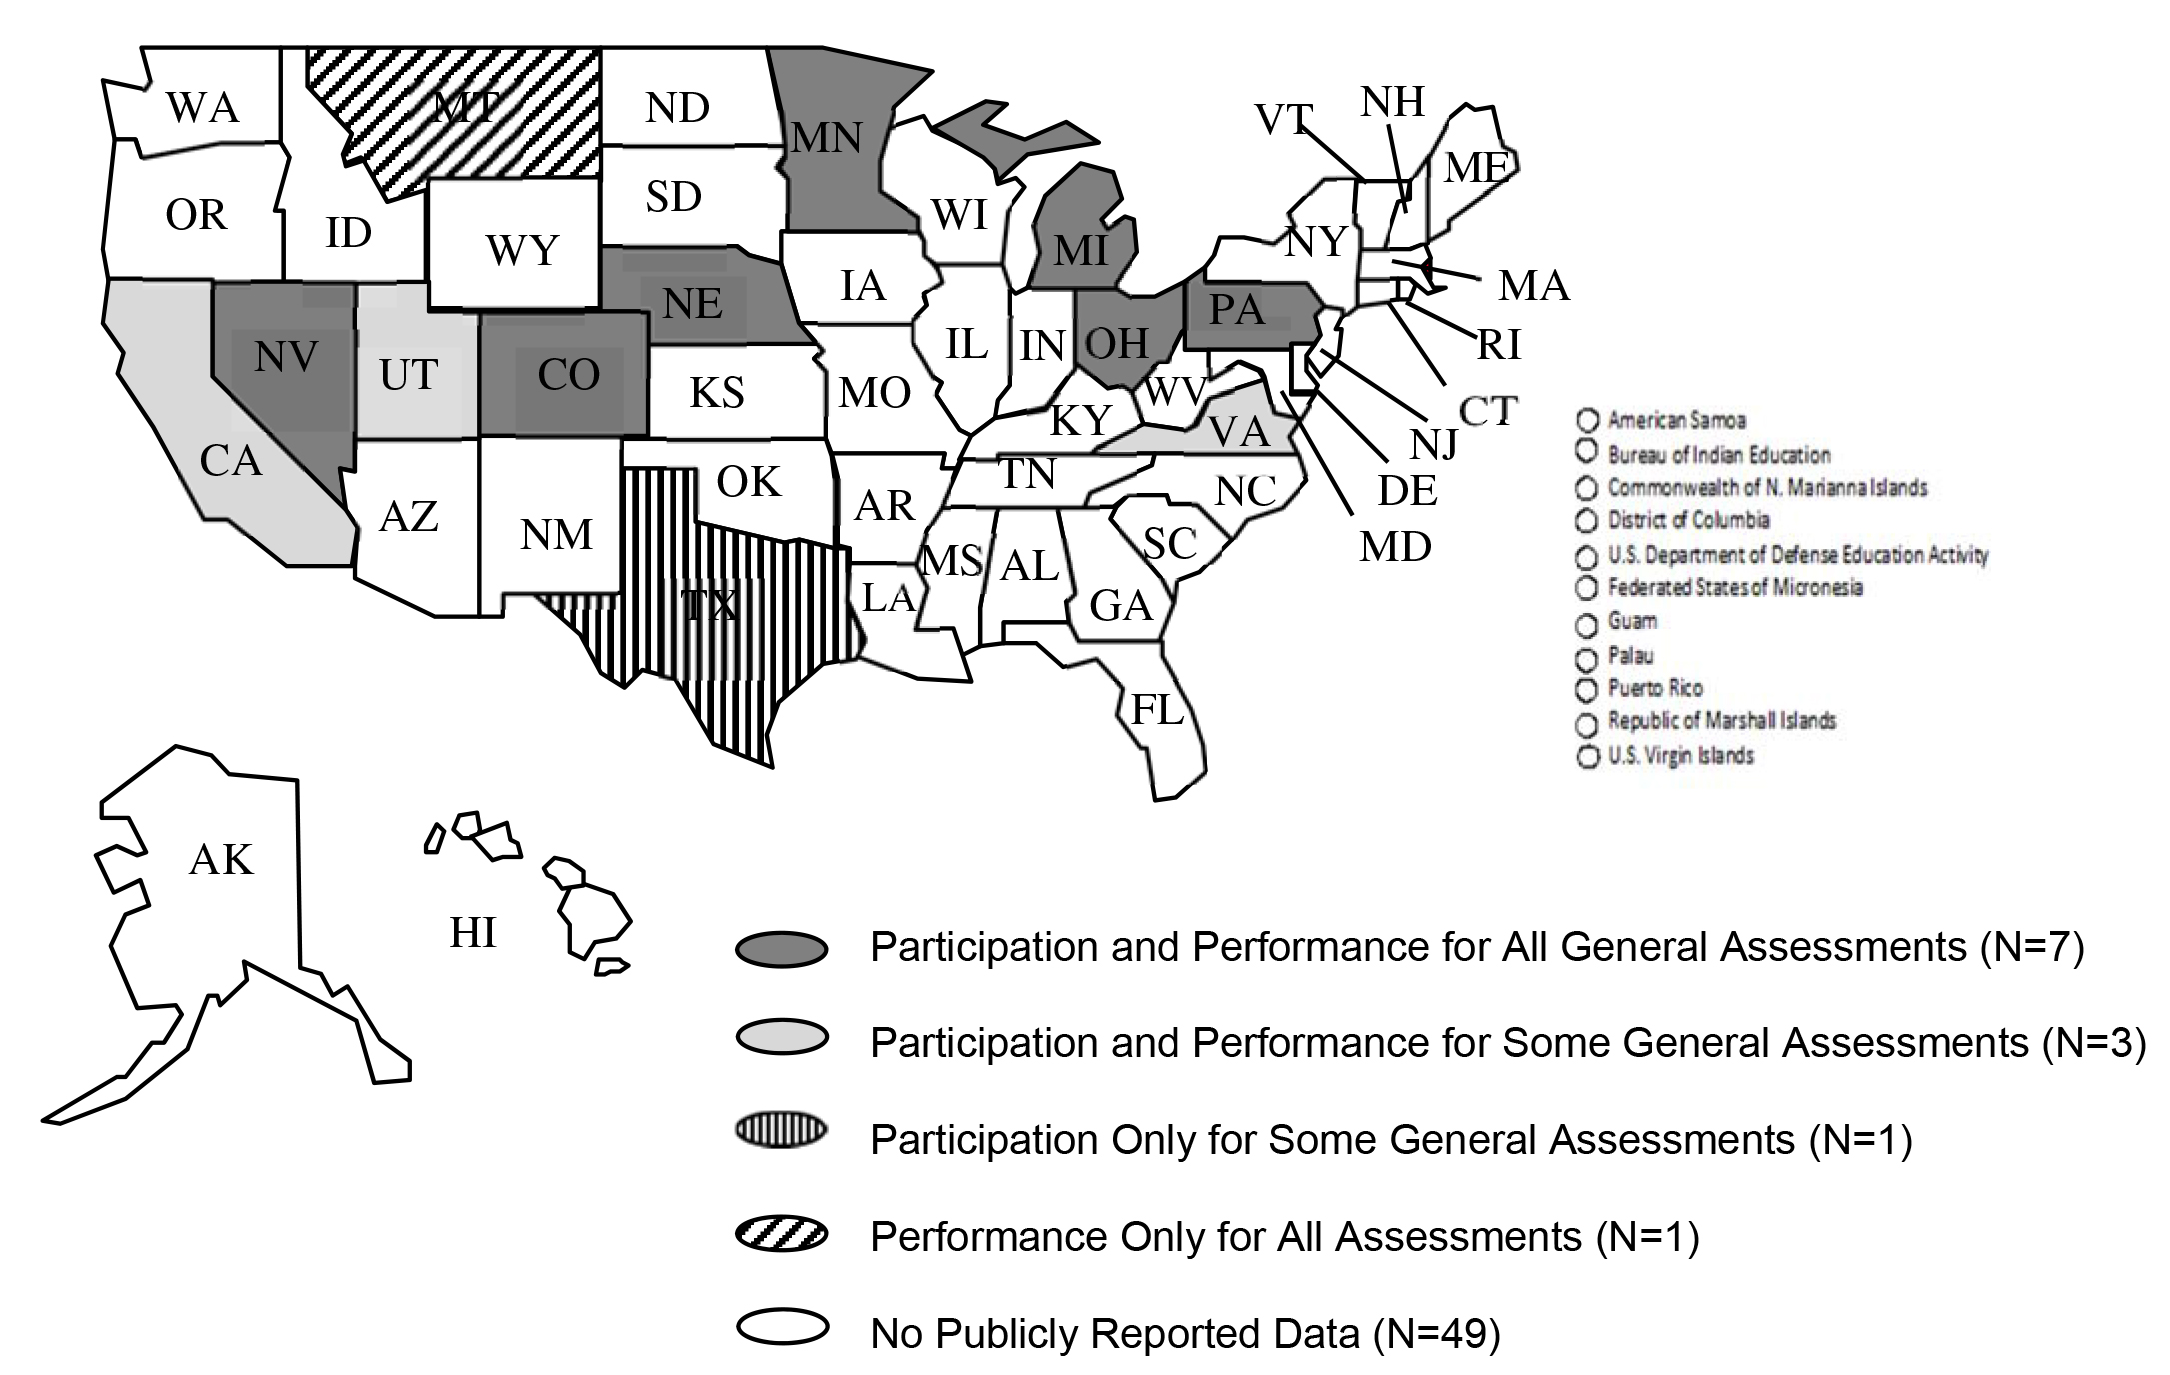
Figure 4 portrays the participation and performance reporting for general assessments not used for Title I by state. This map shows that only a few states publicly reported participation and performance for these assessments. For details, see Table B-2 in Appendix B.
Figure 4. States Reporting 2012-13 Disaggregated Participation or Performance Data for Students with Disabilities on General Assessments Not Used for Title I Accountability*
* Note: States were included if they had any data reported for the assessment (regardless of whether it was across grades, by grade range, or for specific grades).
|
|||||||||||||||||||||||||||||||||||||||||||||||||||||||||||||||||||||||||||||||

![Figure 3 showing Extent of Reporting of General Assessment Data for Students with Disabilities Outside ESEA [N=61]](Figure3.png)
![Figure 4 shows Figure 3. Extent of Reporting for Students with Disabilities in General Assessments Not Used for Title I [N=61]](Figure-4-revised.jpg)
![Figure 5 shows Extent of Reporting of AA-AAS Data Within ESEA [N=61]](Figure5.png)
![Figure 7 shows Extent of States Reporting Data for ELLs with Disabilities on General Assessments Used for Title I [N=61]](Figure7.png)
![Figure 9 shows Extent of States Reporting AA-AAS Data for ELLs with Disabilities within ESEA [N=61]](Figure9.png)
Grade |
Mean Gaps for All States with Data1 |
|||||||
2006-07 |
2008-09 |
2010-11 |
2012-13 |
|||||
Gap |
Number of states |
Gap |
Number of states |
Gap |
Number of states |
Gap |
Number of States |
|
Elementary Reading |
31 |
47 |
31 |
45 |
34 |
45 |
35 (34) |
45 (48) |
Middle School Reading |
40 |
47 |
40 |
46 |
41 |
45 |
41 (41) |
45 (48) |
High School Reading |
40 |
46 |
40 |
44 |
40 |
45 |
39 (38) |
46 (49) |
Elementary Math |
29 |
47 |
28 |
46 |
30 |
45 |
32 (32) |
45 (48) |
Middle School Math |
40 |
47 |
38 |
46 |
40 |
42 |
40 (39) |
45 (48) |
High School Math |
38 |
44 |
37 |
44 |
40 |
43 |
37 (36) |
46 (49) |
1Data in parentheses include the unique states. Data including the unique states were available only for 2012-13. Prior analyses did not include the unique states.
Ease of Finding Publicly Reported Data
Publicly reported data for students with disabilities is easier to find on some state websites than on others. An analysis was conducted of the number of mouse clicks it took to arrive at public reports for the general assessment and the AA-AAS on state department of education websites. This analysis is similar to analyses in previous reports. The number of mouse clicks for each state did not take into account any potential short cuts through search engines that may have provided a link to parts of a state's education website. As in previous analyses, we did not count the additional clicks needed to choose specific demographic or assessment characteristics on sites that allowed users to generate customized reports. For those sites, we only counted the number of clicks needed to arrive at the generator site and a final "submit" click.
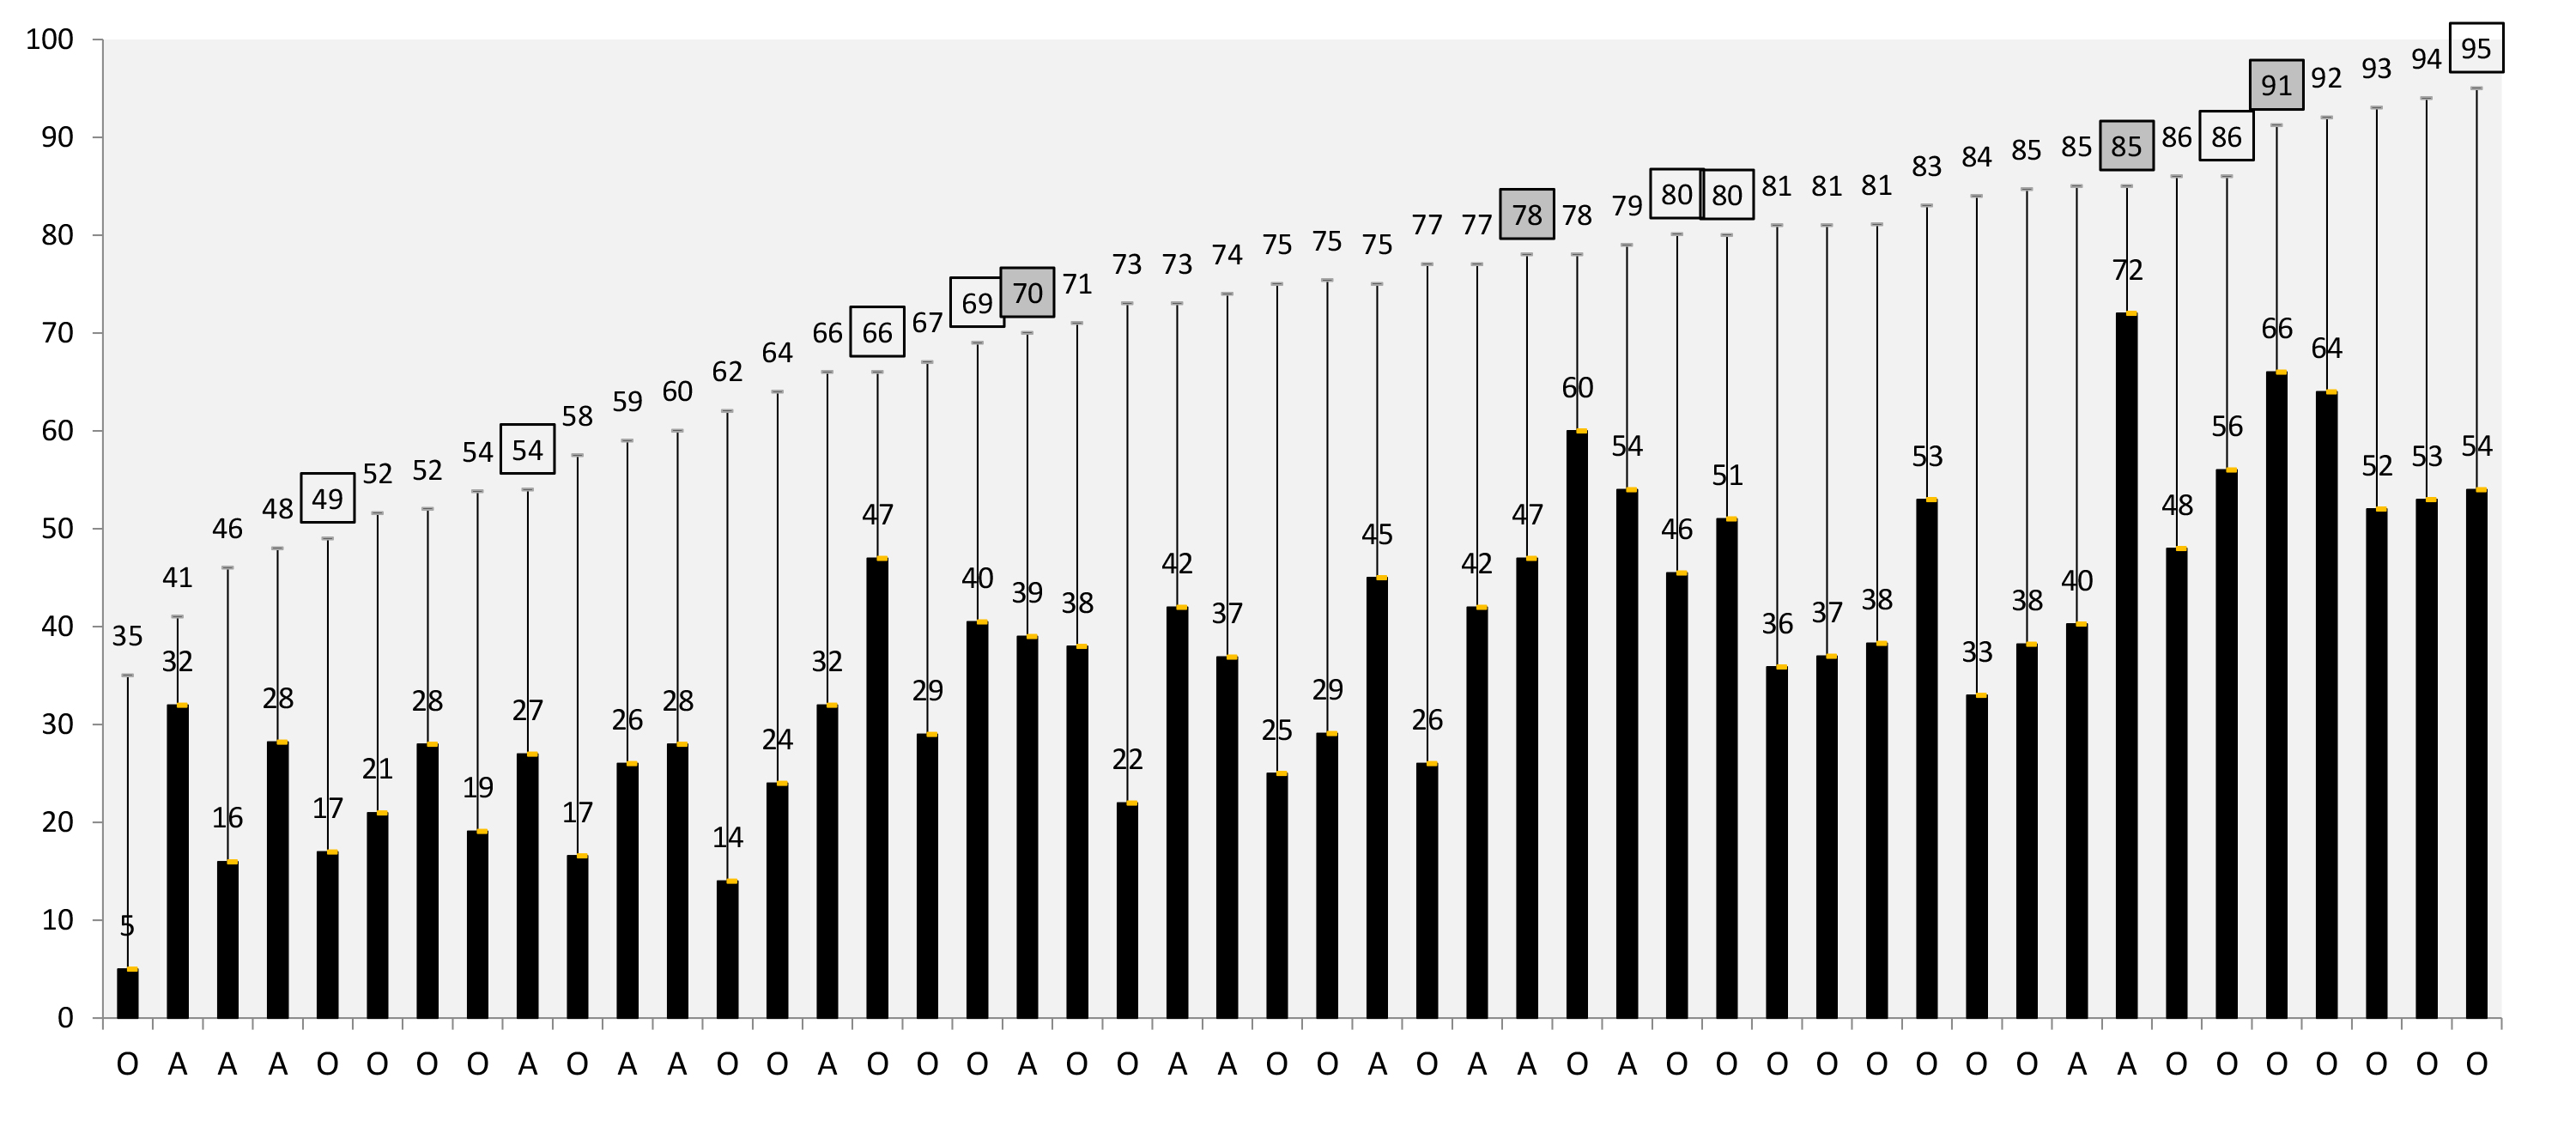
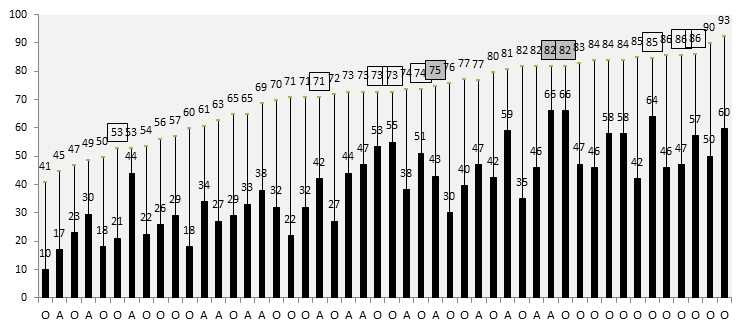
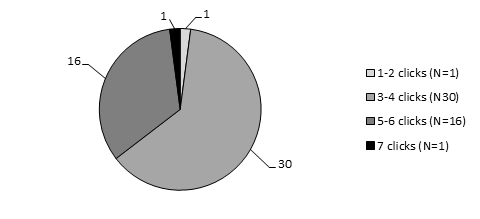
This analysis was referred to as a "click" analysis in some previous reports. Click data for general assessments are presented in Figure 22, and data for AA-AAS are presented in Figure 23. Compared to the most recent year for this analysis (2011-2012), the number of regular states that required 7 clicks decreased from one to none for 2012-13, states with 5-6 clicks (N=15) increased by two, the number of states with 3-4 clicks increased from 30 to 34, and the number of states with 1-2 clicks decreased by four states. For the AA-AAS, there was no clear pattern of increasing or decreasing clicks in 2012-13, with the same number of states at 7 clicks (N=1), one less state in 5-6 clicks (N=16), and four more states in 3-4 clicks (N=30). The number of states requiring 1-2 clicks decreased by two states (N=1) from the previous year. See Figures 22 and 23.
Figure 22. Number of Regular States in Each "Click" Category for Regular States Reporting General Assessments (N=50 of 50 States) for 2012-13
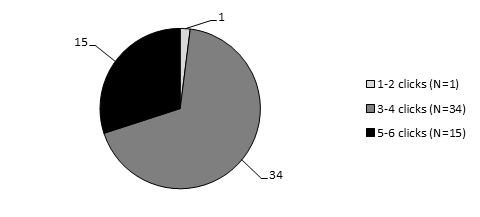
Figure 23. Number of States in Each Click Category for Regular States Reporting AA-AAS (Total N=48 of 50 States) for 2012-13
Top of Page | Table of Contents
Accommodations Data on Students with Disabilities
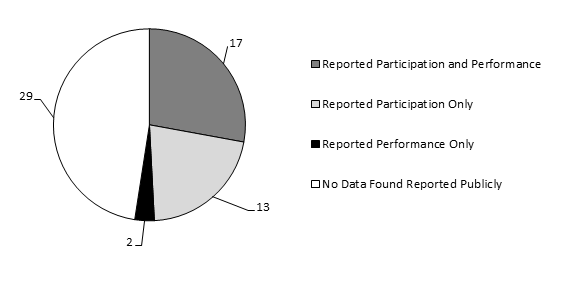
Figure 24 presents the number of regular and unique states that reported data of students with disabilities using accommodations on a general state assessment, by whether the state reported participation, performance, or both. Thirty-two states had at least some accommodated data reported, with 17 states reporting participation and performance, 13 states reporting participation only, and 2 states reporting performance only. See Appendix B-17 for specific state information used in Figure 24.
Figure 24. Number of Regular and Unique States Reporting Data for Students with Disabilities Using Accommodations
Top of Page | Table of Contents
Summary and Conclusions
Extent of Public Reporting for Students with Disabilities
Forty-eight regular states, and four unique states, reported participation and performance for all general assessments and alternate assessments based on alternate achievement standards (AA-AAS) used for Title I accountability purposes. Fifty-two of the 61 states reported both participation and performance for all general assessments; 52 reported similar data for the AA-AAS. Of the 16 states with general assessments not used for Title I, only 6 states reported participation and performance and 2 additional states reported participation or performance for some general assessments. This is a decrease from the previous report, where 9 states reported participation and performance for all general assessments not used for Title I (22 states).
Extent of Public Reporting for ELLs with Disabilities
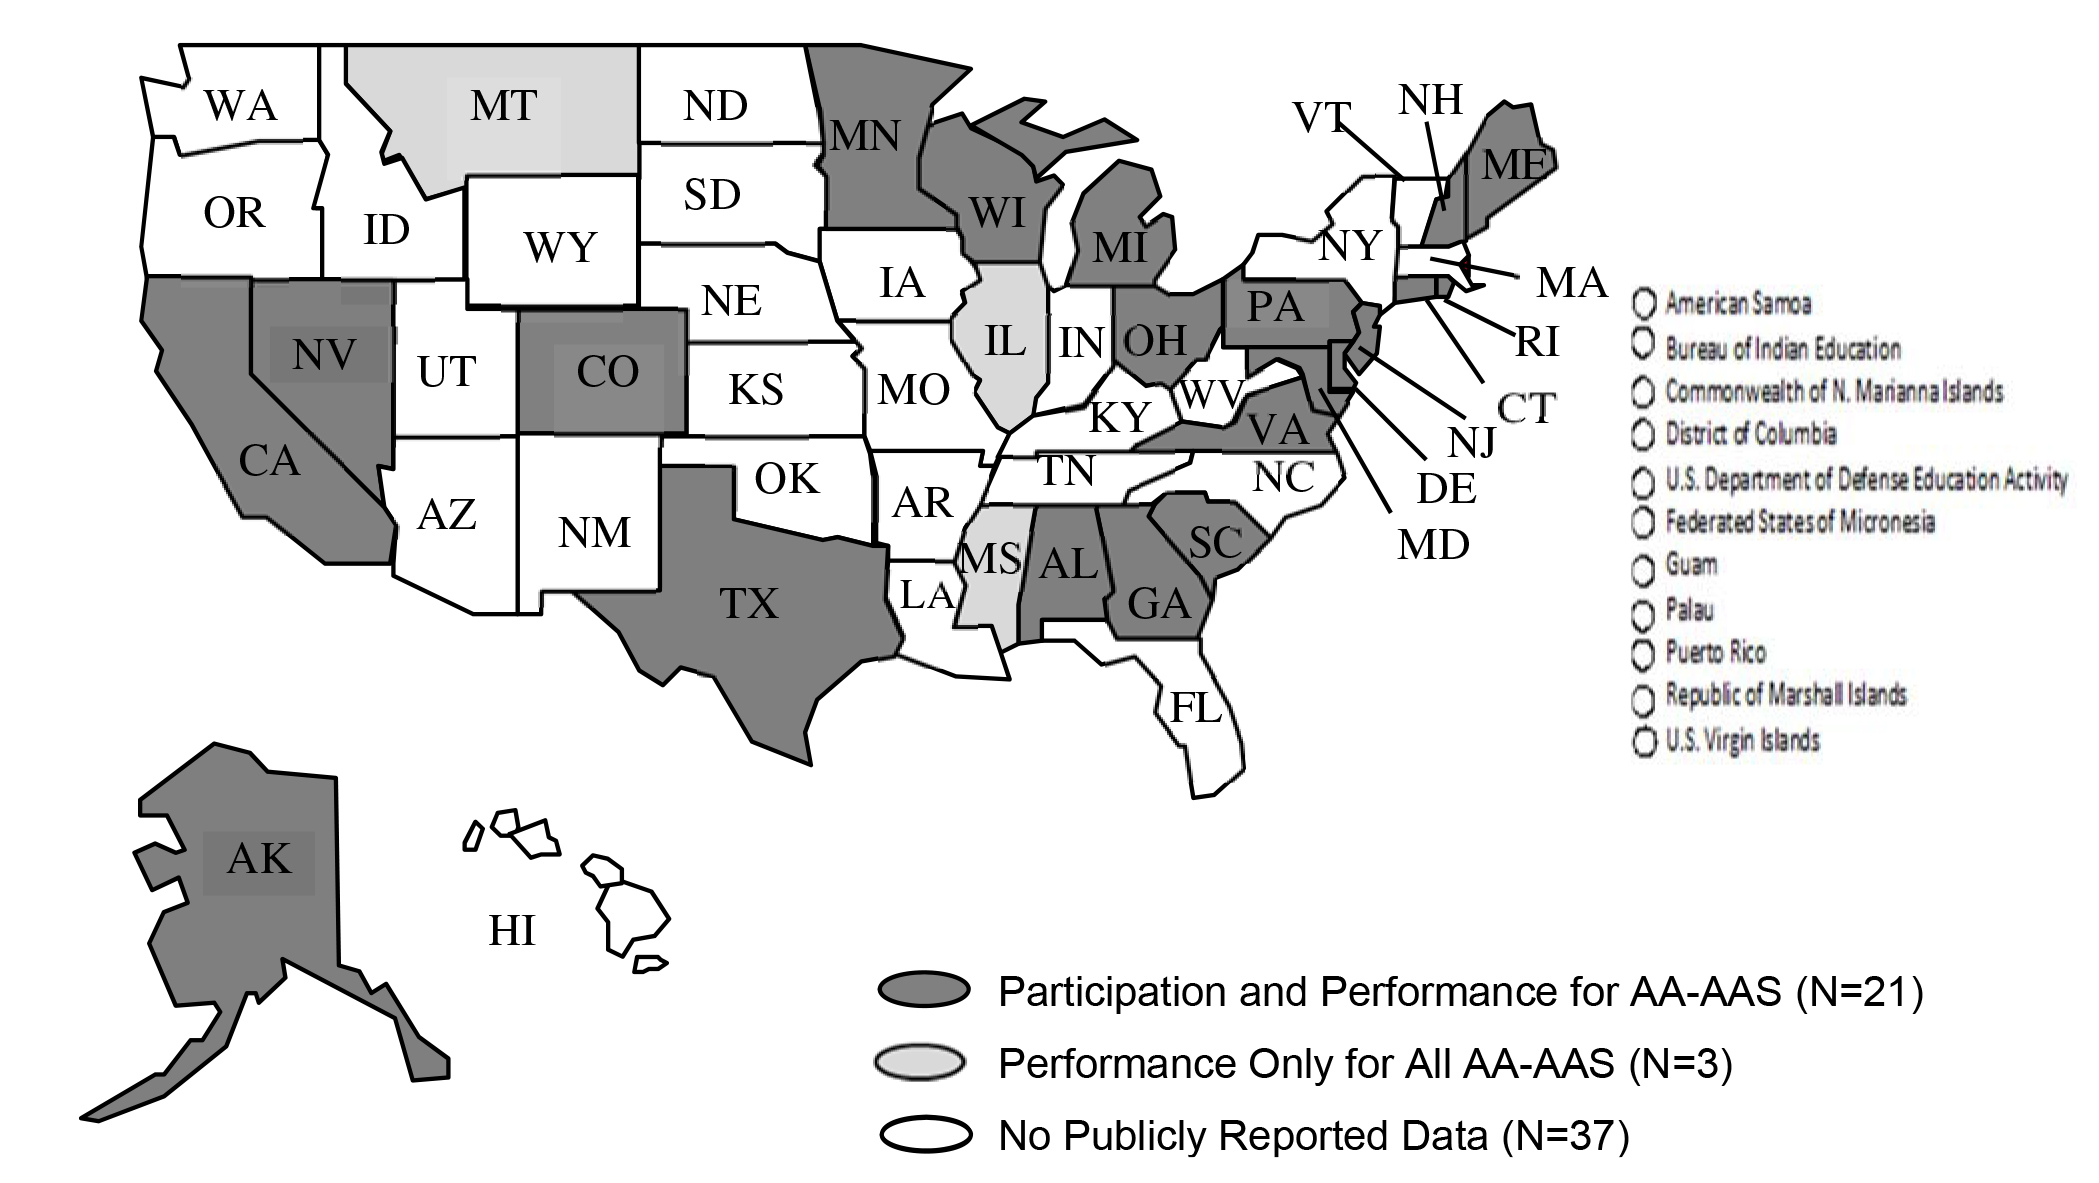
The number of states that reported both participation and performance for ELLs with disabilities stayed the same number as in the previous report (N=7). In addition, 3 states reported these data for some regular assessments, and two other states for either participation or performance. For AA-AAS, more states (N=21) reported participation and performance. This number stayed the same as in the previous two years. It might be expected that more states would have reported disaggregated data for this assessment, given the requirements of ESEA to report by subgroup for each state assessment.
How Data Are Reported
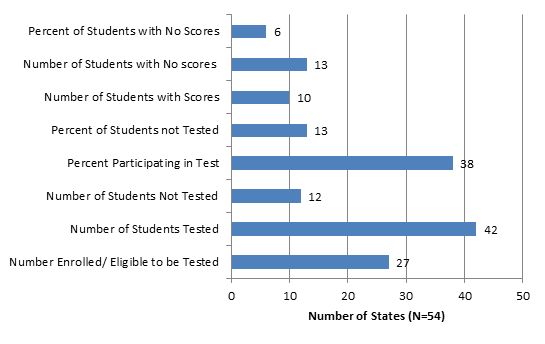
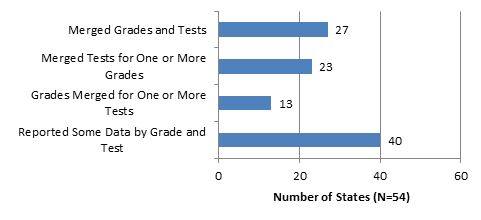
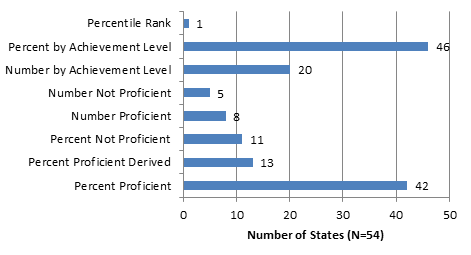
Among the regular states, the most common approaches for communicating participation and performance on general assessments and AA-AAS remained the same in 2008-09, and 2010-11 through 2012-13. For participation in 2012-13, the most common way to report for regular and unique states was in terms of the number assessed (42 states for the general assessment) and percent participating (38 states). For performance, the most common way for regular and unique states was reporting the percent of students in each achievement level (46 states for general assessments) followed by percent proficient (42 states for general assessments). Because states used different methods to report (e.g., merging assessments, grades, or both), the numerators and denominators used to report participation and performance data varied significantly across states. Adding to the complexity is the fact that some states report public data using multiple methods across participation and performance, thus increasing the difficulty of making interpretations about participation and performance.
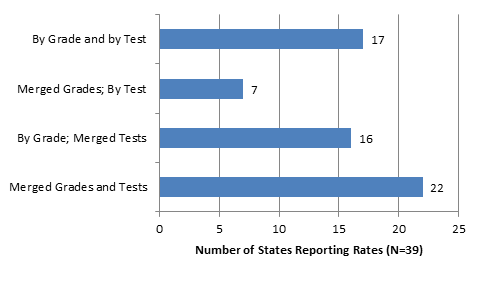
As in previous reports, this report presented participation rates for middle school mathematics as an example of how states report participation rates for students with disabilities. Ten states reported participation rates by grade in a way that would be comparable to include in a graph. Additional states provide numbers that would possibly allow for rates to be calculated. However, in recent years participation data have become less transparent, in part because states that had alternates based on modified achievement standards (AA-MAS) sometimes opted to merge those data with the general assessment data in public reporting for participation and performance. Most states with an AA-MAS did not report participation rates for the AA-MAS separately, though a few did. Another reason that rates may be less straightforward is that states vary in the denominators used to calculate rates.
Achievement Gaps
The achievement gaps between students with and without IEPs in reading and mathematics continue. This report presented average achievement gaps for elementary, middle school, and high school levels. As in past reports, there were smaller overall gaps in elementary reading and mathematics than at the middle school and high school levels. At the middle school and high school levels, for reading and mathematics, the average gaps across states spanned from 36 percentage points to 41 percentage points for 2012-13. Because states vary in the methods they use to publicly report data, this influences the achievement gaps reported. As would be expected, those states with "all students" as the comparison group tended to show smaller gaps compared to states using students without IEPs" as the comparison group. Other factors that influence the size of achievement gaps include whether a state has an AA-MAS, the percentage of students taking an AA-MAS in lieu of the general assessment, and how these data are reported.
Ease of Finding Data on State Websites
State websites vary in the ease of use in finding data about the participation and performance of students with disabilities. This report showed mixed changes in the number of clicks required to find data for students with disabilities on the general assessment. The highest 7 click category lost one state, and the lowest click category lost four states. The middle click categories of 3-4 and 5-6 clicks, also increased by six states, but with a couple more additions in the lower of the two click categories. For the alternate assessment, there was no clear pattern, with a decrease of one state in a higher 5-6 click category and a loss of two states in the lower 1-2 click category, and a gain of 4 states in the 3-4 click category. As in previous years, the majority of states required only 3 to 4 clicks to locate assessment data both for the general assessment (34 states) and AA-AAS (30 states).
Recommendations for Reporting
As many states transition to new assessments based on College- and Career-Ready Standards, there may be changes in how participation and performance data for students with disabilities and ELLs with disabilities are reported. In the intervening time, it is important that states continue to publicly report data for students with disabilities with the same frequency and detail as for other students. As in the previous report (Albus, Lazarus, & Thurlow, 2014), the following recommendations are offered to states for public reporting of disaggregated data for students with disabilities:
- Report participation and performance results for each assessment, content area, and grade level.
- Clearly label preliminary and final data with dates posted.
- Report participation with accommodations.
- Report participation percentages, disaggregated by grade.
- Make data accessible by attending carefully to the usability of formats, ease of finding information, and clarity of language.
- Provide reports in a format that are user-friendly for the general public rather than relying on technical reports to be the sole type of public reporting for student data.
Top of Page | Table of Contents
References
Albus, D., Lazarus, S. S., & Thurlow, M. L. (2014). 2011-12 Publicly reported assessment results for students with disabilities and ELLs with disabilities (Technical Report 69). Minneapolis, MN: University of Minnesota, National Center on Educational Outcomes.
Albus, D., & Thurlow, M. (2013). 2010-11 publicly reported assessment results for students with disabilities and ELLs with disabilities (Technical Report 68). Minneapolis, MN: University of Minnesota, National Center on Educational Outcomes.
Albus, D., & Thurlow, M. (2013). 2010-11 publicly reported assessment results for students with disabilities and ELLs with disabilities (Technical Report 68). Minneapolis, MN: University of Minnesota, National Center on Educational Outcomes.
Albus, D., Thurlow, M., & Bremer, C. (2009). Achieving transparency in the public reporting of 2006-2007 assessment results (Technical Report 53). Minneapolis, MN: University of Minnesota, National Center on Educational Outcomes.
Klein, J. A., Wiley, H. I., & Thurlow, M. L. (2006). Uneven transparency: NCLB tests take precedence in public assessment reporting for students with disabilities (Technical Report 43). Minneapolis, MN: University of Minnesota, National Center on Educational Outcomes.
Thurlow, M., Bremer, C., & Albus, D. (2008). Good news bad news in disaggregated subgroup reporting to the public on 2005-2006 assessment results (Technical Report 52). Minneapolis, MN: University of Minnesota, National Center on Educational Outcomes.
Thurlow, M. L., Bremer, C., & Albus, D. (2011). 2008-09 publicly reported assessment results for students with disabilities and ELLs with disabilities (Technical Report 59). Minneapolis, MN: University of Minnesota, National Center on Educational Outcomes.
Thurlow, M. L., & Wiley, H. I. (2004). Almost there in public reporting of assessment results for students with disabilities (Technical Report 39). Minneapolis, MN: University of Minnesota, National Center on Educational Outcomes.
Thurlow, M. L., Wiley, H. I., & Bielinski, J. (2003). Going public: What 2000-2001 reports tell us about the performance of students with disabilities (Technical Report 35). Minneapolis, MN: University of Minnesota, National Center on Educational Outcomes.
VanGetson, G. R., & Thurlow, M. L. (2007). Nearing the target in disaggregated subgroup reporting to the public on 2004-2005 assessment results (Technical Report 46). Minneapolis, MN: University of Minnesota, National Center on Educational Outcomes.
US Department of Education (2013). ESEA flexibility: Frequently asked questions addendum. Washington, DC: author.
Wiley, H. I., Thurlow, M. L., & Klein, J. A. (2005). Steady progress: State public reporting practices for students with disabilities after the first year of NCLB (2002-2003) (Technical Report 40). Minneapolis, MN: University of Minnesota, National Center on Educational Outcomes.
Top of Page | Table of Contents
Appendix A
Material Used for the Verification Process
Appendix A is presented in another document.