Prepared by Martha L. Thurlow, J. Ruth Nelson, Ellen Teelucksingh, and James E. Ysseldyke
April 2000
Any or all portions of this document may be reproduced and distributed without prior permission, provided the source is cited as:
Thurlow, M. L., Nelson, J. R., Teelucksingh, E., & Ysseldyke, J. E. (2000). Where's Waldo? A third search for students with disabilities in state accountability reports (Technical Report No. 25). Minneapolis, MN: University of Minnesota, National Center on Educational Outcomes. Retrieved [today's date], from the World Wide Web: http://cehd.umn.edu/NCEO/OnlinePubs/TechReport25.html
This report is the third analysis of state reports conducted by NCEO to determine what types of information are provided on students with disabilities in state education reports. Previous analyses had shown that few states (11 in the first analysis and 13 states in the second analysis) reported test-based results for students with disabilities. For this analysis, we collected 170 reports between March 1999 and August 1999 from state accountability offices and state special education offices.
Despite IDEA requirements for public reporting of assessment participation and performance data from students with disabilities, we found that only 14 states included participation data and only 17 states included performance data for students with disabilities in state assessments. Participation levels varied from 33% to 97% of students with disabilities. Performance levels also varied widely, with the differences between rates of students meeting state standards for students with disabilities and all students ranging from 20% to 50%. States are now required to "make available to the public, and report to the public with the same frequency and in the same detail as it reports on the assessment of nondisabled children the following information...the performance results" of students with disabilities on regular and alternate assessments (34 CFR 300.139). There were increases in the reporting of performance data for students with disabilities, but not to the extent that might be expected given the timelines in IDEA 97. More than two-thirds of the documents that did not include data on students with disabilities did include data on regular education student performance. Only eight states reported data on students with disabilities for the first time in this analysis. Furthermore, there were some unexpected reporting changes; three states that reported data on students with disabilities in previous years did not report data this time.
We present several recommendations as a result of our findings. At minimum, states should document that they recognize the need to report data on students with disabilities, and indicate why they have not yet done so and how they are moving toward meeting the IDEA requirements. The ways in which data are presented should be considered carefully so that unintended consequences do not result simply because of the way data are presented. Finally, states should be thorough in reporting—clearly accounting for the number of students actually participating in assessments and represented in every score that is presented.
When the Individuals with Disabilities Education Act (IDEA) was reauthorized in 1997, educational reform in special education was initiated at many levels. The law now requires educational results for students receiving special education services to be public information, just as they are for students without disabilities. IDEA 97 requires states to define performance goals and indicators for themselves, and one of the indicators must be the performance of students with disabilities on assessments. States must include all students with disabilities in their assessments, either in the regular assessment (with accommodations when appropriate), or in an alternate assessment. These requirements recognize that when students with disabilities are excluded from state assessments, an inaccurate picture of how students are performing may result (Thurlow, House, Boys, Scott, & Ysseldyke, 2000; Zlatos, 1994). The law also requires that the performance of students with disabilities on these measures be reported in the same detail and with the same frequency as the performance of other students is reported.
For the past three years now, the National Center on Educational Outcomes has been examining state reporting on the performance and participation of students with disabilities in statewide assessments. Due to the recent push for educational accountability for all students, including students with disabilities, it continues to be critical that we track the nature of, and changes in, state reporting practices, especially since very limited data are currently available on the results of education for these students (Thurlow, Langenfeld, Nelson, Shin & Coleman, 1998; Ysseldyke, Thurlow, Langenfeld, Nelson, Teelucksingh & Seyfarth, 1998).
Historically, states were far from meeting the current requirements. In our first study on state reporting practices, which examined state accountability reports that were collected between Fall 1995 and Spring 1997, we found that only 11 states included test-based outcome data on students with disabilities (Thurlow et al., 1998). However, a larger number of states (N=30) included process indicators for students with disabilities (e.g., enrollment, attendance) in the same reports. Recommendations for good state reporting practices were provided in this report, and many of these are reflected in provisions and regulations of IDEA 97 (e.g., performance data on students with disabilities should be publicly reported as often as data on regular education students).
Our second examination of state reporting practices did not reveal major improvements in either the number of states reporting on students with disabilities or the nature of the data provided. Only 13 states included test based outcome data on students with disabilities. Even fewer states (N=12) provided data on the participation of students with disabilities in assessments. Once again, a larger number of states (N=38) included educational process data on students with disabilities. These data that had been required for federal reporting prior to IDEA 97 include graduation and exit data, enrollment data, dropout rates, and time spent in various settings (Ysseldyke et al., 1998).
In 1998, we found that 50-80% of students with disabilities were reported to be participating in statewide assessments. Performance data indicated generally lower performance of students with disabilities compared to other students. For example, on state assessments of reading, the differences in passing rates between all students and students with disabilities ranged from 30 to 50 percentage points. It is difficult to analyze and interpret these results because of the limited number of states that reported performance and participation data on students with disabilities. However, it is important to continue to examine how students with disabilities are performing and participating in statewide assessments (Ysseldyke et al., 1998).
A survey of state directors of special education (Thompson & Thurlow, 1999) revealed that 23 states were able to provide data on the participation of students with disabilities. Yet, all states except five (four of which had not responded to the item) indicated that they disaggregated data on students with disabilities. The one state that indicated it did not disaggregate data was a state that had no statewide assessment.
The goal of our third study of state reports is to continue to track state reporting practices on the performance and participation of students with disabilities in statewide assessments. With the IDEA amendments now in force, states are federally required to report on the performance and participation of students with disabilities. At the time these reports were gathered, near the end of 1999, we would have expected that nearly all states would be reporting on the performance and participation of students with disabilities.
Data were gathered from public educational accountability documents identified in the annual Council of Chief State School Officers (CCSSO) state accountability survey entitled State Education Accountability and Indicator Reports: Status of Reports across the States 1998 (CCSSO, 1998). Even when a state document appeared to contain old data (1995-96 school year data), we included it in our analysis as long as it was listed in the 1998 state accountability survey.
The contact person for each state listed in the CCSSO state accountability survey was always contacted first. These contact persons were usually in various state offices (Assessment, Accountability, Reporting and/or Special Education departments). From these contacts, we requested the documents listed by CCSSO. We were careful to also inquire about any other publications that contained any data on students with disabilities, especially disaggregated performance data. Many times we were referred to the Directors of Special Education or other knowledgeable individuals within the state special education departments for further information on reports produced on students with disabilities. We also mailed a request for reports with a copy of the previous published NCEO Technical Report 22 (Ysseldyke, Thurlow, Langenfeld, Nelson, Teelucksingh, & Seyfarth, 1998) to each state assessment director and director of special education, with the intention that this would increase the chances that we received all published data available.
Timeline of Data Collection. Data were gathered between March 1999 and August 1999. Though most reports were obtained by the end of June, many reports were downloaded off the Internet throughout the summer months. We asked for any documents published between March 1998 and March 1999, yet received a few that came after these established dates. The difficulty in collecting accountability reports is that state departments publish various documents at various points of the year. All attempts were made to include the most recent data available unless the most recent data on students with disabilities did not have the same kind of data as that provided for other students. This only occurred once. For example, New York publishes several reports at various times of the year and newer data (1997-98 test data sent to us in August, 1999) which was included in the 1999 VESID Pocketbook (University of the State of New York, New York State Education Department, & Office of Vocational and Educational Services for Individuals with Disabilities, 1999) did not provide comparison test data for all students or general education students for the Regents Competency Exams.
Inclusion Criteria of Data Analyzed. For this analysis, any published document or report that provided an author and publisher (state department) was considered to be public data that could be obtained. Internet information was considered published, public data accessible by the general population. We did not include regular education data that included scores of students with disabilities when disaggregated scores of students with disabilities were not found elsewhere in the documents. Data from special studies, grants, or projects were not included if these data were not regularly collected and publicly reported. Only state level information was included in the results (e.g., no district or school level data on students with disabilities). Data were analyzed for grades K–12, excluding any preschool or postschool data.
NCEO did receive from five states some data on students with disabilities that appeared not to be published (no publisher or authors); these appeared to be internal data reports not accessible by the general public. These were not included in the current analysis. These documents were generally database sheets or results produced by the testing company. See Table 1 for a listing of unpublished documents that did contain disaggregated data on students with disabilities, but were not included in this study.
Table 1: List of Unpublished Documents that Contained Performance Data on Students with Disabilities
| State | Document Name |
| Alabama | High School Basic
Skills Exit Exam, 2nd Ed. Stanford Achievement Test State Summary |
| Florida | FL Comprehensive
Assessment Test (FCAT) 1998 1998 FL Writing Assessment |
| Georgia | GA High School Graduation Tests, Spring 1998 |
| Missouri | Assessment Program Results for Students with an IEP, Spring 1998 |
| North Dakota | ND 1998 Research Results for Statewide CTBS/5 (TerraNova Testing) |
Analysis of Data. For this analysis, we reviewed 170 public documents (see Appendix A). Each report was searched thoroughly for data on students with disabilities. A two page accountability report checklist was completed for each document on the educational results and process indicators for all students, noting carefully any disaggregated data on students with disabilities. This checklist is reproduced in Appendix B.
The data were coded according to the NCEO framework (Ysseldyke, Krentz, Elliott, Thurlow, Erickson, & Moore, 1998). This comprehensive framework, initially created by hundreds of nationally-representative stakeholders, includes both academic and nonacademic domains, and encompasses more than just participation data. The vast majority of data collected fell into only two categories: (1) Educational Results for Systems and Individuals, and (2) Educational Processes, specifically Student-Oriented Domains.
Data from three domains were collected in the area of Educational Results: Academic and Functional Literacy, Personal and Social Well-Being, and Satisfaction. Most of the data included information on Academic and Functional Literacy. Test score data included in the area of Academic and Functional Literacy were of primary interest to us, and thus were subjected to additional analysis.
Data from two domains were collected in the area of Educational Processes: Participation and Family Involvement. Most of the data reported by states in these areas are included in the Twentieth Annual Report to Congress on the Implementation of the Individuals with Disabilities Education Act (U.S. Department of Education, 1998), including enrollment, placement, exit data, and personnel and financial data. These data are not included in our analysis; however, we do mention when these data were included in public accountability reports, since data in these state reports are more widely available to the general public than the Report to Congress.
Cautions in Interpretation of the Data Analysis. Though every effort was made to gather current data, states gather and report data at different times throughout the year, and may be reporting data a year or two behind the actual date that data were collected. Therefore, it cannot be assumed that the data included here are taken from the same school year. States also use various tests, rubrics, and standards to judge performance. Data provided in the achievement data tables reflect a comparison between all students and students with disabilities if available; otherwise, the comparison groups are noted (e.g., Not Disabled, Regular Education students). As in our previous report, some data in state reports continue to be difficult to interpret because they do not include glossary or summary information, the percentages of students with disabilities tested, or other information that is needed to accurately interpret the data.
The data presented here are intended to be a general overview of the performance of students with disabilities, and should be interpreted with caution. Comparisons between states on the performance and participation of students with disabilities are not appropriate since measures and participation rates for students with disabilities vary greatly from one state to the next.
Of the 165 reports that were analyzed from 50 states, a total of 91 reports (41 states) included data on students with disabilities in the domains of student-oriented process or academic and functional literacy. Of the 74 reports that did not include data on students with disabilities, over 50 included performance data on regular education students. Nine states did not have any information on students with disabilities other than financial data. Because states often produce multiple reports with varying levels of information (e.g., individual school, school district, region, and state) (see Thurlow et al., 1998; Ysseldyke, Thurlow et al., 1998), we opted to analyze all data in terms of state performance (e.g., number of states reporting on test scores or number of students participating in testing).
A listing of all reviewed documents is provided in Appendix A. In it is an accompanying legend that identifies for each state document the type of data available on students with disabilities. A summary of which states report data on educational results and processes is provided in Table 2. As indicated in the Educational Results column, the most frequent domain for which data were presented was Academic and Functional Literacy. Only three states included other areas (Kansas had Personal and Social Well-Being data; New York and Vermont had Satisfaction data on vocational and special education services as well as Academic and Functional Literacy). In the Process area, most states reported on the enrollment of students with disabilities.
Table 2. Overall Summary of Data Gathered on Students with Disabilities
| State | Educational Results |
Educational Processes |
State | Educational Results |
Educational Processes |
| Alabama | Nebraska | P |
|||
| Alaska | Pa |
Nevada | AFL |
P* |
|
| Arizona | New Hampshire | AFL |
P* |
||
| Arkansas | New Jersey | P* |
|||
| California | New Mexico | P |
|||
| Colorado | New York | AFL; Sc |
P* |
||
| Connecticut | AFL |
P* |
North Carolina | AFL |
P* |
| Delaware | AFL |
P* |
North Dakota | P |
|
| Florida | P |
Ohio | P |
||
| Georgia | P |
Oklahoma | P |
||
| Hawaii | P |
Oregon | P |
||
| Idaho | P |
Pennsylvania | P |
||
| Illinois | Rhode Island | AFL |
P |
||
| Indiana | P |
South Carolina | AFL |
P* |
|
| Iowa | P |
South Dakota | AFL |
P |
|
| Kansas | PSWb |
P |
Tennessee | P |
|
| Kentucky | P |
Texas | AFL |
P* |
|
| Louisiana | P |
Utah | P |
||
| Maine | P |
Vermont | AFL; Sd |
P* |
|
| Maryland | AFL |
P |
Virginia | AFL |
P* |
| Massachusetts | AFL |
P* |
Washington | ||
| Michigan | West Virginia | AFL |
P* |
||
| Minnesota | AFL |
P* |
Wisconsin | ||
| Mississippi | AFL |
P |
Wyoming | P |
|
| Missouri | P |
District of Columbia | P |
||
| Montana | P |
a AK only reports exemption data
for students coded both Special Education and LEP.
b KS reports on violent acts against students and
teachers by students with disabilities.
c NY reports on consumer satisfaction with VESID
services by staff, students with disabilities, and parents in
the 1997 Quality Assurance Survey.
d VT administers student surveys to special education
seniors which includes a follow-up survey that covers
satisfaction with their education.
* These states reported participation in large-scale assessments
(N=14 states).
** AFL - Academic and Functional Literacy; PSW - Personal and
Social Well-Being; S - Satisfaction; P - Participation.
Of the 41 states that provided some data beyond financial data on students with disabilities, 17 states disaggregated performance data for students with disabilities in the area of Academic and Functional Literacy (Connecticut, Delaware, Maryland, Massachusetts, Minnesota, Mississippi, Nevada, New Hampshire, New York, North Carolina, Rhode Island, South Carolina, South Dakota, Texas, Vermont, Virginia, West Virginia).
The 17 states provided information on how students with disabilities performed on statewide assessments. A handful of states included information in their state accountability documents on how students with disabilities are performing over time and whether there is improvement or progress in performance from year to year.
Two states reported on other domains of results for students with disabilities. Kansas, the only state to report on the area of Personal and Social Well-Being, cited the number of violent acts committed by students with disabilities against other students and teachers. New York reported data in the domain of Satisfaction: the results of a Consumer Satisfaction Survey on vocational rehabilitation services provided to special education students. Vermont administered student surveys to special education seniors that addressed student satisfaction with their education.
For the 17 states that presented information on statewide assessments, the most frequently reported content areas (see Table 3) were: reading (17 states) and math (17 states). Eleven states reported science data, ten reported writing data, and only six reported social studies data. Sixteen states reported on students with disabilities in three or more content areas (Connecticut, Delaware, Maryland, Massachusetts, Minnesota, Nevada, New Hampshire, New York, North Carolina, Rhode Island, South Carolina, South Dakota, Texas, Vermont, Virginia, West Virginia).
Table 3: Educational Results Summary
Academic & Functional Literacy |
||||||||
State |
Assessment Data By |
Graduation Exam |
End-Of-Course |
Other Unique |
||||
Rdg/Lang. |
Math |
Writ. |
Sci. |
S. S. |
||||
| CT | ü |
ü |
ü |
ü |
CAPT Interdisciplinary content area |
|||
| DE | ü |
ü |
ü |
|||||
| MD | ü |
ü |
ü |
ü |
ü |
ü |
Citizenship |
|
| MA | ü |
ü |
ü |
|||||
| MN | ü |
ü |
ü |
ü |
||||
| MS | ü |
ü |
ü | ü |
||||
| NV | ü |
ü |
ü |
|
Language |
|||
| NH | ü |
ü |
ü |
ü |
||||
| NY | ü |
ü |
ü |
ü |
ü |
ü |
Biology, Chemistry, English, Comprehensive Languages, Math, Global Studies, U.S. History & Government |
Performance on Occupational Ed. Proficiency Exam; Post education plans & outcomes; Enrollment in higher education and postsecondary programs; Associate and B.A. degree graduates; Job placements |
| NC | ü |
ü |
ü | ü |
|
Algebra I; Biology; Economic, Legal, & Political Systems; English I; U.S. History |
||
| RI | ü |
ü |
ü |
Health |
||||
| SC | ü |
ü |
ü |
ü |
ü |
Cognitive Skills Assessment Battery (1st grade readiness test) |
||
| SD | ü (Rdg.) |
ü |
ü |
ü |
Language, Environment, Listening, Using Information, Thinking Skills |
|||
| TX | ü |
ü |
ü |
ü |
ü |
|
Biology, Algebra, Eng. II, U.S.History |
TAAS/TASP Equivalency Exams |
| VT | ü |
ü |
ü |
ü |
Students no longer receiving SpEd services |
|||
| VA | ü (Rdg.) |
ü |
ü |
ü |
Language |
|||
| WV | ü (Rdg.) |
ü |
ü |
ü |
Language, Spelling, Listening, Study Skills |
|||
According to Guy, Shin, Lee and Thurlow (1999), 20 states had a high stakes graduation exit exam in 1998. All of these states reported graduation exam results for regular education students, but only 35% of the 20 states (7 states) reported these results for students with disabilities (Maryland, Minnesota, Mississippi, New York, South Carolina, Texas, Virginia).
Only a handful of states presented any other types of data in the domain of Academic and Functional Literacy. New York and Texas provided extensive data on students with disabilities in the area of Academic and Functional Literacy. These two states have state assessments in place, a graduation exam, and end-of-course assessments that include students with disabilities. Furthermore, these states have other unique indicators in this domain. New York has an Occupational Education Proficiency Exam, and Texas reports on the Texas Academic Skills Program Test (TASP). The TASP is required for entry into Texas institutions of higher education. These states also provided extensive achievement data on students with disabilities. Rhode Island reported on the unique indicator of statewide performance on a Health exam.
State achievement test data of students with disabilities can be examined in different ways. Because it is difficult to aggregate and analyze achievement data of states due to differences in tests, standards, rubrics, the time of year given, content difficulty of tests, accommodations given, exclusion of students, the grade the test was given, or the year the data were collected, we decided to examine how students performed relative to standards set by the states. We used the percentage of students above the passing score or other index of "adequate" performance. These data are presented in Table 4.
Table 4. State Achievement Test Data of Students with Disabilities (Passing State Criteria or Percentile Rank Scores)
State, Grade & Year Test Was Given |
Test Used |
Criteria Used by States or Report Authors |
Achievement Testing |
||||||||||||||||||||||
| Reading | Math | Writing | Science | Social Studies | |||||||||||||||||||||
| SWD |
|
SWD | All | SWD | All | SWD | All | SWD | All | ||||||||||||||||
| CT Gr 8 1997-98 |
CT Mastery Test | At or above state goal | SpEd 32.2 |
64.2 | SpEd 19.7 |
52.7 | SpEd 28.1 |
56.4 | No Assessments |
||||||||||||||||
| DEa Gr 8 1997-98 |
DE Writing Assess. | At or above 2.0 scoring rubric of 1-4 * | 71.0 |
Reg Ed 96.0 |
|||||||||||||||||||||
| DE Gr 8 1997-98 |
DTSP (SAT/9) | Percentile rank (no passing indicator) | 16.0 |
Reg Ed 59.0 |
16.0 |
Reg Ed 53.0 |
Assessment given, but only mean scores reported | No assessments |
|||||||||||||||||
| MD Gr 8 1997-98 |
MSPAP | Percent satisfactory | SpEd 4.8 |
Reg
Ed 27.8 |
SpEd 16.4 |
Reg Ed 52.1 |
SpEd 12.0 |
Reg
Ed 48.3 |
SpEd 16.3 |
Reg Ed 53.6 |
SpEd 12.2 |
Reg
Ed 46.9 |
|||||||||||||
| MD Gr 9 1997-98 |
Funct. Tests | Percent passing | SpEd 87.1 |
Reg Ed 98.8 |
SpEd 70.7 |
Reg Ed 86.7 |
SpEd 69.4 |
Reg Ed 92.6 |
No assessment | SpEd Citz. 62.9 |
Reg
Ed 86.5 |
||||||||||||||
| MA Gr 8 1997-98 |
MCAS | Percent proficient and above | 15.0 | 55.0 | 6.0 | 31.0 | No assessment | 6.0 | 28.0 | No assessment | |||||||||||||||
| MN Gr 8 1997-98 |
BST | Percent meeting H.S. minimum standard | SpEd 27.0 |
68.0 | SpEd 29.0 |
71.0 | No assessments |
||||||||||||||||||
| MNb Gr 5 1997-98 |
MCAs | Percent at or above Level II | SpEd 39.0 |
79.0 | SpEd 47.0 |
80.0 | SpEd 51.0 |
80.0 | No assessments | ||||||||||||||||
| MS Gr 8 1997-98 |
ITBS | Percentile rank (no passing indicator) | 25.0 | 51.0 | 21.0 | 49.0 | No assessments |
||||||||||||||||||
| MS Gr 9 1997-98 |
TAP | Percentile rank (no passing indicator) | 16.0 | 42.0 | 20.0 | 43.0 | No assessments |
||||||||||||||||||
| MS 1997-98 |
FLE | Percent passing |
Composite 45.1 |
All
Composite 90.8 |
No assessments | ||||||||||||||||||||
| NV Gr 8 1997-98 |
Terra Nova |
National Percentile of the Mean NCE | IEP 17.0 |
52.0 | IEP 15.0 |
47.0 | No assessments |
IEP 20.0 |
47.0 | No assessments | |||||||||||||||
| NH Gr 6 1997-98 |
NH Ed. Assess. | Percent Basic or above | Dis. 14.0 |
Non Dis. 63.0 |
Dis. 14.0 |
Non Dis. 51.0 |
No assessments |
Dis. 7.0 |
Non Dis. 29.0 |
Dis. 16.0 |
Non Dis. 55.0 |
||||||||||||||
| NY Gr 6 1996-97 |
PEP | Above State Reference Points | 46.6 | 82.0 | 73.5 | 93.0 | No PEP Assessments in these subjects |
||||||||||||||||||
| NY c Gr 9-12 1996-97 |
Regents Comp. Tests | Percent Passing | 58.2 | 74.0 | 42.6 | 56.0 | 67.7 | 78.0 | 45.8 | 59.0 | 39.2 | 51.0 Glob. Stud. | |||||||||||||
| NY c 1997-98 |
Regents Exams | Percent of Tested Scoring 65 or higher | Eng. 51.4 | Eng. 80.6 | Seq.Math 47.6 | Seq. Math 69.0 | |||||||||||||||||||
| NC Gr 8 1996-97 |
End-of-Grade Tests | Percent at or above Level III | Math
& Reading (SWD) 21.0** |
Math & Reading (All) 63.5 |
No assessments |
||||||||||||||||||||
| NCd 1996-97 |
End-of-Course Multiple – Choice Tests | Percent At or Above Level III |
Eng. I 15.8** |
Eng. I 58.5 |
Alg. I 26.0 ** |
Alg. I 55.5 |
No assessment | Bio 22.0 ** |
Bio 57 |
U.S. Hist.
19.6 ** ELP 25.4 ** |
U.S. Hist. 49.5 ELP 62.6 |
||||||||||||||
| RI (Gr 8) 1997-98 |
New Stand. Refer. Exams | Percent meeting the standard | SpEd Rdg. 8.0 |
Rdg. 38.0 |
SpEd Skills 20.0 Prob. Solv. 3.0 |
Skills 51.0 Prob. Solv. 20.0 |
Sp Ed Writ. Eff. 50.0 |
Writ. Eff. 82.0 |
No assessments |
||||||||||||||||
| RI (Gr 8) 1997-98 |
RI Writing Assess. | Percent Proficient |
Sp Ed 10.0 |
45.0 |
|||||||||||||||||||||
| SCe (Gr 8) 1997-98 |
BSAP | Percent meeting BSAP standards | Dis. 26.5 |
68.4 | Dis. 29.0 |
65.0 | Dis. 38.7 |
78.7 | Dis. 13.2 |
44.4 | No assess. | ||||||||||||||
| SC (Gr 7) 1997-98 |
MAT/7 | Percent in the 51 to 99 percentile | Dis. 13.0 |
46.0 | Dis. 15.0 |
48.0 | Dis. Lang 18.0 |
Lang 54.0 |
No assessments |
||||||||||||||||
| SC (Gr K) 1997-98 |
CSAB | % meeting readiness standard | Dis. 59.7 |
81.2 |
|||||||||||||||||||||
| SDf (Gr 8) 1998-99 |
SAT/9 | Percent. rank | IEP St 26.0 IEP Acc. 21.0 IEP NS Accom 22.0 |
64.0 |
IEP
St 33.0 IEP Acc. 26.0 IEP NS Acc. 24.0 |
69.0 |
IEP St 15.0 IEP Acc. 10.0 IEP NS Acc. 12.0 |
57.0 |
IEP St 44 IEP Acc 35 IEP NS Acc 34 |
74.0 |
IEP St 37 IEP Acc 33 IEP NS Acc 30 |
70.0 |
|||||||||||||
| TX (Gr 8) 1997-98 |
TAAS | Percent passing | Sp Ed 45.0 |
All 81.0 |
Sp Ed 39.0 |
All 79.0 |
Sp Ed 36.0 |
All 79.0 |
Sp Ed 47.0 |
Not SpEd 84.0 |
Sp Ed 30.0 |
Not SpEd 69.0 |
|||||||||||||
| (Gr 7-12) 1997-98 |
End-of-Course Exams | % Met minimum expectations | No passing benchmarks yet for Eng. II Exam | Sp Ed Alg.I 8.0 |
Not Sp Ed 39.0 |
No assessment | Sp Ed Bio. 39.0 |
Not Sp Ed 80.0 |
No passing
benchmarks for U.S. History Exam |
||||||||||||||||
| VTg (Gr 8) 1997-98 |
VT Assess. Exams | Percent at or above standard | IEP 19.0 |
No IEP 66.0 |
IEP 24.0 |
No IEP 61 |
IEP 42.0 |
No IEP 86 |
IEP Gr 6 12.0 |
No IEP Gr 6 36.0 |
No assessment | ||||||||||||||
| VAh (Gr 8) 1997-98 |
VA Literacy Passport Test | Percent passing | 23.0 |
Not SWD 48.0 |
31.4 |
Not
SWD 50.4 |
21.6 |
Not
SWD 49.8 |
No assessments |
||||||||||||||||
| WVi (Gr 3 – 11) 1997-98 |
SAT/9 | % in each quartile |
SpEd |
All |
|||||||||||||||||||||
a DE does not identify which of its four point rubric comprises an adequate or "passing" on the Writing Assessment. For purpose of display, we selected the 2.0 level as "passing." Only the percentile rank is given for the SAT/9 portion of the DTSP. DE does give standards-based scores including raw mean score, raw standard deviation, mean scale score, and mean scale standard deviation.
b The authors selected % at or above Level II as "passing" for the Minnesota Comprehensive Assessment results because the report stated that those at "Level III or above have demonstrated more than simple minimum competency" (p. 29, Office of Educational Accountability, 1999).
c The authors selected 1996-97 RCT data for NY because data for all students were available as well. More current data (1997-98) of the performance of SWD for the RCT were available, but no data were available for all students for the same academic year (1997-98). 1997-98 data were available for both SWD and all students for the Regents Exams, and thus, were included. Data were only included if comparisons could be made. Finally, results on SWD for the Regents Preliminary Competency Tests were available, but not for all students; thus, these data were not included.
d NC provides disaggregated results by category of special education services for the math and reading end-of grade and end-of-course tests. We have calculated the aggregate data for students with disabilities from information provided in their state reports. ELP refers to Economic, Legal & Political Systems EOC test.
e The authors chose the 51 – 99 percentile range as the passing score. SC did not specify a passing criterion, but presented the percentages by national quarters.
f SD provides disaggregated scores for students on an IEP who took the test under standard conditions (IEP St), standard accommodations (IEP Accom), and with nonstandard (NS) accommodations (IEP NC Accom) as well as for students on a 504 plan who took the SAT/9 under the same three conditions.
g VT provided bar graphs of the disaggregated results, and so we had to approximate the percentage passing.
h VA also disaggregates results of the SAT/9 by category of students receiving special education services. Not enough information is available to calculate overall scores for SWD in each content area. There is also not a passing descriptor for the SAT/9.
i WV tests in these areas as well as SAT/9 Language, Spelling, Study Skills, and Listening areas. However, data disaggregated for SWD are not given by content area, but for the average of all students with disabilities (excluding gifted) tested under standard conditions in grades 3 – 11 on the total basic skills scores (does not include SWD who take the test under nonstandard conditions). We chose the 51 – 99 percentile range as the passing score. WV did not specify a passing criterion, but presented the percentages by quartiles.
LEGEND
| Acronym | Term |
| BSAP | South Carolina’s Basic Skills Assessment Program |
| BST | Minnesota’s Basic Skills Test |
| Citz. | Maryland’s Citizenship Functional Test |
| CRT’s | Criterion-referenced tests which are part of the LA Educational Assessment Program |
| CSAB | Cognitive Skills Assessment Battery (CSAB) |
| Dis. | Students with an identified disability |
| DTSP | Delaware Student Testing Program |
| Funct. Tests | Maryland’s Functional Tests |
| FLE | Mississippi’s Functional Literacy Exam |
| IEP | Students with an Individualized Education Program |
| MSPAP | Maryland School Performance Assessment Program |
| MCAS | Massachusetts Comprehensive Assessment System |
| MCAs | Minnesota Comprehensive Assessments |
| NP of the NCE | National percentile of the normal curve equivalent |
| PEP | Pupil Evaluation Program tests (New York) |
| Regents Comp. Tests | New York’s Regents Competency Tests |
| SpEd | Special Education students |
| SAT/9 | Stanford Achievement Test, 9th Edition |
| SWD | Students with disabilities |
| TAAS | Texas’s Assessment of Academic Skills |
| Terra Nova/CTSB | California Test of Basic Skills, 5th Edition (Achievement test) |
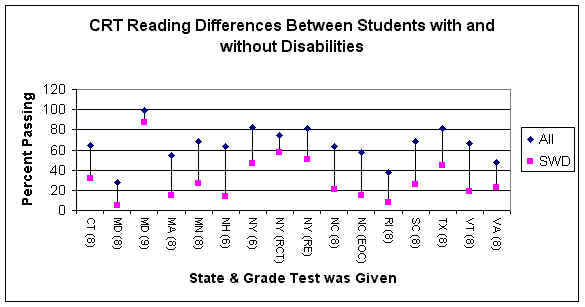
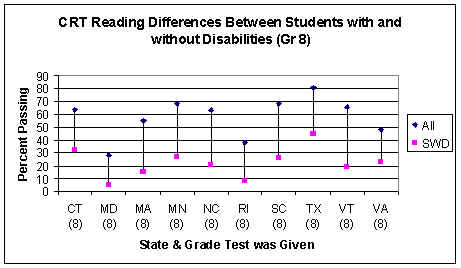
Reading Achievement. Figures 1 and 2 depict the differences between percentages of all students and students with disabilities meeting standards on criterion-referenced assessments in reading. These figures are based on data in Table 4. As indicated, the performance of students with disabilities was quite variable compared to all students’ performance. There were not only differences across states, but also within states on different assessments (perhaps reflecting the difficulty of each assessment). From the data reported, 5% to 87% of students with disabilities tested are meeting reading standards (see Table 5). In fact, these divergent passing rates came from different tests in the same state (Maryland). The differences in passing rates between all students and students with disabilities ranged from 12 to 49 percentage points (see Figure 1). Maryland and New York had the smallest gap (12 and 16 percentage points) in reading performance on their functional or competency exams (Maryland’s Functional Tests and New York’s Regents Competency Exams). In grade 8, the differences in the passing rates between all students and students with disabilities in reading performance ranged from 23 to 47 percentage points (see Table 5 and Figure 2).
Figure 1. CRT Reading Differences Between Students With and Without Disabilities
Figure 2. CRT Reading Differences Between Students With and Without Disabilities (Grade 8)
As expected, when examining the reading differences between all students and students with disabilities on norm-referenced tests (NRT) in Figure 3, the performance was not as variable. Students with disabilities from the five states that presented NRT data performed between the 13th and 26th percentile (see Table 5). The percentage differences in reading performance between students with disabilities and all students spanned 26% to 43%. When looking at the same NRT (SAT/9) reading assessment used by both Delaware and South Dakota (refer to Figure 3), the difference in performance results may be a reflection of the method of reporting procedures. South Dakota disaggregates scores by students with disabilities on an IEP taking the assessment under standard conditions, those taking it with standard accommodations, and those taking it with nonstandard accommodations. In Figure 3, we used the percentage of those on an IEP taking the assessment under standard conditions since an aggregate score for all students with disabilities tested was not given. Delaware, on the other hand, does not make that distinction, and it is unclear who is included in their percentages (e.g., all students on an IEP using standard and nonstandard accommodations, all students on an IEP tested under standard conditions or using standard accommodations, or just students on an IEP testing under standard conditions).
Figure 3. NRT Reading Differences Between Students With and Without Disabilities
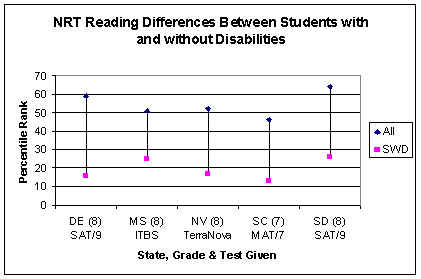
Table 5. Reading Achievement Differences Between Students With and Without Disabilities
| State | All (%) |
Students with Disabilities (%) |
Difference (%) |
| CT (8) CMT | 64 |
32 |
32 |
| DE (8) DTSP (SAT/9) | 59 |
16 |
43 |
| MD (8) MSPAP | 28 |
5 |
23 |
| MD (9) Funct. Tests | 99 |
87 |
12 |
| MA (8) MCAS | 55 |
15 |
40 |
| MN (8) BST | 68 |
27 |
41 |
| MS (8) ITBS | 51 |
25 |
26 |
| NV (8) TerraNova | 52 |
17 |
35 |
| NH (6) NH Ed. Assess. | 63 |
14 |
49 |
| NY (6) PEP | 82 |
47 |
35 |
| NY Regents Compt. Tests | 74 |
58 |
16 |
| NY Regents Exam (English) | 81 |
51 |
30 |
| NC (8) End-of-Grade Tests | 64 |
21 |
43 |
| NC End-of-Course (English I) | 59 |
16 |
42 |
| RI (8) Eng. Lang. Arts/Reading | 38 |
8 |
30 |
| SC (8) BSAP | 68 |
26 |
42 |
| SC (7) MAT/7 | 46 |
13 |
33 |
| SD (8) SAT/9 | 64 |
26* |
38 |
| TX (8) TAAS | 81 |
45 |
36 |
|
VT (8) VT Assess. Exams |
66 |
19 |
47 |
| VA (8) VLPT | 48 |
23 |
25 |
*Percentile given for students on an IEP who took the test under standard conditions.
Math Achievement. Performance in math was just as variable as performance in reading. From all data reported, 3% to 74% of students with disabilities are meeting math standards. The differences in passing rates of students with disabilities and all students ranged from 13 to 42 percentage points (see Table 6 and Figure 4). As detailed in Table 6 and visually depicted in Figure 5, achievement differences on criterion-referenced exams in 8th grade between all students and students with disabilities ranged from 19 (VA Literacy Passport Test) to 42 percentage points (MN Basic Standards Test and NC End-of-Grade Test). Maryland and New York, again, had the smallest achievement differences (e.g., 16 and 13 percentage points) between these two groups of students.
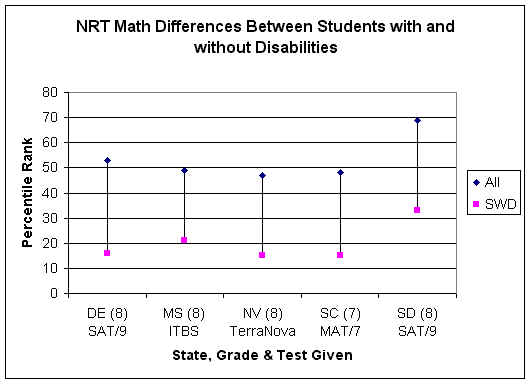
Students with disabilities from the five states that presented NRT data performed between the 15th and 33rd percentile (see Figure 6). The percentage differences between all students and students with disabilities in math achievement were very small across these five states: 28% to 37%. Again, South Dakota’s passing percentages for the same SAT/9 math assessment as compared to Delaware’s SAT/9 results appear to be much larger, but we used the percentage of students on an IEP under standard conditions since there was no aggregate score for all students with disabilities’ performance.
Table 6. Math Achievement Differences Between Students With and Without Disabilities
State |
All (%) |
Students with Disabilities (%) |
Difference (%) |
CT (8) CMT |
53 |
20 |
33 |
DE (8) DTSP (SAT/9) |
53 |
16 |
37 |
MD (8) MSPAP |
52 |
16 |
36 |
MD (9) Funct. Tests |
87 |
71 |
16 |
MA (8) MCAS |
31 |
6 |
25 |
MN (8) BST |
71 |
29 |
42 |
MS (8) ITBS |
49 |
21 |
28 |
NV (8) TerraNova |
47 |
15 |
32 |
NH (6) NH Ed. Assess. |
51 |
14 |
37 |
NY (6) PEP |
93 |
74 |
19 |
NY Regents Compt. Tests |
56 |
43 |
13 |
NY Regents Exams (Seq. Math) |
69 |
48 |
21 |
NC (8) End-of-Grade Tests |
63 |
21 |
42 |
NC End-of-Course (Algebra I) |
55 |
26 |
29 |
RI (8) Stand. Ref. Exams (Math Skills) |
51 |
20 |
31 |
RI (8) Stand. Ref. Exams (Math Problem Solving) |
20 |
3 |
17 |
SC (8) BSAP |
65 |
29 |
36 |
SC (7) MAT/7 |
48 |
15 |
33 |
SD (8) SAT/9 |
69 |
33* |
36 |
TX (8) TAAS |
79 |
39 |
40 |
TX End-of-Course (7-12) |
39 |
8 |
31 |
VT (8) VT Assess. |
61 |
24 |
37 |
VA (8) VLPT |
50 |
31 |
19 |
*Percentile given for students on an IEP who took the test under standard conditions.
Figure 4. CRT Math Differences Between Students With and Without Disabilities
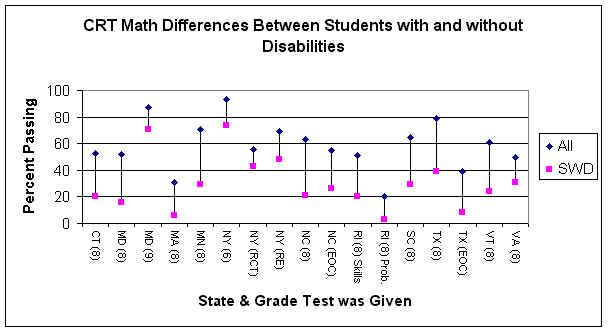
Figure 5. CRT Math Differences Between Students With and Without Disabilities (Grade 8)
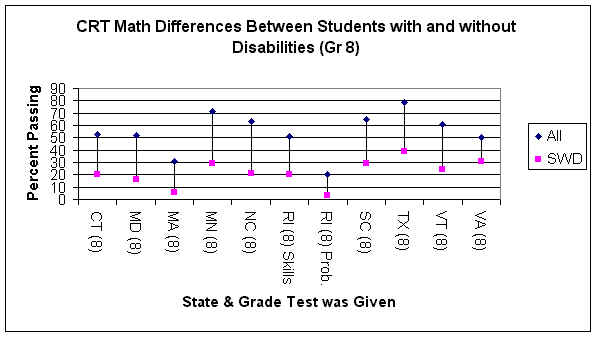
Figure 6. NRT Math Differences Between Students With and Without Disabilities
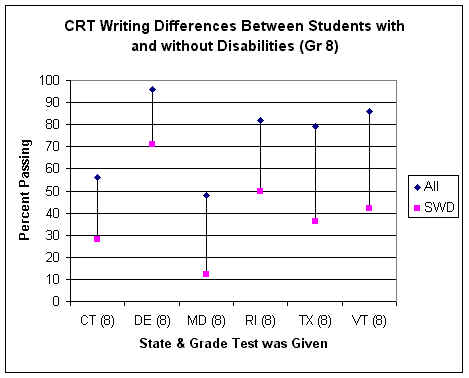
Writing Achievement. Writing performance achievement differences between students with and without disabilities are similar to reading and math achievement. Looking across states and grades, 10% to 69% of students with disabilities are passing state writing standards (see Table 7 and Figure 7). Narrowing the scope to 8th grade writing assessments, the differences in passing rates of students with disabilities and all students ranged from 25 to 44 percentage points (see Figure 8).
Table 7. Writing Achievement Differences Between Students With and Without Disabilities
State |
All (%) |
Students with Disabilities (%) |
Difference (%) |
CT (8) CMT |
56 |
28 |
28 |
DE (8) DE Writing Assessment |
96 |
71 |
25 |
MD (8) MSPAP |
48 |
12 |
36 |
MD (9) Funct. Tests |
93 |
69 |
24 |
NY Regents Compt. Tests |
78 |
68 |
10 |
RI (8) Standard Reference Exams |
82 |
50 |
32 |
RI (10) Writing Assess. |
45 |
10 |
35 |
SC (8) BSAP |
79 |
39 |
40 |
SC (7) MAT/7 Language |
54 |
18 |
36 |
SD (8) SAT/9 Language |
57 |
15 |
42 |
TX (8) TAAS |
79 |
36 |
43 |
VT (8) Assess. Exams |
86 |
42 |
44 |
VA (6) VLPT |
50 |
22 |
28 |
Figure 7. CRT Writing Differences Between Students With and Without Disabilities
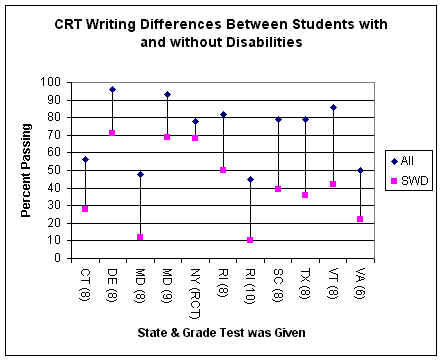
Figure 8. CRT Writing Differences Between Students With and Without Disabilities (Grade 8)
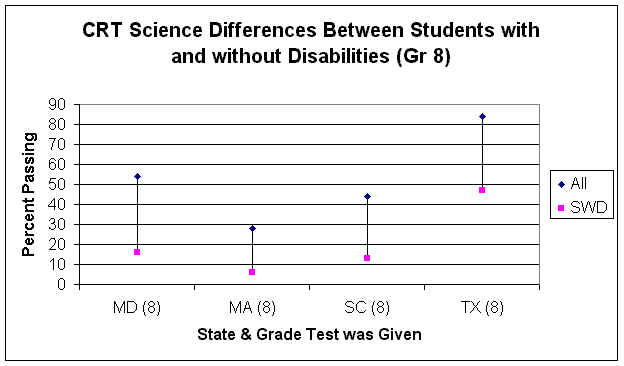
Science. There are fewer states reporting science achievement data; thus, these results are even more limited than for reading, math, and writing. Looking across states and grades, approximately 6% (MA Comprehensive Assessment System) to 47% (Texas Assessment of Academic Skills) of students with disabilities are meeting state science standards (see Table 8 and Figure 9). The differences in passing rates between all students and students with disabilities ranged from 13 to 41 percentage points. Science performance differences between students with disabilities and all students in 8th grade ranged from 22% to 38%, but this range only included four states’ results (see Figure 10).
Table 8. NRT Science Achievement Differences Between Students With and Without Disabilities
State |
All (%) |
Students with Disabilities (%) |
Difference (%) |
MD (8) MSPAP |
54 |
16 |
38 |
MA (8) MCAS |
28 |
6 |
22 |
NV (8) TerraNova |
47 |
20 |
27 |
NH (6) NH Ed. Assess. |
29 |
7 |
22 |
NY (9-12) RCT |
59 |
46 |
13 |
NC (9-12) EOC |
57 |
22 |
35 |
SC (8) BSAP |
44 |
13 |
31 |
SD (8) SAT/9 |
74 |
44* |
30 |
TX (8) TAAS |
84 |
47 |
37 |
TX (8) EOC, Biology |
80 |
39 |
41 |
VT (6) VT Assess. |
36 |
12 |
24 |
*Percentile given for students on an IEP who took the test under standard conditions.
Figure 9. CRT Science Differences Between Students With and Without Disabilities
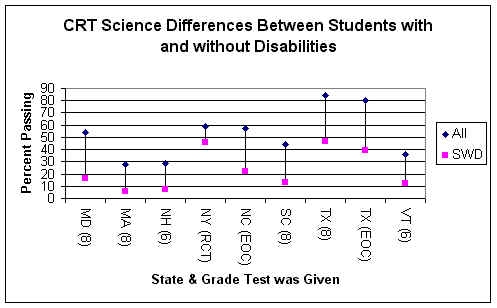
Figure 10. CRT Science Differences Between Students With and Without Disabilities (Grade 8)
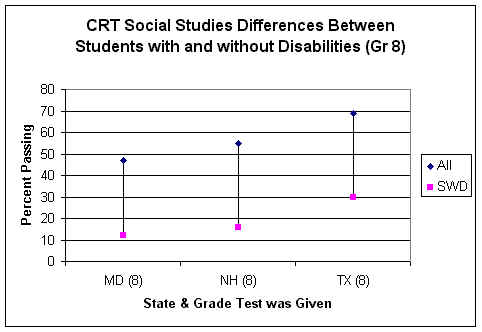
Social Studies. Fewer states report data on the social studies achievement. Looking across states and grades, 12% to 63% of students with disabilities are passing state standards in social studies (see Table 9). The differences in passing rates between all students and students with disabilities ranged from 12 to 39 percentage points (see Figure 11). Although only three states present the results of 8th grade social studies assessments, the differences in passing rates ranged from 35 to 39 percentage points (see Figure 12). These data should be interpreted cautiously.
Table 9. Social Studies Achievement Differences Between Students With and Without Disabilities
State |
All (%) |
Students with Disabilities (%) |
Difference (%) |
MD (8) MSPAP |
47 |
12 |
35 |
MD (9) Funct. Tests |
87 |
63 |
24 |
NH (8) NH Ed. Assess. |
55 |
16 |
39 |
NY (9-12) RCT, Global Studies |
51 |
39 |
12 |
NC EOC, U.S. History |
50 |
20 |
30 |
NC EOC, ELP |
63 |
25 |
38 |
SD (8) SAT/9 |
70 |
37 |
33 |
TX (8) TAAS |
69 |
30 |
39 |
*Percentile given for students on an IEP who took the test under standard conditions.
Figure 11. CRT Social Studies Differences Between Students With and Without Disabilities
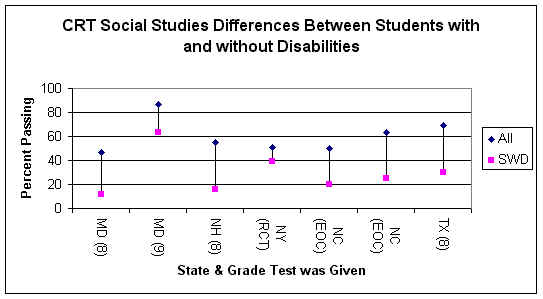
Figure 12. CRT Social Studies Achievement Differences Between Students With and Without Disabilities (Grade 8)
In the area of Student-Oriented Domains, 41 states reported on students with disabilities (see Table 2). Although this number is far greater than that for the area of Academic and Functional Literacy, approximately 18 percent of states are not reporting in this area. In Table 10 we provide a summary of educational process data, specifically Participation and Family Involvement data. In the area of Participation, states reporting on such indicators as the number of students with disabilities participating in large scale assessments, graduation or exit data, enrollment data, dropout rates, or time spent in various settings are noted. There were no data to reflect the domain Family Involvement in state reports.
Of those requirements that historically were mandated to be reported to the federal agency, the majority of states (38) reported on the enrollment or attendance of students with disabilities, making it the most common indicator reported for these students. Eight states (Connecticut, Kansas, Louisiana, Maryland, Minnesota, New York, Texas, Virginia) reported dropout data on students with disabilities in their public reports. Graduation/exit data on students with disabilities were reported by 9 states (Connecticut, Louisiana, Minnesota, Mississippi, Missouri, New York, Tennessee, Texas, Virginia). Six states reported on students with disabilities’ time spent in various settings (Connecticut, Maryland, New York, South Dakota, Texas, Utah). Six states (Kansas, Maine, New York, North Carolina, Texas, Virginia) had unique indicators on students with disabilities including:
number of violent acts committed;
in-grade retention rates;
declassification rates;
provision of test modifications to credential recipients (various types of diplomas);
participation in high school equivalency programs;
absentee rates on the day of testing;
accommodation use on assessments;
advanced course completion;
participation in recommended high school program;
participation in paid and non-paid work experiences; and
school-sponsored co-curricular participation.
Participation in state and district assessments is now required (by IDEA 97) to be publicly reported. Fourteen states included these participation data in reporting on students with disabilities (see Table 2 and Table 10). Five states reported on four or more indicators in the area of Participation (Connecticut, Minnesota, New York, Texas, Virginia). Overall, only 28% of the states reported on educational process indicators of Student-Oriented domains that they were not required to report. Thus, little educational process data are reported on students with disabilities that are not already federally mandated.
Table 10. Educational Processes: Summary
Student Oriented Domains: Participation / Family Involvement |
|||||||
| State | Participation in Large Scale Assessment |
Graduation Rates/Exit Data |
Enrollment |
Drop-Out Rates |
Time Spent in Various Settings |
Other Unique Participation Indicators |
Family Involvement |
| AL | |||||||
| AK | ü * |
ü |
|||||
| AZ | |||||||
| AR | |||||||
| CA | |||||||
| CO | |||||||
| CT | ü |
ü |
ü |
ü |
ü |
||
| DE | ü ** |
ü |
|||||
| DC | ü |
||||||
| FL | ü |
||||||
| GA | ü |
||||||
| HI | ü |
||||||
| ID | ü |
||||||
| IL | |||||||
| IN | ü |
||||||
| IA | ü |
||||||
| KS | ü *** |
ü |
a |
||||
| KY | ü |
||||||
| LA | ü |
ü |
|||||
| ME | b |
||||||
| MD | ü |
ü |
ü |
||||
| MA | ü |
ü |
|||||
| MI | |||||||
| MN | ü |
ü |
ü *** |
ü |
|||
| MS | ü |
ü |
|||||
| MO | ü **** |
ü |
|||||
| MT | ü |
||||||
| NE | ü |
||||||
| NV | ü |
ü |
|||||
| NH | ü |
ü |
|||||
| NJ | ü |
ü |
|||||
| NM | ü |
||||||
| NY | ü |
ü |
ü |
ü |
ü |
c |
|
| NC | ü |
ü |
d |
||||
| ND | ü |
||||||
| OH | ü |
||||||
| OK | ü |
||||||
| OR | ü |
||||||
| PA | ü |
||||||
| RI | ü |
||||||
| SC | ü |
ü |
|||||
| SD | ü |
ü |
|||||
| TN | ü |
ü |
|||||
| TX | ü |
ü |
ü |
ü |
e |
||
| UT | ü |
ü |
|||||
| VT | ü |
ü |
|||||
| VA | ü |
ü |
ü |
f |
|||
| WA | |||||||
| WV | ü |
||||||
| WI | |||||||
| WY | ü |
||||||
*AK only reports exemption data for students coded Special Education
and LEP.
**DE only reports % exempted from all or part of the DTSP, and %
participating with accommodations on the DTSP.
*** KS and MN only report attendance data – no enrollment data.
**** MO reports the number of disabled workers in sheltered workshops.
a = # of violent acts committed by students with disabilities against
students and teachers.
b = In-grade retention rates for elementary and secondary students with
disabilities.
c = Declassification rates; provision of test modifications to
credential recipients (various types of diplomas); participation in high
school equivalency programs; absentee rates on the day of testing.
d = #/% tested by modification on end-of-grade and end-of-course
multiple-choice tests; # of exempt students also given for both EOG and
EOC tests.
e = Retention rates, % in Advanced courses; % in recommended high school
program.
f = % who participated in paid or non-paid work experiences;
school-sponsored co-curricular participation.
ü Indicates states that included information on a student-oriented domain.
Table 11 identifies the various types of participation data on students with disabilities presented by states. For individual state data, refer to Appendix C, a compilation of the participation data available in state accountability reports. Data provided in this table include:
Participation numbers or rates for all students (column 3).
Participation numbers or rates for students with disabilities; rates presented are the number of students with disabilities who took the test divided by the total number of students with disabilities (column 4).
Participation numbers or rates; rates presented are the number of students with disabilities who took the test divided by the total number of students (with and without disabilities) who took the test (column 5).
Participation rates of students coded both as being students with disabilities and Limited English Proficient; rates presented are the number of students with disabilities who are also coded as Limited English Proficient who took the test divided by all students (column 6).
Exemption numbers or rates; rates presented are the number of students with disabilities who were exempted divided by the total number of students with disabilities (column 7).
Exemption numbers or rates; rates presented are the number of students with disabilities exempted as special education students divided by the total number of students (with and without disabilities) enrolled (column 8).
Absentee rates; rates presented are the number of students with disabilities who were enrolled in grade but not tested (assumed absent) (column 9).
Fourteen states provided some type of data on the test participation of students with disabilities in statewide assessments (Connecticut, Delaware, Massachusetts, Minnesota, Nevada, New Hampshire, New Jersey, New York, North Carolina, South Carolina, Texas, Vermont, Virginia, West Virginia).
Five states (Massachusetts, New York, Texas, Vermont, West Virginia) provided participation data as the number of students with disabilities who took the test, divided by the population of all students with disabilities at the grade level being tested (refer to Appendix C). Six states (Minnesota, Nevada, New Jersey, North Carolina, South Carolina, Virginia) provided just the number of students with disabilities tested. Exemption data, giving the percentage of all students with disabilities who were excluded from testing, were provided by three states (Connecticut, New York, and Texas). Nevada, North Carolina and Vermont provided only the number of students with disabilities excluded from testing. From the data available (using both participation data in column 4 and exemption data in column 7), it appears that between 33% (NY Regents Exam) and 97% (Vermont Assessment of English/Language Arts) of students with disabilities are participating in testing in the 14 states that reported participation data. The variability of participation rates could also be a function of the type of exam.
Table 11. Reported Test Participation Data of Students with Disabilities
| State | Test |
All Student Partic. In Testing (No./%) | SWD Partic. In Testing (No./% of SWD) | SWD Partic. In Testing (No./% of Total Tested) | Student Coded Both as SWD and LEP (No./% of All) | SWD Excluded or Exempted (No./% of SWD) | SWD Excluded or Exempted (No./% of Total Students) | Student Enroll. In Grade but not Tested: Absent (No./%) |
AK |
CAT/5 |
ü |
ü |
|||||
CT |
CMT |
ü |
ü |
ü |
||||
MA |
MCAS |
ü |
ü |
|||||
MN |
MCA |
ü |
ü |
|||||
BST |
ü |
ü |
||||||
NH |
NH Assess. |
ü |
ü |
ü |
||||
NV |
Terra Nova |
ü |
ü |
ü |
||||
NJ |
EWT |
ü |
ü |
ü |
||||
HSPT |
ü |
ü |
||||||
NY |
PEP |
ü |
ü |
ü |
ü |
|||
RCT |
ü |
|||||||
Regents |
ü |
ü |
||||||
Occup. Ed. Exam |
ü |
ü |
||||||
NC |
EOG |
ü |
ü |
ü |
||||
EOC |
ü |
ü |
ü |
|||||
SC |
MAT/7 |
ü |
ü |
ü |
||||
BSAP |
ü |
ü |
ü |
|||||
CSAB |
ü |
ü |
ü |
|||||
TX |
TAAS |
ü |
ü |
ü |
||||
EOC |
ü |
ü |
||||||
VT |
VT Assess. |
ü |
ü |
|||||
VA |
SAT/9 |
ü |
ü |
|||||
VLPT |
ü |
ü |
||||||
WV |
SAT/9 |
ü |
ü |
ü |
With the assessment provisions of IDEA 97, researchers, educators, and parents expect to see changes in reporting practices for students with disabilities. However, as this gathering of state public educational accountability documents verifies, the changes are minimal. In general, more reports are being produced, but fewer states are producing reports consistent with the requirements of IDEA 97. States are expected to report on the participation and performance of students with disabilities on statewide assessments as often as they report for regular education students. Yet, as our analysis of reports indicates, more than two-thirds of the documents that did not include data on students with disabilities, did provide performance data on regular education students.
Table 12 summarizes the information obtained from state reports in the area of educational results. Although most of the data on students with disabilities is primarily process data (e.g., enrollment), approximately 34% of the states did disaggregate performance data on statewide assessments. In our previous analysis, 26% of states reported such data. Although the number of states with graduation exams has increased in each successive analysis, the number of states that publicly report these data had decreased (47% to 35%). Regardless of when reports were analyzed, very little data have been reported in the domains of Personal and Social Well-Being and Satisfaction.
Table 12. Summary of Educational Results on Students with Disabilities
| Educational
Results
|
In our previous analysis, the achievement gap between students with disabilities and regular education students across content areas and grades ranged from 30 to 50 percentage points. However, in the current analysis, when controlling for grade and separating out performance by content areas (reading, math, writing, science, and social studies), those states with 8th grade performance data on students with disabilities showed an achievement gap that spanned 20 to 50 percentage points. These results must be interpreted cautiously, however, due to the small number of states by content area (e.g., 10 states with math and reading data, 4 states with science data, 2 states with social studies data) as well as the variability in who is actually participating in the state assessments.
Looking at all grades and across all content areas with data on students with disabilities, the differences in proficiency rates ranged from 10 to 50 percentage points. Approximately 3% to 87% of students with disabilities met state standards across the five content areas. These divergent results could be due to the difficulty of the assessments either across states or within states (e.g., functional or basic skills exam versus a high standards exam) or fewer students with disabilities were participating in the different tests, either across states or within states.
Table 13 summarizes the information obtained from state reports in the area of Educational Processes. In the area of Student-Oriented Domains, 41 states reported on students with disabilities. Though many states reported only enrollment information (e.g., 38 states), only 18% of the states did not report any process data on students with disabilities (an improvement from 25% in our previous analysis). Fourteen states did include participation in large-scale assessments, but this was not a significant increase from the twelve states that provided this same information in our previous analysis. There were no data on Family Involvement in the present study; one state provided these data in the previous analysis. Fewer states reported dropout and graduation exit data on students with disabilities than in the previous analysis (11 states versus 9).
Table 13. Summary of Processes Results on Students with Disabilities
Educational
Processes
|
Although 14 states provided some type of participation data on students with disabilities, only 5 states actually reported the percentage of students with disabilities tested in statewide assessments. Exemption data are rarely given (e.g., 3 states). Due to the small number of states that actually report the percentage of students with disabilities participating (N=5), it is difficult to make any generalizations. The range in participation from 33% to 97% is extreme. The variability in participation could be related to a number of factors: state participation policies, type of exam, inclusion/exclusion of students who have used accommodations, etc. Whether any of these explanations are good reasons is debatable.
Tables 14 and 15 highlight the reporting trends from NCEO’s three analyses of state reports. As noted, the number of reports has increased substantially as has the availability of reports via the World Wide Web. Table 15 details those states that provided performance results on students with disabilities across the three analyses. In the first analysis, 11 states reported state assessment data on students with disabilities. (However, one of these states actually only had unpublished data as noted by the asterisk.) The number of states reporting data rose to 13 states in our second analysis, but two states had unpublished data, and one state in the previous analysis did not continue to produce such data. In this last round of reports, the number significantly climbed to 17 states reporting performance data on students with disabilities. In fact, almost half of those states (N=8) were states that had never before provided this information in their public accountability documents. An additional five states provided us with unpublished data (see Methods for further detail).
Table 14. Reporting Trends Over the Past Three Analyses of State Reports
|
Table 15. Performance Results on Students with Disabilities Provided by States
Accountability Report Analyses |
|||
Study 1 |
Study 2 |
IDEA ’97 |
Study 3 |
Connecticut |
Connecticut |
Connecticut |
|
Delaware |
Delaware |
Delaware |
|
Georgia* |
Georgia* |
||
Kansas |
|||
Louisiana |
Louisiana |
||
Maine |
|||
Maryland |
|||
Massachusetts |
|||
Minnesota |
|||
Mississippi |
|||
Nevada |
|||
New Hampshire |
New Hampshire |
||
New York |
New York |
New York |
|
North Carolina |
North Carolina |
North Carolina |
|
North Dakota* |
|||
Rhode Island |
Rhode Island |
Rhode Island |
|
South Carolina |
South Carolina |
South Carolina |
|
South Dakota |
|||
Texas |
Texas |
Texas |
|
Vermont |
|||
Virginia |
Virginia |
Virginia |
|
West Virginia |
|||
* We included unpublished data in Studies 1 and 2; these data were not included in Study 3.
A summary of the states that reported performance results disaggregated for students with disabilities, along with the academic year of the data included in the reports, is presented in Table 16. As indicated, most of the states’ reports included data for the academic year 1997-98. Two states provided data from a previous year (North Carolina and New York; however, New York also provided some data from 1997-98). One state provided data from 1998-99 (South Dakota).
Table 16. States Reporting Results Data on Students with Disabilities in Study 3
| State | Academic Year of Data Reported in Most Recent Report |
| Connecticut | 1997-98 |
| Delaware | 1997-98 |
| Maryland | 1997-98 |
| Massachusetts | 1997-98 |
| Minnesota | 1997-98 |
| Mississippi | 1997-98 |
| Nevada | 1997-98 |
| New Hampshire | 1997-98 |
| New York | 1996-97; 1997-98 |
| North Carolina | 1996-97 |
| Rhode Island | 1997-98 |
| South Carolina | 1997-98 |
| South Dakota | 1998-99 |
| Texas | 1997-98 |
| Vermont | 1997-98 |
| Virginia | 1997-98 |
| West Virginia | 1997-98 |
Table 17 lists the states that did not provide any performance results on students with disabilities; it also includes the academic year of data included in the reports. The majority of the 33 states that did not report performance data on students with disabilities, did report data on regular education students for the academic year 1997-98—the same year for data included in the reports of all but two states with disaggregated data. Three states that did not report performance data on students with disabilities and were under the requirements of IDEA 97 actually had data for the academic year 1998-99. There were only three states that used data from the 1996-97 academic school year, and thus, may not have been required to provide data on students with disabilities (Alaska, Arkansas, Montana), although two of the states that did provide data used data from 1996-97 (see Table 16).
Table 17. States Not Reporting Results Data on Students with Disabilities in Study 3
| State | Academic Year of Data Reported in Most Recent Report |
State | Academic Year of Data Reported in Most Recent Report |
| Alabama | 1997-98 |
Michigan | 1998-99 |
| Alaska | 1996-97 |
Missouri | 1997-98 |
| Arizona | 1998-99 |
Montana | 1996-97 |
| Arkansas | 1996-97 |
Nebraska | 1997-98 |
| California | 1997-98 |
New Jersey | 1997-98 |
| Colorado | 1997-98 |
New Mexico | 1997-98 |
| Florida | 1997-98 |
North Dakota | 1997-98 |
| Georgia | 1997-98 |
Ohio | 1997-98 |
| Hawaii | 1997-98 |
Oklahoma | 1997-98 |
| Idaho | 1997-98 |
Oregon | 1998-99 |
| Illinois | 1997-98 |
Pennsylvania | 1997-98 |
| Indiana | 1998-99 |
Tennessee | 1997-98 |
| Iowa | 1997-98 |
Utah | 1997-98 |
| Kansas | 1997-98 |
Washington | 1997-98 |
| Kentucky | 1997-98 |
Wisconsin | 1997-98 |
| Louisiana | 1997-98 |
Wyoming | 1997-98 |
| Maine | 1997-98 |
District of Columbia | 1997-98 |
Difficulties in reporting data for students with disabilities may be due to data collection systems. Many states may have two extant databases collected at different points in time, by different offices, and for different purposes. Almond, Tindal and Stieber (1997) discovered in their study of performance and participation rates of students with disabilities in Oregon’s state assessment, that joining the two extant databases (one from the Assessment Department and one from the Special Education Department) was a difficult task because the two systems did not share a common key needed to merge the files. The researchers pointed to the historical and legal conditions under which these two databases were created, and how these precedents may have obscured the eventual merger of the two systems. Almond et al. (1997) recommended that for assessments conducted at particular grade levels, age-to-grade designations of identifying students with disabilities may also leave out students from non-graded programs, those who started school late, or took the same grade level over a second time. States may need to retool their data collection systems to ensure that all students with disabilities are being included in performance reporting.
It is clear that there is new emphasis on reporting performance results of students. This is indicated by the number of new states reporting these data. However, the same trend is not occurring for data on participation in large-scale assessments. As noted previously, this may reflect difficulties in retooling data management systems. However, it seems unlikely that this is the case since most of the states do report performance data. One must ask whether the discrepancy really reflects a reluctance to reveal the numbers of students with disabilities participating in assessments, possibly because the numbers are low.
Of course, there may be other reasons for lack of either participation or performance data. Some of the challenges in reporting these data include:
Information systems in place that do not identify students with disabilities in state assessment procedures.
Inaccuracy in marking answer documents if done either by student or staff member or a proctor.
State policies on excluding students with disabilities who receive any type of accommodation or excluding the scores completely of those who have "nonstandard" accommodations.
Lack of standardized procedures for calculating participation rates.
No information provided on the number of absent students.
Data may only be aggregated at the school or district level, but not at the state level.
Students with disabilities could be included in state assessments, but state reports do not explicitly describe the population sample or disaggregate the data of students with disabilities.
Data on students with disabilities are collected, but not publicly reported and only used internally by state departments.
States are just beginning to report on the participation and performance of students with disabilities in state assessments. Because IDEA 97 requires that these data be included in state reports, it seems that states should at least indicate their recognition of the requirement, even if only by including a statement that the requirement exists and what the state plans to do to move toward meeting that requirement.
For data that are presented, we found that the data of students with disabilities were most often presented in the same table with data on other students (N=11 states). This approach, it would seem, encourages comparisons of groups of students. Since this does not seem to be the intent of the law, states might want to reconsider the approach. It might make much more sense to report participation and performance relative to identified standards, and to mark progress over time.
The goal of improvement over time for both participation and performance is fraught with challenges (Ysseldyke & Bielinski, in press). Misinterpretations of longitudinal trends in large-scale test performance of students with disabilities can easily occur if one does not account for the large numbers of students exiting and entering special education services in a given year. Ysseldyke and Bielinski (in press) analyzed one large state’s databases and discovered that over 5 years, 39,000 students began receiving or exited special education services at least once. This significantly impacts the performance trends of students with disabilities and can lead to inaccurate conclusions about the effectiveness of special education services.
Most important, states should be thorough in their reporting of the performance of students with disabilities—clearly accounting for the numbers of these students actually participating in state assessments, the numbers of exclusions, the shifts in populations of students receiving special education services, and complete reporting of student performance results. Reporting a single score without participation factors for students receiving special education services is not accurate nor justifiable.
Almond, P., Tindal, G., & Stieber, S. (1997). Linking inclusion to conclusions: An empirical study of participation of students with disabilities in statewide testing programs. Minneapolis, MN: University of Minnesota, National Center on Educational Outcomes.
Council of Chief State School Officers. (1998). State education accountability reports and indicator reports: Status of reports across the states 1998. Washington, DC: Author.
Thompson, S. & Thurlow, M. (1999). 1999 state special education outcomes: A report on state activities at the end of the century. Minneapolis, MN: University of Minnesota, National Center on Educational Outcomes.
Thurlow, M., House, A., Boys, C., Scott, D., & Ysseldyke, J. (2000). State participation and accommodations policies for students with disabilities: 1999 update (Synthesis Report 33). Minneapolis, MN: University of Minnesota, National Center on Educational Outcomes.
Thurlow, M. L., Langenfeld, K. H., Nelson, J. R., Shin, H., & Coleman, J. E. (1998). State accountability reports: What are states saying about students with disabilities? (Technical Report 20). Minneapolis, MN: University of Minnesota, National Center on Educational Outcomes.
University of the State of New York, New York State Education Department, & Office of Vocational and Educational Services for Individuals with Disabilities. (1999, Aug.). 1999 Pocketbook of goals and results for individuals with disabilities. Albany, NY: Author.
U.S. Department of Education. (1998). Twentieth annual report to Congress on the implementation of the Individuals with Disabilities Act. Washington, DC: Author.
Ysseldyke, J., & Bielinski, J. (2000). Effects of failure to consider student reclassification on the interpretation of test performance. Manuscript submitted for publication.
Ysseldyke, J., Krentz, J., Elliott, J., Thurlow, M., Erickson, R., & Moore, M. (1998). NCEO framework for educational accountability. Minneapolis, MN: University of Minnesota, National Center on Educational Outcomes.
Ysseldyke, J. E., Thurlow, M. L., Langenfeld, K. L., Nelson, J. R., Teelucksingh, E., & Seyfarth, A. (1998). Educational results for students with disabilities: What do the data tell us? (Technical Report 23) Minneapolis, MN: University of Minnesota, National Center on Educational Outcomes.
Zlatos, B. (1994). Don’t test, don’t tell: Is ‘academic red-shirting’ skewing the way we rank our schools? The American School Board Journal, 181 (11), 24-28.
Accountability Report Checklist Form
Participation Data for Students with Disabilities in Statewide Testing