1999 State Special Education Outcomes:
A Report on State Activities at the End of the Century
Published by the National Center on Educational Outcomes
December 1999
Prepared by: Sandra Thompson • Martha Thurlow
Any or all portions of this document may be reproduced and distributed without prior permission, provided the source is cited as:
Thompson, S., & Thurlow, M. (1999). 1999 State special education outcomes: A report on state activities at the end of the century. Minneapolis, MN: University of Minnesota, National Center on Educational Outcomes. Retrieved [today's date], from the World Wide Web: http://education.umn.edu/NCEO/OnlinePubs/99StateReport.htm./
The 1999 National Survey of State Directors of Special Education is the seventh in a series of surveys that have been conducted by NCEO since 1991. This year’s findings include:
These findings highlight the current status of students with disabilities at the end of a century marked by dramatic changes in measuring the outcomes of education for students with disabilities. The findings reinforce the need to continue to survey state directors of special education about the status of state special education outcomes.
The Mission of the National Center on Educational Outcomes
NCEO is a collaborative effort of the University of Minnesota, the National Association of State Directors of Special Education (NASDSE), and the Council of Chief State School Officers (CCSSO). Part of NCEO’s mission is to provide national leadership in assisting state and local education agencies in their development of policies and practices that encourage and support the participation of students with disabilities in accountability systems and data collection efforts. NCEO is working toward four goals for students with disabilities:
Goal 1: Students with disabilities will be a part of nationally-initiated educational reforms.
Goal 2: Students with disabilities will be a part of each state’s standards-based educational reform efforts.
Goal 3: Students with disabilities will be included in national educational data collection efforts.
Goal 4: Students with disabilities will be included in national and state level reporting of educational outcomes, with results that can be disaggregated.
Many NCEO activities promote these goals. In addition to its national survey, NCEO is working with its partners to provide needed information and support to state education agencies seeking to include students with disabilities in their efforts to provide better educational outcomes to all students.
The Center is affiliated with the Institute on Community Integration at the College of Education and Human Development, University of Minnesota. It is supported through a cooperative agreement (#H159C50004) with the U.S. Department of Education, Office of Special Education Programs. Opinions or points of view expressed within this document do not necessarily represent those of the Department or the Offices within it.
Acknowledgments
Many individuals provided input on both the content and format of this 1999 Special Education Outcomes document. NCEO especially expresses its appreciation to the state directors of special education and their staff who volunteered a portion of their valuable time in addressing the survey questions. In addition, special thanks go to:
• David Malouf and Lou Danielson, of the Office of Special Education Programs in the U.S. Department of Education;
• Eileen Ahearn, of the National Association of State Directors of Special Education;
• Joshua Davis, on-line survey design and maintenance;
• John Bielinski, data analyst for the National Center on Educational Outcomes; and
• Michael Moore, publications director for the National Center on Educational Outcomes.
State Special Education Outcomes 1999 was prepared by Sandra Thompson and Martha Thurlow, with support from research assistant Stacy Callender.
Overview of 1999 Survey
The National Center on Educational Outcomes has been surveying state directors of special education about efforts to include students with disabilities in education reform since 1991. At that time, most state directors of special education were just beginning to think about how students with disabilities fit into emerging educational reforms. Little did anyone realize the incredible magnitude of education reform efforts that would take place over the next eight years, at local, state, and national levels.
In 1997 the reauthorization of the Individuals with Disabilities Education Act (IDEA) sparked educational reform in special education. As a result of changes in the Act, educational results for students receiving special education services now must be as public as they are for other students. This means that states must define performance goals and indicators for themselves, and one of the indicators must be the performance of students with disabilities on state and district assessments. Students with disabilities must be included in state and district assessments, with accommodations as appropriate, or in an alternate assessment when they are not able to participate in the general assessment. Their performance on these measures is to be reported in the same way and with the same frequency as the performance of other students is reported.
IDEA 97 is not an isolated law. Its push for educational accountability is evident in other laws as well. The Improving America’s Schools Act, for example, requires that the performance of students with disabilities be disaggregated so that Title I reforms can be targeted toward the needs of these students as well as toward the needs of other students. Other laws, such as Goals 2000: Educate America Act and the School to Work Opportunities Act also solidify the push to recognize that students with disabilities are part of the educational system and that states and districts must be accountable for their learning as well. All in all, there has been a clear directive that the public needs to know, and has a right to know, about the performance of students receiving special education services.
As we produce this first report since the 1997 reauthorization of IDEA, we look at the key elements contained in IDEA. Yet, we also attempt to understand the pressures and barriers that affect state activities during this period of change. We give states the opportunity to report on the planning, development, and implementation of their accountability systems. And, we once again gather information on technical assistance needs so that states can better move forward in their efforts to meet the mandates of educational reform and at the same time do what is best for the children served by special education programs.
The 1999 Special Education Outcomes survey focuses on the implications of educational reform within the context of the 1997 reauthorization of the Individuals with Disabilities Education Act. Results are presented in six sections:
Participants in the 1999 survey included state directors of special education
from all 50 states and 11 unique states that abide by the provisions of IDEA. Responses to the survey were gathered on-line for the first time, or by fax or mail for those without Internet access. Some state directors designated other state officials to complete the survey, and some surveys were completed by multiple respondents, including state assessment personnel. Once compiled, drafts of tables were sent to state directors for verification. Several directors made changes in their responses and faxed them back to NCEO. Overall, responses were obtained from 48 of the 50 states and from the U.S. Virgin Islands.
The Context of Reform
Table 1 displays the number of students with disabilities, ages 6 to 17 years, served under the provisions of IDEA during the 1996-97 school year (see third column). It also shows in the last column what percentages these totals represent when compared to the total estimated resident population of students 6-17 years old (from second column). State special education populations differ in their proportion to the overall student populations because of a variety of factors, including differences among states in their eligibility requirements for receiving special education services.
Table 1. Frequency and Percentage of State Student Populations Receiving Special Education Services for the 1996-97 School Year
Name of State |
Estimated Resident Population for Children |
Number of Children Served Under IDEA (Ages 6-17) 2 |
Percent of All Children Served Under IDEA |
| Alabama | 719,328 |
84,406 |
11.73% |
| Alaska | 123,975 |
15,056 |
12.14% |
| Arizona | 738,684 |
68,403 |
9.26% |
| Arkansas | 447,838 |
45,050 |
10.06% |
| California | 5,548,936 |
505,936 |
9.12% |
| Colorado | 671,575 |
61,146 |
9.10% |
| Connecticut | 527,690 |
69,883 |
13.24% |
| Delaware | 115,806 |
13,190 |
11.39% |
| Florida | 2,262,861 |
293,033 |
12.51% |
| Georgia | 1,287,524 |
122,307 |
9.50% |
| Hawaii | 196,244 |
14,965 |
7.63% |
| Idaho | 239,941 |
21,213 |
8.84% |
| Illinois | 2,054,925 |
228,834 |
11.14% |
| Indiana | 1,005,325 |
119,308 |
11.87% |
| Iowa | 499,544 |
58,943 |
11.80% |
| Kansas | 470,136 |
46,744 |
9.94% |
| Kentucky | 656,613 |
66,902 |
10.19% |
| Louisiana | 837,677 |
78,554 |
9.38% |
| Maine | 212,162 |
27,838 |
13.12% |
| Maryland | 848,851 |
91,017 |
10.72% |
| Massachusetts | 945,688 |
136,577 |
14.44% |
| Michigan | 1,720,585 |
165,784 |
9.64% |
| Minnesota | 863,512 |
86,191 |
9.98% |
| Mississippi | 510,179 |
56,585 |
11.09% |
| Missouri | 949,395 |
111,331 |
11.73% |
Table 1. Frequency and Percentage of State Student Populations Receiving Special Education Services for the 1996-97 School Year (continued)
| Name of State | Estimated Resident Population for Children (Ages 6-17) 1 |
Number of Children Served Under IDEA (Ages 6-17) 2 |
Percent of All Children Served Under IDEA (Ages 6-17) 3 |
| Montana | 165,074 |
16,086 |
9.74% |
| Nebraska | 305,230 |
35,120 |
11.51% |
| Nevada | 268,132 |
25,761 |
9.61% |
| New Hampshire | 203,891 |
22,845 |
11.20% |
| New Jersey | 1,293,988 |
176,576 |
13.65% |
| New Mexico | 336,994 |
42,524 |
12.62% |
| New York | 2,938,973 |
339,892 |
11.56% |
| North Carolina | 1,212,477 |
132,295 |
10.91% |
| North Dakota | 118,783 |
10,967 |
9.23% |
| Ohio | 1,929,434 |
195,556 |
10.14% |
| Oklahoma | 604,777 |
65,206 |
10.78% |
| Oregon | 552,251 |
55,759 |
10.10% |
| Pennsylvania | 1,969,268 |
183,471 |
9.32% |
| Rhode Island | 158,229 |
22,810 |
14.42% |
| South Carolina | 628,881 |
77,098 |
12.26% |
| South Dakota | 142,091 |
12,268 |
8.63% |
| Tennessee | 882,139 |
109,041 |
12.36% |
| Texas | 3,552,482 |
405,491 |
11.41% |
| Utah | 453,896 |
46,673 |
10.28% |
| Vermont | 103,207 |
10,034 |
9.72% |
| Virginia | 1,081,618 |
125,065 |
11.56% |
| Washington | 969,424 |
90,630 |
9.35% |
| West Virginia | 292,704 |
39,943 |
13.65% |
| Wisconsin | 934,624 |
91,385 |
9.78% |
| Wyoming | 95,323 |
10,797 |
11.33% |
1
Data taken from Table AF4 published in Twentieth Annual Report to Congress (U.S. Department of Education, 1998).2
Data taken from Table AA1 published in Twentieth Annual Report to Congress (U.S. Department of Education, 1998).3
Data taken from Table AA10 published in Twentieth Annual Report to Congress (U.S. Department of Education, 1998).
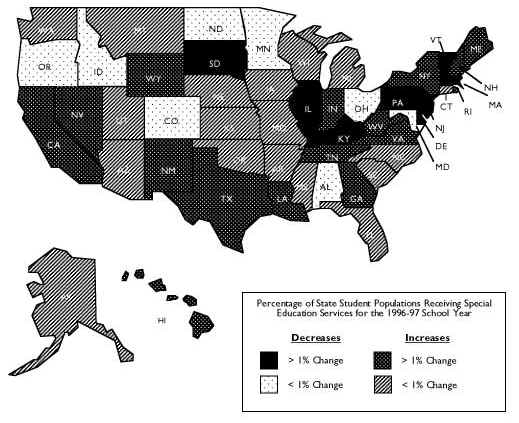
Figure 1 shows changes in populations of students receiving special education services from 1990 to 1997. While there has been an increase in 34 states and a decrease in 16 states, the percentages of change are generally quite small. Thus, special education populations continue to show tremendous variations from one state to another, but changes over time are relatively small.
Figure 1. Change in Percentage of Students Receiving Special Education Services from 1990 to 1997
Participation of Students with Disabilities in Statewide Testing
The extent to which students with disabilities are participating in statewide testing has increased and also become more measurable since NCEO began asking states to provide data on student participation in assessments. Participation data previously were largely inaccessible or unavailable to most state directors of special education. The 1995 NCEO survey noted that few state directors knew whether test scores for students with disabilities could be disaggregated from assessment databases. Even when the data were available, most states had not attempted to disaggregate data on students with disabilities.
This year, NCEO again asked for data on the participation of students with disabilities in state assessments. As in the 1997 report, state directors were asked to indicate whether the following kinds of data are available for one or more of their statewide assessments:
The responses of individual states are presented in Table 2.
Table 2. Primary Participation Data Available
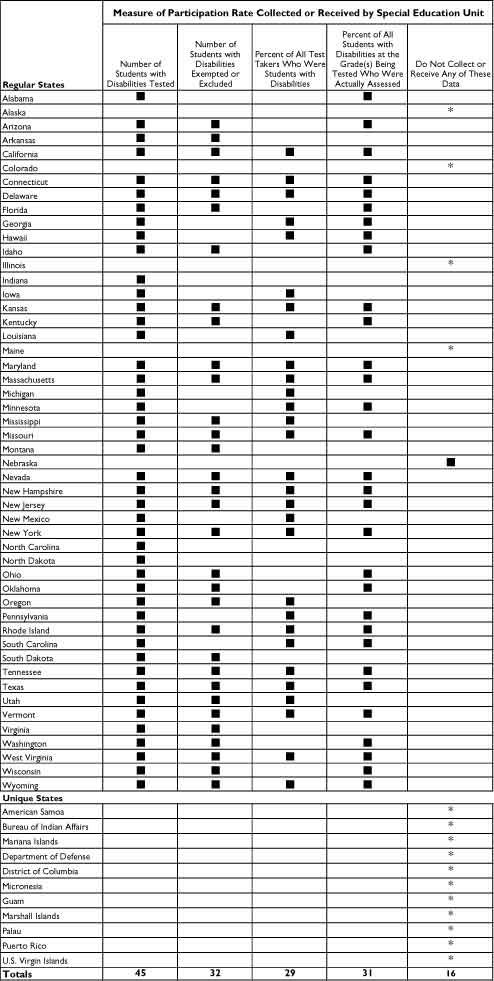
A total of 45 states indicated that they have data on the number of students with disabilities tested. This information is required by the 1997 amendments to IDEA. Five regular states and all unique states appeared not to have information on the number of students with disabilities tested. One of these states (Nebraska) does not administer statewide tests, so it would not be expected to have data on the number of students taking the state assessment. The four other regular states without an indication that they had participation data either had not responded to this item (Alaska, Colorado) or they had not responded to the survey (Illinois, Maine).
Several states also collect or receive participation data in other ways than simply the number tested. Approximately equal numbers of states, but not necessarily the same ones, have data on exemptions or exclusions, and percentage information.
Some students are recognized as having disabilities under another federal law—Section 504 of the Rehabilitation Act of 1973. Data on 504 students participating in testing and other types of participation data are available somewhat sporadically among the states (see Table 3). For example, data on how many 504 students participate in testing are available in just 18 states, and other kinds of participation data are available in 12 states. These other data include the number of students using testing accommodations.
Table 3: Other Participation Data and 504 Participation Data Available
| Regular States |
504 Plans |
Other Measures of Participation |
Description of Other Data |
| Alabama | n | n | "Other" not defined |
| Alaska* | |||
| Arizona | |||
| Arkansas | |||
| California | |||
| Colorado* | |||
| Connecticut | |||
| Delaware | |||
| Florida | n | n | "Other" not defined |
| Georgia | n | ||
| Hawaii | |||
| Idaho | |||
| Illinois* | |||
| Indiana | n | n | Number of students receiving accommodations |
| Iowa | |||
| Kansas | |||
| Kentucky | n | n | Types of accommodations, number testing with and without accommodations, number participating in alternate portfolio |
| Louisiana | n | ||
| Maine* | |||
| Maryland | n | n | Number of students/types of accommodations, number of students alternately assessed |
| Massachusetts | n | Pre-test files, post-test files, results | |
| Michigan | n |
Table 3: Other Participation Data and 504 Participation Data Available (continued)
| Regular States |
504 Plans |
Other Measures of Participation | Description of Other Data |
| Minnesota | n | ||
| Mississippi | |||
| Missouri | n | ||
| Montana | |||
| Nebraska | |||
| Nevada | n | ||
| New Hampshire | n | Number of students with limited English proficiency | |
| New Jersey | n | ||
| New Mexico | n | Number of special education test takers with and without modifications | |
| New York | n | Disaggregate results for students receiving consultant teacher, resource room, or related services, and results for students receiving special class services | |
| North Carolina* | |||
| North Dakota | n | ||
| Ohio | n | Information presented by 4-6-9-10-12 grades and by proficiency area | |
| Oklahoma | |||
| Oregon | |||
| Pennsylvania | |||
| Rhode Island | n | ||
| South Carolina | n | ||
| South Dakota | n | n | Number of students participating with accommodations |
| Tennessee | |||
| Texas | n | "Other" not defined | |
| Utah | |||
| Vermont | n | ||
| Virginia | |||
| Washington | |||
| West Virginia | |||
| Wisconsin | |||
| Wyoming | n | ||
| Unique States* | |||
| American Samoa | |||
| Bureau of Indian Affairs | |||
| Department of Defense | |||
| District of Columbia | |||
| Guam | |||
| Mariana Islands | |||
| Marshall Islands | |||
| Micronesia | |||
| Palau | |||
| Puerto Rico | |||
| U.S. Virgin Islands | |||
| Totals | 18 |
12 |
|
State directors also were asked how participation rates were calculated in their most recent statewide assessment. Of the 31 states whose directors had reported that the state calculated test participation rates for students receiving special education services, 10 indicated that the calculations were completed at the local level by having schools turn in all of their test forms, including those for students who were not tested. Participation is calculated by dividing the number of completed test forms by the total number of test forms (including those that are blank). Most of the remaining states (14 of 21) divide the number of test takers by the state/federal child count that is reported December 1. Other states gave answers that did not indicate which calculation method they used. States have found distinct advantages and disadvantages with each of these models, as shown in Table 4. Interestingly, a few additional states indicated how they would calculate these rates even though they had indicated they did not do so. These states were fairly evenly split between those using local counts and those using state/federal child count data.
Table 4. Advantages and Disadvantages of Counting Students Locally on Test Day Versus Using the Federal Child Count
Count students locally on test day |
Use federal child count |
|
| Advantages | Do not have to worry about inaccuracies resulting from time between enrollment count and test. | Numbers are used to determine state and federal funding, so underreporting is unlikely. |
| Disadvantages | Count may be inaccurate due to errors by local test administrators. Some students are unaccounted for – they are eligible for testing, but are not tested. |
Several months may pass between child count and test, leaving room for error due to students entering and leaving school system. Child count is generally reported by student age, not grade (tests are given by grade, not age). |
State directors reported encountering a variety of difficulties in the calculation of test participation rates of students receiving special education services. Only two state directors reported having no problems calculating these participation rates. Other states reported four primary challenges:
Each year, NCEO asks states to provide actual participation frequency data for the most recent assessment for which data are available. In the past, most states have been able to provide only estimates of the participation of students with disabilities in state assessments. In 1997, prior to the reauthorization of IDEA, 15 states provided actual participation numbers. In 1999, 23 states provided these data, but the states were not necessarily the same ones. The states providing participation data in 1999 are listed in Table 5, along with those states that provided data in 1997.
Table 5. States with Data on the Number of Students with Disabilities Participating in State Assessments
1997 |
1999 |
|
|
Although the federal requirement is for states to report the number of students with disabilities participating in state and district assessments, percentages are most useful for policymakers evaluating the inclusiveness of assessment programs. Using state-provided numbers of students participating in assessments and child count data, participation rates were calculated for specific administrations of state tests. These estimated rates are contained in Table 6. Rates of participation vary from less than one-fourth of students with disabilities to all students with disabilities.
Table 6. Percent of Students Receiving Special Education Services Who Participated in State Assessments*
|
|
|
|
|
|
|
|
|
|
|
|
|
|
|
|
|
|
|
|
|
|
|
|
|
|
|
|
|
|
|
|
|
|
|
|
|
|
|
|
|
|
|
|
|
|
|
|
|
|
|
|
|
|
|
|
|
|
|
|
|
|
|
|
Table 6. Percent of Students Receiving Special Education Services Who Participated in State Assessments* (continued)
|
|
|
|
|
|
|
|
|
|
|
|
|
|
|
|
|
|
|
|
|
|
|
|
|
|
|
|
|
|
|
|
|
|
|
|
|
|
|
|
|
|
|
|
|
|
|
|
|
|
|
|
|
||
|
|
|
|
|
*Repeat years of exit tests were not included in this table because of repeated testing opportunities.
Twelve states were able to report data on the number of students who used accommodations. These data, also calculated as percentages by NCEO, are provided in Table 7. Rates of use vary from less than one-fourth of students with disabilities to more than three-quarters. The variability in rates may be due, in part, to differences in definition and what kinds of accommodations are counted (e.g., some states count only modifications).
Table 7. Percent of Students Receiving Special Education Services Who Used Testing Accommodations
|
|
|
|
|
|
|
|
|
|
|
|
|
|
|
|
|
|
|
|
|
|
|
|
|
|
|
|
|
|
|
|
|
|
|
|
|
|
|
|
|
|
|
|
|
|
|
|
|
|
|
|
|
|
|
|
|
|
|
|
|
|
|
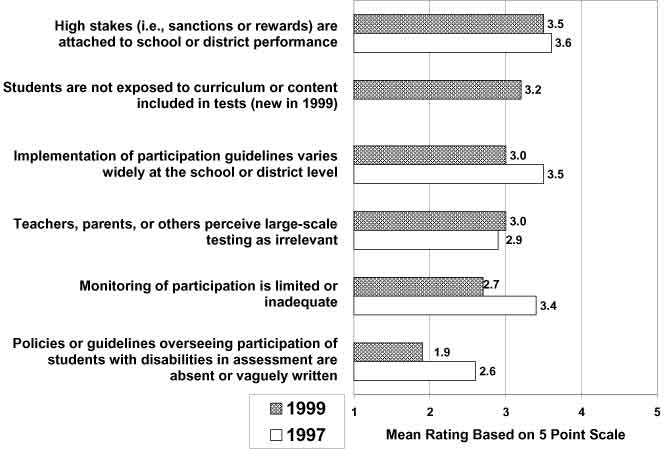
There are several factors that state directors of special education believe may work against the full participation of students with disabilities in large-scale assessment programs, especially in states where accountability systems have significant consequences for students or schools (see Figure 2). Most of the factors reported in 1999 inhibit participation to a somewhat lesser degree than they did in 1997. High stakes (i.e., sanctions or rewards) attached to school or district performance remains the greatest source of discouragement. A new item in 1999, focusing on exposure to the curriculum or content included in tests, is perceived to inhibit participation to a high degree and will be important to continue to track in future years. The perception of teachers, parents, and others that large-scale testing is irrelevant to the educational success of students with disabilities also remains a significant barrier. Implementation of participation guidelines varies widely at the school or district level, but less than in 1997. The least inhibiting factor this year is "policies or guidelines overseeing participation of students with disabilities in assessment are absent or vaguely written." The decreases in ratings for both the monitoring and policies/guidelines items reflect substantial changes from 1997.
Figure 2. Factors Discouraging Participation of Students with Disabilities in State Assessment Programs
State Activities in Developing Alternate Assessments
Alternate assessments provide a mechanism for students who cannot participate in state and district-wide assessments, even with accommodations, to be included in state and district accountability systems. In 1997, NCEO began to assess the status of states in the development of alternate assessments using an on-line survey. This provided all states with continuous, up-to-date information on what other states are doing in the development of their alternate assessments. The data reported in Tables 8-10 were compiled from state responses to the Alternate Assessment On-line Survey in October, 1999. At this time, 43 regular states and three unique states had completed the survey. The date is important to note, since states are continually working on their alternate assessments and updating the information in the survey.
Nearly half of the states report using the same standards for alternate assessments as they use in general education assessments, or some variation of them, such as expanded standards (see Table 8). Other states are developing different standards for students participating in alternate assessments, or are still uncertain about what standards they will use.
Table 8. Alternate Assessment Standards
Alternate Assessment Standards |
Regular States |
Unique States |
| Identical to those applied to general education | 6 | 0 |
| General education standards with some additions | 1 | 0 |
| Subset of those applied to general education | 14 | 2 |
| Independently developed for students needing alternate assessments | 8 | 0 |
| Uncertain at this time | 14 | 1 |
*Includes the responses of 43 regular states and 3 unique states have responded to the Alternate Assessment Survey, as of October, 1999.
Table 9 shows the status of states in various aspects of the development of their alternate assessments. Most states are continuing to work on identifying standards, establishing eligibility guidelines, and creating assessment tools or systems.
Table 9. States Engaged in Various Alternate Assessment Activities
State Activity |
Regular States |
Unique States |
| Identifying standards | 34 | 0 |
| Establishing eligibility guidelines | 36 | 1 |
| Identifying/creating instrument | 32 | 1 |
| Training on alternate assessment | 12 | 0 |
| Establishing proficiency levels | 22 | 0 |
| Determining reporting procedures | 23 | 0 |
| Determining inclusion in high stakes | 18 | 0 |
*Includes the responses of 43 regular states and 3 unique states have responded to the Alternate Assessment Survey, as of October, 1999.
Several states now have selected the data collection methods that they are using for their alternate assessments (see Table 10). Most states have decided to use observations, portfolios, or performance assessments. However, many states have not yet selected their alternate assessment approach.
Table 10. Alternate Assessment Approaches Selected and Considered by States
State Activity |
Regular States |
Unique States |
| Observation (direct, video, or other) | 8 | 0 |
| Student portfolio | 4 | 0 |
| Performance assessment | 4 | 0 |
| Survey (mail or other) or Interview | 3 | 0 |
| Review of progress | 3 | 0 |
| Adapted regular state assessment | 3 | 0 |
| Adaptive behavior scale | 2 | 0 |
*Includes the responses of 43 regular states and 3 unique states have responded to the Alternate Assessment Survey, as of October, 1999.
Only 29 state directors were able to give a number when asked to estimate the percent of students in their states whose exposure to the content covered on statewide assessments was so limited that it made little sense to give them the regular assessment for their age or grade level (see Table 11). Some estimated the percentage of students with disabilities while others estimated the percentage of all students. The distinction between the two percentages still seems to be confusing to states. Some states were able to base their estimation on actual participation data, while others were making educated guesses. Eight states reported that they are not able to estimate this percentage yet, but will have better information once their alternate assessments are in place. State provided estimates varied considerably, with as many states estimating more than 4% (and some of these as high as 9%) as estimated one percent or less.
Table 11. Estimated Percentages of All Students Whose Exposure to Content is Too Limited for Them to Participate in Regular Assessment
< 1 – 1% |
> 1 – 2% |
> 2 – 4% |
> 4% |
|
|
|
|
*State provided percentage of students with disabilities was transformed to a percentage of all students using the special education rate.
When asked to estimate how many students per grade level are expected to participate in alternate assessments, for both the current school year (1999-2000) during which alternate assessments are not required by law, and the upcoming school year (2000-01), when alternate assessments are required, state directors sometimes responded with percentages of all students rather than just students with disabilities. Most states estimated that percentages would stay the same, but some foresaw decreases and others increases (see Table 12).
Table 12. Estimated Changes in Alternate Assessment Participation from 1999-2000 to 2000-2001*
| Decrease | Same | Increase |
|
|
|
*Only 15 states were able to make projections for both years.
Most states are in the process of developing their alternate assessments. Expected participation rates of all students unable to participate in regular assessments varies considerably in the 29 states ready to make predictions, implying that there will also be large variations in alternate assessment participation rates.
Reporting and Using Assessment Results
Performance of students with disabilities on regular assessments now must be disaggregated from the scores of other students and reported in the same way as the performance of other students is reported. In 1999, all directors with statewide assessments indicated that scores of test-takers receiving special education services were disaggregated. In 1997, 22 states did not disaggregate scores. Reasons for disaggregating data are primarily to conduct separate analyses or report the results. Still, 11 states indicated they are removing the scores of students with disabilities from further analyses (see Figure 3). Removing scores was the only reason cited by four states (Connecticut, Hawaii, Iowa, and Nebraska).
Figure 3. Reasons for Disaggregating Performance Data
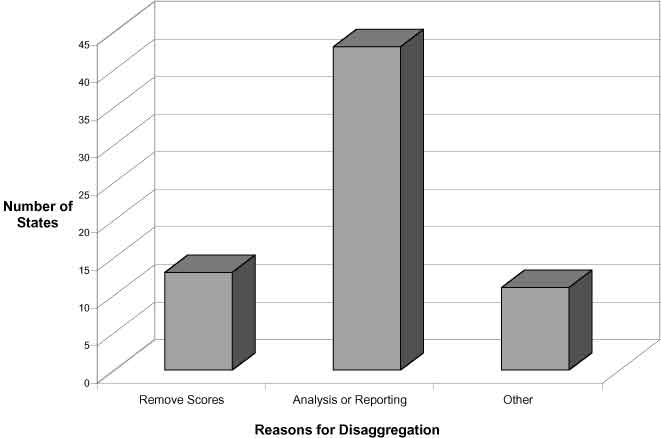
Table 13 shows the ways in which results are reported in the 41 states that separate scores for analysis or reporting. Most states are publicly reporting on the performance of students with disabilities.
Table 13. Ways in Which Results of Separate Analyses of Students with Disabilities are Reported
|
|
|
|
|
|
|
|||
|
|
|
||
|
|
|
||
|
|
|||
|
|
|
||
|
|
|
|
|
|
|
|
||
|
|
|
|
|
|
|
|
||
|
|
|||
|
|
|
||
|
|
|
|
|
|
|
|
|
|
|
|
|
|
|
|
|
|
|
|
|
|
|
|
|
|
|
|
||
|
|
|
|
|
|
|
|
|
|
|
|
|
||
|
|
|
|
|
|
|
|
||
|
|
|
|
|
|
|
|||
|
|
|
|
|
|
|
|
||
|
|
|
|
|
|
|
|
|
|
|
|
|
|
|
|
|
|||
|
|
|
|
|
|
|
|
||
|
|
|||
|
|
|
|
|
|
|
|
||
|
|
|||
|
|
|
|
|
|
|
|||
|
|
|||
|
|
|
|
|
|
|
|
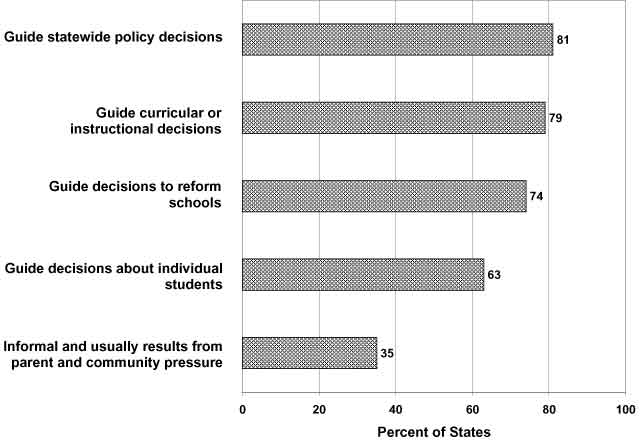
About three fourths of the state directors use test results for at least three distinct purposes, including guiding statewide policy decisions, curricular or instructional decisions, and decisions to reform schools (see Figure 4). Over half use them to guide decisions about individual students. About one-third of the directors indicated that the use of test results is informal and usually results from parent and community pressure.
Figure 4. Uses of Test Results Across States
Individualized Education Programs and Assessments
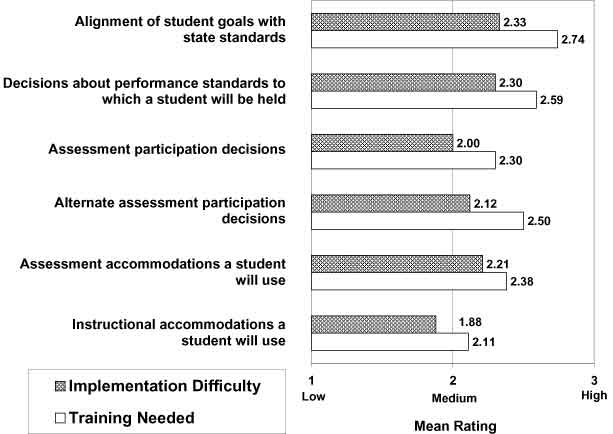
The 1997 reauthorization of the Individuals with Disabilities Education Act will likely lead to fundamental changes in how Individualized Education Programs (IEPs) are written, implemented, and evaluated. Two areas of greatest difficulty and need for training are alignment of student goals with state standards, and decisions about the performance standards to which students with disabilities will be held (see Figure 5). State directors reported having the least difficulty and lowest training needs in determining the instructional accommodations students will use.
States have used several strategies to meet the assessment provisions of IDEA. The approach used by the greatest number of states is training (70% of states), followed by the development and dissemination of written policies (44% of states). These approaches and others identified by states are summarized in Appendix A for those states that responded.
Figure 5. IEPs and Assessment - Areas of Difficulty and Need for Training
Standards-based Reform
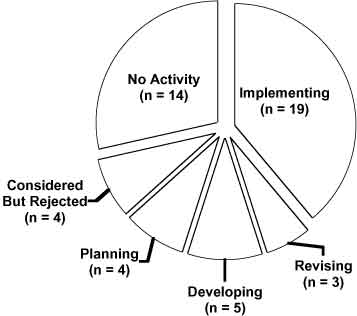
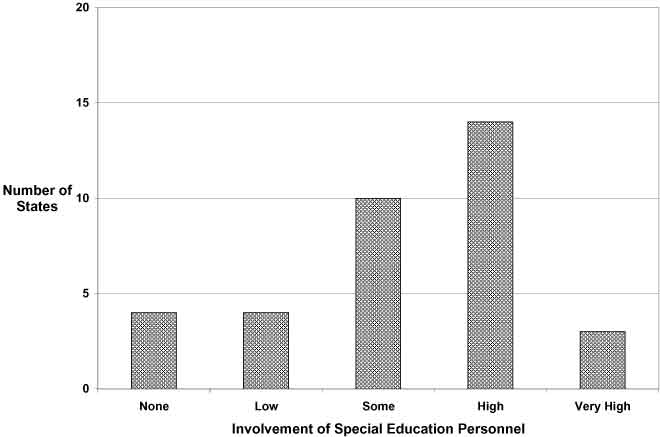
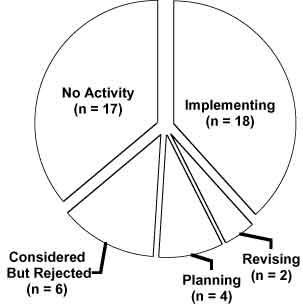
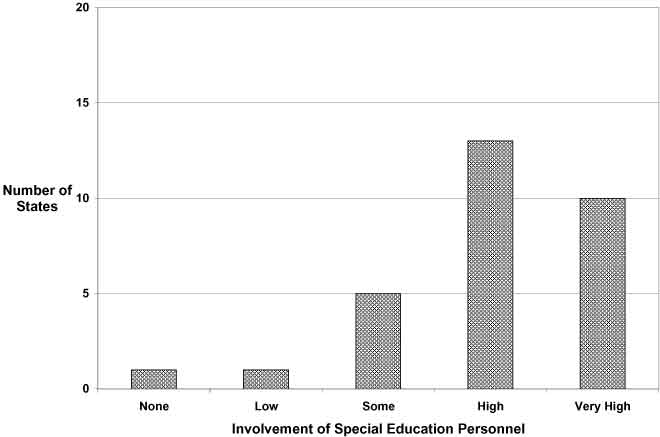
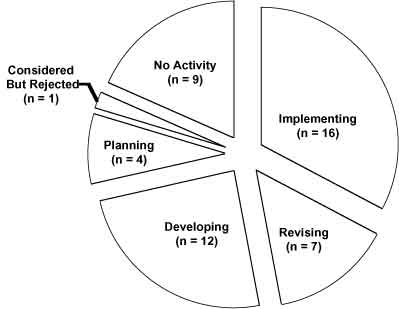
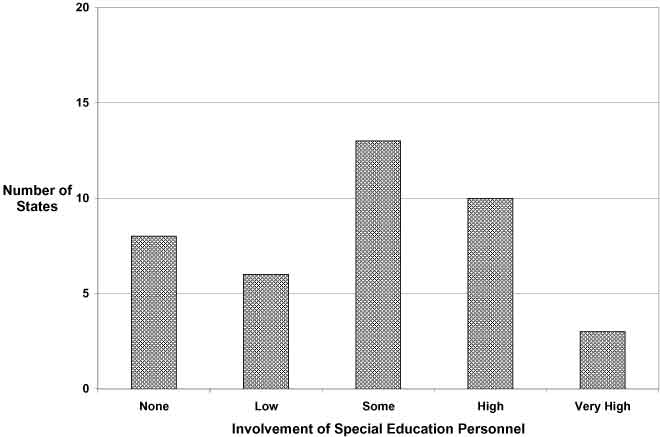
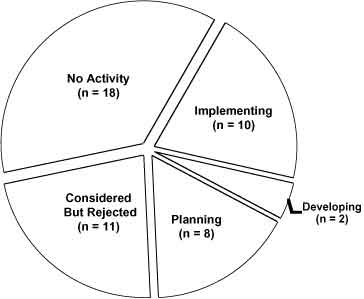
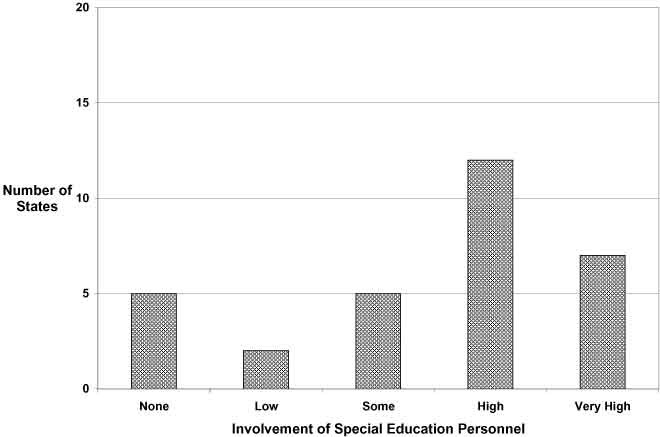
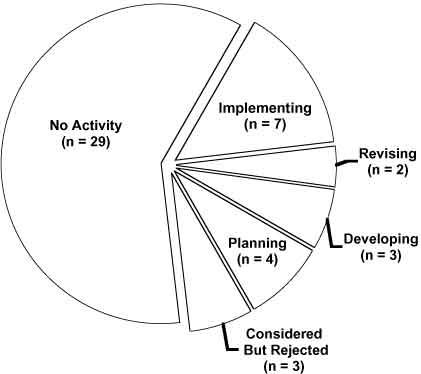
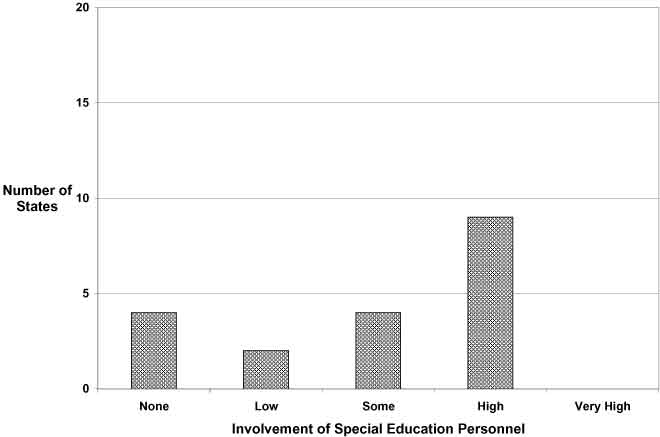
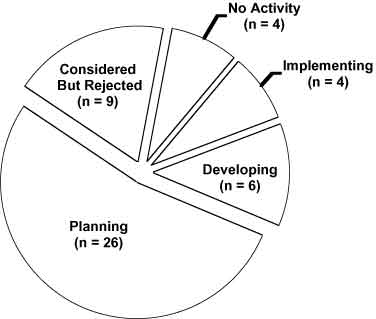
The charts in Figure 6 summarize the current status of states with respect to several standards-based reform practices. For those states with some activity underway, the figure also shows the involvement of state special education personnel.
Passing an exit exam for graduation from high school is required by 19 states, with another 9 states either developing or planning an exit exam. In nearly half of the 35 states with some activity, special educators have high to very high involvement.
Eighteen states allow IEP teams to change graduation requirements for individual students. Another four are planning to do so. Three-quarters of the 30 states with some activity have high to very high involvement of special educators.
Rewards or sanctions for schools or districts based on accountability results is a practice currently being implemented by 16 states; 12 additional states are developing rewards and sanctions practices, and 4 are planning. Most state special education personnel have some or high involvement.
Out-of-level testing is implemented by 10 states, with development or planning taking place in 10 states. High involvement with this issue was the most frequent response of special educators.
Only 7 states are implementing end-of-course testing, but another 7 are either in development or planning stages. Involvement of special education personnel is varied, yet almost half of the states with some activity indicate high involvement.
Only 4 states are aggregating results of their alternate assessment with the results of the general assessment. Most states are in the planning stage. Involvement of special education personnel in states with some activity in this area is primarily high to very high.
Clearly, special education personnel are most highly involved in practices that are most directly related to students with disabilities, especially aggregating results of alternate assessments with general assessment results and allowing IEP teams to change graduation requirements for individual students. Practices relating to all students, or those where the inclusion of students with disabilities might be seen as detrimental, such as determining rewards or sanctions for schools based on accountability results, have the least involvement of special education personnel. Comments by individual states about their activities across each of these practices can be found in Appendix B.
Figure 6. Level of State Activity and Involvement of State Special Education Personnel in Standards-based Reform
Exit exams required for graduation
Allowing IEP teams to change graduation requirements for individual students
Rewards or sanctions for schools or districts based on accountability results
Out-of-level testing for large-scale accountability systems
End-of-course testing as a measure of accountability
Aggregating results of alternate assessment with general assessment results

Current Issues and Technical Assistance Needs
According to state directors, the factor presenting the greatest barrier to obtaining educational accountability information on students with disabilities is lack of resources (see Table 14). The adequacy of assessments for use with all students is also seen as a significant barrier. The fewest barriers are attributed to cooperation between general and special education and concerns or resistance by state agency personnel.
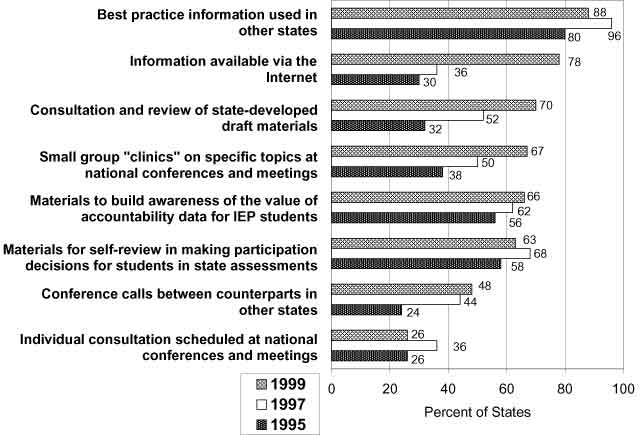
Technical assistance needs reflect the issues states are facing. Figure 7 illustrates the change in preferred forms of technical assistance since 1995. While access to best practice information continues to be rated high, information available via the Internet has soared in 1999 to a level nearly as high as best practice information.
Table 14. Factors Presenting Barriers to the Development, Implementation and Reporting of Educational Accountability Information on Students Receiving Special Education Services
| Ratings of Barriers (Number of States) | |||||
Factors |
None |
Minimum |
Moderate |
Major |
Mean Rating* |
| Lack of resources | 0 |
16 |
18 |
14 |
1.96 |
| Adequacy of assessments for all students | 0 |
16 |
20 |
11 |
1.89 |
| Concerns or resistance by local school personnel | 0 |
13 |
29 |
5 |
1.83 |
| Policies or practices regarding test accommodations | 2 |
21 |
18 |
7 |
1.63 |
| Policies or practices regarding participation | 5 |
19 |
14 |
7 |
1.51 |
| Appropriateness of standards for all students | 5 |
20 |
14 |
8 |
1.50 |
| Availability of data on who is excluded from assessment | 8 |
20 |
10 |
9 |
1.43 |
| Lack of technical expertise | 7 |
20 |
17 |
3 |
1.34 |
| Concerns or resistance by parents and community members | 4 |
28 |
9 |
5 |
1.33 |
| Availability of data on who receives accommodations | 10 |
17 |
11 |
6 |
1.30 |
| Lack of cooperation between general and special education | 8 |
22 |
15 |
1 |
1.20 |
| Concerns or resistance by state agency personnel | 13 |
26 |
7 |
1 |
.91 |
* For the mean rating, none = 0, minimum = 1, moderate = 2, major = 3.
Figure 7. Technical Assistance Needs of State Directors
|
Response |
|
Training |
|
Written policies; linking IEP goals/objectives to curriculum frameworks of state; refining data collection and reporting procedures with test producers; training; monitoring practices. |
|
Development of new monitoring procedures and presentations at regional meetings and conferences. |
|
Training materials; trainer of trainers; conferences; parent center involvement; listserv, teleTA, & Web site. |
|
Since implementation is not required until July 2000 no training, monitoring have been conducted. Policies in development. |
|
Stakeholder groups, informing all parties regularly (SBE, parents, teachers, administrators), providing written guidelines and training. |
|
Training at local levels, written policies from state level; monitoring practices (just beginning); providing inclusion rate reports to districts (has heightened awareness and made folks pay attention to what's reported!). |
|
Working with NCEO personnel, SCASS group, training and working with parents. |
|
Ongoing professional development. |
|
Written policies, large group training, small workshops, 1:1 TA, monitoring, district accountability. |
|
Training and written policies. |
|
Since everything is so new, the development of training packages is delayed because the development of written policies takes place. Staff development, that results in an understanding of the requirements, and what is right for students, teachers, and parents. |
|
Written policies, training, professional development, technical assistance, and monitoring. |
|
Training & task force discussions. |
|
Regional training - Addendum to the IEP, direct mailing of guidelines. Contractor forcing us to stay focused to get our $ worth. |
|
Continuous training of LEA's, teachers, and parents. Intense training of IHEs. |
|
Written accommodations guidelines; training for special education and general education together; participation decision-making tool available on the Internet. |
|
Training, monitoring practices, written policies. |
|
Written policies and guidelines, Intense training, Follow up. |
|
Alternate assessments based on rating the students’ performance directly with the state's standards. |
|
Training. |
|
Training and written policies. |
|
Written policies, training, technical assistance documents. |
|
Written policies, training, monitoring practices. |
|
1. Joint training activities by our Office of Special Education Programs and Office of Assessment accompanied by written guidelines. 2. Presentations for various constituencies with opportunities to solicit their input. 3. Participation of special educators. |
|
Working closely with our Assessment and Evaluation Unit staff. Providing written guidance to the field from the Superintendent. |
|
We have issued policy guidelines and provided some training. More training is needed, and more user-friendly guidelines for making participation and accommodations decisions are needed. We're working on these this year. |
|
Public reporting of results, monitoring and training based on data, and written policies. |
|
Training. |
|
Written policies, training, monitoring practices. |
|
Training, monitoring practices, written policies. |
|
Training, monitoring practices, written policies. |
|
In-service training and technical assistance guides. |
|
Training, written policies. |
Appendix A. Approaches States Have Found Most Helpful in Meeting the Assessment Provisions of IDEA (continued)
|
Response |
|
Written policies; coordination between the various state and regional divisions of the Texas Education Agency; training; monitoring practices; website; statewide steering committee with parents, professional educators, advocates, and state student accountability division. |
|
Training of special education, general education, and testing staff in local districts has been very helpful. Written guidelines with decision-making strategies for IEP teams and feedback to district regarding their performance have also been helpful. |
|
Training and consulting with experts in the field. |
|
Collaboration with the Office of Assessment within the WVDE for policy development, training, monitoring. Also, participation in conferences and Spec Ed SCASS, especially helpful with alternate assessment, and assistance from Mid-South RRC. |
|
Access to information on our web page www.k12.wy.us. |
|
Professional development, guided dialogue, and written procedures. |
Exit exams required for graduation
|
|
State’s Level of Activity |
Special Education’s Involvement |
Description of Activity |
|
Implementation |
High |
Implementation of current exam and in revision for new exam. Giving EE and developing a new exam on new content. Note: Special Educators (SDE & LEA) used on all committees. |
|
Considered but Rejected |
High |
Arkansas had this required but has since eliminated it. |
|
Implementation |
High |
Our graduation test will be implemented next year (2000). |
|
Low |
High school exit exams were mandated early in 1999. | |
|
Implementation |
Some |
Administration of 10th grade DSTP in Spring of 2000 will count for High School Diploma. |
|
Implementation |
Very High |
Currently have a minimum skills test for graduation and are transitioning to an on level graduation test (FCAT) in 2003. |
|
Planning |
Some |
Expected to be implemented in 2005. |
|
No Activity |
---- |
Local decision. |
|
In Revision |
Some |
For the past ten years Louisiana has provided students with graduate exit exams; currently test exams are under revision. |
|
Planning |
High |
Under Education Reform requirement for graduation is passing MCAS tests. |
|
Implementation |
High |
Students with IEPs can pass the exit exam at an "individual" level (lower score or modified test) and still receive a regular high school diploma. |
|
Planning |
Some |
This is being discussed in our state. |
|
Implementation |
High |
All students must pass our High School Proficiency Assessment to receive a diploma except those who are exempt on their IEPs. Students may also pass an alternative test, the Special Review Assessment, which measures the same proficiencies as the HSPA. |
|
Implementation |
Low |
High School Competency Exam in grade 10, passing rates of 90% or higher are typical. |
|
Implementation |
High |
Regents’ exams are exit exams and are requirements for graduation. Students with disabilities may meet lower standards during the period the State is phasing in new higher standards for all students. |
|
Implementation |
High |
Students must pass high school proficiency test in order to receive a diploma. |
|
Considered but Rejected |
None |
Legislation does not require exit exams, but requires passing end of course tests before graduation. |
|
Implementation |
Our school reform system is in place at this time. | |
|
In Revision |
High |
In transition from competency tests to high stakes EOC tests. |
|
Implementation |
Very High |
Students with disabilities must take the Exit Exam for graduation when the IEP Committee has determined it is an appropriate test, considering the effects of the student’s disability, the instructional content required in the IEP for FAPE, and the student’s requirements for accommodations in test administration. |
|
Development |
High |
To be implemented in 2003. Testing will begin in 10th grade. Students who pass receive regular diploma. Students can retake test until it is passed. Test has yet to be developed. |
IEP teams allowed to change graduation requirements for individual students
|
|
State’s Level of Activity |
Special Education’s Involvement |
Description of Activity |
|
Implementation |
High |
IEP teams may determine the level at which the graduation test will be given to students with IEP. |
|
Planning |
High |
Policies are under development for use with new promotion standards and the high school exit exam. |
|
No Activity |
Some |
The decision is made by the district only; the state only guides. |
|
Implementation |
Very High |
Has been in place for years. IEP team may determine that a requirement is not appropriate for a student or determine what coursework will satisfy the requirement. |
|
Planning |
High |
Very preliminary discussions. |
|
No Activity |
Very High |
We have a special diploma option that is determined by the IEP but it is not Considered but Rejected a diploma (standard) Students with disabilities always have the right and opportunity to pursue a standard diploma by meeting the same requirements as other students. |
|
No Activity |
Very High |
We will need to consider this when the state sets graduation requirements. |
|
Implementation |
Very High |
Students with IEPs can have individualized graduation requirements and still get a regular diploma. |
|
Implementation |
Very High |
High school diplomas can be issued based upon completion of IEP goals and objectives. |
|
No Activity |
Low |
IEP teams determine exiting goals and objectives, requirements for a standard diploma are established by the State Board of Education. |
|
Implementation |
Schools across the state have been practicing this for years. | |
|
Implementation |
IEP teams must include graduation requirements in the IEP. Students who meet modified graduation requirements as stated in the IEP receive the same state endorsed diploma as those nondisabled students who meet all mandated graduation requirements. | |
|
Implementation |
High |
Recent revision of state regulations specifies how the team should operate. |
|
Implementation |
Very High |
In Nevada, a student who has a disability can earn an "adjusted" diploma based upon completion of program outlined in IEP. IEP teams cannot change regular diploma graduation requirements for individual students. |
|
Implementation |
High |
All students must meet same standards, however there is a safety net that applies to students with disabilities and Section 504 students, allowing such students to meet lower graduation requirements. This is work in progress. |
|
In Revision |
Some |
Current legislation does not mention students on IEPs and has no provision for changing course requirements for graduation. |
|
Considered but Rejected |
High |
State law does not allow. |
|
Implementation |
Very High |
IEP teams may not change graduation requirements set in state law and policy. However, there are various plans for achieving graduation for students in the general curriculum, and three additional options for SWD. The IEP team is required to identify, plan, and provide the student the appropriate rout to graduation. |
|
Implementation |
Very High |
IEP teams determine graduation requirements including participation in test required for graduation. |
|
Implementation |
Very High |
Allow IEP teams to develop multi-year plans. Plans must be endorsed by the school superintendent or designee. |
|
---- |
---- |
Unsure at this time. |
|
Implementation |
Very High |
IEP teams can determine if student is working toward a regular or modified diploma. These criteria are defined in state board policy. |
|
In Revision |
State has developed a task force to study this issue. |
Rewards or sanctions for schools or districts based on accountability results
|
State’s Level of Activity |
Special Education’s Involvement |
Description of Activity |
|
Implementation |
Some |
At-risk funding for low achievers. Schools/LEAs placed on Alert, Caution, clear lists with consequences. |
|
Planning |
Low |
There was legislation proposed to require the State Board to do this. |
|
Development |
Some |
An Academic Performance Index is under development. |
|
Development |
None |
Awaiting board decision on accreditation rules. |
|
Implementation |
None |
Funding formula provides additional dollars to low performing schools in an effort to bring them up. |
|
Development |
Some |
Accountability Task Force is making those decisions currently. |
|
Implementation |
High |
Two years of test results are used to define all schools on achievement levels 1 through 5. Vouchers are allowed for schools at level 1. Currently only students with speech and language impairments are included in this calculation. |
|
Planning |
Low |
State is just beginning to consider. |
|
Considered but Rejected |
Low |
The results of students on the Kansas State Assessments, is a part of the accreditation process for schools. |
|
In Revision |
High |
State accountability regulations have been revised to determine a new method for determining school accountability rewards and sanctions. |
|
Implementation |
High |
This is the first year for school accountability. |
|
Development |
Some |
Plan to identify under performing schools. |
|
Implementation |
Very High |
Both rewards and sanctions are applied for MSPAP. Student Diploma or non-diploma for Functional Test. |
|
Implementation |
High |
Requirement is in state law. Rules are being developed. |
|
In Revision |
High |
Current proposal: districts must have an 85% passing rate on statewide assessments or show year to year improvement to pass state monitoring. For special education students, we are planning to look at participation rates and performance. |
|
In Revision |
Low |
Not ranking but rating schools on five factors: achievement; attendance; dropouts; parent/community involvement; and safety. |
|
Implementation |
Some |
Since 1997, the Nevada Education Reform Act has used results from Terra Nova Testing to evaluate school-level accountability, with various consequences being attached to the results. |
|
Implementation |
High |
Local Assistance Plans must be prepare by school districts for low performing schools. Lowest performing schools are subject to registration review and eventual closure or re-design if they do not improve. Our accountability system is currently under revision. |
|
Implementation |
Some |
State intervention will be required for some district performing poorly. |
|
Development |
Low |
State legislation regarding district effectiveness. |
|
Development |
Some |
Value added rewards and sanctions being developed. |
|
Implementation |
Some |
TX does include consideration of student performance, including SWD, on the state accountability test in the rating system for rewarding or sanctioning districts. |
|
Development |
Some |
New state legislation passed in 1999 session is requiring state office to further develop accountability system for implementation in 2003. |
|
Development |
Very High |
AYP system based on growth factors under development. |
|
Development |
Some |
The Board has held public hearings on what policy should be. |
|
Implementation |
High |
Wisconsin's criteria for identifying schools "in need of improvement" have been in place for several years. Until recently, this criteria was based on the percentage of students achieving in the top two of the state's four proficiency levels. |
|
Implementation |
Some |
Current rewards or sanctions do not specifically address students with disabilities - their results are aggregated into school totals if they took the assessment under standard conditions. |
Out-of-level testing for large-scale accountability systems
|
|
State’s Level of Activity |
Special Education’s Involvement |
Description of Activity |
|
Implementation |
High |
For both our NRT and standards-based assessment systems, as per State Board decision. |
|
Implementation |
Low |
There is discussion on resolving inequitable reporting practices for out-of-level testing. |
|
Implementation |
Very High |
CT has allowed out-of-level testing for about 10 years. |
|
---- |
High |
Data to support or refute the need is currently being collected. |
|
Planning |
None |
Planning is too strong, we are considering and have not rejected the idea. |
|
Implementation |
Some |
Out-of-level Testing guidelines for CTBS followed. |
|
Considered but Rejected |
High |
We allow school districts to define "age appropriate" when making decisions regarding when students are to be tested. |
|
Considered but Rejected |
Some |
State will revisit this issue for possible consideration in the next few months. |
|
Development |
High |
1999-2000 is to be the first year of implementation. |
|
Considered by Rejected |
Very High |
Accommodations committee rejected due to validity issues. |
|
Development |
Very High |
The current accountability assessment, TAAS, does not permit out-of-level testing. This is the major reason students with disabilities are exempt. Texas is developing an alternate test of students’ progress in the state’s general curriculum for students with disabilities who are taught in the curriculum but for whom the TAAS is not an appropriate test. |
|
Implementation |
Very High |
Out-of-level testing is an option on the end-of-course, end-of-level tests only. |
|
Implementation |
Very High |
Out-of-level tests may be requested. Use must be approved by Dept. of Ed. on a case-by-case basis. |
|
Implementation |
Very High |
Currently, students cannot only be tested one grade level below placement; this is a modification and nonstandard administration. |
End-of-course testing as a measure of accountability
|
|
State’s Level of Activity |
Special Education’s Involvement |
Description of Activity |
|
In Revision |
High |
All grades except 11th which is in "Development." |
|
Considered but Rejected |
None |
California's Golden State Exam program is not used for accountability purposes. |
|
Planning |
Some |
Assessment for State standards is in the planning phase. |
|
Development |
High |
Developing for High school. Field-testing in 1999-2000 school year. |
|
Implementation |
High |
NY uses 11th grade competency status to make accountability determinations for high schools. We are moving to a system of cohort analysis. The performance of students with disabilities is included (aggregated) in such determinations. Also, spec. ed. Quality Assurance (monitoring) procedures heavily emphasize student perf. data, including participation and performance in state assessments. |
|
Planning |
None |
Recent legislation requires end of course tests. Beginning the planning and development of these tests. |
|
Development |
High |
EOC tests in development—special ed. has concerns with obtaining regular education diploma. |
|
Implementation |
High |
Students with disabilities who take the course with no content modifications are included in the assessments. |
|
Implementation |
High |
End of level tests for k-6 in language arts, math and science. Math and science for some courses grades 7-12. By 2003, Language Arts and Math will be developed for all grades and courses K-12. |
|
Development |
Low |
Currently looking at end-of-course test for Algebra I only. |
Aggregating results of alternate assessment with general assessment results
|
|
State’s Level of Activity |
Special Education’s Involvement |
Description of activity |
|
Implementation |
Low |
Aggregation is automatic for students who participate. |
|
Planning |
Very High |
Pilot studies are underway to review reliability and audit teacher decision-making. Multiple means of alternate assessment are currently being used. Planning in this area continues. |
|
Implementation |
Very High |
Reports include the results of alternate assessment in the aggregate as an equal weight as non-disabled students. |
|
Implementation |
Very High |
Scores appear identical and will be aggregated and disaggregated. |
|
Considered but Rejected |
High |
At this time we do not plan to aggregate the results with the MAP assessments. We will use the MAP-Alternate results somehow in the accountability system. Not sure how we will do that yet. |
|
Planning |
Some |
Task Force reviewing this issue. |
|
Considered but Rejected |
High |
We will not aggregate results from these very different measures. |
|
Planning |
Very High |
There is discussion of how these results will be reported after July 1, 2000. |
|
Development |
Very High |
Alternate assessment developed to mirror reporting language of statewide assessment. |
|
Planning |
High |
Texas is studying valid methodology and statistical design to address this issue. |
|
Considered but Rejected |
Very High |
AA results are not expected to be compatible with results of general state assessments and therefore cannot be aggregated. Still in development so no firm decision has been made. |
|
Planning |
Very High |
Developing a system. |
|
Implementation |
High |
Students who participate in alternate assessment will be reported in a fifth proficiency level beginning with the 1999-2000 school year. |
|
Planning |
High |
Examining reporting alternate assessment results across 4 performance levels - not percentiles. |
|
Considered but Rejected |
For reporting purposes the State does not aggregate due to statistical reasons. For accountability purposes alternate assessment will count. |
Other areas of reform
|
|
State’s Level of Activity |
Special Education’s Involvement |
Description of Activity |
|
Development |
Some |
New Outcome Based Licensure System |
|
---- |
---- |
(1) Each district will develop a contract specifying how all students will meet standards. (2) The report form will include alternate assessment results—not aggregated. (3) The state will also try to look at "Safe & Civil Learning Environment" as an accreditation indicator. |
|
Planning |
Very High |
School Achievement level determination for special schools (juvenile justice facilities, special center schools; alternative schools): Addressing accountability for special schools and investigating accountability for special education in multiple ways—not just through test scores. |
|
Development |
Very High |
Accountability for demonstrating progress toward Special Education Performance Goals and Indicators: Includes: Decreasing dropout rates, increasing graduation rates, participation of all students in district and statewide assessments, improving academic skills of students in special education, improving post-school outcomes for special education student. |
|
Planning |
High |
Alternate graduation options: Discussing is more like it - we have not reached the planning stage yet. |
|
Planning |
Some |
We are still trying to establish a single system based on cohort groups in schools. |
|
Implementation |
Very High |
Special accommodations for students in special education. Training on-going. |
|
Development |
Low |
Stanford 9 will be increased to include grade 3 by 2003. |