Overview
The main tenet of the standards movement, according to the National Association of State Boards of Education, is that “Schools, districts and state departments of education, along with students and families, are responsible for developing high levels of knowledge and skills in all students” (NASBE, 2002, p. 7). In the past, some groups of students have been left out of educational reform movements because of barriers to high achievement. These might include a perception that English language learners (ELLs)1 and students with disabilities were not capable of challenging academic content, for example, and inequitable funding in urban schools with high concentrations of minority and low-income students (NASBE, 2002). The No Child Left Behind Act of 2001 (NCLB) made it clear that states, districts, and schools are to hold high expectations for all students and work to improve outcomes for low performing groups. A central part of these mandated improvement efforts is using data to identify groups of students who are achieving poorly on statewide tests and find ways to improve instruction for the students so that they might achieve at higher rates in the future.
NCLB requires that accountability data be disaggregated and reported for some specific subgroups of students. According to Thurlow and Liu (2001), one group for which NCLB does not clearly mandate the public reporting of assessment data is students who are limited English proficient and also have disabilities. Students who are not tested, and students who are tested but whose data are not publicly reported, tend to remain invisible inside our educational system (Thurlow & Liu, 2001). Therefore, it is important for students with limited English proficiency and disabilities, a rapidly growing group2, to be represented in discussions of standards-based assessment results.
At the present time, fewer than 10 states report large-scale assessment participation or performance data on students with limited English proficiency and disabilities (Albus, Thurlow, Minnema & Anderson, 2004). This report is part of a series aimed at providing an in depth look at one state’s data on the participation and performance of students with limited English proficiency and disabilities in assessments mandated by NCLB. A previous report (Liu, Barrera, Thurlow & Shyyan, 2005) examined data from the 1999–2000 administration of a state graduation test. This report adds to those data with results from the 2000–2001 administration of the graduation test.
1 Students with limited English proficiency are
increasingly referred to as English language learners or ELLs. We recognize that
a number of terms are used in the field related to learners of English as a new
or second language. We have adopted some of those terms for reference, but have
chosen to use language and acronyms compliant with “person first” protocol and
to minimize lengthy terms where possible. In this document we use the term
“students with limited English proficiency.”
2 Zehler, Fleischman, Hopstock, Pendzick and Stephenson (2003) have
documented that English language learners with disabilities represent
approximately 9% of all ELLs in public schools. Because the total number of ELLs
is growing rapidly, it is logical to assume that the number of ELLs with
disabilities is also growing.
Background
In Minnesota, Basic Standards Tests (BSTs) are assessments that students must pass to receive a high school diploma. Assessments for the diploma are administered in reading and mathematics for the first time in 8th grade and in writing for the first time in grade 10. In each content area, students must achieve a scale score of 600 or higher by the 12th grade in order to receive a diploma. Tests may be re-taken several times if the students do not meet the passing scale score.
In addition to their use as graduation requirement assessments, BSTs are also used as school accountability measures. Thus, the grade 8 reading and mathematics scores and the grade 10 writing scores were school accountability measures. During the 2000–2001 school year, additional components of the Basic Standards Tests at other grades were in the process of being implemented. This report examines only the participation and performance of students with limited English proficiency and disabilities (SLEPD) on the reading and mathematics components of the BST during their first attempt on the grade 8 administration.
The 2000–2001 technical manual for the Basic Standards Tests (Minnesota Department of Education [MDE], 2001) states that in that year exemptions from testing were allowed for some students with limited English proficiency (SLEP). “Students with limited English proficiency must participate in the accountability testing unless they have been in the United States fewer than 12 months. Only these very few LEP students may be exempted from testing” (Appendix C, p. 3). Also, during the time period represented in this report, students with disabilities could be exempted from the tests if the goals and objectives of their Individualized Education Programs (IEPs) did not match the content of the state tests.
The data in this report come from the year in which NCLB legislation was passed, but had not yet taken effect. Requirements for alternate assessments for students with severe disabilities and for at least 95% participation of students in a subgroup to be tested for accountability purposes had not yet been implemented.
Accommodations and Modifications
Students who participated in the BSTs in 2000–2001 were allowed some accommodations and modifications. The Minnesota Department of Education defines accommodations as minor changes that do not change the validity, reliability, or security of the test (MDE 2001, p. 5). Modifications are changes in the standard, the test, or the testing circumstances that alter the level of difficulty of what is being assessed (MDE, 2001, p. 6). Accommodations are permitted on the reading and mathematics portions of the test in 8th grade, when the test is used for accountability purposes, and on the writing portion in 10th grade. Modifications are only allowed for students with disabilities in later retests. When they are used, they result in a student receiving a “pass individual” notation. The data files used for this report did not contain information about whether students received an accommodation or a modification. Therefore, the report does not address this topic. Data in the report represent numbers of students passing the reading or mathematics tests at the “state level,” meaning the state test is taken without modifications.
Method
The Minnesota Department of Education collected the data compiled for this report. After preparing the data files and discarding unusable data, the researchers ran descriptive statistical analyses using the SPSS Information Analysis System. Numbers showing total student enrollment were based on fall counts and may differ from counts of students enrolled on the day of testing several months later. Following the presentation of the results of our analyses of participation and performance data for 2000–2001, we compare the 2000–2001 results to the data from 1999–2000.
Data
Participation in 2000–2001
As indicated in Table 1, in 2000–2001 eighth grade participation of subgroups taking the reading and mathematics BSTs ranged from 88% to 97%. At the time, these rates were considered to be relatively high. The 95% participation requirement for accountability for all subgroups that was implemented under NCLB in 2001 had not yet taken effect. Students with limited English proficiency and disabilities (SLEPD) had the lowest participation rates with 88% in both reading and mathematics. Students with limited English proficiency (SLEP) and students with disabilities (SD) had slightly higher percentages of participation (90%–91%). The total group of 8th grade students had the highest percent participating with 97%. This was nearly 10% higher than that of students with limited English proficiency and disabilities. For each group, the percentage of students participating in reading versus mathematics was similar.
Table 1: Eighth Grade Participation for the 2000–2001 BST Reading and Mathematics Tests
|
|
Reading 2000–2001 |
Mathematics 2000–2001 |
||||
|
Enrolled |
Tested |
Enrolled |
Tested |
|||
|
Number |
Percent |
Number |
Percent |
|||
|
SLEPD |
302 |
267 |
88% |
302 |
265 |
88% |
|
SLEP |
2,586 |
2,350 |
91% |
2,586 |
2,360 |
91% |
|
SD |
8,500 |
7,706 |
91% |
8,500 |
7,667 |
90% |
|
ALL |
66,513 |
64,391 |
97% |
66,513 |
64,213 |
97% |
Key: SLEPD = students with limited English proficiency and disabilities; SLEP = students with limited English proficiency without disabilities; SD = students with disabilities without limited English proficiency; ALL = all 8th grade students
Participation of Students by Disability Category
Table 2 shows the participation of students with limited English proficiency and disabilities (SLEPD) and all students with disabilities (SD) according to the students’ primary disability category. When looking at these data, readers are cautioned to keep in mind that some disability categories were quite small in size. Also, there were no students with limited English proficiency and deaf-blindness in this particular year.
Table 2: Participation of all 8th Grade Students with Disabilities and Students with Limited English Proficiency and Disabilities in the 2000–2001 BSTs for Reading and Mathematics
|
|
READING |
MATHEMATICS |
|||||
|
Disability Group |
Enrolled |
Tested |
Enrolled |
Tested |
|||
|
Number |
Percent |
Number |
Percent |
||||
|
SLEPD |
Speech/Language Impaired |
28 |
27 |
96% |
28 |
26 |
93% |
|
Mentally Impaired: Mild-Moderate |
14 |
7 |
50% |
14 |
8 |
57% |
|
|
Mentally Impaired: Moderate-Severe |
5 |
1 |
20% |
5 |
1 |
20% |
|
|
Physically Impaired |
3 |
2 |
67% |
3 |
2 |
67% |
|
|
Deaf-Hard of Hearing |
23 |
19 |
83% |
23 |
19 |
83% |
|
|
Visually Impaired |
5 |
4 |
80% |
5 |
4 |
80% |
|
|
Specific Learning Disabilities |
192 |
180 |
94% |
192 |
178 |
93% |
|
|
Emotional/Behavioral Disorders |
22 |
19 |
86% |
22 |
19 |
86% |
|
|
Deaf-Blindness |
0 |
0 |
0% |
0 |
0 |
0% |
|
|
Other Health Impaired |
8 |
7 |
88% |
8 |
7 |
88% |
|
|
Autistic |
1 |
0 |
0% |
1 |
0 |
0% |
|
|
Traumatic Brain Injury |
1 |
1 |
100% |
1 |
1 |
100% |
|
|
ALL |
Speech/Language Impaired |
550 |
531 |
97% |
550 |
530 |
96% |
|
Mentally Impaired: Mild-Moderate |
587 |
403 |
69% |
587 |
392 |
67% |
|
|
Mentally Impaired: Moderate-Severe |
168 |
17 |
10% |
168 |
19 |
11% |
|
|
Physically Impaired |
102 |
78 |
77% |
102 |
77 |
75% |
|
|
Deaf-Hard of Hearing |
146 |
136 |
93% |
146 |
138 |
95% |
|
|
Visually Impaired |
24 |
21 |
88% |
24 |
20 |
83% |
|
|
Specific Learning Disabilities |
4,314 |
4,126 |
96% |
4,314 |
4,117 |
96% |
|
|
Emotional/Behavioral Disorders |
1,958 |
1,805 |
92% |
1,958 |
1,791 |
91% |
|
|
Deaf-Blindness |
1 |
0 |
0% |
1 |
0 |
0% |
|
|
Other Health Impaired |
784 |
740 |
94% |
784 |
734 |
94% |
|
|
Autistic |
142 |
95 |
67% |
142 |
93 |
65% |
|
|
Traumatic Brain Injury |
26 |
21 |
81% |
26 |
21 |
81% |
|
Key: SLEPD = Students with limited English proficiency and disabilities; ALL SD = All students with disabilities including SLEPD
In both the total group of students with disabilities and the students with limited English proficiency and disabilities there was a great deal of variation in participation rates across disability categories. Participation in individual categories ranged from 0% to 100%. For both groups, students with speech/language impairments had the highest participation rates in reading (96% of SLEPD and 97% of all SD) and mathematics (93% of SLEPD and 96% of all SD). Students with specific learning disabilities also had comparatively high participation rates in both reading (94% of SLEPD and 96% of SD) and mathematics (93% of SLEPD and 96% of SD). Students with autism (65%–67% of SD and 0% of SLEPD), students with Mild-to-Moderate Mental Impairments (67%–69% of SD and 50%–57% of SLEPD) and students with Moderate-to-Severe Mental Impairments (11%–17% of SD and 20% of SLEPD) had the lowest participation rates.
For the most part, the total group of students with disabilities in any given disability category tended to participate at somewhat higher rates than students with limited English proficiency and disabilities in the same category. Anywhere from 1% to 10% higher participation rates for the total group of students within a particular disability category was typical. There were two exceptions, however. For students with moderate-severe mental impairments and students who were deaf or hard of hearing, greater percentages of limited English proficient students with disabilities took the test than did the total population of students with disabilities in that same category.
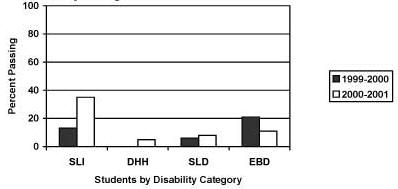
Figure 1 shows the information from the top half of the table in reverse; the percent of the students with limited English proficiency and disabilities, by disability category, who did not participate in the 2000–2001 BSTs for Reading and Mathematics. The graphic highlights the fact that those students with limited English proficiency and mild-moderate or moderate-severe mental impairments were the least likely to participate in the statewide test of basic skills. The same was true for students with autism in this particular year, but the data represent only one student.
Figure 1. Percent of 8th Grade Students with Limited English
Proficiency and Disabilities Not Participating in the 2000-2001 BSTs for Reading
and Mathematics
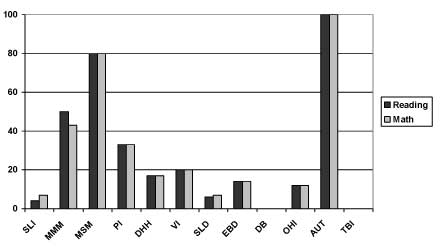
Key: SLI= Speech Language Impairment; MMM = Mild-to-Moderate Mental Impairment; MSM= Moderate-to-Severe Mental Impairment; PI= Physical Impairment; DHH = Deaf/Hard of Hearing; VI= Visual Impairment; SLD= Specific Learning Disability; EBD=Emotional/Behavioral Disorder; DB= Deaf-Blind; OHI= Other Health Impairment; AUT= Autistic; TBI=Traumatic Brain Injury
Participation of Students By Language Group
Table 3 presents participation data as a function of home language. Students from the state’s largest three home language groups are shown. The 2000–2001 participation rates for a particular language group tended to be similar regardless of whether the total language group was examined or just those students with limited English proficiency and disabilities. In both cases, Hmong students had the highest participation rates, followed by those students from Spanish speaking backgrounds. Somali students had the lowest participation rates of the three groups.
Table 3: Percent of Language Minority Students Participating in 2000–2001 BSTs for Reading and Mathematics
|
|
Language Group |
Reading |
Mathematics |
||||
|
Enrolled |
Tested |
Enrolled |
Tested |
||||
|
Number |
Percent |
Number |
Percent |
||||
|
SLEPD |
Hmong |
137 |
124 |
91% |
137 |
123 |
90% |
|
Spanish |
102 |
88 |
86% |
102 |
87 |
85% |
|
|
Somali |
7 |
6 |
86% |
7 |
5 |
71% |
|
|
ALL
|
Hmong |
1,548 |
1,491 |
96% |
1,548 |
1,479 |
96% |
|
Spanish |
1,014 |
875 |
86% |
1,014 |
891 |
88% |
|
|
Somali |
268 |
213 |
80% |
268 |
206 |
77% |
|
Key: SLEPD = Students with limited English proficiency and disabilities; ALL = 8th grade students who are Hmong, Spanish or Somali speaking regardless of proficiency level
Participation rates for reading versus mathematics tended to be similar for most groups. Somali students with limited English proficiency and disabilities had the largest difference in the percentage of students participating in reading (71%) versus mathematics (86%). However, this large difference in percentage was the result of a small number of students.
Performance in 2000–2001
In this section we examine student performance based on the percentage passing at the state-determined passing rate. Table 4 illustrates that, of the four groups examined, students with limited English proficiency and disabilities were the least likely to pass either the reading or the mathematics tests (10% and 12%, respectively).
Table 4. Percent of 8th Graders Passing the 2000–2001 BSTs for Reading and Mathematics
|
|
Reading |
Mathematics |
||||
|
Tested |
Passed |
Percent Passing |
Tested |
Passed |
Percent Passing |
|
|
SLEPD |
267 |
27 |
10% |
265 |
32 |
12% |
|
SLEP |
2,350 |
811 |
35% |
2,360 |
838 |
36% |
|
SD |
7,706 |
2,935 |
38% |
7,667 |
2,395 |
31% |
|
ALL |
64,391 |
50,747 |
79% |
64,213 |
46,205 |
72% |
Key: SLEPD = Students with limited English proficiency and disabilities; SLEP = Students with limited English proficiency without disabilities; SD = Students with disabilities without limited English proficiency; ALL = All 8th grade students
For any one group, the percentage of students passing reading typically varied little from the percentage passing mathematics, approximately 1%–7% difference between the two content areas. There was no consistent directionality to the difference.
Performance of Students by Disability Category
Table 5 provides more detailed data about which students with disabilities were more likely to pass the reading and mathematics tests at the state level on their first attempt in 8th grade. The reader should be aware that the small numbers of students with limited English proficiency and disabilities who were tested in certain disability categories did not allow performance data to be disaggregated for those categories (e.g., moderate-severe mental impairments, physical impairments).
Table 5. Percent of All Students with Disabilities and Students Who Are Limited English Proficient with Disabilities Passing the 2000–2001 BSTs for Reading and Mathematics
|
|
Disability Group |
Reading |
Mathematics |
||||
|
Tested |
Number Passed |
Percent Passed |
Tested |
Number Passed |
Percent Passed |
||
|
SLEPD
|
Speech/Language Impaired |
27 |
5 |
19% |
26 |
9 |
35% |
|
Mentally Impaired: Mild-Moderate |
7 |
* |
* |
8 |
* |
* |
|
|
Mentally Impaired: Moderate-Severe |
1 |
* |
* |
1 |
* |
* |
|
|
Physically Impaired |
2 |
* |
* |
2 |
* |
* |
|
|
Deaf-Hard of Hearing |
19 |
3 |
16% |
19 |
1 |
5% |
|
|
Visually Impaired |
4 |
* |
* |
4 |
* |
* |
|
|
Specific Learning Disabilities |
180 |
15 |
8% |
178 |
14 |
8% |
|
|
Emotional/Behavioral Disorders |
19 |
2 |
11% |
19 |
2 |
11% |
|
|
Deaf-Blindness |
0 |
0 |
0 |
0 |
0 |
0 |
|
|
Other Health Impaired |
7 |
* |
* |
7 |
* |
* |
|
|
Autistic |
0 |
0 |
0 |
0 |
0 |
0 |
|
|
Traumatic Brain Injury |
1 |
* |
* |
1 |
* |
* |
|
|
All SD |
Speech/Language Impaired |
531 |
276 |
52% |
531 |
267 |
50% |
|
Mentally Impaired: Mild-Moderate |
403 |
10 |
2% |
403 |
2 |
<1% |
|
|
Mentally Impaired: Moderate-Severe |
17 |
0 |
0% |
17 |
1 |
6% |
|
|
Physically Impaired |
78 |
41 |
53% |
78 |
32 |
41% |
|
|
Deaf-Hard of Hearing |
136 |
54 |
40% |
136 |
48 |
35% |
|
|
Visually Impaired |
21 |
11 |
52% |
21 |
15 |
71% |
|
|
Specific Learning Disabilities |
4,126 |
1,347 |
33% |
4,126 |
1,155 |
28% |
|
|
Emotional/Behavioral Disorders |
1,805 |
799 |
44% |
1,805 |
582 |
32% |
|
|
Deaf-Blindness |
0 |
0 |
0% |
0 |
0 |
0% |
|
|
Other Health Impaired |
740 |
339 |
46% |
740 |
239 |
32% |
|
|
Autistic |
95 |
51 |
54% |
95 |
48 |
51% |
|
|
Traumatic Brain Injury |
21 |
7 |
33% |
21 |
6 |
29% |
|
Key: SLEPD = Students with limited English proficiency and disabilities; ALL SD = Students with disabilities including SLEPD; * = Data not disaggregated because fewer than 10 students tested in this category
One characteristic that stands out from the performance data is the amount of variation in the percentage of students from particular disability groups who passed either the reading or mathematics tests. For students with limited English proficiency and disabilities, 0%–19% passed reading and 0%–35% passed mathematics. For the total population of students with disabilities, the variation is even greater. The percentage of these students passing ranged from 0%–54% in reading and 0%–71% in mathematics.
The percentages of students with limited English proficiency and disabilities who passed either the reading or mathematics test was often quite a bit smaller than the percentage passing from the total group of students with disabilities. The data were sufficient to document the gap in four disability categories. Students with limited English proficiency and speech language impairments, specific learning disabilities, emotional-behavioral disabilities, and those who were deaf and hard of hearing all had a 15%–33% lower percentage passing reading or mathematics than their non-limited English proficient peers in the same disability category.
There were some consistent patterns of performance that were evident across the general population of students with disabilities and those with limited English proficiency and disabilities. Students with speech-language impairments were among the highest achievers in both the total population of students with disabilities (52% passed reading and 50% passed mathematics) and for students with limited English proficiency and disabilities (19% passed reading and 35% passed mathematics). Of the few groups that had disaggregated data, students with limited English proficiency and learning disabilities had the smallest percentage of students passing the test (8% for both reading and mathematics). Of particular note is that students with specific learning disabilities had relatively low percentages of students passing in both the total population of students with disabilities (33% passed reading and 28% passed mathematics) and those with limited English proficiency and disabilities (8% passed reading and mathematics).
There were differences between the percentage of students passing reading and mathematics, but the direction of the difference was not always the same. For students with limited English proficiency and disabilities, most of the groups with disaggregated data had the same or slightly smaller percentage of students passing reading than mathematics. This pattern was similar to what was observed in the data for the total population of students with disabilities as well. The only exception was students with limited English proficiency and speech language impairments. Sixteen percent more of these students passed the mathematics test than the reading test. In the total population of students with disabilities, those with moderate-severe mental impairments and those with visual impairments were more likely to pass mathematics than reading.
Performance of Students by Language Group
Next we examined the performance of students with limited English proficiency and disabilities by language group. The data in Table 6 show that all Hmong students (ALL) and Hmong students with limited English proficiency and disabilities (SLEPD) were the most likely of the three language groups to pass the test (43% for reading and 46% for mathematics for All Hmong and 9% for reading and 16% for mathematics of Hmong students with limited English proficiency and disabilities). The number of Somali students with limited English proficiency and disabilities was too small to make any inferences about performance.
For the Hmong-, Spanish-, and Somali-speaking students with limited English proficiency and disabilities there was not a consistent directionality of better performance on reading versus mathematics. Hmong students were more likely to pass the mathematics than the reading test. In contrast, Spanish- and Somali-speaking students were more likely to pass reading than mathematics. This pattern was also evident in the total population of Hmong- and Spanish-speaking students. The number of Somali students with limited English proficiency and disabilities (SLEPD) was fewer than 10 so their performance data are not provided here.
Table 6: 2000–2001 8th Grade BST Reading and Mathematics Performance of Students who are Language Minority and Students with Limited English Proficiency and Disabilities
|
|
Language Group |
Reading |
Mathematics |
||||
|
Tested |
Passed |
Percent Passed |
Tested |
Passed |
Percent Passed |
||
|
SLEPD |
Hmong |
124 |
11 |
9% |
123 |
20 |
16% |
|
Spanish |
88 |
7 |
8% |
87 |
5 |
6% |
|
|
Somali |
6 |
* |
* |
5 |
* |
* |
|
|
All |
Hmong |
1,491 |
637 |
43% |
1,479 |
674 |
46% |
|
Spanish |
875 |
324 |
37% |
891 |
251 |
28% |
|
|
Somali |
213 |
41 |
19% |
206 |
29 |
14% |
|
Key: SLEPD = Students with limited English proficiency and disabilities; ALL = 8th grade students who are Hmong-, Spanish-, or Somali-speaking regardless of proficiency level; * = Data not disaggregated because fewer than 10 students tested
Comparison across Years 2000–2001 and 1999–2000
The figures that follow place the 1999–2000 data next to the 2000–2001 data for the purposes of descriptive comparison. Two years of data are not enough to establish any trends in performance. Still, this preliminary look at how students did over a two-year period can form the basis for further work on trends when sufficient data are available. Tables with more detailed data are presented in Appendix A.
Participation
Participation in the 1999–2000 and 2000–2001 Basic Standards Tests for students with limited English proficiency and disabilities (SLEPD) compared to the other three groups that we discuss here (SLEP, SD, and ALL) is shown in Figure 2. In both reading and mathematics, there was a noticeable decline in the percentage of students with limited English proficiency and disabilities who participated in a content test from one year to the next. In contrast, for the other groups shown in the figure (SLEP, SD, and ALL) there were relatively small changes in the percent of students participating in a content test from one year to the next. Overall participation rates for reading versus mathematics were similar across years.
Figure 2. Comparison of Percentage Tested Across Groups for
1999-2000 and 2000-2001
Key: SLEPD = Students with limited English proficiency and
disabilities; SLEP = Students with limited English proficiency without
disabilities; SD = Students with disabilities without limited English
proficiency; ALL = All 8th grade students
Participation of Students by Disability Category
The 1999–2000 and 2000–2001 reading test participation rates by disability category are shown in Figure 3. Participation varied across groups and years. Students with limited English proficiency and speech language impairments, specific learning disabilities, and traumatic brain injuries had consistent reading test participation rates across the two years. Students with limited English proficiency who had mild-moderate mental impairments, those who were deaf and hard of hearing, and those who were visually impaired had lower participation rates in 2000–2001 than in 1999–2000. Students with limited English proficiency and moderate to severe mental impairments, physical impairments, and other health impairments had higher participation rates in 2000–2001 than in 1999–2000. Some of this variability, particularly for the categories of moderate-severe mentally impaired, physically impaired, visually impaired, other health impaired, and traumatic brain injury, is due to small numbers of students in the groups. Students with limited English proficiency and autism are not included in the figure because there were none tested in either year.
Figure 3. Comparison of 1999-2000 and 2000-2001 Reading
Test Participation Rates for Students with Limited English Proficiency and
Disabilities
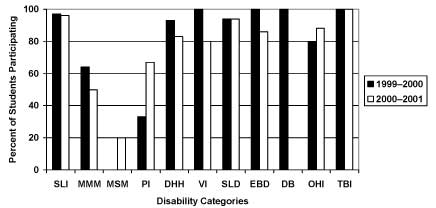
Key: SLI= Speech Language Impairment; MMM = Mild-to-Moderate Mental Impairment; MSM= Moderate-to-Severe Mental Impairment; PI= Physical Impairment; DHH = Deaf/Hard of Hearing; VI= Visual Impairment; SLD= Specific Learning Disability; EBD=Emotional/Behavioral Disorder; DB= Deaf-Blind; OHI= Other Health Impairment; TBI=Traumatic Brain Injury
Figure 4 shows the percentage of students in the various disability categories who participated in the 1999–2000 and 2000–2001 mathematics tests. As with reading, there was a great deal of variability in participation rates across the two years and no clear directionality by content area that held true for all groups. As with reading, the most consistent mathematics participation rates across years can be seen for students with limited English proficiency and learning disabilities as well students with limited English proficiency and traumatic brain injuries. Decreases in the percentages of students participating can be seen for students with limited English proficiency and speech language impairments, mild-moderate mental impairments, those who were deaf and hard of hearing, those with visual impairments and those with emotional-behavioral disabilities. Increases in the percentage of students participating were observed for students with limited English proficiency and moderate-severe mental impairments, physical impairments, and other health impairments. Students with limited English proficiency and autism are not included in the figure because there were none in 1999-2000 and the one autistic student in 2000-2001 was not tested.
Figure 4. Comparison of 1999-2000 and 2000-2001
Mathematics Test Participation for Students with Limited English Proficiency and
Disabilities
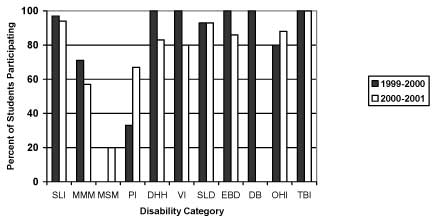
Key: SLI= Speech Language Impairment; MMM =
Mild-to-Moderate Mental Impairment; MSM= Moderate-to-Severe Mental Impairment;
PI= Physical Impairment; DHH = Deaf/Hard of Hearing; VI= Visual Impairment; SLD=
Specific Learning Disability; EBD=Emotional/Behavioral Disorder; DB= Deaf-Blind;
OHI= Other Health Impairment; TBI=Traumatic Brain Injury
Participation of Students by Language Group
Figure 5 compares the 1999–2000 and 2000–2001 reading participation rates for students by language groups. All groups showed changes in participation rates across the two-year time period, but there was no consistent directionality to the change and the size of the difference varied by group. Four of the six groups shown (All Hmong, All Spanish, SLEPD Spanish, and SLEPD Somali) showed decreases in the percentage of students taking the reading test in 2000–2001 than in 1999–2000. Somali students with limited English proficiency and disabilities showed the largest decrease in the percentage of students participating in the reading test across the two-year period. Two groups (SLEPD Hmong and All Somali) showed increases in the percentage of students taking the reading test in 2000–2001 compared to 1999–2000.
Figure 5. Comparison of 1999-2000 and 2000-2001 Reading Test
Participation by Language Group and Disability Status
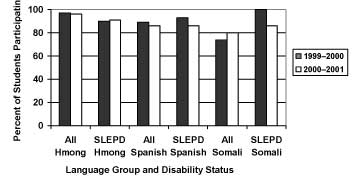
Key: SLEPD= Students with limited
English proficiency and a disability; ALL = All Hmong-, Somali-, or
Spanish-speaking students regardless of language proficiency
The same type of information is provided for mathematics tests in Figure 6. Most language groups, except the total population of Somali-speaking students, showed a decrease in the percentage of students participating in the 2000–2001 mathematics test. The change in the percentage of students passing the 1999–2000 versus the 2000–2001 mathematics test was relatively small for all groups except Somali students with limited English proficiency and disabilities.
Figure 6. Comparison of 1999-2000 and 2000-2001 Mathematics
Test Participation by Language Group and Disability Status
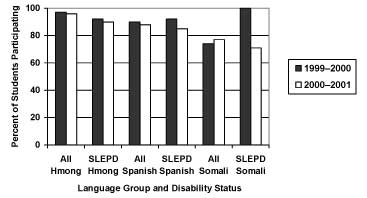
Key: SLEPD= Students with limited English proficiency and a disability; ALL = All Hmong-, Somali-, or Spanish-speaking students regardless of language proficiency
Performance
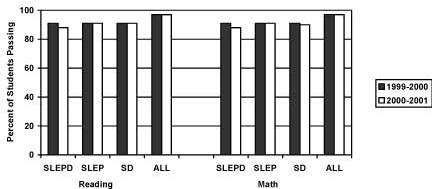
Figure 7 shows the percent of students passing the 1999–2000 and 2000–2001 BSTs by subgroup. Within a subgroup, the percentage of students passing the test from one year to the next was fairly similar for most groups in both reading and mathematics. Students with limited English proficiency and disabilities showed the largest increase in the percentage of students passing reading and mathematics in 2000–2001. The increase in the percentage of these students passing mathematics was slightly larger than the increase in the percentage passing reading.
Figure 7. Comparison of 1999-2000 and 2000-2001 Performance
for Reading and Mathematics
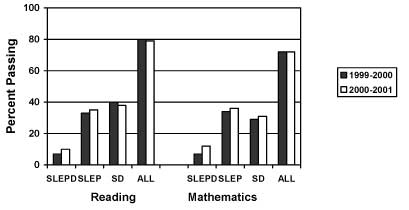
Key: SLEPD = Students with limited English proficiency and
disabilities; SLEP = Students with limited English proficiency without
disabilities; SD = Students with disabilities without limited English
proficiency; ALL = All 8th grade students
Performance by Disability Category
Figure 8 shows 1999–2000 and 2000–2001 reading performance by disability category for students with limited English proficiency and disabilities in those groups with enough data to disaggregate. For three of the four groups shown, there was a slightly larger percentage of students passing the reading test in 2000–2001 than in 1999–2000 (Deaf/Hard of Hearing, Specific Learning Difficulty, and Emotional/Behavioral Disorder). The fourth group (Speech Language Impairment) showed similar percentages of students passing the reading test in both years.
Among the groups that had disaggregated data, students with limited English proficiency and learning disabilities were the least likely to pass the reading test in both of the years shown.
Figure 8. Students with Limited English Proficiency and a
Disability Passing the 1999-2000 and 2000-2001 Reading Test
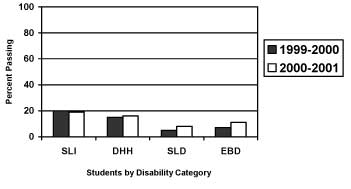
Key:
SLI= Speech Language Impairment; DHH = Deaf/Hard
of Hearing; SLD= Specific Learning Disability; EBD=Emotional/Behavioral Disorder
Figure 9 shows similar data on the mathematics performance of students with limited English proficiency and disabilities, by disability category, in 1999–2000 and 2000–2001. There were observable differences in the percentages of students passing within a disability category, but there was no clear directionality to the differences. Students with limited English proficiency and speech language impairments, along with students with limited English proficiency who were deaf and hard of hearing, passed the mathematics test in greater numbers in 2000–2001 than in 1999–2000. The increase in the percentage of students with speech language impairments who passed was striking. In contrast, a smaller percentage of students with limited English proficiency and emotional/behavioral disorders passed the test in 2000–2001 than passed it in 1999–2000.
Figure 9. Students with Limited English Proficiency and a
Disability Passing the 1999-2000 and 2000-2001 Mathematics Test
Key:
SLI= Speech Language Impairment; DHH = Deaf/Hard
of Hearing; SLD= Specific Learning Disability; EBD=Emotional/Behavioral Disorder
Performance by Language Group
Figure 10 shows the percentage of students passing the reading assessments in 1999–2000 and 2000–2001 by language group. In most of the groups shown, percentages of students in each of the three main language groups who passed the reading test, including those with limited English proficiency and disabilities, varied little across the two years. The exception was Spanish-speaking students with limited English proficiency and disabilities. A larger percentage of these students passed the reading test in 2000–2001 than in 1999–2000. Fewer than 10 Somali students with limited English proficiency and disabilities were tested and their performance data were not disaggregated.
Figure 10. 1999-2000 and 2000-2001 Reading Performance for
Students with Limited English Proficiency by Language Group
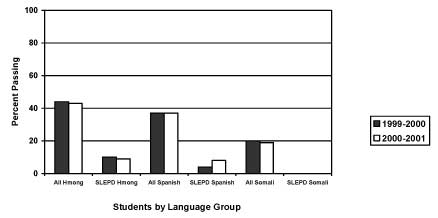
Key:
SLEPD= Students with limited English proficiency and a disability; ALL = All
Hmong-, Somali-, or Spanish-speaking students regardless of language proficiency
Figure 11 contains performance data for the 1999–2000 and 2000–2001 mathematics test by language group. Four of the six groups shown had the same, or slightly higher, percentage of students participating in the mathematics test from one year to the next. The exception was Spanish-speaking students with limited English proficiency and disabilities. This group of students showed a slight decrease in the percentage of students passing the mathematics test in 2000–2001 compared to 1999–2000.
Figure 11. 1999-2000 and 2000-2001Mathematics Test Performance
for Students with Limited English Proficiency and a Disability by Language Group
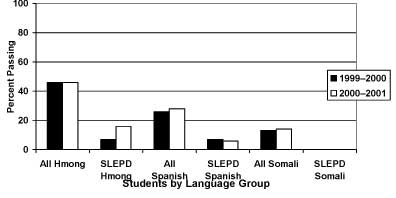
Key: SLEPD= Students with limited English proficiency and a disability;
ALL = All Hmong-, Somali-, or Spanish-speaking students regardless of language
proficiency
For most groups, the difference in the percent of students passing in 1999–2000 versus 2000–2001 was small. The one exception was Hmong students with limited English proficiency and disabilities. Roughly 10% more of these students passed the mathematics test in 2000–2001 than in 1999–2000.
Summary of Findings
The data on the participation and performance of students with limited English proficiency and disabilities that are presented in this report are important because they are among some of the first that have been publicly reported and analyzed. Despite their importance, they still must be viewed with some caution, particularly when considering data by disability category, because of the limited number of students.
Participation in 2000–2001
Within disability categories, students with limited English proficiency and disabilities tended to participate at lower rates than their peers in the total group of students with disabilities in that same disability category. Participation rates by disability category varied and were impacted by small numbers of students with limited English proficiency and disabilities. Typically, students with speech/language disabilities and learning disabilities had the highest participation rates for students with limited English proficiency and disabilities. Students with autism, mild-moderate mental impairments, and moderate-severe mental impairments had the lowest participation rates. In a few categories, participation rates were different in reading versus mathematics. However, in most cases the participation rates for students in a particular disability category were the same for both subjects..
Performance in 2000–20011
Of the four groups examined, students with limited English proficiency and disabilities were the least likely to pass either the reading or the mathematics tests. The passing rate was approximately 10%–12% for students with limited English proficiency and disabilities, which was at least 20% lower than the passing rate for either students with disabilities or students with limited English proficiency. This disparity grew even larger when students with limited English proficiency and disabilities were compared to the total student population.
Small numbers of students with limited English proficiency and disabilities in some disability categories limited the observations that could be made about performance. There were enough students to provide data showing that students with limited English proficiency and speech/language impairments had the highest percentage passing of all the disability categories. Students with mild-moderate mental impairments along with students with learning disabilities had the lowest percentage passing.
Participation Compared Across Two Yearss
Participation rates for students with disabilities, students with limited English proficiency, and the total student population tended to be similar in 1999–2000 and 2000–2001 for both reading and mathematics. Even so, students with limited English proficiency and disabilities had the most noticeable decrease in the percentage of students participating.
When data were examined by disability category, there was a great deal of variation in participation rates for students with limited English proficiency and disabilities in both years. In reading, students with limited English proficiency and speech-language impairments, learning disabilities, and traumatic brain injuries had consistent participation rates across the two years. In contrast, students with limited English proficiency and mild-moderate mental impairments, visual impairments, and those who were deaf and hard of hearing had lower participation rates in 2000–2001 than in 1999–2000. Students with moderate-severe mental impairments, physical impairments, and other health impairments had higher reading participation in 2000–2001 than in 1999–2000. In mathematics, those with limited English proficiency and learning disabilities or traumatic brain injury had the most consistent participation rates across years. Students with limited English proficiency and speech language impairments, mild-moderate mental impairments, visual impairments, emotional-behavioral disabilities, and those who were deaf and hard of hearing had lower mathematics participation rates in 2000–2001. Students with limited English proficiency and moderate-severe mental impairments, physical impairments, and other health impairments showed an increase participation rates in mathematics for 2000–2001.
Performance Compared Across Two Yearss
Compared to students with disabilities, students with limited English proficiency, and the total 8th grade population, students with limited English proficiency and disabilities were the least likely to pass either the reading or the mathematics test in either year.
When data were examined by disability category, certain patterns could be seen in those disability categories with large enough numbers of students. Students with limited English proficiency and speech-language impairments had the highest percentage of students passing either reading or mathematics. Typically, the percentage of students in a disability category who passed mathematics versus reading was the same or slightly different. Exceptions to this pattern were noted for students with speech-language impairments who had a noticeable increase in the percentage of students passing mathematics in 2000–2001 compared to 1999–2000.
Discussion and Conclusion
There were very small numbers of Somali students with limited English proficiency and disabilities that were enrolled in the years covered by this report. One important contextual factor to understand in interpreting these results is that Somali students are among the most recent immigrants to Minnesota. At the time these data were collected, many Somali students may have been so new to the United States that teachers were not yet referring them for special education assessment in the belief that they needed time to learn English first. Somali students might also have qualified for the short-term exemption from testing due to their recent arrival in the United States.
Although disaggregating statewide assessment data for students who have both limited English proficiency and disabilities is not currently mandated by NCLB, there are advantages for educators in having these data available to them. This report has shown that while students with limited English proficiency and disabilities tended to pass the statewide tests at lower percentages than their peers who were in the larger groups of all students with disabilities or all students with limited English proficiency, it was not true that all students with limited English proficiency and disabilities were performing poorly. Some of these students passed this state’s 8th grade tests of basic skills in reading and mathematics at the state-determined level on their first attempt. Clearly, these are success stories that should be celebrated. However, this examination of the data shows that as recently as 2000–2001 there was a much larger group of students with limited English proficiency and disabilities who required increased support in order to achieve proficiency on basic skills. A closer examination of the standards-based instruction that these students receive in the classroom and how it aligns with the state content standards assessed by the test may be in order.
One such group that warrants close attention is students with limited English proficiency and learning disabilities. These students had relatively high percentages participating in the BST content tests, but relatively low percentages passing either reading or mathematics. Students with limited English proficiency and learning disabilities are one of the larger groups of students with limited English proficiency and disabilities. Therefore, changes in instruction and assessment policies and practices to support increased academic achievement could have a relatively large impact on the performance of the total group of students. Based on the data, immigrant and refugee students who are the more recent arrivals to the state, such as Somali students with learning disabilities, may be among those most likely to benefit from this additional support.