Prepared by:
Kristi Liu • Manuel Barrera • Martha Thurlow • Kamil Guven • Vitaliy Shyyan
May 2005
Any or all portions of this document may be reproduced and distributed without prior permission, provided the source is cited as:
Liu, K., Barrera, M., Thurlow, M., Guven, K. & Shyyan, V. (2005). Graduation exam participation and performance (1999-2000) of English language learners with disabilities (ELLs with Disabilities Report 2). Minneapolis, MN: University of Minnesota, National Center on Educational Outcomes. Retrieved [today's date], from the World Wide Web: http://cehd.umn.edu/NCEO/OnlinePubs/ELLsDisReport2.html
One of the central themes in the standards-based education movement continues to be the importance of clear and detailed system accountability data showing how students from special needs groups perform on statewide accountability assessments (Albus, Thurlow & Liu, 2002; National Research Council, 1997; Thurlow & Liu, 2001). Armed with such data, states, districts and schools can begin to examine ways that current instructional policies and practices might be improved for students in a particular group.
The No Child Left Behind Act of 2001 (NCLB) requires that states make public their assessment results disaggregated by race/ethnicity, socioeconomic status, migrant status, disability, and limited English proficiency. One group that is not mentioned in the legislation is students who are both limited English proficient and who also have a disability. Even though making data public on this particular group of students is not required, more and more educators and policymakers are starting to ask to see these data to inform their school improvement efforts.
As recently as 1998–99 there was only one state that publicly reported the statewide test participation of students who were both limited English proficient and had a disability (Thurlow & Liu, 2001). However, there were no performance data available on students with limited English proficiency and a disability in any state assessment at that time. The situation has improved somewhat in the past several years. In 2002-2003, a small number of states made some type of participation or performance data available on these students via the Internet (Albus & Thurlow, 2005) in varying amounts of detail.
This report represents one of a series of reports providing an in depth look at the participation and performance of English language learners (ELLs) with disabilities on assessments in one state’s accountability system. The series includes reports such as this one that examine data from the 1999–2000 school year, just prior to the implementation of the No Child Left Behind Act. Other reports include data for subsequent years (see Albus, Barrera, Thurlow, Guven, & Shyyan, 2004), allowing for the possible observation of NCLB on participation and performance patterns. This report specifically addresses a statewide test of basic skills that is used both as a measure of system accountability and as a high stakes test for graduation. Albus, Thurlow, Barrera, Guven, & Shyyan (2004) examine a high standards assessment given at the elementary school level during the same school year.
The Minnesota Basic Standards Tests (BSTs) were implemented in the mid-1990s as a measure of both individual achievement of basic skills considered important for participation in adult life and as a measure of school accountability. Students generally take the Basic Standards Tests in reading and mathematics for the first time in 8th grade and the results at that time are used for school accountability purposes. Students must achieve a passing score in both areas by the 12th grade in order to receive a diploma but they have several opportunities to take the test again if their 8th grade scores do not meet the passing score. The writing test is given for the first time in 10th grade. The 10th grade scores are used for accountability measures and the students must either meet the passing criteria at that time or in successive grades in order to receive a diploma. This report examines the participation and performance of students with limited English proficiency with disabilities (SLEPD) on the reading and mathematics components of the test during the initial test administration in 8th grade.
Information on the 1999–2000 administration of the BSTs is no longer available to the general public on the Minnesota Department of Education Web site. However, previous work by the National Center on Educational Outcomes documented some of the testing policies in existence during this time period. For example, Thompson, Thurlow, Spicuzza, and Parson (1999) stated that 1999–2000 was the first year in which students were required to pass the Basic Standards Tests in reading and mathematics in order to graduate from high school. A minimum of 70% of the items had to be answered correctly in 1999–2000 in order for a student to pass at the state level. Liu and Thurlow (2000) documented that in the 1998–1999 school year there was a one year temporary exemption from Basic Standards Testing that was allowed for students who were new arrivals to the United States. That exemption policy was still in existence at the time that the data in this report were collected. According to Thompson et al. (1999), for the 1999–2000 test administrations:
There are three levels of participation allowed on Minnesota’s Basic Standards Tests for students with Individualized Educational Programs or 504 Accommodation Plans. Students can either take the tests as generally administered (with accommodations as needed…), take a modified version of the tests and receive the notation “pass individual” on their high school transcript, or be exempt from testing altogether.” (p. 2)
Students with disabilities who did not participate in the Basic Standards Tests, as determined by their Individualized Education Program, were not yet required to participate in a state developed alternate assessment (Thompson et al., 1999). The Minnesota Alternate Assessment was not implemented until the following year. It is important to note that the data in this report come from a time-period that was a full two years prior to the implementation of the No Child Left Behind Act. For example, requirements for alternate assessments for students with significant disabilities, and for at least 95% participation of students in a subgroup to be tested for accountability, did not yet exist.
Accommodations and Modifications
There are lists of allowable accommodations for both students with limited English proficiency and students with disabilities for the 1999–2000 Basic Standards Test administration (see Liu & Thurlow, 1999; Thompson et al., 1999). The data available for this report did not indicate which accommodations students received. Therefore the analyses in this report do not address the issue of accommodations use and how accommodations might have impacted scores.
Format of Data Tables
For the purposes of comparison, the tables in this report include 1999–2000 data from both reading and mathematics tests. Where possible, reading and mathematics data are presented side by side for ease of comparison. This report begins by presenting the test participation rates for English language learners with disabilities (referred to as SLEPD1 in tables) along with the data on students with limited English proficiency without disabilities (SLEP), students with disabilities without limited English proficiency (here called SD) and the total 8th grade test taking population (labeled All). Additional tables show data for students by disability category and in the state’s three largest language groups.
It is important to note that the makeup of the group labeled “All” changes across tables and figures. In each case there is a key underneath that defines the term.
1The terms used in this document reflect language
adopted in federal documents. We recognize that a number of terms are used in
the field related to learners of English as a new or second language. We have
adopted some of those terms for reference, but have chosen to use language and
acronyms compliant with “person first” protocol and to minimize lengthy terms
where possible.
The Minnesota Department of Education collected the data compiled for this report. Researchers organized the data file and excluded unusable data before running descriptive statistical analyses using the SPSS Information Analysis System. Numbers showing total student enrollment are based on fall counts and may differ from counts of students enrolled on the day of testing several months later.
Participation
Table 1 shows that participation rates for students with special
needs (SLEPD, SLEP, SD) were consistently 6% lower (91%) than those for the
“all” 8th grade student population where 97% consistently participated.2
Participation rates for each of the groups shown were stable across reading and
mathematics tests.
2 The No Child Left Behind Act was passed during 2001
and requires that 95% of students in a subgroup participate in statewide tests
for accountability purposes. The legislation was not in effect at the time of
the tests mentioned in this report.
Table 1: Eighth Grade Participation for the 1999–2000 BST Reading and Mathematics Tests
|
|
Reading |
Mathematics |
||||
|
Enrolled |
Tested |
Enrolled |
Tested |
|||
|
Number |
Percent |
Number |
Percent |
|||
|
SLEPD |
221 |
201 |
91% |
221 |
202 |
91% |
|
SLEP |
2,065 |
1,888 |
91% |
2,065 |
1,887 |
91% |
|
SD |
8,599 |
7,824 |
91% |
8,599 |
7,794 |
91% |
|
ALL |
68,012 |
65,976 |
97% |
68,012 |
65,911 |
97% |
Key: SLEPD = Students with limited English proficiency with disabilities; SLEP = Students with limited English proficiency without disabilities; SD = Students with disabilities without limited English proficiency; ALL = The total population of students enrolled in grade 8 in the state.
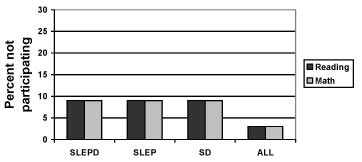
Figure 1 illustrates the reverse of Table 1 — the percentage of students in each group that did not participate in the 1999–2000 reading and mathematics tests. It highlights the fact that participation rates for students with limited English proficiency and disabilities were similar to those of their peers with limited English proficiency only and with disabilities only. Students with limited English proficiency and disabilities had participation rates above 90%, which was considered high at the time. However, there was still a gap between the percent of these students tested and the percent of all students tested.
Figure 1. Percent of Students NOT Participating in the 1999-2000 Reading and Mathematics Tests
Key: SLEPD = Students with limited English
proficiency with disabilities; SLEP = Students with limited English proficiency
without disabilities; SD = Students with disabilities without limited English
proficiency; ALL = The total population of students enrolled in grade 8 in the
state
Participation of Students by Disability Category
Table 2 shows the reading and mathematics participation of students with limited English proficiency and disabilities (SLEPD), by disability category, compared to the total population of 8th grade students with disabilities (SD), also by disability category. It illustrates that while overall participation for each of the groups (i.e., SLEPD, SD) was considered high at the time, there was extreme variability in the participation of students in particular disability categories for both content areas. For students with limited English proficiency and disabilities, participation was as low as 0% for those with moderate-severe mental impairments and as high as 100% for those with visual impairments, emotional/behavioral disorders, deaf-blindness and traumatic brain injuries. Likewise, for all students with disabilities participation was as low as 7% for students with moderate-severe mental impairments and as high as 100% for students with visual impairments.
Students with limited English proficiency who did not have mental impairments or physical impairments tended to have the highest participation rates. Those with speech/language impairments, visual impairments, specific learning disabilities, emotional/behavioral disorders, deaf-blindness and traumatic brain injury all had participation rates above 90%. In contrast, students with limited English proficiency and mild-moderate mental impairments, moderate-severe mental impairments, physical impairments, and other health impairments had participation rates below 80%. There were no students with limited English proficiency and autism in 1999–2000. Readers are strongly cautioned to remember that many of the disability categories had fewer than 20 students included so detailed comparisons of participation rates are not possible.
The total population of students with disabilities, shown in the bottom half of Table 2, showed the same tendency for students without mental or physical impairments to have the highest participation rates.
In general, participation of students with limited English proficiency and disabilities, no matter what the disability category, tended to be similar across reading and mathematics. Changes in the percentage of students participating in one content area versus the other were typically caused by one student not participating in a small group. The pattern in the larger group of all students with disabilities was similar. Participation rates for students within a disability category tended to vary little across reading and mathematics.
Figure 2 shows the percent of students in specific disability categories within the total population of students with limited English proficiency and disabilities who did not participate. Students with autism are not shown here because there were none in this disability category in 1999–2000. The figure highlights the variability mentioned, while showing that students who did not have mental or physical impairments were the most likely to be tested.
Table 2: Participation of 8th Grade Students with Limited English Proficiency with Disabilities and all 8th Grade Students with Disabilities in the 1999–2000 BST Reading and Mathematics Tests
|
|
READING |
MATHEMATICS |
|||||
Disability Group |
Enrolled |
Tested |
Enrolled
|
Tested |
|||
|
Number |
Percent |
Number |
Percent |
||||
|
SLEPD |
Speech/Language Impaired |
31 |
30 |
97% |
31 |
30 |
97% |
|
Mentally Impaired: Mild-Moderate |
14 |
9 |
64% |
14 |
10 |
71% |
|
|
Mentally Impaired: Moderate-Severe |
2 |
0 |
0% |
2 |
0 |
0% |
|
|
Physically Impaired |
3 |
1 |
33% |
3 |
1 |
33% |
|
|
Deaf-Hard of Hearing |
14 |
13 |
93% |
14 |
14 |
100% |
|
|
Visually Impaired |
1 |
1 |
100% |
1 |
1 |
100% |
|
|
Specific Learning Disabilities |
134 |
126 |
94% |
134 |
125 |
93% |
|
|
Emotional/Behavioral Disorders |
14 |
14 |
100% |
14 |
14 |
100% |
|
|
Deaf-Blindness |
2 |
2 |
100% |
2 |
2 |
100% |
|
|
Other Health Impaired |
5 |
4 |
80% |
5 |
4 |
80% |
|
|
Autistic |
0 |
0 |
0 % |
0 |
0 |
0% |
|
|
Traumatic Brain Injury Disabled |
1 |
1 |
100% |
1 |
1 |
100% |
|
ALL |
Speech/Language Impaired |
527 |
518 |
98% |
527 |
516 |
98% |
|
Mentally Impaired: Mild-Moderate |
599 |
430 |
72% |
599 |
421 |
70% |
|
|
Mentally Impaired: Moderate-Severe |
162 |
12 |
7% |
162 |
11 |
7% |
|
|
Physically Impaired |
120 |
99 |
83% |
120 |
96 |
80% |
|
|
Deaf-Hard of Hearing |
160 |
148 |
93% |
160 |
149 |
93% |
|
|
Visually Impaired |
21 |
21 |
100% |
21 |
21 |
100% |
|
|
Specific Learning Disabilities |
4,258 |
4,091 |
96% |
4,258 |
4,093 |
96% |
|
|
Emotional/Behavioral Disorders |
2,133 |
1,956 |
92% |
2,133 |
1,948 |
91% |
|
|
Deaf-Blindness |
8 |
6 |
75% |
8 |
6 |
75% |
|
|
Other Health Impaired |
681 |
641 |
94% |
681 |
634 |
93% |
|
|
Autistic |
117 |
77 |
66% |
117 |
75 |
64% |
|
|
Traumatic Brain Injury Disabled |
34 |
26 |
77% |
34 |
26 |
77% |
|
Key: SLEPD = Students with limited English proficiency and disabilities; ALL = Students with disabilities including those with limited English proficiency; 0= No students tested in this category.
Figure 2. Percent of 8th Grade Students with Limited English Proficiency and Disabilities by Disability Category NOT Participating in the 1999-2000 BST Reading and Mathematics Tests
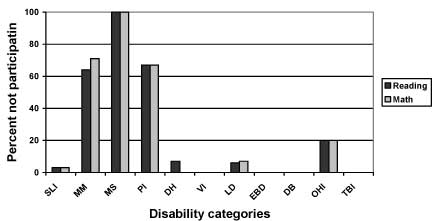
Key: SLI= Speech Language Impairment; MM = Mild to Moderate Mental Impairment; MS= Moderate to Severe Mental Impairment; PI= Physical Impairment; DH = Deaf/Hard of Hearing; VI= Visual Impairment; SLD= Specific Learning Disability; EBD=Emotional/Behavioral Disorder; DB= Deaf-Blind; OHI= Other Health Impairment; TBI=Traumatic Brain Injury
Participation of Students by Language Group
Another dimension of student participation is to examine students with disabilities by language groups. Table 3 shows the participation rates for all 8th grade students in the three largest language groups (Hmong, Somali and Spanish) with the participation of ELLs with disabilities in those same groups.
In 1999–2000, Hmong-, Somali-, and Spanish-speaking students with limited English proficiency and a disability all had participation rates at or above 90%, which was considered high at that time. In fact, Spanish- and Somali-speaking students with limited English proficiency and disabilities had higher participation rates than their Spanish- and Somali-speaking peers without disabilities and with a variety of native language proficiency levels. Readers are cautioned to remember that percentages in some of these groups are based on small numbers.
Participation rates across reading and mathematics tended to be similar, for both students with limited English proficiency and disabilities in the three language groups, and for all students in the three language groups.
Table 3: Percent of 8th Grade Language Minority Students Participating in 1999–2000 BST Reading and Mathematics Tests
|
|
Language Group |
Reading |
Mathematics |
||||
|
Enrolled |
Tested |
Enrolled |
Tested |
||||
|
Number |
Percent |
Number |
Percent |
||||
|
SLEPD |
Hmong |
111 |
100 |
90% |
111 |
102 |
92% |
|
Spanish |
60 |
56 |
93% |
60 |
55 |
92% |
|
|
Somali |
3 |
3 |
100% |
3 |
3 |
100% |
|
|
ALL
|
Hmong |
1,365 |
1,326 |
97% |
1,365 |
1,325 |
97% |
|
Spanish |
857 |
766 |
89% |
857 |
773 |
90% |
|
|
Somali |
185 |
137 |
74% |
185 |
137 |
74% |
|
Key: SLEPD= Students with limited English proficiency and disabilities; ALL = The population of all 8th grade Hmong-, Spanish-, and Somali-speaking students regardless of language proficiency
Figure 3 graphically represents the reverse of Table 3—the percentages of students not participating by language group. Most obvious in this figure is that Hmong students tended to have fewer students with limited English proficiency and disabilities who participated compared to the total group of Hmong students. The reverse was true for Spanish and Somali students where those with limited English proficiency and disabilities had higher participation rates than students in the total group.
Figure 3. Percent of 8th Grade Language Minority Students Not Participating in 1999-2000 BST Reading Tests
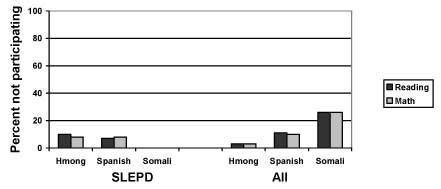
Key: SLEPD = Students with limited English proficiency and disabilities; ALL = the population of all 8th grade Hmong-, Spanish-, and Somali-speaking students regardless of language proficiency
Performance
This section examines BST performance data in a manner similar to that used to look at participation data. It starts with a look across the four major groups, followed by breakdowns of data by disability category and language group.
General Performance
As shown in Table 4, students with both limited English proficiency and disabilities had by far the smallest percentage passing either the reading or the mathematics tests at the state-determined level: just 7%. The other students with special needs, those with limited English proficiency and those with disabilities, had much higher percentages passing the same tests (33%–34% and 20–40%, respectively). More than ten times as many of the total 8th grade population passed the tests (72%–80%) when compared to students with limited English proficiency and disabilities.
For students with limited English proficiency and disabilities, as well as for students with limited proficiency only, similar percentages of students passed the reading versus the mathematics tests. However, for the total student population, and for all students with disabilities, a more noticeable difference can be seen in the percent of students passing one test compared to the other. Eight percent more of the total population of students passed reading (80%) compared to mathematics (72%). A dramatic twenty percent more of all students with disabilities passed reading (40%) compared to mathematics (20%).
Table 4. Percent of 8th Graders Passing the 1999–2000 BST Reading and Mathematics Tests
|
|
Reading |
Mathematics |
||||
|
Tested |
Passed |
Percent |
Tested |
Passed |
Percent |
|
|
SLEPD |
201 |
15 |
7% |
202 |
14 |
7% |
|
SLEP |
7,824 |
622 |
33% |
7,794 |
643 |
34% |
|
SD |
1,888 |
3,118 |
40% |
1,887 |
2,281 |
20% |
|
ALL |
65,976 |
52,567 |
80% |
65,911 |
47,305 |
72% |
Key: SLEPD = Students with limited English proficiency and disabilities; SD = Students with disabilities without limited English proficiency; SLEP = Students with limited English proficiency without disabilities; ALL = The total population of students enrolled in grade 8.
Figure 4 highlights the information from Table 4 to emphasize the size of the performance gap between students with disabilities who passed at the state-determined level and students in other groups who passed at the same level.
Figure 4. Percent of 8th Graders Passing the 1999-2000 BST Reading and Mathematics Tests
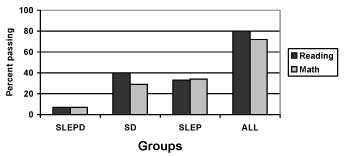
Key: SLEPD= Students with limited English proficiency and disabilities; SD= Students with disabilities without limited English proficiency; SLEP= Students with limited English proficiency without disabilities; ALL= The total population of enrolled 8th graders
Performance of Students by Disability Category
Additional context to these results is provided by examining passing rates by disability category. Table 5 shows the performance of students with limited English proficiency and disabilities, by disability category, along with the performance of all students with disabilities, also by disability category.
As with participation rates, the percentages of students within a disability category who passed either the reading or mathematics test varied a great deal across disability categories. The percentage of students passing reading or mathematics ranged from a low of 0% (those with mild-moderate mental impairments on reading and mathematics; those who were deaf and hard of hearing on mathematics) to a high of 21% (those with emotional-behavioral disabilities). The total population of students with disabilities had even greater variability with a low of 0% passing (those with moderate-severe mental impairments on both reading and mathematics) to a high of 57% passing (those with physical impairments on reading and those with visual impairments on mathematics).
Many categories of students with limited English proficiency and a disability did not have enough students enrolled to allow data to be reported. However, the data that did exist on these students showed that those with speech/language impairments appeared to have the highest passing rate (20% in reading; 13% in mathematics). Looking only at those disability categories having greater than 10 students tested, students with limited English proficiency and mild-moderate mental impairments had the lowest percentage of students passing either the reading or the mathematics test (0%). Students with limited English proficiency in other disability categories had a greater difference between the percent passing one test or the other test. For example, 15% of students with limited English proficiency and deafness-hard of hearing passed the reading test. This percentage is among the largest for students with limited English proficiency and disabilities (SLEPD) across disability categories. At the same time, 0% of deaf-hard of hearing students with limited English proficiency passed the mathematics test, which places them among the groups with the lowest percentage of students passing in that content area. A similar situation occurred for students with emotional/behavioral disorders where 7% passed the reading test but 21% passed the mathematics test.
In comparison, in the total population of students with disabilities, students with visual impairments had consistently higher passing rates than their peers in the other disability categories. Fifty-two percent of students with visual impairments passed reading while 57% passed mathematics. Students in other disability categories had much more variable percentages passing reading versus mathematics. In general, more students in every disability category passed reading than mathematics.
One general finding that is striking in these data is the relatively low percentage of students with limited English proficiency and learning disabilities who passed either the reading or mathematics component of the basic skills test.
Figure 5 provides a graphic representation of the performance data for students with limited English proficiency and disabilities as shown in the top half of Table 5. It represents only the data from groups with more than 10 students tested and illustrates both the variability in performance by group and subject and the lower performance of these students.
Figure 5. Percent of Selected Students with Limited English Proficiency and Disabilities, by Disability Category, Passing the 1999-2000 BST Reading and Mathematics Tests
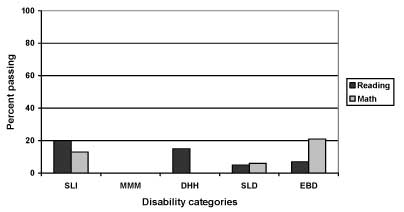
Key: SLI= Speech Language Impairment; MMM = Mild to Moderate Mental Impairment; DHH = Deaf/Hard of Hearing; SLD= Specific Learning Disability; EBD=Emotional/Behavioral Disorder
Table 5. Percent of 8th Grade Students with Limited English Proficiency with Disabilities and All 8th Grade Students with Disabilities Passing the 1999–2000 BST Reading and Mathematics Tests
|
|
Disability Group |
Reading |
Mathematics |
||||
|
Tested |
Number |
Percent Passed |
Tested |
Number |
Percent Passed |
||
|
SLEPD |
Speech/Language Impaired |
30 |
6 |
20% |
30 |
4 |
13% |
|
Mentally Impaired: Mild-Moderate |
9 |
0 |
0% |
10 |
0 |
0% |
|
|
Mentally Impaired: Moderate-Severe |
0 |
* |
* |
0 |
* |
* |
|
|
Physically Impaired |
1 |
* |
* |
1 |
* |
* |
|
|
Deaf-Hard of Hearing |
13 |
2 |
15% |
14 |
0 |
0% |
|
|
Visually Impaired |
1 |
* |
* |
1 |
* |
* |
|
|
Specific Learning Disabilities |
126 |
6 |
5% |
125 |
7 |
6% |
|
|
Emotional/Behavioral Disorders |
14 |
1 |
7% |
14 |
3 |
21% |
|
|
Deaf–Blindness |
2 |
* |
* |
2 |
* |
* |
|
|
Other Health Impaired |
4 |
* |
* |
4 |
* |
* |
|
|
Autistic |
0 |
* |
* |
0 |
* |
* |
|
|
Traumatic Brain Injury Disabled |
1 |
* |
* |
1 |
* |
* |
|
|
ALL |
Speech/Language Impaired |
518 |
264 |
51% |
516 |
231 |
45% |
|
Mentally Impaired: Mild-Moderate |
430 |
17 |
4% |
421 |
6 |
1% |
|
|
Mentally Impaired: Moderate-Severe |
12 |
0 |
0% |
11 |
0 |
0% |
|
|
Physically Impaired |
99 |
56 |
57% |
96 |
34 |
35% |
|
|
Deaf-Hard of Hearing |
148 |
50 |
34% |
149 |
46 |
31% |
|
|
Visually Impaired |
21 |
11 |
52% |
21 |
12 |
57% |
|
|
Specific Learning Disabilities |
4,091 |
1,508 |
37% |
4,093 |
1,130 |
28% |
|
|
Emotional/Behavioral Disorders |
1,956 |
892 |
46% |
1,948 |
610 |
31% |
|
|
Deaf–Blindness |
6 |
* |
* |
6 |
* |
* |
|
|
Other Health Impaired |
641 |
282 |
44% |
634 |
183 |
29% |
|
|
Autistic |
77 |
40 |
52% |
75 |
34 |
45% |
|
|
|
Traumatic Brain Injury Disabled |
26 |
11 |
42% |
26 |
6 |
23% |
Key: SLEPD = Students with limited English proficiency and disabilities; ALL = students with disabilities including those with limited English proficiency; * = fewer than 10 students tested in this category
Performance of Students by Language Group
Performance data for language minority students and for students with limited English proficiency and disabilities in the three main language groups are shown in Table 6.
Looking specifically at students with limited English proficiency and a disability within a language group, these students were much less likely to pass the reading and mathematics tests than was the total 8th grade cohort from the same language group. For example, 10% percent of Hmong students with disabilities and limited English proficiency passed reading in 1999–2000 in comparison to 44% of all Hmong students. Likewise 7% of Hmong students with disabilities and limited English proficiency passed mathematics in comparison to 46% of all Hmong students. In the same way, four percent of Spanish-speaking students with disabilities and limited English proficiency passed the reading test in comparison to 37% of all Spanish-speaking students. Seven percent of Spanish-speaking students with disabilities and limited English proficiency passed the mathematics test in comparison to 26% of all Spanish-speaking students. The numbers of Somali students with disabilities and limited English proficiency tested in 8th grade were fewer than 10 so these data are not provided.
Table 6: 1999–2000 8th Grade BST Reading and Mathematics Performance of Language Minority Students
|
|
Language Group |
Reading |
Mathematics |
||||
|
Tested |
Passed |
Percent Passed |
Tested |
Passed |
Percent Passed |
||
|
SLEPD |
Hmong |
100 |
10 |
10% |
102 |
7 |
7% |
|
Spanish |
56 |
2 |
4% |
55 |
4 |
7% |
|
|
Somali |
3 |
* |
* |
3 |
* |
* |
|
|
ALL |
Hmong |
1,326 |
583 |
44% |
1,325 |
607 |
46% |
|
Spanish |
766 |
285 |
37% |
773 |
202 |
26% |
|
|
Somali |
137 |
28 |
20% |
137 |
18 |
13% |
|
Key: SLEPD = Students with limited English proficiency and disabilities; ALL = 8th grade Hmong-, Spanish-, and Somali-speaking students, regardless of language proficiency; *= fewer than 10 students tested in this category
Participation and performance data are summarized below. The reader is reminded to observe caution regarding limited numbers in specific disability categories and the context in which standardized assessments occur. Namely, the data provided indicates aggregate results devoid of important factors such as the varied nature of instruction and the varied nature of experiences for learners from diverse cultural and linguistic groups.
Participation
Performance
This report provides one of the first publicly available examinations of participation and performance of students with limited English proficiency and a disability on a high stakes achievement test. Other reports in the series (Albus et al., 2003a; Albus, et al., 2003b) examine the participation and performance of these students on statewide accountability tests during the 1999–2000 and 2000–2001 school years.
Data on students with limited English proficiency and a disability were not widely available prior to No Child Left Behind and the legislation does not require them to be publicly reported now. However, having access to such data on students with limited English proficiency and a disability plays an important role in efforts to improve educational outcomes for these students.
Disaggregating the data on students with limited English proficiency and a disability, even though not required, can be invaluable to educators to assist them in examining the impact of programs and policies on a group of students who may receive both Special Education and English as a Second Language Services. For example, the data presented here on 8th grade students with limited English proficiency and disabilities show that these students are among the least likely to master basic reading and mathematics skills in this state. To follow up on that finding, educators at the school level might investigate the amount of time these students are pulled out of mainstream content instruction for supplemental services, the type of content instruction students receive and whether that instruction is aligned with state 8th grade content standards. These are just a sample of some of the ways the data might spur further investigation and changes in instruction that may create improved test scores for students with limited English proficiency and disabilities. A closer look might also examine whether students with limited English proficiency and disabilities are receiving appropriate test accommodations that allow them to best demonstrate what they know.
Albus, D. & Thurlow, M. (2005). Beyond subgroup reporting: English language learners with disabilities in 2002–2003 online state assessment reports (ELLs with Disabilities Report 10). Minneapolis, MN: University of Minnesota, National Center on Educational Outcomes.
Albus, D., Thurlow, M., Barrera, M., Guven, K., & Shyyan, V. (2004). Minnesota Comprehensive Assessments: 1999–2000 participation and performance of students with limited English proficiency and disabilities (ELLs with Disabilities Report 1). Minneapolis, MN: University of Minnesota, National Center on Educational Outcomes.
Albus, D., Barrera, M., Thurlow, M., Guven, K., & Shyyan, V. (2004). Minnesota Comprehensive Assessments: 2000–2001 participation and performance of students with limited English proficiency and disabilities (ELLs with Disabilities Report 4). Minneapolis, MN: University of Minnesota, National Center on Educational Outcomes.
Albus, D., Thurlow, M., & Liu, K. (2002). 1999–2000 participation and performance of English language learners reported in public state documents and web sites (LEP Projects Report 3). Minneapolis, MN: University of Minnesota, National Center on Educational Outcomes.
Liu, K., & Thurlow, M. (2000). Participation and performance of limited English proficient students: Minnesota Comprehensive Assessments in reading and math, 1998-99 (Minnesota Report 24). Minneapolis, MN: University of Minnesota, National Center on Educational Outcomes.
National Research Council. (1997). Educating one and all: Students with disabilities and standards-based reform. Washington DC: National Academy Press.
Thurlow, M., & Liu, K. (2001). State and district assessments as an avenue to equity and excellence for English language learners with disabilities (LEP Projects Report 2). Minneapolis, MN: University of Minnesota, National Center on Educational Outcomes.
Thompson, S., Thurlow, M., Spicuzza, R., & Parson, L. (1999). Participation and performance of students receiving special education services on Minnesota’s Basic Standards Tests: reading and math, 1996 through 1998 (Minnesota Report 18). Minneapolis, MN: University of Minnesota, National Center on Educational Outcomes.