Overview
Accommodations provide students with disabilities and English learners access to assessments, resulting in a better opportunity to demonstrate academic knowledge and skills. Because all students with disabilities, including those who are English learners, are required by the Individuals with Disabilities Education Act (IDEA) of 2004 and by the 2015 reauthorization of the Elementary and Secondary Education Act (ESEA) to participate in assessments, it is important to ensure that the accommodations they use do not compromise the validity of their assessment results. In addition, knowing about perceptions of accommodations and the implementation issues that might emerge helps provide context for the uses of accommodations. States can review the findings from research when making policy decisions about accommodations.
To synthesize accommodations research efforts completed across the years, the National Center on Educational Outcomes (NCEO) has published a series of reports on accommodations research. The time periods included 1999–2001 (Thompson, Blount, & Thurlow, 2002), 2002–2004 (Johnstone, Altman, Thurlow, & Thompson, 2006), 2005–2006 (Zenisky & Sireci, 2007), 2007–2008 (Cormier, Altman, Shyyan, & Thurlow, 2010), 2009–2010 (Rogers, Christian, & Thurlow, 2012), 2011–2012 (Rogers, Lazarus, & Thurlow, 2014), 2013–2014 (Rogers, Lazarus, & Thurlow, 2016), and 2015–2016 (Rogers, Thurlow, Lazarus, & Liu, 2019).
The purpose of this report is to present a synthesis of the research on test accommodations for elementary and secondary students (K–12) published in 2017. The academic literature described here encompasses empirical studies of performance comparability and validity studies as well as investigations into accommodations use, implementation practices, and perceptions of the effectiveness of accommodations. As a whole, the current research body offers a broad view and a deep examination of issues pertaining to assessment accommodations. Reporting the findings of recent research studies was the collective goal of these analyses.
Review Process
Similar to the process used in NCEO’s past accommodations research syntheses, a number of sources were accessed to complete the review of the K–12 accommodations research published in 2017. Specifically, five research databases were consulted: Educational Resources Information Center (ERIC), PsycINFO, Academic Search Premier, Digital Dissertations, and Educational Abstracts. To help confirm the thoroughness of our searches, we used the Web search engine Google Scholar to locate additional research. In addition, a hand-search of at least 50 journals was completed to ensure that no qualifying study was missed. A list of hand-searched journals is available on the NCEO website (https://nceo.info/Resources/bibliographies/accommodations/methods-for-identifying).
Online archives of several organizations also were searched for relevant publications. These organizations included Behavioral Research and Teaching (BRT) at the University of Oregon (https://www.brtprojects.org/publications/), the College Board Research Library (http://research.collegeboard.org), the National Center for Research on Evaluation, Standards, and Student Testing (CRESST; http://cresst.org/education/), and the Wisconsin Center for Educational Research (WCER; https://www.wcer.wisc.edu/publications).
The initial search was completed in December, 2017. A second search was completed in April, 2018, to assure that all articles published in 2017 were found and included in this review. Within each of these research databases and publications archives, we used a sequence of search terms. Terms searched for this review were:
- standardized (also large-scale, state, standards-based) test (also testing) changes
- standardized (also large-scale, state, standards-based) test (also testing) modification(s)
- standardized (also large-scale, state, standards-based) test (also testing)
- accommodation(s)
- test changes
- test modifications
- test accommodations
Many of these search terms were used as delimiters when searches yielded large pools of documents found to be irrelevant to the searches.
The research documents from these searches were then considered for inclusion in this review using several criteria. First, this analysis included only research published or defended (in doctoral dissertations) in 2017. Second, the scope of the research was limited to investigations of accommodations for regular assessments; hence, articles specific to accommodations for alternate assessments, accommodations for instruction or learning, and universal design in general were not part of this review. Third, research involving English learners was included only if the target population was English learners with disabilities.
Fourth, presentations from professional conferences were not searched or included in this review, based on NCEO’s criterion to include only research that would be accessible to readers and had gone through the level of peer review typically required for publication in professional journals or through a doctoral committee review. (This criterion was implemented for the first time during the 2007–2008 review.) Fifth, to be included in the online bibliography and summarized in this report, studies needed to involve (a) experimental manipulation of an accommodation; (b) investigation of the comparability of test scores across accommodated and non-accommodated conditions, or across more than one accommodated condition; or (c) examination of survey results or interview data sets about students’ or teachers’ knowledge or perceptions of accommodations. Sixth, we limited this report to research on students in United States schools; consequently, studies with only participants in other countries (e.g., Canada, Germany, etc.) were not included. Seventh, the current report includes only research pertaining to the primary and secondary levels of the education system, that is, from Kindergarten through grade 12, unlike previous NCEO accommodations research reports. Eighth, we did not include literature reviews or meta-analyses in this review, unlike in previous NCEO accommodations research reports.
These limitations do not necessarily apply to NCEO’s Accommodations for Students with Disabilities Bibliography, which is an online database (https://nceo.info/Resources/bibliographies/accommodations/bibliography). It will continue to include research in non-US settings. Also, postsecondary accommodations research will continue to be included in the Accommodations Bibliography.
To reflect the wide range of accommodations research in the K–12 system that was published in 2017, the studies are summarized and compared in the following ways: (a) publication type, (b) purposes of research, (c) research type and data collection source, (d) assessment or data collection focus, (e) characteristics of the independent and dependent variables under study, and (f) comparability of findings between studies in similar domains.
Results
Publication Type
Fourteen studies were published between January 2017 and December 2017. As shown in Figure 1, of the 14 studies, seven were journal articles, seven were dissertations, and none were published professional reports released by research organizations or entities (e.g., CRESST).
The total number of studies published on accommodations in the K–12 educational context in 2017 (N=14) increased from previous years. After applying the same criteria used in the current report retroactively to the 2015–2016 report (Rogers et al., 2019)—which removed studies in non-US contexts and literature reviews—the numbers of published K–12 studies were nine in 2015, nine in 2016, and 14 in 2017. Increases were evident in each type of publication except reports from research organizations, which was zero in all three years. Journal articles increased from four in 2015 to seven in 2016 and seven in 2017. The largest variability in numbers was for dissertations, with five in 2015, two in 2016, and seven in 2017. The 2017 review included seven journal articles from seven different journals; there were seven articles from seven different journals in 2016 and four articles from four different journals in 2015 (Rogers et al., 2019). Appendix A presents information about the publication type of each study.
Figure 1. Percentage of K–12 Accommodations Studies in 2017 by Publication Type

Purposes of the Research
Several purposes were identified in the K–12 accommodations research published in 2017. Table 1 shows the primary focus of each of the 14 studies included in this review. One study listed a single purpose (see Appendix B). The vast majority of studies sought to accomplish multiple purposes. In these cases, we identified the “primary purpose” based on the title of the work or the first-mentioned purpose in the text.
The most frequent primary purpose for research published during 2017 was score comparison to identify the effects of accommodations on test performance. In contrast, only one study was an investigation of the construct validity of assessment forms.
Table 2 shows the multiple purposes investigated by the studies. After comparing scores in order to examine the effects of accommodations on performance, the next most widely investigated purposes, of approximately half of the studies, were summarizing relevant accommodations research and delving deeply into accommodations-related issues. The high number of studies with these two purposes was related to the fact that half of the studies were by dissertation researchers. Dissertation researchers frequently sought to complete multiple purposes, and nearly all of the dissertations (n=7) addressed more than two purposes. All included extensive research summaries, and most also inquired substantively into accommodations-related issues.
Table 1. Primary Purpose of K–12 Studies in 2017
| Purpose | Number of Studies |
Percent of Studies |
|---|---|---|
| Compare scores | 10 | 71% |
| only students with disabilities (7 studies; 50% of studies) | ||
| only students without disabilities (2 studies; 14% of studies) |
||
| both students with and without disabilities (1 study; 7% of studies) |
||
| Report on implementation practices and accommodations use | 2 | 14% |
| Study/compare perceptions and preferences about use | 1 | 7% |
| Discuss issues | 0 | 0% |
| Summarize research on test accommodations | 0 | 0% |
| Compare test items | 0 | 0% |
| Evaluate test structure | 0 | 0% |
| Investigate test validity | 1 | 7% |
Appendix B presents each of the studies’ many purposes. Six studies had two purposes; all included analysis of effects of accommodations, two studies (Davis, Kong, McBride, & Morrison, 2017; Meyer & Bouck, 2017) examined participants’ perceptions, one study (Davis, Morrison, Kong, & McBride, 2017) examined accommodations use patterns, two studies (Ferrell et al., 2017; Gandhi, Ogut, Stein, Bzura, & Danielson, 2017) contained extensive discussions of related issues, and one study (Noakes, 2017) extensively reviewed related literature. Six studies (Johnson-Jones, 2017; Peterson, 2017; Polkowski, 2017; Svetina, Dai, & Wang, 2017; Taylor, 2017; Young, 2017) investigated three purposes. Kavanaugh (2017) addressed five purposes, including examination of item-level and test-level design features relevant to accommodations and assessment validity.
Table 2. All Purposes of K–12 Studies in 2017
| Purpose | Number of Studies |
Percent of Studies |
|---|---|---|
| Compare scores | 10 | 71% |
| only students with disabilities (7 studies; 44% of studies) | ||
| only students without disabilities (2 studies; 14% of
studies) |
||
| both students with and without disabilities (1 study; 7% of studies) |
||
| Discuss issues | 8 | 57% |
| Summarize research on test accommodations | 7 | 50% |
| Report on implementation practices and accommodations use | 3 | 21% |
| Study/compare perceptions and preferences about use | 4 | 29% |
| Compare test items | 2 | 14% |
| Evaluate test structure | 1 | 7% |
| Investigate test validity | 1 | 7% |
Note. Of the 14 studies reviewed for this report, 13 reported addressing two or more purposes. Thus, the number of studies totals more than 14, and more than 100%.
Research Type and Data Collection Source
Experimental and quasi-experimental designs were the two most frequent types of accommodations research published in 2017, with each encompassing over one-quarter of the 14 K–12 studies. As shown in Table 3, the researchers for all of these studies gathered the data themselves. Three other studies were descriptive quantitative designs, with most relying on secondary data. One study (Svetina, Dai, & Wang, 2017) employed a correlational design. In contrast, only two studies used primarily or only qualitative data. No studies published in 2017 used longitudinal designs, so that design is not included in Table 3.
Table 3. Research Design and Data Collection Source for K–12 Studies in 2017
| Research Design | Data Collection Source | Total | |
|---|---|---|---|
| Primary | Secondary | ||
| Quasi-experimental | 4 | 0 | 4 |
| Experimental | 4 | 0 | 4 |
| Descriptive quantitative | 1 | 2 | 3 |
| Descriptive qualitative | 2 | 0 | 2 |
| Correlation/prediction | 0 | 1 | 1 |
| Totals | 11 | 3 | 14 |
We observed a substantial difference in the number of studies published in 2017 that used primary data collection sources when compared to those which used secondary data collection sources. Eleven (79%) used primary sources and three used secondary sources (21%). In our previous report (Rogers et al., 2019), when reviewing two years of research (2015 and 2016), we found that the difference was smaller—approximately 60% versus 40%. (Appendix A presents research designs and data collection sources for individual studies.)
Data Collection Methods and Instruments
The 2017 research we analyzed used the methods shown in Figure 2 to collect study data. Seventy-nine percent of the studies (n=11) used performance data acquired through academic content testing. In some of the cases (e.g., Gandhi et al., 2017), tests were administered as part of the study; in other cases (e.g., Svetina et al., 2017), extant data sources were used. Interviews (n=3, 21%) and surveys (n=5, 36%) were other common data sources, while observations and grade records comprised less common sources. One study (Taylor, 2017) also collected other data (i.e., disciplinary incident counts). Nine studies (64%) reported using more than one method or tool to gather data. The most common combined collection methods were testing and surveys (n=4, 29%). See Appendix A for additional details about each study’s data collection methods.
Figure 2. Data Collection Methods Used in K–12 Studies in 2017
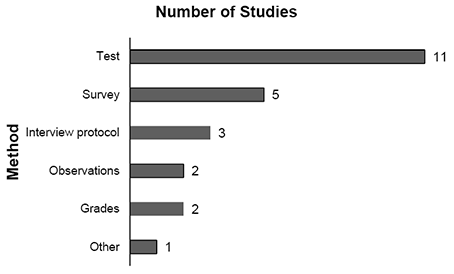
Note. Of the 14 studies reviewed for this report, nine reported using two data collection methods. Thus, the total numbers represented in this figure totals more than 14.
All of the studies published in 2017 used some type of data collection instrument (see Table 4). The terms used in Table 4 are defined as follows:
- “Surveys” refers to items of an attitudinal or self-report nature.
- “Tests” is defined as course- or classroom-based.
- “Assessments” indicates statewide or large-scale assessments in scope.
- “Protocols” refers to sets of questions, usually presented in an interview format.
- “Measures” refers to norm-referenced academic achievement instruments.
No cognitive ability instruments were employed in the studies published in 2017. All of the instruments were placed into seven categories:
- Surveys or academic tests developed by education professionals or drawn by researchers from other sources
- Non-academic protocols or surveys developed by study authors
- State criterion-referenced academic assessments
- Criterion-referenced academic achievement assessments
- Norm-referenced academic achievement measures
- Norm-referenced cognitive ability measures
- Other
In 10 studies, surveys or academic tests developed by researchers, or other education professionals, using sources outside of the study were used. This was the most commonly-used type of instruments. An example of a survey in the reviewed studies was the Checklist of Learning and Assessment Adjustments for Students (CLAAS) (Davies, Elliott, & Cumming, 2016). An example of an academic test that was created used the 2007 math national dataset drawn from the National Assessment of Educational Progress (National Center on Education Statistics, n.d.).
Non-academic protocols developed by the authors of the studies were used in seven studies. Examples included questionnaires with rating scales of social validity checks on the students’ testing experiences (Young, 2017), and interview protocols for uncovering parents’ and educators’ perceptions and attitudes (Peterson, 2017).
Table 4. Data Collection Instrument Types for K–12 Studies in 2017
| Instrument Type | Number of Studiesa |
Percent of Studiesa |
|---|---|---|
| Surveys or academic tests developed by professionals or
researchers using sources outside of current study |
10 | 71% |
| Non-academic protocols or surveys developed by study author/s |
7 | 50% |
| State criterion-referenced assessments | 4 | 29% |
| Criterion-referenced academic achievement measures | 2 | 14% |
| Norm-referenced academic achievement measures | 2 | 14% |
| Norm-referenced cognitive ability measures | 0 | 0% |
| Otherb | 2 | 14% |
a Ten studies (71%) used more than one type of instrument; therefore,
numbers total more than the 14 studies represented, and percentages
total more than 100.
b Other: see Appendix C, Table C-1 for specific information in
Peterson, 2017; and Taylor, 2017.
State criterion-referenced assessments included those of Massachusetts, New Hampshire, Rhode Island, Vermont, and Virginia, as well as released test items from assessment entities and several states (Davis, Kong, et al., 2017; Davis, Morrison, et al., 2017; Ferrell et al., 2017; Gandhi et al., 2017; Svetina et al., 2017). Criterion-referenced academic achievement measures, including the Stanford Achievement Test (Harcourt, 1996) and the Scholastic Reading Inventory (Scholastic, 2007) were also used, often as checks on test validity. Three norm-referenced academic achievement measures were used in one or more studies, including the Woodcock-Johnson III Diagnostic Reading Battery (Woodcock, Mather, & Schrank, 2004), the Test of Word Reading Efficiency 2 (Torgesen, Wagner, & Rashotte, 2012), and the Woodcock Reading Mastery Tests-Revised (Woodcock, 1987). Over 60% of all studies (n=9) used instrumentation of more than one kind. We present a complete listing of the instruments used in each of the studies in Table C-1 in Appendix C, including the related studies or other sources for these instruments, when available.
Content Area Assessed
Eleven studies published during 2017 focused on accommodations used in specific academic content areas. As shown in Table 5, reading was the most commonly studied content area. Table 5 was constructed by applying the same criteria used in the current report retrospectively to the data from the 2015–2016 report (Rogers et al., 2019) and the 2013–2014 report (Rogers et al., 2016). In four of the five years of our accommodations research literature reviews (all except 2016), reading and mathematics were the most common content areas for accommodations research, yet have varied in terms of which of the two was the most common content area in any particular year.
Cumulatively, science was the third most frequent content area, with 12 total studies across the five years of research reviews. In 2017, over one-third of studies examined accommodations impact data for more than one content area, which was the largest proportion of studies in the five years. The inclusion of multiple content area analyses varied in frequency across the five years. There was little change across years in the number of studies addressing writing, “other language arts,” and social studies. (See Appendix C, Table C-2, for additional details about the content areas.)
Table 5. Academic Content Area Assessed in K–12 Studies across Three Reports
| Content Area Assessed | 2013a | 2014b | 2015c | 2016 | 2017d |
|---|---|---|---|---|---|
| Mathematics | 3 (33%) | 5 (50%) | 3 (33%) | 1 (14%) | 5 (45%) |
| Reading | 5 (56%) | 4 (40%) | 3 (33%) | 1 (14%) | 6 (55%) |
| Writing | 0 (0%) | 1 (10%) | 2 (22%) | 1 (14%) | 1 (9%) |
| Other Language Artse | 2 (22%) | 0 (0%) | 1 (11%) | 0 (0%) | 2 (18%) |
| Science | 3 (33%) | 1 (10%) | 1 (11%) | 4 (57%) | 3 (27%) |
| Social Studies | 0 (0%) | 0 (0%) | 1 (11%) | 0 (0%) | 0 (0%) |
| Multiple contentf | 3 (33%) | 1 (10%) | 2 (22%) | 0 (0%) | 4 (36%) |
| Total (of Relevant Studies) | 9 | 10 | 9 | 7 | 11 |
a Studies in 2013 included studies that addressed more than one
content area (i.e., two content areas, three content areas).
b Studies in 2014 included a study that addressed two content areas.
c Studies in 2015 included studies that addressed two content areas.
d Studies in 2017 included studies that addressed more than one
content area (i.e., two content areas, three content areas).
e Detailed descriptions of what constituted “Other Language Arts” for
the 2017 studies can be found in Appendix C, Table C-2.
f Because some studies investigated effects in more than one content
area, the percentages total more than 100.
Research Participants
The studies in this analysis of accommodations research published in 2017 included participants in several roles (see Figure 3 and Appendix D). A majority of the studies included only students: n=11, or over 75%. Only educators participated in one study (Polkowski, 2017). The remaining studies had combinations of participant populations. Students and teachers were the participants in the Johnson-Jones (2017) study which examined perspectives on use and practices related to academic accommodations. Peterson (2017) sought the viewpoints of the parents and teachers of students with various cognitive disabilities on the students’ use of assistive technology for supporting communication and academic performance.
Figure 3. Types of Research Participants for K–12 Studies in 2017
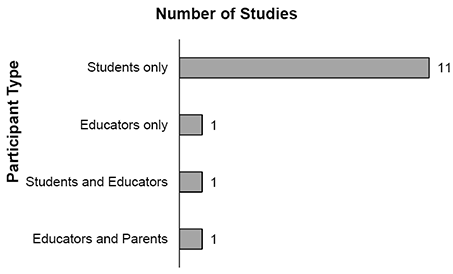
Table 6 details the size and composition of the K–12 student groups in the research studies published during 2017. For additional detail by study, see Appendix D. The size of the participant groups varied from three (Noakes, 2017) to 4,999 (Kavanaugh, 2017). The largest single set of studies published in 2017 involved only students with disabilities (8 studies); in comparison, only two studies (Davis, Kong, et al., 2017; Davis, Morrison, et al., 2017) had participants who were only students without disabilities. Two studies (Gandhi et al, 2017; Kavanaugh, 2017) compared groups of students using relatively equal numbers of students with and without disabilities, though no studies directly compared data from an identical number of students from both populations. Two studies engaged only educators (Polkowski, 2017) or educators and parents (Peterson, 2017) as participants, and one study (Johnson-Jones, 2017) had both educators and students as participants.
Table 6. Participant Sample Sizes and Ratio of K–12 Students with Disabilities in 2017
| Number of Research Participants by Study |
Number of Studies by Proportion of Sample Comprising
Individuals with Disabilities |
||||
|---|---|---|---|---|---|
| 0–24% | 25–49% | 50–74% | 75–100% | Total | |
| 1–9 | 0 | 1 | 0 | 3 | 4 |
| 10–24 | 1 | 0 | 0 | 0 | 1 |
| 25–49 | 1 | 0 | 0 | 1 | 2 |
| 50–99 | 0 | 0 | 0 | 0 | 0 |
| 100–249 | 0 | 1 | 0 | 1 | 2 |
| 249–999 | 2 | 0 | 0 | 1 | 3 |
| 1,000–4,999 | 0 | 1 | 0 | 1 | 2 |
| Total | 4 | 3 | 0 | 7 | 14 |
School Level
Students in the elementary, middle, and high school levels participated in 12 of the 14 studies published in 2017 (see Table 7; also, see Appendix D for students’ specific grade levels when available). Most studies included students in more than one grade; only four studies (Gandhi et al., 2017; Gohanna, 2017; Kavanaugh, 2017; Meyer & Bouck, 2017) examined student data for a single grade level. Four studies involved students from more than one school level: two studies (Ferrell et al., 2017; Johnson-Jones, 2017) had elementary and middle school participants, one study (Taylor, 2017) had middle and high school participants, and one study (Noakes, 2017) had participants from all three school levels.
Table 7. School Levels of Research Participants for K–12 Studies in 2017
| Academic Level of
Study Participants |
Number of Studiesa |
Percent of Studiesa |
|---|---|---|
| Elementary school (K-5) | 4 | 29% |
| Middle school (6–8) | 7 | 50% |
| High school (9–12) | 6 | 38% |
| Not applicable | 2 | 14% |
a Four studies (29%) had participants in more than one school level; therefore, the numbers total more than the 14 studies represented, and percentages total more than 100.
Disability Categories
The K–12 accommodations research published in 2017 addressed a number of disability categories (see Appendix D for details). As shown in Table 8, two studies did not specify disability categories of student participants, and two studies did not include students in the sample. Of the remaining 11 studies, the most commonly studied student disability category was learning disabilities (n=5); two studies (Meyer & Bouck, 2017; Young, 2017) included only participants with learning disabilities, and one other study (Gandhi et al., 2017) compared students with learning disabilities to students without disabilities.
In addition to learning disabilities, some studies included students from only one disability category. For example, Johnson-Jones sought the perspectives of students with visual impairments and their teachers; Noakes (2017) addressed the views of students with traumatic brain injuries; and Wang, Hartman, Jahromi, and Tversky (2017) examined data from students with hearing impairments. Two studies (Ferrell et al., 2017; Taylor, 2017) included students from six or more disability categories.
Table 8. Disabilities Reported for Research Participants for K–12 Studies in 2017
| Disabilities of Research Participants |
Number of Studiesa |
Percent of Studiesa |
|---|---|---|
| Learning disabilities | 5 | 36% |
| Autism | 2 | 14% |
| Blindness/visual impairment | 2 | 14% |
| Emotional/behavioral disability | 2 | 14% |
| Physical disability | 2 | 14% |
| Speech/language | 2 | 14% |
| Deafness/hearing impairment | 1 | 7% |
| Traumatic brain injury | 1 | 7% |
| Attention problem | 0 | 0% |
| Multiple disabilities | 0 | 0% |
| Intellectual disabilities | 0 | 0% |
| Otherb | 1 | 7% |
| No disabilityc | 4 | 29% |
| Not specified | 2 | 14% |
| Not applicable | 2 | 14% |
a Several studies had participants with more than one disability
category; therefore, the numbers in this table total more than the 14
studies represented, and percentages total more than 100.
b One study identified some participants as having “neurological” and
“sensory” disabilities, with no further clarifying information.
c These four studies included students without disabilities as some
or all of the participants.
Types of Accommodations
The specific types of accommodations included in the 2017 published research are summarized in Table 9. Presentation accommodations comprised the most frequently studied type of accommodation, with 11 studies. Response accommodations and equipment/materials accommodations were investigated in approximately half of the studies.
The most widely studied presentation accommodation was oral delivery. In previous NCEO accommodations research reports, we combined the three ways that this accommodation was provided: (a) by a test administrator live and in-person, (b) with a recorded human voice, and (c) as simulated speech via text-to-speech devices or software. For additional information, see Table E-2 in Appendix E which provides details about each of these separately. Oral delivery presented live and in-person was investigated in four studies, recorded delivery was investigated in one study, and simulated speech was investigated in two studies. Oral delivery was investigated in six studies in all, with one study (Meyer & Bouck, 2017) comparing the impact of live, in-person, oral delivery and text-to-speech software. Electronic administration—called “computer administration” in previous reports—was investigated in four studies. This accommodation encompasses three types of accommodation: (a) how tests are presented to students, (b) computer or electronic tablet equipment, and (c) the way students record their test item responses. Another response accommodation, dictated response, was studied relatively frequently in the 2017 published studies (n=3). Several studies (n=11) included accommodations from more than one category. Of those, six studies included accommodations from each of three accommodations types, and five studies included accommodations from two accommodations types. A complete listing of accommodations examined in each study is provided in Appendix E Table E-1, and by accommodation type in Tables E-2 through E-6.
Table 9. Accommodations in Reviewed Research in 2017
| Accommodations Type | Number of Studiesa |
|---|---|
| Presentation | 11 |
| Response | 8 |
| Equipment/Materials | 6 |
| Timing/Scheduling | 2 |
| Setting | 2 |
a Eleven studies investigated accommodations from more than one category; therefore, the numbers in this table total more than the 14 studies included in the review.
Research Findings
The findings of the studies on accommodations published in 2017 are summarized according to the nature of the studies. These findings were consistent with the stated purposes and focuses of the studies. The findings included sets of research about specific accommodations, such as oral delivery. Other studies examined impacts of aggregated sets of accommodations commonly called “bundles.” We also present findings on the impact of unique accommodations—those examined in only one study—such as audible image description (also called “audio describe”) and dictated response through speech recognition software (see Appendix F). We report on perceptions of accommodations, including those of student test-takers, educators, and students’ parents. We summarize the findings of the accommodations, and describe implementation conditions as well as patterns or incidence of use of various accommodations across large data sets. This report also presents findings by academic content areas: math, reading, and science. In Appendix F, we provide details on individual studies.
Impact of Accommodations
Research published in 2017 that examined the effects of accommodations on assessment performance for K–12 students with disabilities totaled 10 studies (see Figure 4; see also Appendix F for details about each of these studies). We report here the effects of three discrete accommodations—oral delivery live and in-person, oral delivery with simulated voice via text-to-speech software, and electronic administration—along with several aggregated sets of accommodations. See Appendix F for further details on accommodations with only one associated finding.
Figure 4. Effects of Specific Accommodations for K–12 Studies in 2017
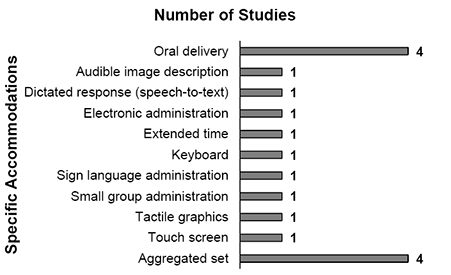
Note. Seven studies examined the separate impacts of several accommodations; therefore, the total exceeds the number of studies represented (n=10).
The single most investigated accommodation in 2017 was oral delivery, which was investigated in four studies (Gandhi et al., 2017; Meyer & Bouck, 2017; Svetina et al., 2017; Young, 2017). Oral delivery was provided either in-person by a test administrator or through text-to-speech, which uses text-reading computer software employing computer-simulated voicing. Most of the studies examined the impact of either live/in-person only (Gandhi et al., Svetina et al.) or text-to-speech only conditions (Young); one study (Meyer & Bouck) compared performance using in-person oral delivery to text-to-speech oral delivery. For these four studies, one study (Gandhi et al.) had comparison groups of students without disabilities, while the other studies had either (a) very small numbers of students with disabilities in both accommodated and unaccommodated testing conditions (Meyer & Bouck, Young) or (b) very large extant data sets of students with disabilities in which post-hoc analyses of individual score patterns were completed (Svetina et al.).
In addition, two of the five studies examining effects of aggregated sets of accommodations provided findings combined oral delivery with one or more other accommodations. In Wang et al. (2017), one of the assessment conditions included both signed administration and oral delivery by a human voice in a video recording for some of the student participants who had hearing impairments yet were fluent in American Sign Language. Taylor (2017) provided findings enlisting a comparison of students with various disabilities using a combination of live/in-person oral delivery and calculator accommodations with similar students not using either accommodation.
Gandhi and her colleagues (2017) presented all participants with three different degrees of orally-delivered reading assessment items, and compared reading performance across three groups of grade 4 students—average readers, students with reading difficulties, and students with reading disabilities. This study concluded that students with reading disabilities benefited differentially more from most or all test elements being read to them, including text passages, in contrast to the other participant groups. Average readers performed essentially the same for accommodated and non-accommodated conditions, and showed slightly higher scores on the non-accommodated test version. Students with reading difficulties (but who did not have identified disabilities) benefited, but to a lesser degree, from two of the accommodated versions, and there was no significant mean score difference between being read only test items and being read both test items and reading passages.
Meyer and Bouck (2017) concluded that oral delivery did not support any significant reading comprehension performance improvements for all four 7th grade students with disabilities, with minimal effect sizes. Further, participants did not score significantly differently when using one oral delivery format over the other.
Svetina and colleagues (2017) compared scoring patterns for a large national extant data set of students with various disabilities using different accommodations—oral delivery by test administrator, extended time, and small group setting—on a grade 8 mathematics assessment (NAEP). They found that about half of the students using oral delivery demonstrated mastery of quantitative reading, yet the remaining 22 skills were mastered by fewer than half of those students. In contrast, a larger proportion of students using only small group administration reached performance mastery, while students using only extended time did not perform as well as students using oral delivery (alone). Further, students with disabilities not using accommodations scored higher than all accommodated test-taking groups.
Young (2017) found that three of the four grade 9 students with learning disabilities performed significantly better on various reading-related skills when using text-to-speech than when they did not have accommodations. In sum, oral delivery benefited students with disabilities in performance on a math assessment and on reading assessments in most studies.
Four studies (Davis, Kong, et al., 2017; Davis, Morrison, et al., 2017; Ferrell et al., 2017; Wang et al., 2017) reported findings on the impact of aggregated sets, or bundles, of accommodations. Due to the unique combinations of these sets of accommodations, and the fact that none of them are exactly the same bundle of accommodations, individual findings are reported only in Appendix F. Some of these studies compared impacts of unique individual accommodations with aggregated sets of accommodations; therefore, these studies are cited more than once in this section.
We identified separate reportable findings on the impact of nine unique accommodations—that is, accommodations that were the focus of just one study. Effects of these nine unique accommodations were examined by seven studies:
- keyboard and touch screen (Davis, Kong, et al., 2017; Davis, Morrison, et al., 2017)
- audible image description and tactile graphics (Ferrell et al., 2017)
- electronic administration compared to paper-based format (Kavanaugh, 2017)
- dictated response (Noakes, 2017)
- extended time and small group administration (Svetina et al., 2017)
- sign language administration (Wang et al., 2017)
Findings for each of these unique accommodations are reported in Appendix F.
Perceptions about Accommodations
Four studies (Davis, Kong, et al., 2017; Meyer & Bouck, 2017; Peterson, 2017; Young, 2017) provided findings on perceptions about accommodations. Nearly all of them provided information only about students’ perceptions, although one study (Peterson, 2017) highlighted the perceptions of students’ parents and educators. One study yielded perceptions about accommodations (Young), while two studies provided detail about students’ preferences between two accommodations (Davis, Kong, et al.; Meyer & Bouck).
Students with learning disabilities in grade 9 indicated generally positive experiences when using accommodations, specifically oral delivery provided live and in-person by a test administrator (Young, 2017).
Along with analyzing the impact of desktop or laptop computer and keyboard versus electronic tablet with touch-screen on math, reading, and science assessment performance for high school students without disabilities, Davis, Kong, and their colleagues (2017) reported mixed results on students’ preferences between the two response-related accommodations. The largest proportion of students preferred using paper only or paper and computer screen; a much smaller proportion preferred using a touchscreen to respond. Study participants who reported that they had previous tablet-delivered test experience expressed more positive perceptions about using tablets during testing than other participants. Meyer and Bouck (2017) indicated that grade 7 students with learning disabilities expected that text-to-speech oral delivery would be better at the beginning of the study; yet by the end of the study, three of four preferred live/in-person oral delivery. When the two modes of oral delivery were compared, there were no significant performance differences.
Just one study (Peterson, 2017) examined the perceptions of students’ parents and educators about accommodations. Information about these perception findings are provided in Appendix F.
Implementation and Use of Accommodations
Four studies (Davis, Morrison, et al., 2017; Johnson-Jones, 2017; Peterson, 2017; Polkowski, 2017) had findings related to accommodations use and implementation issues. In three studies (Davis, Morrison, et al., 2017; Johnson-Jones, 2017; Polkowski, 2017), researchers described patterns of accommodations use, while two studies (Johnson-Jones, 2017; Peterson, 2017) provided information about educators’ accommodations implementation practices.
Davis, Morrison, and colleagues (2017) reported survey findings from students without disabilities. This study found that male participants had higher scores in reading when tablets were used (compared to computers). For females, there was not a similar differential between tablets and computers. They stated, “student survey responses did not reveal any differential use in devices between genders which would offer an explanation in terms of either experience level with devices or novelty of devices” (p. 44).
Johnson-Jones (2017) reported findings from interviews with three students with visual impairments in grades 3-7 and their educators. A common theme was that students had uneven access to specific supports; for example, one student indicated only using closed circuit television (CCTV) for magnification during the state assessment, and that this ‘high-tech’ magnification device was not available for classroom use. All three students reported in detail about their limited access or lack of access to academic materials, despite specifically asking for supports such as recorded lecture notes and other materials. The educators—general and special education teachers and a paraprofessional—indicated at various points in interviews that they did not have sufficient training or resources for providing vision-related supports for the students. These educators readily provided access by reading materials aloud, yet some engaged students’ peers for supporting students’ need for access to materials. Johnson-Jones discussed related themes, such as students’ sense of their disabilities, and their negative emotions associated with the limitations that they experienced with instructional supports.
Peterson (2017) examined the accommodations practices and barriers to accommodations implementation of six special educators of students with cognitive disabilities. The teachers identified four barriers to implementation: “their own comfort with technology, their awareness of appropriate assistive technology solutions for their students, school or district support, and financial considerations” (p. 59). Teachers lacked both information about resources, and practical knowledge of how to use them. Further, the presence or absence of a technology-oriented professional on the IEP team was related to whether students had assistive technology listed in their IEPs. Peterson commented that the first two implementation barriers were associated with the degree to which educators had an accepting attitude toward assistive technology use, and that acceptance and knowledge was less if educators had not received relevant training for incorporating assistive technology into their teaching practices.
Polkowski (2017) reported on findings from an analysis of data from the Checklist of Learning and Assessment Adjustments for Students (CLAAS) (Davies et al., 2016). This checklist was completed by 45 educators from three school districts. The CLAAS identified eight domains of accommodations: (a) assistance prior to administration of test, (b) assessment directions, (c) assistance during assessment, (d) changes in test format, (e) equipment or assistive technology, (f) motivation, (g) scheduling, and (h) setting. Further, accommodations could be provided during instruction, classroom assessments, and large-scale assessments. Polkowski indicated different rates of receiving accommodations across these contexts: 49% of the students received accommodations during classroom learning, 46% received accommodations during classroom assessments, and 26% had accommodations during large-scale assessments.
Polkowski (2017) also described rates of using accommodations domains or types in the three contexts. For instance, three domains—Setting Adjustments, Assistance Prior to Testing, and Equipment/Assistive Technology—were used at essentially the same rates across the settings. In contrast, the Formats domain showed significantly different prevalence for classroom learning compared to large-scale assessment. In a summative comparison of all domains, one comparison showed a significant difference between conditions during instruction and the state assessment. In contrast, no significant differences were reported between the conditions during learning and assessment in the classroom for any of the eight accommodations domains. Effect sizes were also reported for all of these results. Alignment analyses yielded similar patterns, with the lowest alignments between classroom learning and large-scale assessment conditions, and consistently highest (for all domains) between classroom learning and classroom assessment conditions.
Validity
The topic of validity, specifically individual item comparability, was addressed in the findings of one study (Kavanaugh, 2017). He concluded from his analysis that a computer-administered assessment with embedded supports did not affect the science construct. Further details about construct validity in this study are reported in Appendix F.
Accommodations by Academic Content Assessments
As in previous reports, we analyzed research findings according to the academic content area included in each of the studies. The content areas, presented in terms of the number of studies including them are: reading (n=6), mathematics (n=5), science (n=3), other language arts (n=2), and writing (n=1) (see Figure 5). For each content area, we examined the impact on assessment performance, perceptions about accommodations, construct validity, and implementation and use. (See Appendix F for more detailed explanation of the findings of each study.)
Figure 5. Findings by Content Areas for K–12 Studies in 2017
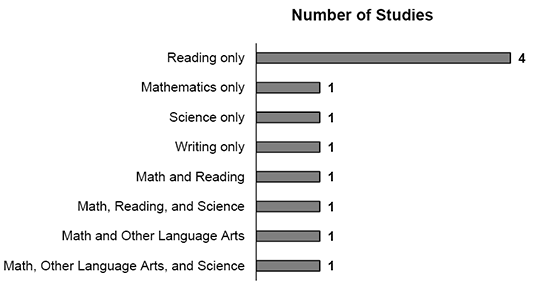
n=11
Reading. Three of the six studies on accommodations effects for reading assessments included only students with disabilities—that is, there was no comparison group of students without disabilities (Meyer & Bouck, 2017; Wang et al., 2017; Young, 2017). One study (Gandhi et al., 2017) included a comparison group of students without disabilities. The other two studies (Davis, Kong, et al., 2017; Davis, Morrison, et al., 2017) involved only students without disabilities; that is, there were no performance comparisons between students with and without disabilities.
Three of the six studies using reading assessments specifically measured the impact of oral delivery (Gandhi et al., 2017; Meyer & Bouck, 2017; Young, 2017). Two studies (Davis, Kong, et al., 2017; Davis, Morrison, et al., 2017) reported on analyses of versions of electronic administration (keyboard or touchscreen) to respond to test items. The sixth study (Wang et al., 2017) reported on comparisons of video-recorded presentations of either sign language only or simultaneous signed and spoken English.
Accommodations benefited the reading performance of at least some students with disabilities in three studies (Gandhi et al., 2017; Wang et al., 2017; Young, 2017). Two of these studies provided findings from comparisons across more than one accommodation condition. Gandhi and colleagues (2017) found that grade 4 students with reading-related disabilities significantly benefited most from two of the in-person oral delivery conditions: test item stems; answer choices; and proper nouns, with or without text segments. Wang and colleagues (2017) indicated that American sign language (ASL) alone was more beneficial for students in grades 5–8 with hearing impairments who used hearing technologies than when ASL was combined with spoken language as “SIMCOM” (simultaneous sign and speech). In contrast, Meyer and Bouck (2017) found that the grade 7 students with learning disabilities, as a group, did not substantially benefit from either in-person or text-to-speech oral delivery. The other two studies (Davis, Kong, et al., 2017; Davis, Morrison, et al., 2017)—using the same participant data set but different analyses—found that electronic administration devices (computer with physical keyboard and tablet with touchscreen) did not result in significantly different performance patterns for students without disabilities. In sum, these reading assessment accommodations benefited some students with disabilities, and had no effect on the performance of other students with disabilities.
Four of the studies examined aspects of accommodations in addition to their effects on reading performance. Specifically, three studies (Davis, Kong, et al., 2017; Meyer & Bouck, 2017; Young, 2017) yielded findings on perceptions of accommodations, and one study (Davis, Morrison, et al., 2017) provided information on students’ use of different devices for reading assessments.
Meyer and Bouck (2017) reported that grade 7 students with learning disabilities preferred oral delivery in-person by a test administrator over text-to-speech. Young (2017) indicated that students with learning disabilities in grade 9 had generally positive experiences when using accommodations, specifically oral delivery provided live and in-person by a test administrator. Davis, Kong, and their colleagues (2017) reported findings on perceptions as well as preferences for high school students without disabilities. Students did not perceive any differences in reading test content difficulty between devices. Preferences for different device options during assessments varied, with the largest proportions of participants preferring paper only or paper and computer screen, and much smaller proportions preferring touchscreen response. Participants with previous tablet-delivered test experience also expressed more positive perceptions regarding the use of tablets during testing. Davis, Morrison, and their colleagues (2017) noted that there were some reading test performance differences based on demographic variables. Specifically, male students scored slightly higher when using electronic tablet touchscreens for responding to items than when using computers with keyboards; however, male and female students showed no pattern of experience differences with either device that might account for these score differences.
Mathematics. All five of the studies involving mathematics reported findings on the effects of accommodations on performance. Three studies (Ferrell et al., 2017; Svetina et al, 2017; Taylor, 2017) included only students with disabilities. Two studies (Davis, Kong, et al., 2017; Davis, Morrison, et al., 2017) included only students without disabilities. None of the math-related studies provided comparisons across student groups.
Two studies using math assessments examined oral delivery accommodations. One study (Svetina et al., 2017) reported on the separate impact of oral delivery presented live by a test administrator, while the other study (Taylor, 2017) reported on the impact of the combination of live/in-person oral delivery and calculator accommodations.
Ferrell (2017) provided findings on the separate effects of tactile graphics, audible descriptions of images, as well as the impact of the combination of tactile graphics and audible descriptions on math performance by students with visual impairments and students with print disabilities in grades 3–8. Two studies (Davis, Kong, et al., 2017; Davis, Morrison, et al., 2017) reported on analyses of electronic administration requiring responses to test items either via keyboard or touchscreen.
Accommodations benefited the math performance of some students with disabilities in two studies (Ferrell et al., 2017; Svetina et al., 2017). Ferrell and colleagues (2017) found that students with print disabilities in grades 3–8, and students with visual impairments who could read print, performed no differently in math, on average, when receiving or not receiving the audible image description accommodation. In contrast, students with visual impairments who read braille performed highest when using audio description alone. Comparing NAEP math assessment extant data for students with various disabilities, Svetina (2017) found that about half of students using only oral delivery demonstrated mastery of quantitative reading, yet the remaining 22 skills were mastered by fewer than half of those students. In contrast, a larger proportion of students receiving only a small group administration accommodation achieved mastery level performance, while students using only extended time did not perform as well as students using oral delivery alone. Students with disabilities not using accommodations scored higher than all accommodated test-taking groups.
In one of the studies focused on math, the provided accommodation had a negative effect on performance. Taylor (2017) found in an analysis of an extant data set that students in grades 6–12 with various disabilities who received a combination of both oral delivery in-person by a test administrator and calculator accommodations scored significantly lower on state math assessments than similar students with disabilities not provided those accommodations.
The other two studies (Davis, Kong, et al., 2017; Davis, Morrison, et al., 2017)—using the same participant data set but different analyses—found that the electronic administration devices (computer with physical keyboard and tablet with touchscreen) did not result in significantly different performance patterns for students without disabilities. In sum, these math assessment accommodations benefited some students with disabilities, had no performance effect for other students with disabilities, and had a negative effect for still other students with disabilities.
Two studies (Davis, Kong, et al., 2017; Davis, Morrison, et al., 2017) examined other aspects of accommodations, in addition to their effects on math assessments. Davis, Kong, and colleagues (2017) reported on perceptions and preferences from students without disabilities, finding that these students did not perceive any differences in math test content difficulty between devices. Preferences for device options during assessments varied, with the largest proportions of participants preferring to use paper only or paper and computer screen, and a much smaller proportion preferring to use a touchscreen. Participants with previous tablet-delivered test experience expressed more positive perceptions about using tablets during testing. Davis, Morrison, and colleagues (2017) reported on students’ experiences with the two devices for administering and responding to test items, finding there were no differences for demographic groups in use experiences for the students without disabilities. (See Appendix F for more detailed explanation of the findings of each study.)
Science. The three studies in science (Davis, Morrison, et al., 2017; Ferrell et al., 2017; Kavanaugh, 2017) pertained to different participant groups, different accommodations, different purposes, and different findings, making them difficult to compare with one another.
Ferrell (2017) compared science assessment performance of students with visual impairments and students with print disabilities in grades 3–8. Ferrell found no individual effects of audible image description or tactile graphics—that is, there was no benefit in science for students with print disabilities or for students with visual impairments who could read print. Audio description of graphics alone benefited students with visual impairments who did not read print. Further, due in part to apparent difficulties with the tactile graphics accommodation, the researchers concluded that audible image description in combination with tactile graphics in science had the worst effect of the three test conditions for non-print reading students with visual impairments. Davis, Morrison, and their colleagues (2017) reported no significant performance differences in science for students without disabilities when using electronic tablet touchscreens for responding to items compared to when using computers with keyboards. Examining an extant assessment data set of high school students with various unspecified disabilities and students without disabilities, Kavanaugh (2017) concluded that the computer-administered assessment with embedded supports did not affect the science construct.
Other Language Arts. Two studies (Ferrell et al., 2017; Taylor, 2017) presented findings on the effects of accommodations provided to students with disabilities when completing state assessments of English language arts. Ferrell and colleagues (2017) found that students with print disabilities in grades 3–8 scored no differently on average when provided audible image description than when not provided this accommodation. Students with visual impairments who read braille scored significantly higher with audio description alone on ELA assessments. Further, due in part to apparent difficulties with the tactile graphics accommodation, the researchers concluded that audible image description in combination with tactile graphics in ELA had the worst effect of the three test conditions for non-print reading students with visual impairments. Taylor (2017) found that students in grades 6–12 with various disabilities who received a combination of oral delivery in-person by a test administrator and calculator accommodations scored significantly lower on state English language arts assessments than similar students with disabilities who did not receive either accommodation. In sum, these English language arts assessment accommodations benefited some students with disabilities, had no performance effect for some students with disabilities, and also had a negative effect for other students with disabilities.
Writing. One study (Noakes, 2017) provided findings for writing. The findings pertained to perceptions of and implementation of accommodations. Specific findings on the impact of writing accommodations are reported in Appendix F.
Discussion
This report provided a snapshot of accommodations research literature involving K–12 students published in 2017. This is a narrower focus than previous NCEO accommodations research reports (Cormier et al., 2010; Johnstone et al., 2006; Thompson et al., 2002; Rogers et al., 2012; Rogers et al., 2014; Rogers et al., 2016; Rogers et al., 2019; Zenisky et al., 2007), which have incorporated more than one year of research literature and encompassed elementary, secondary, and postsecondary education settings. We highlighted the types of accommodations that were studied, the purposes of the research, research types, data sources, and characteristics of the independent and dependent variables under study. We examined the comparability of findings between studies in similar domains (e.g., by specific accommodations and their performance effects), and we examined findings by academic content area.
Reading and mathematics were the content areas most frequently addressed in the studies included in this analysis, each comprising about half of the 11 studies that used content assessments. Science comprised over one quarter of the studies focused on a content area. Many studies included more than one content area. These proportions are similar to those noted in previous NCEO accommodations research reports (Cormier et al., 2010; Johnstone et al., 2006; Thompson et al., 2002; Rogers et al., 2012; Rogers et al., 2014; Rogers et al., 2016; Rogers et al., 2019; Zenisky et al., 2007). The proportions for science are similar to recent reports; in early reports, science was a less common content area for K–12 accommodations research. Students were the participant group in nearly two-thirds of the studies. Students with learning disabilities (LD) were participants in about one-third of the studies reported, and were more likely to be included in the research samples than any other single disability category. Other disability categories receiving attention by some studies included autism, blindness/visual impairment, emotional behavioral disability, physical disability, and speech/language impairment; each of these categories comprised 14 percent of the studies, or two studies each.
Accommodations research has continued to be an area with substantial research activity, and there has been an expansion in breadth and depth across the years. The number of studies has increased across the span of NCEO’s reports in this area: in 2011–2012, there were 49 identified studies; in 2013–2014, there were 53 studies; and in 2015–2016, there were 58 studies. A substantial proportion of the studies examined in previous reports highlighted research on the academic accommodations provided at institutions of higher education. Keeping in mind that the current report addressed only one year of accommodations research and was narrowed to the context of the U.S. K–12 school system, the 14 studies included in this report were consistent with the trend toward an increasing number of accommodations research studies across the years.
Researchers have continued to explore a wide range of topics related to assessment accessibility features and accommodations, including the comparison of the effects of differing versions of accommodations such as oral delivery presented live and in-person, provided through human voice recordings, and made available through computer-generated voicing from text-to-speech software. Studies also continued to examine multiple purposes and types of data. Along with investigating effects on content tests, researchers inquired about perceptions of students with disabilities and educators about accommodations, and students’ use and educators’ implementation practices surrounding accommodations.
Both quantitative analyses and thematic exploration of qualitative data have yielded findings that can inform and improve considerations of addressing students’ needs. For instance, Wang and colleagues (2017) sought to investigate both signed and spoken text passages versus signed-only text passages to students with hearing impairments, recognizing the potential for excessive demands on working memory. These finer investigations, while narrower in focus, can provide the opportunity to gain a deeper understanding of the cognitive processes that may be affected by the use of some assessment accommodations. Further, researchers have been developing a range of practices and approaches to analyze data when investigating test validity including consideration of the potential of accommodations to possibly change the academic construct being assessed.
The reauthorization of the Elementary and Secondary Education Act (ESEA) as the Every Student Succeeds Act (ESSA) has given states more flexibility in how they annually assess students on statewide tests for accountability purposes. Still, there is continued focus on ensuring that the assessments are accessible to students with disabilities. Conducting research on the effects of accommodations, as well as research on perceptions and implementation of accommodations, continues to be important as states ensure that their assessments produce valid and reliable assessment results.
References
Report References
(References in the report to papers that were part of the 2017 accommodations research analysis are not included in this list. They are in the separate list titled: 2017 K–12 Accommodation References.)
Cormier, D. C., Altman, J. R., Shyyan, V., & Thurlow, M. L. (2010). A summary of the research on the effects of test accommodations: 2007–2008 (Technical Report 56). Minneapolis, MN: University of Minnesota, National Center on Educational Outcomes.
Corrigan, P. W., Giffort, D., Rashid, F., Leary, M., & Okeke, I. (1999). Recovery as a psychological construct. Community Mental Health Journal, 35(3), 231–240. https://doi.org/10.1023/A:1018741302682
Corrigan, P. W., Salzer, M., Ralph, R. O. Sangster, Y., & Keck, L. (2004). Examining the factor structure of the Recovery Assessment Scale. Schizophrenia Bulletin, 30(4), 1035–1041. https://doi.org/10.1093/oxfordjournals.schbul.a007118
Davies, M., Elliott, S. N., & Cumming, J. (2016). Documenting support needs and adjustment gaps for SWSNs: Teacher practices in Australian classrooms and on national tests. International Journal of Inclusive Education, 20(12), 1252–1269. https://doi.org/10.1080/13603116.2016.1159256
French, B. F. & Oakes, W. (2004). Reliability and validity evidence for the Institutional Integration Scale. Educational and Psychological Measurement, 64(1), 88–98. https://doi.org/10.1177/0013164403258458
Harcourt Educational Measurement. (1996). Stanford Achievement Tests—Hearing Impaired version (SAT-HI). San Diego, CA: Author.
Johnstone, C. J., Altman, J., Thurlow, M. L., & Thompson, S. J. (2006). A summary of research on the effects of test accommodations: 2002 through 2004 (Technical Report 45). Minneapolis, MN: University of Minnesota, National Center on Educational Outcomes.
National Center for Education Statistics (NCES); n.d.). Explore assessment data: Assessment of Educational Progress (NAEP). Washington DC: Institute of Education Sciences (IES). https://nces.ed.gov/ nationsreportcard/data/
Pauk, W. (2000). Six-way paragraphs, middle level: 100 passages for developing the six essential categories comprehension (3rd Ed.). Lincolnwood, IL: Jamestown Publishers.
Rogers, C. M., Christian, E. M., & Thurlow, M. L. (2012). A summary of the research on the effects of test accommodations: 2009–2010 (Technical Report 65). Minneapolis, MN: University of Minnesota, National Center on Educational Outcomes.
Rogers, C. M., Lazarus, S. S., & Thurlow, M. L. (2014). A summary of the research on the effects of test accommodations, 2011–2012 (Synthesis Report 94). Minneapolis, MN: University of Minnesota, National Center on Educational Outcomes.
Rogers, C. M., Lazarus, S. S., & Thurlow, M. L. (2016). A summary of the research on the effects of test accommodations: 2013–2014 (NCEO Report 402). Minneapolis, MN: University of Minnesota, National Center on Educational Outcomes.
Rogers, C. M., Thurlow, M. L., Lazarus, S. S., & Liu, K. K. (2019). A summary of the research on effects of test accommodations: 2015–2016 (NCEO Report 412). Minneapolis, MN: University of Minnesota, National Center on Educational Outcomes.
Scholastic, Inc. (2007). Scholastic Reading Inventory technical guide. New York: Author.
Thompson, S., Blount, A., & Thurlow, M. (2002). A summary of research on the effects of test accommodations: 1999 through 2001 (Technical Report 34). Minneapolis, MN: University of Minnesota, National Center on Educational Outcomes.
Thurlow, M. L., Ysseldyke, J. E., & Silverstein, B. (1993). Testing accommodations for students with disabilities: A review of the literature (Synthesis Report 4). Minneapolis, MN: University of Minnesota, National Center on Educational Outcomes.
Torgesen, J. K., Wagner, R. K., & Rashotte, C. A. (2012). Test of Word Reading Efficiency–Second Edition (TOWRE-2). Austin, TX: Pro-Ed.
Woodcock, R. W. (1987). Woodcock Reading Mastery Tests-Revised. Circle Pines, MN: American Guidance Service.
Woodcock, R. W., Mather, N., & Schrank, F. A. (2004). Woodcock-Johnson III Diagnostic Reading Battery. Rolling Meadows, IL: Riverside.
Woodcock, R. W., McGrew, K. S., & Mather, N. (2001). The Woodcock-Johnson III Tests of Achievement. Itasca, IL: Riverside Publishing.
Zenisky, A. L., & Sireci, S. G. (2007). A summary of the research on the effects of test accommodations: 2005–2006 (Technical Report 47). Minneapolis, MN: University of Minnesota, National Center on Educational Outcomes.
2017 K–12 Accommodation References (N=14)
Davis, L., Morrison, K., Kong, X., & McBride, Y. (2017). Disaggregated effects of device on score comparability. Educational Measurement: Issues and Practice, 36(3), 35–45. https://doi.org/10.1111/emip.12158
Davis, L. L., Kong, X., McBride, Y., & Morrison, K. M. (2017). Device comparability of tablets and computers for assessment purposes. Applied Measurement in Education, 30(1), 16–26. https://doi.org/10.1080/08957347.2016.1243538
Ferrell, K. A., Correa-Torres, S. M., Howell, J. J., Pearson, R., Carver, W. M., Groll, A. S., … Dewald, A. J. (2017). Audible image description as an accommodation in statewide assessments for students with visual and print disabilities. Journal of Visual Impairment & Blindness, 111(4), 325–339. https://www.afb.org/jvib/jvib_main.asp
Gandhi, A. G., Ogut, B., Stein, L., Bzura, R., & Danielson, L. (2017). Enhancing accessibility for students with decoding difficulties on large-scale reading assessments. Journal of Learning Disabilities, 51(6), 540–551. https://doi.org/10.1177/0022219417714774
Johnson-Jones, K. J. (2017). Educating students with visual impairments in the general education setting. Dissertation Abstracts International: Section A. Humanities and Social Sciences, 78/08(E). https://aquila.usm.edu/dissertations/1337
Kavanaugh, M. (2017). Examining the impact of accommodations and universal design on test accessibility and validity. Dissertation Abstracts International: Section A. Humanities and Social Sciences, 78/09(E). https://dlib.bc.edu/islandora/object/bc-ir:107317
Meyer, N. K., & Bouck, E. C. (2017). Read-aloud accommodations, expository text, and adolescents with learning disabilities. Learning Disabilities: A Multidisciplinary Journal, 22(1), 34–47. https://doi.org/10.18666/ldmj-2017-v22-i1-7932
Noakes, M. A. (2017). Does speech-to-text assistive technology improve the written expression of students with traumatic brain injury? Dissertation Abstracts International: Section A. Humanities and Social Sciences, 79(01)E. http://search.proquest.com/docview/1954694875/abstract
Peterson, D. H. (2017). Parental and teacher perspectives on assistive technology. Dissertation Abstracts International: Section A. Humanities and Social Sciences, 79/02(E). http://hdl.handle.net/11299/190508
Polkowski, S. M. (2017). An analysis of educator practices: Learning and assessment accommodations for students with special needs. Dissertation Abstracts International: Section A. Humanities and Social Sciences, 79/04(E). https://rucore.libraries.rutgers.edu/rutgers-lib/55081/
Svetina, D., Dai, S., & Wang, X. (2017). Use of cognitive diagnostic model to study differential item functioning in accommodations. Behaviormetrika, 44(2), 313–349. https://doi.org/10.1007/s41237-017-0021-0
Taylor, E. (2017). The influence of testing accommodations on academic performance and disciplinary rates. Dissertation Abstracts International: Section B. Sciences and Engineering, 79/05(E). http://search.proquest.com/docview/2008665931/abstract
Wang, Y., Hartman, M. C., Jahromi, L. B., & Tversky, B. (2017). Better story recall by deaf children with unimodal communication. Journal of Developmental and Physical Disabilities, 29(5), 699–720. https://doi.org/10.1007/s10882-017-9551-3
Young, M. C. (2017). The effects of text-to-speech on reading comprehension of students with learning disabilities. Dissertation Abstracts International: Section A. Humanities and Social Sciences, 78(11)E. http://search.proquest.com/docview/1927469340/abstract
Appendix A
Research Characteristics for K–12 Studies in 2017
| Authors | Publication Type |
Research Type |
Research Design | Data Collection Source |
Collection Instrument |
|---|---|---|---|---|---|
| Davis, Kong, et al. | Journal Article | Mixed | Quasi-experimental | Primary | Survey, Test |
| Davis, Morrison, et al. | Journal Article | Quantitative | Quasi-experimental | Primary | Survey, Test |
| Ferrell et al. | Journal Article | Quantitative | Experimental | Primary | Survey, Test |
| Gandhi et al. | Journal Article | Quantitative | Quasi-experimental | Primary | Test |
| Johnson-Jones | Dissertation | Qualitative | Descriptive Qualitative |
Primary | Interview Protocol, Observations |
| Kavanaugh | Dissertation | Quantitative | Descriptive Quantitative |
Secondary | Test |
| Meyer & Bouck | Journal Article | Quantitative | Quasi-experimental | Primary | Interview Protocol, Test |
| Noakes | Dissertation | Mixed | Experimental | Primary | Test, Observations |
| Peterson | Dissertation | Qualitative | Descriptive Qualitative |
Primary | Interview Protocol |
| Polkowski | Dissertation | Quantitative | Descriptive Quantitative |
Primary | Survey |
| Svetina et al. | Journal Article | Quantitative | Correlation/Prediction | Secondary | Test |
| Taylor | Dissertation | Quantitative | Descriptive Quantitative |
Secondary | Grades, Test |
| Wang et al. | Journal Article | Quantitative | Experimental | Primary | Test |
| Young | Dissertation | Quantitative | Experimental | Primary | Survey, Test |
Appendix B
Research Purposes for K–12 Studies in 2017
| Authors | Stated Research Purpose | Effects (SwD) |
Effects (non) |
Effects (both) |
Issues | Review | Implement/ Use |
Perceptions | Items | Test | Validity |
|---|---|---|---|---|---|---|---|---|---|---|---|
| Davis, Kong, McBride, & Morrison | Investigate the effects of the device type for presenting math and reading assessments, comparing computer screen—desktop or laptop—versus electronic tablet; inquire about the perceptions and preferences of students about test-taking with the different administration formats. | P | X | ||||||||
| Davis, Morrison, Kong, & McBride | Investigate the effects on a multiple-content (math, reading, and science) assessment while using computers (with keyboards) and while using tablets with touchscreens; report on patterns of use of computers and electronic tablets as assessment formats. | P | X | ||||||||
| Ferrell, Correa-Torres, Howell, Pearson, Carver, Groll, … Dewald | Investigate the effects of three different accommodated assessment conditions—tactile graphics, audible descriptions of images, and a combination of tactile graphics and audible descriptions—on math, English language arts, and science assessments for students with visual and print-related disabilities; discuss issues of test-takers with different needs, including students with visual impairments versus sighted students with print-related difficulties. | P | X | ||||||||
| Gandhi, Ogut, Stein, Bzura, & Danielson | Investigate the effects of different forms of in-person oral delivery compared to one another and to a non-accommodated administration of reading assessment items for students with and without reading disabilities; discuss issues of performance by students with reading difficulties versus students with reading-related disabilities. | P | X | ||||||||
| Johnson-Jones | Describe students’ use of assistive technology devices and accommodations in classrooms—including class tests—as well as their use for state assessments, and educators’ practices of providing these assistive technology devices and accommodations; summarize related research literature; discuss issues of ‘high-tech’ and ‘low-tech’ accommodations and supports. | X | X | P | |||||||
| Kavanaugh | Examine item-level comparisons and test-level factor structure—for testing conditions of paper format with and without accessibility features and accommodations, versus computer-administered format with embedded accessibility features and accommodations, on high school science test items—for validity implications; summarize related research literature; discuss features of embedded tools provided via computer administration. | X | X | X | X | P | |||||
| Meyer & Bouck | Investigate the effects of oral delivery presented live by a test administrator versus through text-to-speech computer software, provided with individual administration and quiet alternate setting, on reading comprehension assessment performance for students with learning disabilities; inquire about the perceptions of students about their assessment experiences and obtain additional relevant information from educators about students’ comprehension difficulties. | P | X | ||||||||
| Noakes | Investigate the effects of dictated response using speech recognition technology versus written compositions produced with standard hand-writing, both provided with individual administration and quiet alternate setting, for students with traumatic brain injuries; summarize related research literature. | P | X | ||||||||
| Peterson | Examine the perceptions of special educators and parents of students with cognitive disabilities about assistive technology and accommodations; summarize related research literature; discuss familiarity with technology and its application to instruction and assessment. | X | X | P | |||||||
| Polkowski | Report on various types of educators and their practices implementing various accommodations; summarize related research literature; discuss the alignment of accommodations use across instruction and assessment contexts, and ways to categorize accommodations. | X | X | P | |||||||
| Svetina, Dai, & Wang | Investigate the effects of single accommodations—extended time, oral delivery, or small group administration—on a national math assessment for an extant data set of students with unspecified disabilities; examine item-level data for interaction of single accommodations with discrete skills; discuss viability of data analysis approaches. | P | X | X | |||||||
| Taylor | Investigate the effects of oral delivery (live/in-person) and calculator on ELA and math state assessment performance for an extant data set of students with various disabilities; summarize related research literature; discuss the relevant factors of students’ class grades and disciplinary records. | P | X | X | |||||||
| Wang, Hartman, Jahromi, & Tversky | Investigate effects of unimodal vs. bimodal communication modes—that is, typical signing only versus simultaneous sign and spoken English—presented via video recording on reading performance. | P | |||||||||
| Young | Investigate the effects on reading comprehension of text-to-speech software presented on computer platform for students with learning disabilities using their pre-selected settings including highlighting, rate of speed, and voice selection; inquire about the perceptions of students for text-to-speech software; summarize related research literature. | P | X | X |
| KEY | |
| A-Effects [SwD] | Compare effects of accommodations on assessment scores [only students with disabilities] |
| A-Effects [non] | Compare effects of accommodations on assessment scores [only students without disabilities] |
| A-Effects [both] | Compare effects of accommodations on assessment scores [both students with and without disabilities] |
| B-Issues | Discuss issues related to accommodations |
| C-Review | Summarize research on test accommodations |
| D-Perceptions | Study/compare perceptions and preferences about use |
| E-Implement/Use | Report on implementation practices and accommodations use |
| F-Items | Compare test items across assessment formats |
| G-Test | Evaluate test structure |
| H-Validity | Investigate test validity under accommodated conditions |
| P | Primary Purpose |
| X | Other Purpose |
Appendix C
Instrument Characteristics for K-12 Studies in 2017
Table C-1. Instrument Types and Specific Instruments Used, and Their Sources
| Authors | Instrument Types and Description/s | Number of Types |
|---|---|---|
| Davis, Kong, et al. | Author Survey: 10-item survey asking about respondents’
previous and present test experiences using a computer and an electronic tablet. Researcher Test: 59-item test addressing three content areas: mathematics, reading, and science. Drawn from various sources: math items from a national norm-referenced test of computation, geometry and pre-algebra strands, reading items from a formative assessment item bank with passages of varying lengths and genres, and science items were from two criterion-referenced tests in biology and chemistry; the tests were reviewed by content experts. State Test: Students’ state (Virginia) reading test scores were also collected to check for randomness in assignment. |
3 |
| Davis, Morrison, et al. | Author Survey: 10-item survey asking about respondents’
previous and present test experiences using a computer and an electronic tablet. Researcher Test: 59-item test addressing three content areas: mathematics, reading, and science. Drawn from various sources: math items from a national norm-referenced test of computation, geometry and pre-algebra strands, reading items from a formative assessment item bank with passages of varying lengths and genres, and science items were from two criterion-referenced tests in biology and chemistry; the tests were reviewed by content experts. State Test: Students’ state (Virginia) reading test scores were also collected to check for randomness in assignment. |
3 |
| Ferrell et al. | Author Survey: Teacher survey on basic information about each
student participant: disability, assessment accommodations used, and current reading status—that is, teachers’ indication of whether students are reading at grade level. Researcher Test: Comprising items on English language arts (ELA), mathematics, and science. Drawn from previous non-secure and practice item banks in Utah. ELA and math items matched to the Common Core State Standards, and the selected science items confirmed to link to grade level standards in all three states. |
2 |
| Gandhi et al. | Researcher Test: Reading comprehension assessments comprised
11 released state (Ohio) assessment reading passages, with 5 to 7 multiple choice items each. Each of the four comparable (in difficulty) test versions had two passages and 11 to 14 items. Norm-ref Ach: (for screening purposes) Woodcock-Johnson III Diagnostic Reading Battery, Basic Reading Cluster on Letter-Word Identification and Word Attack (Woodcock, Mather, & Schrank, 2004) and the Test of Word Reading Efficiency 2, on Sight Word Efficiency and Phonemic Decoding Efficiency (Torgesen, Wagner, & Rashotte, 2012). |
2 |
| Johnson-Jones | Author Interview: Set of semi-structured, open-ended
interview questions inquiring about participants’ experiences with accommodations and assistive technology devices; classroom observation protocol recording instructional and assessment practices and students’ responding behaviors. |
1 |
| Kavanaugh | State Test: New England Common Assessment Program (NECAP)
grade 11 science assessment item scores from 2009 for New Hampshire, Rhode Island, and Vermont. |
1 |
| Meyer & Bouck | Author Interview: Two social validity interview protocols
asking about students’ opinions of using the two different oral delivery versions of the comprehension questions, including their preferences between them if any. A brief series of interview questions for the students’ teacher about the participants’ comprehension challenges. Researcher Test: A series of common comprehension questions, based on a rubric designed by the researchers, inquiring about main idea and supporting details in each reading passage, and a set of passage-specific questions. Passages connected to grade 7 content, drawn from a commercially-available reading curriculum (Pauk, 2000); the passages were expository, containing fact-based content in science and social studies. Participants answered comprehension questions orally to the researchers, with responses scribed. Participants’ performance data were measured by the percentage of correct answers from each set of passage questions. Norm-ref Ach: (for screening purposes) Woodcock Reading Mastery Tests-Revised (1987), including Word Identification, Word Attack, and Passage Comprehension |
3 |
| Noakes | Researcher Test: Written Expression Curriculum Based
Measurement (WE-CBM) tracked participants’ progress in correct written sequences (CWS), total words written (TWW), and words spelled correctly (WSC). These three elements were quantified by the WE-CBM into separate scores. |
1 |
| Peterson | Author Interview: Inquiring about the
reflections—perceptions, attitudes, and experiences—of parents and teachers of students with cognitive disabilities. Other: (Data artifacts used for triangulation purposes) intermittent examination of research literature, and with the expansion of study participants to include educators, information was compiled about available resources, assistive technology details in IEP documents, and teacher education program information. |
2 |
| Polkowski | Author Survey: The Checklist of Learning and Assessment
Adjustments for Students (CLAAS; Davies, Elliott, & Cumming, 2016) is a 67-item measure of eight domains comprising its own typology of accommodations: motivational, scheduling, setting, directions, equipment/assistive technology, formats, and assistance prior to and during assessments. Teacher-respondents documented students’ need for and use of various accommodations in three contexts: classroom instruction, classroom assessment, and state assessment. Part of the function of the CLAAS was to examine alignment of accommodation use across the three contexts. |
1 |
| Svetina et al. | Researcher Test: National Assessment of Educational Progress
(NAEP) in grade 8 mathematics, 2007 national dataset composed of 53 item-level responses. |
1 |
| Taylor | Researcher Test: Massachusetts Comprehensive Assessment
System (MCAS) state assessments in English language arts (ELA) and mathematics, 2016 extant data set from one school district. Other: Academic grades for school years 2014–2015 and 2015–2016 (based on grade point average/GPA), and disciplinary records from 2015–2016. |
2 |
| Wang et al. | Researcher Test: The story recall task performance score, for
working memory, measured with items from, or based upon, the Woodcock-Johnson Tests of Achievement (WJ III ACH; Woodcock, McGrew, & Mather, 2001) Story Recall subtest. Crit-ref Ach: Stanford Achievement Test-Hearing Impaired-Verbal (SAT-HI) served as an independent measure of participants’ reading ability. |
2 |
| Young | Author Survey: Student survey of eight items employing a
rating scale to measure perceptions as a social validity check. Researcher Test: A curriculum-based measure (CBM) of 15 multiple choice items, with eight vocabulary items, four literacy analysis items, and three reading comprehension items. Oral reading fluency (ORF) was gathered through having participants read out loud to the test administrator, both as a baseline pre-test, after each accommodation condition, and as a post-test; the ORF pre-test provided information for setting the text-to-speech rate of speed. Crit-ref Ach: The Scholastic Reading Inventory (SRI) served as a separate (criterion-referenced) reading comprehension assessment, measured in Lexile scores. |
3 |
| Instrument Types | Type Abbreviations | Number of Studies |
|---|---|---|
| Non-Academic Protocols or Surveys Developed by Study Author/s |
Author Survey/ Interview |
9 |
| Surveys or Academic Tests Developed by Professionals or
Researchers through Work Outside of Current Study |
Researcher Test | 10 |
| State Criterion-referenced Assessment | State Test | 2 |
| Norm-referenced Academic Achievement Measures | Norm-ref Ach | 2 |
| Norm-referenced Cognitive Ability Measures | Norm-ref Ability | 0 |
| Criterion-referenced Academic Achievement Measures | Crit-ref Ach | 2 |
| Student Course Grades (GPA) | Grades | 1 |
| Other | Other | 3 |
Table C-2. Content Areas Assessed
| Authors | Math | Reading | Writing | Other ELA |
Science | Social Studies |
N |
|---|---|---|---|---|---|---|---|
| Davis, Kong, et al. | 1 | 1 | 0 | 0 | 0 | 0 | 2 |
| Davis, Morrison, et al. | 1 | 1 | 0 | 0 | 1 | 0 | 3 |
| Ferrell et al. | 1 | 0 | 0 | 1 | 1 | 0 | 3 |
| Gandhi et al. | 0 | 1 | 0 | 0 | 0 | 0 | 1 |
| Johnson-Jones | 0 | 0 | 0 | 0 | 0 | 0 | 0 |
| Kavanaugh | 0 | 0 | 0 | 0 | 1 | 0 | 1 |
| Meyer & Bouck | 0 | 1 | 0 | 0 | 0 | 0 | 1 |
| Noakes | 0 | 0 | 1 | 0 | 0 | 0 | 1 |
| Peterson | 0 | 0 | 0 | 0 | 0 | 0 | 0 |
| Polkowski | 0 | 0 | 0 | 0 | 0 | 0 | 0 |
| Svetina et al. | 1 | 0 | 0 | 0 | 0 | 0 | 1 |
| Taylor | 1 | 0 | 0 | 1 | 0 | 0 | 2 |
| Wang et al. | 0 | 1 | 0 | 0 | 0 | 0 | 1 |
| Young | 0 | 1 | 0 | 0 | 0 | 0 | 1 |
| TOTAL (number of studies) |
5 | 6 | 1 | 2 | 3 | 0 |
Appendix D
Participant and Sample Characteristics for K–12 Studies in 2017
| Authors | Unit of Analysis |
Sample Size |
Percent of Sample with Disabilities |
Grade/Education Level |
Disability Categories Included in Sample |
|---|---|---|---|---|---|
| Davis, Kong, et al. | Students | 964 | 0% | high school (grade not specified) |
None |
| Davis, Morrison, et al. |
Students | 964 | 0% | high school (grade not specified) |
None |
| Ferrell et al. | Students | 295 | 100% | grades 3 through 8 (elementary & middle) |
LD, VI, PD, S/L, A, OHI |
| Gandhi et al. | Students | 145 | 47% | grade 4 (elementary) | None, LD |
| Johnson-Jones | Students, Educators |
7 | 43% | grades 3 through 7 (elementary & middle) |
VI; educators were sighted |
| Kavanaugh | Students | 4999 | 43% | grade 11 (high) | no info, None |
| Meyer & Bouck | Students | 4 | 100% | grade 7 (middle) | LD |
| Noakes | Students | 3 | 100% | grades 4, 8, & 9 (elementary, middle, & high) |
TBI |
| Peterson | Parents, Educators |
12 | 0% | n/a | N/A |
| Polkowski | Educators | 45 | 0% | n/a | N/A |
| Svetina et al. | Students | 3700 | 100% | middle school | no info |
| Taylor | Students | 100 | 100% | grades 6–12 (middle & high) |
LD, PD, A, EBD, S/L, othera |
| Wang et al. | Students | 36 | 100% | grades 5–8 (middle) | HI |
| Young | Students | 4 | 100% | high school | LD |
a Other=”neurological” and “sensory”
Appendix E
Accommodations Studied for K–12 Studies in 2017
Table E-1. All Accommodations by Study
| Author/s | Accommodation/s |
|---|---|
| Davis, Kong, et al. | Calculator; Electronic administration; Multiple
accommodations |
| Davis, Morrison, et al. | Electronic administration |
| Ferrell et al. | Large print/magnification; Technological aid; Multiple
accommodations |
| Gandhi et al. | Extended time; Oral delivery, live/in-person; Multiple
accommodations |
| Johnson-Jones | Electronic administration; Large print/magnification;
Technological aid |
| Kavanaugh | Electronic administration |
| Meyer & Bouck | Dictated response; Oral delivery, live/in-person;
Technological aid; Text-to-speech device/software |
| Noakes | Dictated response; Individual; Specialized setting; Speech recognition system |
| Peterson | not specified |
| Polkowski | not specified |
| Svetina et al. | Extended time; Oral delivery, live/in-person; Small group |
| Taylor | Calculator; Oral delivery, live/in-person |
| Wang et al. | Dictated response; Recorded delivery (audio or video); Signed administration; Signed response; Multiple accommodations |
| Young | Text-to-speech device/software |
Table E-2. Presentation Accommodations Itemized by Study
| Author/s | Electronic admin- istration |
Large print/ magnification |
Oral delivery, live/ in-person |
Recorded delivery (audio or video) |
Signed admin- istration |
Text-to- speech device/ software |
N |
|---|---|---|---|---|---|---|---|
| Davis, Kong, et al. | • | 1 | |||||
| Davis, Morrison, et al. |
• | 1 | |||||
| Ferrell et al. | • | 2 | |||||
| Gandhi et al. | • | 1 | |||||
| Johnson-Jones | • | • | 2 | ||||
| Kavanaugh | • | 1 | |||||
| Meyer & Bouck | • | • | 2 | ||||
| Svetina et al. | • | 1 | |||||
| Taylor | • | 1 | |||||
| Wang et al. | • | • | 2 | ||||
| Young | • | 1 | |||||
| TOTAL studies (of 11) |
4 | 2 | 4 | 1 | 1 | 2 |
Table E-3. Equipment Accommodations Itemized by Study
| Author/s | Electronic administration |
Technological aid |
N |
|---|---|---|---|
| Davis, Kong, et al. | • | 1 | |
| Davis, Morrison, et al. |
• | 1 | |
| Ferrell et al. | • | 1 | |
| Johnson-Jones | • | • | 2 |
| Kavanaugh | • | 1 | |
| Meyer & Bouck | • | 1 | |
| TOTAL studies (of 6) | 4 | 3 |
Table E-4. Response Accommodations Itemized by Study
| Author/s | Calculator | Electronic administration |
Dictated response |
Signed response |
Speech recognition system |
N |
|---|---|---|---|---|---|---|
| Davis, Kong, et al. | • | • | 2 | |||
| Davis, Morrison, et al. |
• | 1 | ||||
| Johnson-Jones | • | 1 | ||||
| Kavanaugh | • | 1 | ||||
| Meyer & Bouck | • | 1 | ||||
| Noakes | • | • | 2 | |||
| Taylor | • | 1 | ||||
| Wang et al. | • | • | 2 | |||
| TOTAL studies (of 8) | 2 | 4 | 3 | 1 | 1 |
Table E-5. Scheduling Accommodations Itemized by Study
| Author/s | Extended time |
Test breaks |
N |
|---|---|---|---|
| Gandhi et al. | • | 1 | |
| Svetina et al. | • | 1 | |
| TOTAL studies (of 2) | 2 | 0 |
Table E-6. Setting Accommodations Itemized by Study
| Author/s | Individual | Small group |
Specialized setting |
N |
|---|---|---|---|---|
| Noakes | 1 | 1 | 1 | 3 |
| Svetina et al. | 1 | 1 | ||
| TOTAL studies (of 2) | 1 | 2 | 1 |
Appendix F
Findings for K–12 Studies in 2017
| Authors | Findings Statement | Effects | Perceptions | Implement/ Use |
Validity | Content |
|---|---|---|---|---|---|---|
| Davis, Kong, et al. | Student participant groups did not perform differently in any
content area/s by device, between computer screen (non-interactive) versus tablet touchscreen. Students answering computer-delivered items scored essentially the same on average as students testing on electronic tablets with touchscreen responding, covering math, reading, and science content. There were also no significant mean differences in response patterns across the various item types. However, two individual reading items indicated a performance difference, with students using tablets scoring significantly higher than those using computers. Student participants reported having previous experience using devices during large-scale assessment; nearly all (95%) had taken assessments on paper, most (85%) on desktop computers, most (75%) on laptops, much fewer (24%) on electronic tablets, and almost none (5%) on smart phones. Student perceptions of test content difficulty was not significantly different between devices. Preferences for device option during assessments varied; the largest proportions of participants preferred using paper only or paper and computer screen; much smaller proportions preferred touchscreen responding. Participants reporting having previous tablet-delivered test experience also expressed more positive perceptions of using tablets during testing. |
1 | 1 | M,R | ||
| Davis, Morrison, et al. | The researchers compared raw scores for all participants and
used ANOVA analyses to examine intergroup differences and interaction effects. They found no significant score differences between the use of computers and tablets on the math and science sections of the assessment. On the reading items, mean scores for the male group of high school students were slightly higher when using with tablets than when using computers. There were no correlations for mean scores by ethnicity group with computers or with tablets. The researchers provided limited information on findings from the student surveys, in reference to the performance findings. Specifically, about the higher scores for male participants in reading with tablets (compared to computers), they stated, “student survey responses did not reveal any differential use in devices between genders which would offer an explanation in terms of either experience level with devices or novelty of devices” (p. 44). |
1 | 1 | M,R,S | ||
| Ferrell et al. | Audible image description did not affect the performance of
students with print disabilities—that is, this participant group’s average score was not significantly different with this accommodations than without this accommodation. Students with visual impairments who read print— either standard-sized or large print—also did not score significantly differently when receiving audible image description than when they did not. However, students with visual impairments who read braille answered significantly more items correctly with audio description across all items, with a moderate effect size. When analyzing the score patterns for students who read braille more closely, audio description alone was the most beneficial of the three testing conditions for ELA and math; braille readers answered correctly on the same proportion of science items when receiving tactile graphics only as when receiving audio description only. The researchers expected to find that audible image description would work together with tactile graphics to boost scores of students with visual impairments who used braille; however, this testing condition (with both accommodations) yielded lower scores than audio description alone in each of the three content areas for braille readers. In fact, in ELA and science, braille readers scored lowest in the multiple accommodations condition, compared with receiving tactile graphics only or audio description only. The researchers recommended that states ought to adopt audible image description as an accommodation for state assessments, in that it can be potentially helpful for students who read braille. |
1 | M,LA,S | |||
| Gandhi et al. | Participants with reading difficulties scored significantly
higher in two of the three accommodated conditions compared to the unaccommodated reading comprehension assessment: these low-performing readers scored significantly higher with oral delivery of question stems and answer options and with the entire test (including passages) presented aloud. Also, these 96 students with reading difficulties did not score significantly differently on average when comparing performance between these two accommodated test conditions—that is, with the difference of hearing the passages aloud or not. Further, participants who were average readers did not score significantly differently between accommodated and unaccommodated assessments, and also when comparing each of the accommodated versions to one another. Descriptive differences were noted for the average reader group: they scored highest on the unaccommodated test, and lowest on the test version with proper nouns read aloud. Participants with reading disabilities had somewhat more pronounced differences— with larger effect sizes—than the overall poor readers group. The 68 students with disabilities averaged significantly higher scores (compared with no accommodations) when using two of the accommodations conditions: with the questions and proper nouns read to them, and with oral delivery of the entire test. However, these students with reading disabilities did not demonstrate significant benefits from oral delivery of question stems and answer choices alone, in comparison with no accommodations at all. |
1 | R | |||
| Johnson-Jones | The study yielded information about teachers’ accommodations
practices and students’ expressed needs and uses of accommodations. At least two themes identified in the findings pertained to these topics: “depending on structures of support” (Abstract) and “responding to barriers” (Abstract). Supports were identified as people—as in ‘support system’—as well as accommodations and assistive technology; the latter were emphasized in this summary. Two of the students indicated using a magnifying glass for routine needs in the classroom. A common theme was that students had uneven access to specific supports; for example, one student indicated only using CCTV during the state assessment, and that this ‘high-tech’ magnification device was not available for classroom use. The teacher for this student indicated that after having noticed the student’s low performance on classroom tests with standard print size, the teacher provided large print paper tests and observed improved test results. The researcher also remarked about the absence of high-tech magnification devices in the classroom, despite herself noticing that “all three students were observed holding their papers close to their face or bending over so their face could be near the top of their desk to see their papers” (p. 65). Teachers indicated at various points in interviews that they did not have sufficient training or resources for providing vision-related supports for the students; while readily providing access by reading materials aloud, some teachers engaged students’ peers to support students’ need for access to materials. All three students reported in detail about their limited access or lack of access altogether to academic materials, despite specifically asking for supports such as recorded lecture notes and other materials. One student had computer access listed on the IEP, yet the teacher noted, “there was often no technician to assist in fixing the device” (p. 83); another student indicated being expected to use a computer for a reading test, yet that someone had to read the test aloud (from the computer) to the student. The researcher discussed related themes regarding students’ sense of their disabilities and their negative emotions associated with the limitations that they experienced with instructional support. Educators indicated their needs for resources in order to address the needs of students with visual impairments, and the researcher offered recommendations on this matter. |
1 | 0 | |||
| Kavanaugh | Accommodations provided to students who completed the paper
form of the state science assessment were different in some cases from those provided to students who used the NimbleTools in the computer- administered format. For instance, oral delivery was provided by a test administrator during the paper test, but was provided through a speech synthesizer as an embedded tool on the computerized test; further, about 16% of students used oral delivery on the paper form, but about 87% of students used the computer-presented oral delivery support. The researcher indicated that the “overall item functioning and underlying factor structure was consistent across accommodated and unaccommodated conditions” (p. 155) and in both paper-based and computer-administered assessments. In other words, a similar construct, although possibly not well-defined, was measured in both accommodated formats. Most items functioned similarly across test versions, with only a few exceptions in which items did not systematically favor one condition. The researcher concluded that the computer-administered assessment with embedded supports did not affect the science construct, and highlighted the positive features of the NimbleTools system. |
1 | S | |||
| Meyer & Bouck | Performance data were reported graphically for each
participant, and individual descriptions of student performance were provided. Overall, the researchers concluded that oral delivery did not support any significant performance improvements for all four participants; they described the effect sizes of both forms of oral delivery for three participants as “small to questionable” (p. 44) and stated “only one student experienced modest effects for both types of read-alouds (i.e., Cole)” (p. 44). Further, according to the improvement rate difference (IRD) data, the participants did not score significantly differently when using one oral delivery format over the other, and as the researchers noted, “the data in both conditions were variable, with a great deal of overlap” (p. 44). They also noted that the percentage of nonoverlapping data (PND) analyses indicated that oral delivery in-person by a test administrator yielded better scores for three of the students, and text-to-speech supported one student (Kara) better; however, these differences were judged to be no greater than modest. Early in the study, participants all expressed their expectation that text-to-speech would likely help them more; however, by the end of the study, three of the four participants preferred in-person oral delivery over text-to-speech. The researchers stated that the participants’ special education teacher “was skeptical of students using TTS [text-to-speech] appropriately, although she noted that it might provide more independence for the students as well as improve their efficiency” (p. 44). The researchers offered the observation that oral delivery might not be beneficial as a sole intervention for students with reading-based disabilities, and recommended additional instructional interventions need to be provided. |
1 | 1 | R | ||
| Noakes | All three participants demonstrated significantly higher
written performance when using the dictated response accommodation, employing speech recognition software on a digital platform (computer). The researcher reported large effect sizes, ranging from +3.4 to +8.8. Further, the researcher noted “Perhaps more impressive, was 100 percent non-overlap of data between the two conditions across participants and dependent variables” (p. 67). Observations of participants’ handwritten products yielded detailed examples to support the CBM data indicating that their standard unaccommodated performance was substantially limited by their disabilities; in contrast, the speech-to-text accommodation supported “significantly improved performance” (p. 69). The researcher indicated that the three participants benefited despite their traumatic brain injuries and related fine motor skill impairments. She suggested that the results supported the intent of addressing the needs of students with TBIs by removing the barrier to performance, noting the mechanism believed to be involved: “In theory, because less effort is spent on transcription, there is a reduction in cognitive load, enabling more time to be spent on generation skills, such as idea development, selecting more complex words that might be otherwise difficult to spell, and grammar” (p. 66). |
1 | W | |||
| Peterson | Parents tended to indicate open-mindedness about engaging
with new or additional assistive technology tools, and teachers affirmed parents’ positive attitudes toward new possibilities; new support resources typically came from educators and not parents. As such, a potential implementation barrier could be educators’ attitudes or resources for initiating assistive technology for students. Teachers identified four barriers to implementation: “their own comfort with technology, their awareness of appropriate assistive technology solutions for their students, school or district support, and financial considerations” (p. 59). Some teacher interviewees indicated limited comfort with, and several indicated limited awareness of applying specific assistive technology resources to address student needs—that is, they lacked not only information about resources, but practical knowledge of how to use them. Further, the presence or absence of a technology-oriented professional on the IEP team was related to whether students had assistive technology listed in their IEPs. The researcher reflected that these first two implementation barriers were also affirmed in the body of literature, and that they were associated with the degree to which educators had an accepting attitude toward assistive technology use; further, acceptance and knowledge can be complicated by educators’ preparation, or lack thereof, to incorporate assistive technology in their teaching practices. School and district resources, and funding, both also operated somewhat independently as factors experienced by teacher interviewees effecting implementation barriers. Districts with funding might not already have assistive technology resources, yet funding can be a necessary prerequisite for obtaining at least some new assistive technology resources, and were required for leaders to facilitate acquiring new resources. The availability of resources and finances varied widely in the study participants’ districts; some had assistive technology lending libraries, and some did not. The degree to which finances are limited or available at the school or district, or from parents of students needing assistive technology, can serve as an implementation barrier according to interviewees and the body of research literature. |
1 | 0 | |||
| Polkowski | Educators reported that 49% of their students received
accommodations during classroom learning, 46% received accommodations during classroom assessments, and 26% had accommodations during large-scale assessments. The researcher described the relative prevalences of the accommodation domains/ types in the three contexts: during instruction, Motivational Adjustments were used by the highest prevalence of participants (86%) and Equipment or Assistive Technology had the lowest prevalence (26%); during Classroom Assessments, Motivational Adjustments were highest in prevalence (82%) and Equipment or Assistive Technology was lowest (24%); in contrast, during Large scale Assessments, the highest prevalence (54%) received Scheduling Adjustments, and the lowest prevalence (15%) received Equipment and Assistive Technology accommodations. The researcher also contrasted the accommodations domains between conditions, noting that three domains—Setting Adjustments, Assistance prior to Testing, and Equipment/Assistive Technology—demonstrated no significant difference between conditions. Prevalence differences were significant for Motivational Adjustments between instruction and state test with a large effect size, and between classroom learning and classroom assessment, with a large effect size. Similar significant differences in these two condition comparisons for Scheduling Adjustments (with medium effect sizes), Assistance with Directions (with medium effect sizes), and Assistance during Assessment (with medium effect sizes). The Formats domain showed significantly different prevalence in comparison between Classroom Learning and Large-scale Assessment (with a medium effect size). A summative comparison of all domains was also reported, and one comparison showed significant difference: between the instruction and state assessment conditions, with a moderate effect size. However, for all eight domains, no significant differences were reported for the conditions of learning and assessment in the classroom. Alignment analyses yielded similar patterns, with the lowest alignments between Classroom Learning and Large-scale Assessment conditions, and consistently highest (for all domains) between Classroom Learning and Classroom Assessment conditions. The researcher also explained the similarities and distinctions between the results when using prevalence, effect size, and alignment analyses. |
1 | 0 | |||
| Svetina et al. | Twenty-five of the 53 NAEP math items were identified with
DIF, and the researchers specified that 14 had nonuniform DIF, 9 had uniform DIF, and 2 had both. Examining these 25 items further, the researchers determined that the item demands required mastery of 24 different skills for correct math test answers, such as number sense and estimation. On average, the nonaccommodated group of students had higher math performance than the accommodated groups, indicating that they had “higher mastery probabilities as well as higher proportions of students with mastery across all [item] attributes” (p. 333), with a 33% difference in mastery level performance. The groups using single accommodations (extended time, oral delivery, or small group administration) had similar performance success as one another across item attributes, with students using small group administration having a larger proportion of students reaching performance mastery. The nonaccommodated group had much higher proportions of students demonstrating skill mastery, with more than half of its members mastering 20 skills. In comparison, one skill— unit conversion—was mastered by more than half of each of the accommodated groups. A couple skills were mastered by more than half of the group receiving small group administration: evaluating/ verifying options and word problems; for both skills, the other accommodated groups had 50% or fewer of its members showing mastery. The group using oral delivery had 51% of its members with mastery of quantitative reading, yet the remaining 22 skills were mastered by fewer than half of its members. The group using extended time had half or fewer of its members showing mastery on 23 skills. In contrast, both nonaccommodated and accommodated groups scored similarly on the item skills of quantitative reading and logical reasoning. The researchers concluded that this approach to investigate item analysis is a viable alternative. |
1 | M | |||
| Taylor | Students with disabilities who received both oral delivery
in-person by a test administrator and calculator accommodations scored significantly lower on state ELA and math assessments than students with disabilities who did not receive either accommodation. When comparing the academic grades of both groups, neither student group scored significantly differently than the other, indicating that there was no specific relationship between having received these accommodations and students’ GPAs. Finally, there were no significant differences in disciplinary records between the group receiving those accommodations and the group not receiving them. The researcher noted that disabilities’ severities were not expressly identified for students, and suggested that this factor might have been influential in the results patterns. In addition, the student groups were not matched by disability category. |
1 | M,LA | |||
| Wang et al. | Students with hearing aids and students with cochlear
implants did not perform significantly differently as groups on the recall task, in either testing condition. Similarly, no significant differences in mean performance scores were found based on participants’ ages, genders, home languages, or PTA/hearing levels. Repeated measures analyses yielded that, on average, participants scored significantly higher when presented the stories only through signing (in ASL), compared with when presented in both oral delivery of English and signing. In other words, SIMCOM yielded lower performance scores than ASL alone. The researchers suggested that the students’ attention to both modes might have overloaded students; that is, receiving communication in essentially two languages simultaneously overtaxed their attentional resources. |
1 | R | |||
| Young | Three of the four participants demonstrated significant
positive differences in CBM scores between the unaccommodated condition and the oral delivery accommodation—using text-to-speech. Individual participant scoring patterns were also reported. Vincent demonstrated limited average improvement in the overall CBM score, with his smallest improvement in the comprehension component, and lower than typical improvement (compared to age-mates) in oral reading fluency (ORF) from the baseline to post-intervention [he missed the maintenance sessions]. While there were increases in some of Vincent’s scores, particularly in abrupt increases in immediacy of effect, they were not significant overall. Jack showed significant mean improvement from first baseline (34%) to maintenance (75%) scores, with his largest improvement in the vocabulary component. He also demonstrated significant increases in immediacy of effect, and scores showed accelerating and therapeutic trends. Jack also had a 100% in PND (percentage of nonoverlapping data). With the lowest (of the four participants) initial ORF (that is, words per minute) score, Jack made the largest improvements—in fact, he made twice the growth rate in comparison to average peers. Dianna’s overall CBM scores also showed a significant immediate effect from using text-to-speech; her scores had a similar significant decrease when switching from the accommodated to unaccommodated conditions; her largest improvement was in comprehension component average: first baseline of 33% to maintenance of 67%. Her scores showed an accelerating growth pattern, and reached 100% PND. Dianna’s ORF scores were significantly higher overall, associated with text-to-speech. Donald showed an overall mean CBM increase from 44% at baseline to 68% at maintenance, deemed a significant effect from text-to-speech, with similar improvements in vocabulary, literary analysis, and comprehension components. His scores showed accelerating and therapeutic gains, and reached 100% PND. He demonstrated an average increase in ORF scores. Two of the four students—Jack and Dianna— showed improvements in comprehension on a screening assessment, SRI, indicating the ability to generalize this skill. The survey results indicated that the social validity of using text to speech for all three students (with one not completing this survey) was positive overall at the end of the study. Specifically, the most positively rated statements indicated enjoyment—highest, at 4 out of 5—and easy-to-use, remembering more information, and liking to moderate the speed of speech (all of which had the mean rating 3.7 of 5). |
1 | 1 | R | ||
| TOTAL | 10 | 4 | 3 | 1 | 12 |