A publication of:
NATIONAL CENTER ON EDUCATIONAL OUTCOMES
The Center is supported through a Cooperative Agreement (#H326G160001) with the Research to Practice Division, Office of Special Education Programs, U.S. Department of Education. The Center is affiliated with the Institute on Community Integration at the College of Education and Human Development, University of Minnesota. The contents of this report were developed under the Cooperative Agreement from the U.S. Department of Education, but does not necessarily represent the policy or opinions of the U.S. Department of Education or Offices within it. Readers should not assume endorsement by the federal government.
Project Officer: David Egnor All rights reserved.

Any or all portions of this document may be reproduced and distributed without prior permission, provided the source is cited as: Warren, S. H., Strunk, K., Lazarus, S. S., & Thurlow, M. L. (2019). States and districts working together on the 1.0% threshold. Minneapolis, MN: University of Minnesota, National Center on Educational Outcomes.
Forum Facilitators Forum Notetakers Forum Conveners Forum Organizers Forum Presenters Forum Participants |
Forum Participants, continued |
Approximately 35 individuals representing staff from invited state departments of education and school districts, along with others (e.g., U.S. Department of Education, other state representatives) participated in a forum on June 26, 2019 in Orlando, Florida to discuss how states and districts can work together to meet the 1.0% threshold on participation in the alternate assessment aligned to alternate academic achievement standards (AA-AAAS). The forum was a post-session to the Council of Chief State School Officers (CCSSO) National Conference on Student Assessment (NCSA), and was a collaboration of the Assessing Special Education Students (ASES) State Collaborative on Assessment and Student Standards (SCASS) and the National Center on Educational Outcomes (NCEO).
A specific goal of the forum was to have states and districts talk about issues related to the 1.0% requirements and their implementation. It was believed that these discussions among states and districts could lay the foundation for continued thinking and acting together by states and districts to ensure that the right students are taking the right assessment.
The purpose of the forum was to encourage states and districts to work together on meeting the 1.0% threshold. This topic grew out of numerous conversations during which states indicated that they were challenged by the Every Student Succeeds Act (ESSA) requirement that states be held to a 1.0% cap on participation in the AA-AAAS, but that districts could not be limited to 1.0% participation in the AA-AAAS.
Among the questions addressed in the forum were ones related to how states and districts could work together on: (a) analysis and use of data related to the 1.0% threshold; (b) use of professional development and technical assistance to lower the percentage of students participating in the alternate assessment; and (c) helping IEP teams to ensure that the “right” students are taking the “right” assessment. In addition, states and districts commented on resources that might support states and districts working together on these topics.
The forum started with a presentation on the history leading up to the 1.0% participation threshold for participation in the AA-AAAS. Then, the perspectives of a state and a district were provided. Following these presentations, forum participants broke into groups, first to discuss the issues, and then to identify needed resources. Groups were formed in a way that enabled state and district representatives from the same state to interact with each other as well as with individuals from other states and districts.
Each of these groups addressed the following questions:
Discussions were rich and engaging. The agenda was as follows:
This report summarizes both the introductory information provided to forum participants, and the facilitated forum discussions that followed. Summaries of the presentations were developed from notes taken during the presentations, and from the presenters’ slides. Summaries of the facilitated discussions were developed from notes taken by notetakers.
Participants were encouraged to comment and discuss freely, with assurances that no individual’s name, nor any state or organization would be attached to comments made. Complete anonymity of statements was ensured. This led to frank and open conversations.
Sandra Warren, CCSSO ASES SCASS Advisor, provided an overview of the forum and recognized the hosts—ASES SCASS and NCEO. She noted that states are challenged by the ESSA requirement that states be held to a 1.0% threshold while districts within the states are not. She indicated that it made sense to start discussions among states and districts to identify the issues and to identify resources that would be helpful in supporting states and districts to work together on the AA-AAAS participation requirements. She confirmed that the goal of the forum was to find ways to encourage states and districts to work together on meeting the 1.0% threshold.
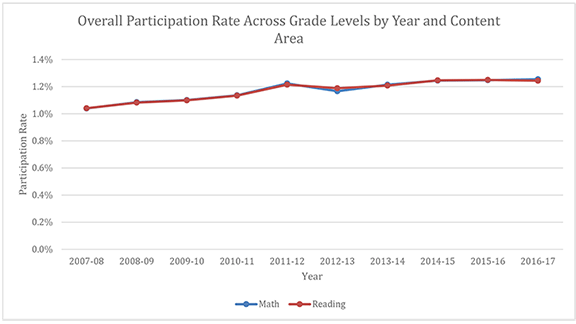
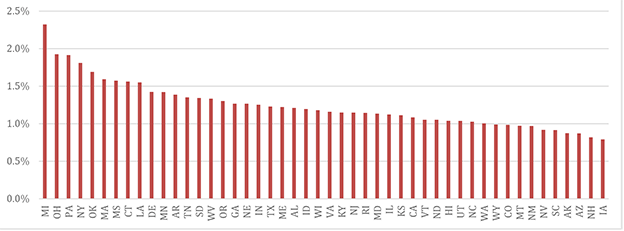
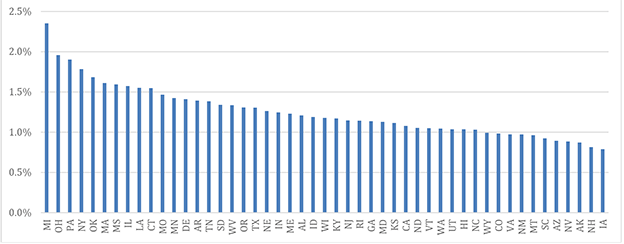
Martha Thurlow, NCEO, provided a brief history of the events that led up to the decision to hold a forum on the topic of states and districts working together, and referred participants to a handout, The 1.0% Threshold on Participation in the AA-AAAS (see Appendix). She noted the slow increase in AA-AAAS participation rates over the past 10 years, and then presented graphs of AA-AAAS participation rates in reading/language arts and mathematics in 2016-17. These graphs showed the tremendous variability in states’ AA-AAAS participation rates, with a range from 0.8% to 2.3% in reading/ language arts and from 0.8% to 2.4% in mathematics. Thurlow highlighted the challenge that states face – being held to 1.0% without being able to hold districts to the same participation thresholds.
Sheryl Lazarus, NCEO, introduced the topic of states and districts working together by reminding the participants that even though districts are not held to the 1.0% threshold, there are consequences for the state not making progress toward the threshold that ultimately could affect districts and schools, including potential reduced funding to provide technical assistance and support to districts and schools. She also noted the importance of the district perspective because districts provide the most direct guidance to their schools, which is where decisions about AA-AAAS participation are made at the local level.
Lazarus introduced the two speakers:
Jacobson and Larson provided their perspectives on the 1.0% threshold and activities in the state of Wisconsin and the districts within CESA 6. Among the points they made together were:
Sheryl Lazarus informed participants of the structure of small group discussions, noting the explicit attempt to place individuals into groups so that there was an opportunity for states and districts to talk to each other. She confirmed the desire for open and candid conversations, and noted that a report would be produced as a result of the discussions.
Following the forum presentations, meeting participants divided into discussion groups as noted previously.
The first discussion session focused on addressing three questions:
The group discussions and follow-up whole-group sharing session comments are summarized here, following the question format that was used for the discussion.
How can states and districts work together to analyze and use data related to the 1.0% threshold?
The groups had rich discussions related to analyzing and using data. Specific suggestions that were mentioned included:
How can states and districts work together to use professional development and technical assistance to lower the percentage of students participating in the alternate assessment?
The groups also suggested a number of ways for states and districts to work together on professional development and technical assistance. For example:
How can states and districts work together to help IEP teams ensure the “right” students are taking the “right” assessment?
The groups also had enthusiastic conversations about IEP teams and how states and districts could work together to influence them. The following points were noted:
The second discussion session focused on addressing three slightly different questions:
The group discussions and follow-up whole-group sharing session comments are summarized here, following the question format that was used for the discussion.
What resources might support states and districts working together to analyze and use data related to the 1.0% threshold?
Participants in the group generated several ideas for supports for data analysis and use:
What resources might support states and districts working together to use professional development and technical assistance to lower the percentage of students participating in the alternate assessment?
Conversations about professional development and technical assistance had been infused in previous discussions. Nevertheless, several key ideas were shared:
A frequent comment was to involve all stakeholders in anything developed for professional development and technical assistance to ensure that the materials meet actual needs. Another frequent comment was that time needed to be taken to ensure that all systems and documents align with each other.
What resources might support states and districts working together to help IEP teams ensure the “right” students are taking the “right” assessment?
The discussion about influencing IEP teams was lively. Some of the points made were:
The meeting closed with concluding remarks by Martha Thurlow (NCEO). She thanked participants for their thoughtful discussions and confirmed that a report with the forum proceedings would be available by the fall.
The purpose of this brief document is to provide basic information on the alternate assessment based on alternate academic achievement standards (AA-AAAS)
Timeline of Federal Legislation on the Alternate Assessment
(now known as AA-AAAS)
| Date/Event | Major Provisions |
|---|---|
| IDEA 1997 | Alternate assessment first required – no indication of numbers |
| IDEA Final Rule 1999 |
No information about numbers |
| ESEA 2001 (NCLB) |
Alternate assessment included in accountability (AYP), but no provision for alternate achievement standards |
| NCLB NPRM 2002 | Introduced idea of alternate achievement standards; proposed a cap of 0.5% on who could count as proficient for AYP – at the state and LEA level |
| NCLB Final Rule 2002 |
Used the term “alternate achievement standards” but delayed the definition of the percentage that could count as proficient for AYP – kept the same grade level achievement standards, pending another notice of proposed rulemaking (due to the many comments received) |
| NCLB NPRM 2003 |
Explained the source of the 0.5% figure, but then recognized some of the limitations in the scientific basis for that figure; proposed a cap of 1.0% on who could count as proficient for AYP |
| NCLB Final Rule 2003 | Provided for the 1.0% cap, and also allowed for the Secretary of Education to approve an exception for a state (or for a state to approve an exception for an LEA) |
| ESEA 2015 (ESSA) | Applied the 1.0% cap to participation rather than performance; percentage is based on the number of students with valid test scores in each subject area (across all grades) |
IDEA = Individuals with Disabilities Education Act; ESEA = Elementary and Secondary Education Act; NCLB = No Child Left Behind; NPRM = Notice of Proposed Rule Making; ESSA = Every Student Succeeds Act
Rationale of the 1.0% Threshold Requirement on Participation in the AA-AAAS
The Elementary and Secondary Education Act (ESEA), reauthorized as the Every Student Succeeds Act (ESSA), specifically limits participation in the AA-AAAS to 1.0% of the total assessed population in each subject area at the state level (1111(b)(1)(D)(i)(I)). The statute allows States to apply for a waiver to exceed the 1.0% threshold. Assessment regulations enacted on January 9, 2017 (20 U.S.C 6301–6576) provide details about waiver criteria.
The limit on participation in the AA-AAAS is a change from the AA-AAAS performance cap that was established through 2003 ESEA regulations (section 200.6(a)(2)). The regulations did not limit the number of students who could participate in an AA-AAAS. Rather, they limited the percentage of scores from an AA-AAAS that could be counted as proficient or advanced in a state’s accountability system. Under ESSA assessment regulations, the scores of all students who take an AA–AAAS, no matter how many are proficient, must be reported on State education agency (SEA) and local education agency (LEA) report cards and included in school accountability determinations under Section 1111(c) of the ESEA, including performance against long-term goals and in the Academic Achievement indicator (Federal Register, Dec 8 2016, Volume 81, Number 236, p. 88911). This ensures that the vast majority of students with disabilities are included in the general assessment alongside their peers and that only those with the most significant cognitive disabilities are assessed with an AA-AAAS.
Graphic Displays of AA-AAAS Participation Rates
Rates from 2007-08 to 2016-17

State-level Rates for AA-AAAS Reading in 2016-17

State-level Rates for AA-AAAS Mathematics in 2016-17
