
Note: Starting with 2021-22 data, the U.S. Department of Education no longer used the rounding rule described in this Brief.
In 2015, the Elementary and Secondary Education Act (ESEA) was reauthorized as the Every Student Succeeds Act (ESSA). In that law, for the first time, a state-level cap of 1.0% was placed on the percentage of students who could participate in the state’s alternate assessment based on alternate academic achievement standards (AA-AAAS). The law confirmed that the AA-AAAS was designed for students with the most significant cognitive disabilities who receive special education services through the Individuals with Disabilities Education Act (IDEA). This Brief presents analyses of states’ AA-AAAS participation rates for the four years with data available from the U.S. Department of Education (from 2015-16 through 2018-19).
In 2015-16 when the assessment requirements of the law were first in place, most states had rates above the 1% threshold (Thurlow & Wu, 2019). The U.S. Department of Education’s Office of Elementary and Secondary Education (OESE) considered 2017-18 the baseline year for evaluating the extent to which states were making progress toward the 1.0% requirement. States could request a waiver from the requirement for each subject area (math, reading, science) if they had an overall test participation rate of 95% and a 95% participation rate for students with disabilities. OESE confirmed through a letter to state assessment and Title I directors that there would be consequences for states not meeting the requirement to assess 1.0% or less of students with the AA-AAAS (Rooney & Ryder, 2019). In this letter to states, four actions the U.S. Department of Education might take were defined (see box).
1. Sending a letter notifying the State that it has assessed more than 1.0 percent of tested students with an AA-AAAS and requiring the state to submit a plan to come into compliance with the 1.0 percent cap.
2. Placing a condition on the State’s Title I Part A grant award. As part of the condition, a State would be required to submit a plan to assess no more than 1.0 percent of students with an AA-AAAS in each subject.
3. Imposing high risk status on the State’s Title I Part A grant award. A State with such a high risk status would be required to submit a plan to come into compliance with the 1.0 percent cap and to participate in joint OESE/OSEP monitoring calls while the State works to meet the requirement.
4. Withholding Title I Part A State administrative funds. If the Department of Education withholds funds, a State would be required to submit a plan to come into compliance with the 1.0 percent cap and participate in joint OESE/OSEP monitoring calls while they work to come into compliance.
The way in which the AA-AAAS participation rate was calculated was delineated (number of students with Individualized Education Programs (IEPs) tested with the AA-AAAS divided by the total number of students tested in a subject). Further, the U.S. Department of Education clarified that it would round to the nearest tenth (e.g., 1.0%) to determine whether a state met the participation requirement (Rooney & Ryder, 2019). The rounding rule used by OESE to determine whether a state met the requirement was portrayed as a typical rounding rule. In other words, 0.05% and above were rounded to 0.1%, whereas 0.04% and below were rounded to 0.0%. Thus, a state with an AA-AAAS participation rate of 1.05% was treated as a state with a rate of 1.1%. A state with a participation rate of 1.04% was treated as a state with a rate of 1.0%.
The purpose of this Brief is to provide information on AA-AAAS participation rates from 2015-16 through 2018-19 using the rounding rule.1 In this Brief, we examine: (a) the number of states meeting the 1.0% participation requirement in each year from 2015-16 through 2018-19 for mathematics (i.e., math) and reading/language arts (i.e., reading), and (b) states with decreasing and states with increasing patterns of participation rates across the four years in math and reading.
Datasets. To determine state AA-AAAS participation rates, we gathered data on the number of students in each of two subjects (math, reading) who participated in the AA-AAAS. The data we analyzed were from the IDEA Data Center website, which summarizes IDEA Part B annual performance report assessment data. To calculate percentages based on the states’ total tested population in each subject, as required by ESSA, we obtained data only available from the U.S. Department of Education. Our analyses focused on data for the years 2015-16 through 2018-19. Because of state assessment interruptions due to COVID 19, 2018-19 is the most recent year for which data were available.
States. The number of states with data varied by year and content area (from 46 to 49 states)2 because some states’ data were either missing or suppressed by the U.S. Department of Education due to data quality issues. There were 38 states with both reading and math data for all four years and four states with four years of data in either reading (Georgia and Iowa) or math (Minnesota and New Hampshire).
Participation rates. Rates for AA-AAAS participation were calculated for math and reading separately for each state and year using the requirements of ESSA. We divided the number of students with IEPs who participated in the AA-AAAS in a subject by the total number of students tested in the subject. We examined rates rounded to the nearest tenth, using the rounding rule defined by the U.S. Department of Education (see rounding example in box; see Table 1 for participation rates by state, year, and content area).
Pattern. AA-AAAS participation rates that were either decreasing or increasing from 2015-16 through 2018-19 were identified. Decreasing refers to states with participation rates less than or equal to each of the previous years from 2015-16 through 2018-19. Increasing refers to states with participation rates greater than or equal to each of the previous years from 2015-16 through 2018-19.
Examples of Rounding Rule Application for AA-AAAS Participation
0.50% – 1.04% = 1.0%
1.05% – 1.14% = 1.1%
1.15% – 1.24% = 1.2%
Etc.
Table 1. AA-AAAS Participation Rate by State, Content Area, and Year
| State | Math | Reading | ||||||
|---|---|---|---|---|---|---|---|---|
| 2015-16 | 2016-17 | 2017-18 | 2018-19 | 2015-16 | 2016-17 | 2017-18 | 2018-19 | |
| Alabama | 1.1% | 1.2% | 1.3% | 1.3% | 1.1% | 1.2% | 1.3% | 1.3% |
| Alaska | - | 0.9% | 0.8% | 0.8% | - | 0.9% | 0.8% | 0.8% |
| Arizona | 1.2% | 0.9% | 0.8% | 1.0% | 1.2% | 0.9% | 0.8% | 1.0% |
| Arkansas | 1.3% | 1.4% | 1.2% | 1.5% | 1.4% | 1.4% | 1.2% | 1.5% |
| California | 1.0% | 1.1% | 1.1% | 1.1% | 1.0% | 1.1% | 1.1% | 1.1% |
| Colorado | 1.0% | 1.0% | 0.9% | 0.9% | 1.0% | 1.0% | 0.9% | 0.9% |
| Connecticut | 1.4% | 1.6% | 1.5% | 1.4% | 1.4% | 1.6% | 1.5% | 1.4% |
| Delaware | 1.5% | 1.4% | 1.4% | 1.4% | 1.5% | 1.4% | 1.4% | 1.5% |
| Florida | 1.2% | - | 1.5% | 1.6% | 1.4% | - | 1.4% | 1.5% |
| Georgia | 1.0% | 1.1% | 1.2% | - | 1.1% | 1.3% | 1.3% | 1.3% |
| Hawaii | 1.0% | 1.0% | 1.1% | 1.0% | 1.0% | 1.0% | 1.1% | 1.0% |
| Idaho | 1.2% | 1.2% | 1.2% | 1.0% | 1.2% | 1.2% | 1.2% | 1.0% |
| Illinois | 1.1% | 1.6% | 1.1% | 1.1% | 1.1% | 1.1% | 1.1% | 1.1% |
| Indiana | - | 1.3% | 1.2% | 1.2% | - | 1.3% | 1.2% | 1.2% |
| Iowa | 0.7% | 0.8% | 0.8% | - | 0.7% | 0.8% | 0.8% | 0.8% |
| Kansas | 1.1% | 1.1% | 1.2% | 1.1% | 1.1% | 1.1% | 1.1% | 1.1% |
| Kentucky | 1.2% | 1.2% | 1.1% | 1.1% | 1.2% | 1.2% | 1.1% | 1.1% |
| Louisiana | 1.4% | 1.6% | 1.3% | 1.6% | 1.5% | 1.6% | 1.3% | 1.6% |
| Maine | 1.2% | 1.2% | 1.0% | 1.0% | 1.2% | 1.2% | 1.0% | 1.0% |
| Maryland | 1.0% | 1.1% | - | 1.1% | 1.0% | 1.1% | - | 1.1% |
| Massachusetts | 1.7% | 1.6% | 1.5% | 1.4% | 1.6% | 1.6% | 1.5% | 1.4% |
| Michigan | 2.4% | 2.4% | 2.2% | 2.0% | 2.3% | 2.3% | 2.1% | 2.0% |
| Minnesota | 1.5% | 1.4% | 1.4% | 1.4% | 1.5% | 1.4% | 1.4% | - |
| Mississippi | 1.9% | 1.6% | 1.5% | 1.4% | 1.7% | 1.6% | 1.4% | 1.4% |
| Missouri | 1.3% | 1.5% | 1.1% | 0.9% | 1.3% | 1.5% | 1.1% | 0.9% |
| Montana | 1.2% | 1.0% | 1.0% | - | 1.1% | 1.0% | 1.0% | - |
| Nebraska | 1.3% | 1.3% | 1.1% | 1.0% | 1.3% | 1.3% | 1.1% | 1.0% |
| Nevada | 0.9% | 0.9% | 0.9% | 0.9% | 0.9% | 0.9% | 0.9% | 0.9% |
| New Hampshire | 0.9% | 0.8% | 0.9% | 0.9% | 0.9% | 0.8% | - | 0.9% |
| New Jersey | 1.2% | 1.2% | 1.3% | 1.3% | 1.2% | 1.2% | 1.2% | 1.3% |
| New Mexico | 0.8% | 1.0% | - | 1.0% | 0.8% | 1.0% | 1.0% | - |
| New York | 1.8% | 1.8% | 1.7% | 1.7% | 1.8% | 1.8% | 1.8% | 1.7% |
| North Carolina | 1.0% | 1.0% | 1.1% | 1.1% | 1.0% | 1.0% | 1.0% | 1.1% |
| North Dakota | 1.1% | 1.1% | 1.0% | 1.0% | 1.1% | 1.1% | 1.0% | 1.0% |
| Ohio | 1.9% | 2.0% | 2.0% | 2.0% | 1.9% | 1.9% | 2.0% | 1.9% |
| Oklahoma | 1.6% | 1.7% | 1.7% | 1.6% | 1.7% | 1.7% | 1.7% | 1.6% |
| Oregon | 1.4% | 1.3% | 1.2% | 1.2% | 1.4% | 1.3% | 1.2% | 1.2% |
| Pennsylvania | 1.9% | 1.9% | 2.0% | 2.0% | 1.9% | 1.9% | 2.0% | 2.0% |
| Rhode Island | 1.1% | 1.1% | 1.3% | 1.3% | 1.1% | 1.1% | 1.3% | 1.3% |
| South Carolina | 0.9% | 0.9% | 0.9% | 1.0% | 0.9% | 0.9% | 0.9% | 1.0% |
| South Dakota | 1.5% | 1.3% | 1.2% | 1.0% | 1.5% | 1.3% | 1.2% | 1.0% |
| Tennessee | - | 1.4% | 1.4% | 1.5% | - | 1.4% | 1.4% | 1.5% |
| Texas | 1.2% | 1.3% | 1.4% | 1.4% | 1.1% | 1.2% | 1.3% | 1.3% |
| Utah | 1.1% | 1.0% | 1.0% | 0.9% | 1.0% | 1.0% | 1.0% | 0.9% |
| Vermont | 1.0% | 1.1% | - | - | 1.0% | 1.1% | - | - |
| Virginia | 1.0% | 1.0% | 1.0% | 1.1% | 1.2% | 1.2% | 1.2% | 1.2% |
| Washington | 1.0% | 1.0% | 1.0% | 1.0% | 1.0% | 1.0% | 1.0% | 1.0% |
| West Virginia | 1.4% | 1.3% | 1.3% | 1.2% | 1.4% | 1.3% | 1.3% | 1.2% |
| Wisconsin | 1.2% | 1.2% | 1.0% | 0.9% | 1.2% | 1.2% | 1.0% | 0.9% |
| Wyoming | 1.0% | 1.0% | 1.0% | 1.0% | 1.0% | 1.0% | 1.0% | 1.0% |
Figure 1 presents the number of states meeting the 1.0% AA-AAAS participation requirement each year. This figure includes all states, not only those with data for all four years. In 2018-19, the most recent year with data available, 18 states met the 1.0% requirement in math and 18 states met the 1.0% requirement in reading. These numbers are slight increases from the rates in previous years.
Figure 1. Number of States Meeting the 1.0% Requirement in Each Year from 2015-16 through 2018-19
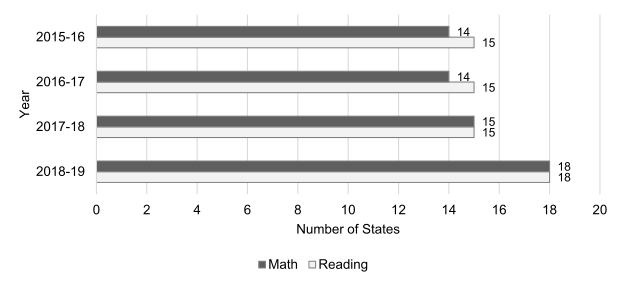
Note: States may only meet the 1.0% requirement in either math or reading AA-AAAS.
Across the states with data in each year, the increases in the number of states meeting the requirement were minimal for both reading and math, until the year 2018-19 when there was a slightly greater increase.
Figure 2 shows that just six of the states that had math data for all four years (n = 40) met the 1.0% requirement in each of the four years (Colorado, Nevada, New Hampshire, South Carolina, Washington, and Wyoming).
Figure 2. States Meeting the 1.0% Requirement for Math in All Four Years
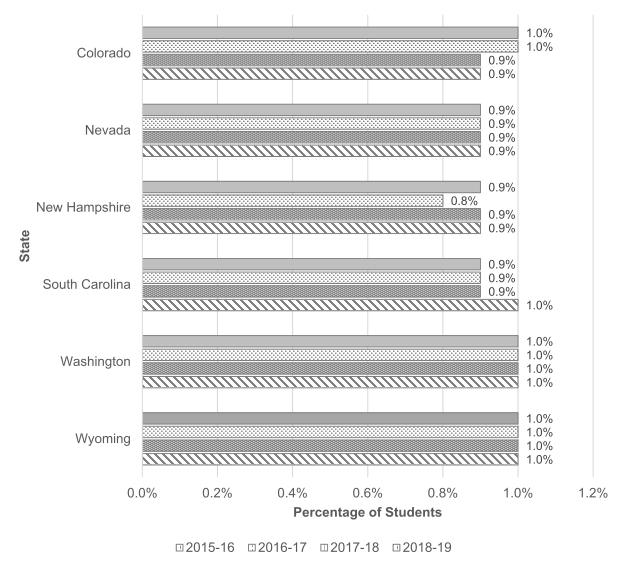
Note: States included in this figure had data for all years from 2015-16 through 2018-19.
Figure 3 shows just seven of the 40 states that had reading data for all four years met the 1.0% requirement each of the four years (Colorado, Iowa, Nevada, South Carolina, Utah, Washington, and Wyoming). Colorado, Nevada, South Carolina, Washington, and Wyoming met the 1.0% requirement for both math and reading for all four years, while three states met the 1.0% requirement either in math (New Hampshire) or reading (Iowa and Utah,) AA-AAAS (see Figures 2 and 3).
Figure 3. States Meeting the 1.0% Requirement for Reading in All Four Years
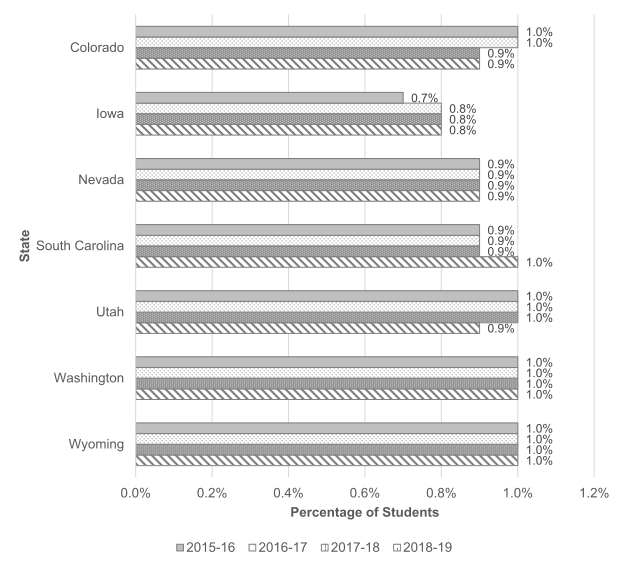
Note: States included in this figure had data for all years from 2015-16 through 2018-19.
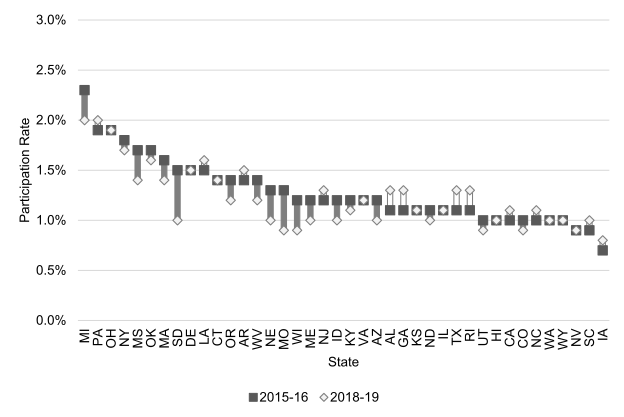
Figures 4 and 5 present the difference between the 2015-16 and 2018-19 AA-AAAS participation rates for math (Figure 4) and reading (Figure 5) for the 40 states with valid data for 2015-16 through 2018-19. States are ordered in the figures from those with the highest AA-AAAS participation rates in 2015-16 to those with the lowest AA-AAAS participation rates in 2015-16.
For math (see Figure 4), rates decreased at least 0.1 percentage points in 19 of the 40 states (48%) from 2015-16 through 2018-19. Although the amount of decrease varied considerably, nine of these states did not meet the U.S. Department of Education’s 1.0% requirement in 2018-19. Some of the states with the highest participation rates in 2015-16 showed the greatest decreases (e.g., Michigan, Mississippi, Missouri, South Dakota). Still, some states showed increases in their AA-AAAS participation rates from 2015-16 through 2018-19 (e.g., Arkansas, Texas). Several of the states that met the 1.0% requirement in 2015-16 showed small to moderate increases in participation rates, but most remained below 1.0%.
Figure 4. Differences in Math AA-AAAS Participation Rates Between 2015-16 and 2018-19
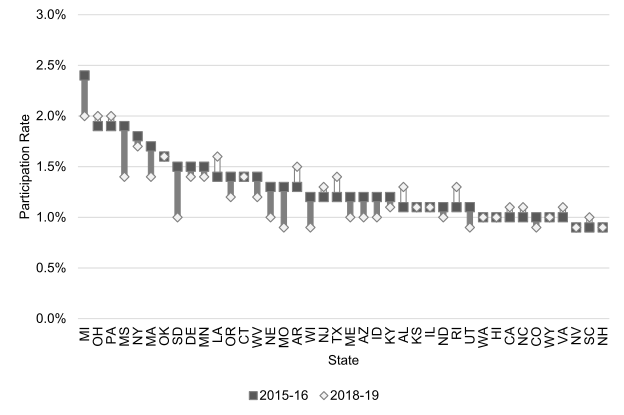
Note: States included in this figure had data for all years from 2015-16 through 2018-19.
For reading (see Figure 5), rates decreased at least 0.1 percentage points in 18 of the 40 states (45%). Although the amount of decrease varied considerably, it was less variable than for math. Many of these states did not meet the 1.0% requirement in 2018-19. Several states with the highest participation rates in 2015-16 showed the greatest decreases (e.g., Michigan, Mississippi, Missouri, Nebraska, South Dakota, and Wisconsin). States that showed increases in their AA-AAAS participation rates from 2015-16 through 2018-19 generally had smaller increases; Alabama, Georgia, Texas, and Rhode Island reported the largest increases.
Figure 5. Differences in Reading AA-AAAS Participation Rates Between 2015-16 and 2018-19
Note: States included in this figure had data for all years from 2015-16 through 2018-19.
Most states with four years of data showed variable participation rates (i.e., neither consistently decreasing rates nor increasing rates) or insufficient data across the four years. For math, the numbers were 24 states with variable patterns and 10 states with insufficient data. For reading, the numbers were 22 states with variable patterns and 10 states with insufficient data. In four states, the states with insufficient data were different for math and reading.
States with Pattern of Decreasing AA-AAAS Participation Rates. Figures 6 and 7 show states with a pattern of decreasing AA-AAAS participation rates across years for math (n = 11, see Figure 6) and reading (n = 12, see Figure 7). Ten states showed decreasing patterns in both math and reading AA-AAAS. Only Colorado met the 1.0% requirement for both math and reading AA-AAAS across all four years. In 2018-19, in addition to Colorado, five other states (Nebraska, North Dakota, South Dakota, Utah, and Wisconsin) met the 1.0% requirement for both math and reading.
Figure 7 shows that Colorado, Utah, and Washington met the 1.0% requirement across all four years in reading AA-AAAS, and Nebraska, North Dakota, South Dakota, and Wisconsin met the 1.0% requirement in 2018-19. More states met the 1.0% requirement in reading (n = 3) than in math (n = 1) in 2015-16, but in 2018-19 the number of states meeting the requirement was very similar for math (n = 6) and reading (n = 7). Among states with a decreasing pattern across years (math n = 11; reading n = 12), more than half (math n = 6, 55%; reading n = 7, 58%) met the 1.0% requirement in 2018-19.
States with Pattern of Increasing AA-AAAS Participation Rates. Figures 8 and 9 show states with a pattern of increasing AA-AAAS participation rates across years for math (n = 5) and reading (n = 5). Four of these states had increasing rates in both math and reading (Alabama, California, North Carolina, and Pennsylvania). In 2015-16, only two of these states had met the 1.0% requirement for both math and reading AA-AAAS: California met it for both math and reading in 2015-16, but not in subsequent years; North Carolina met the 1.0% requirement for reading in 2015-16, 2016-17, and 2017-18, but not in 2018-19. Among states with a pattern of increasing rates, none of them met the 1.0% requirement in 2018-19.
Figure 6. States with a Decreasing Pattern of AA-AAAS Participation Rates for Math Across Years
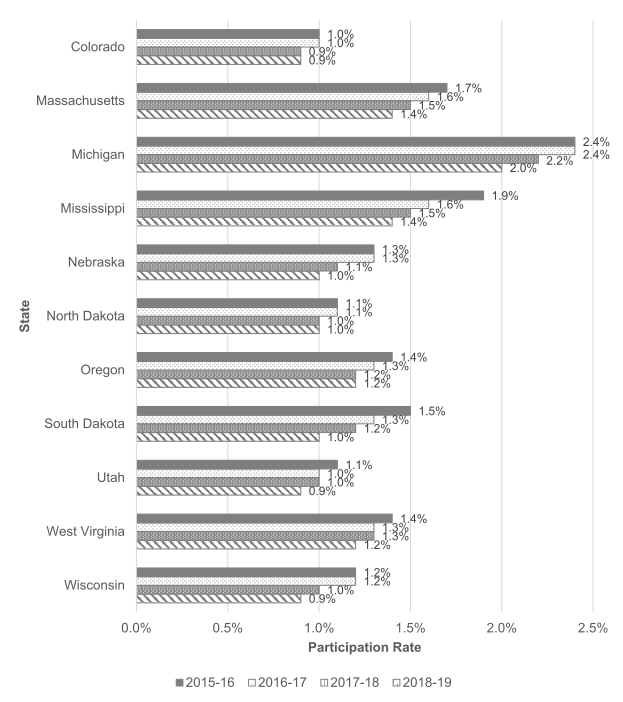
Note: States included in this figure had data for all years from 2015-16 through 2018-19.
Figure 7. States with a Decreasing Pattern of AA-AAAS Participation Rates for Reading Across Years
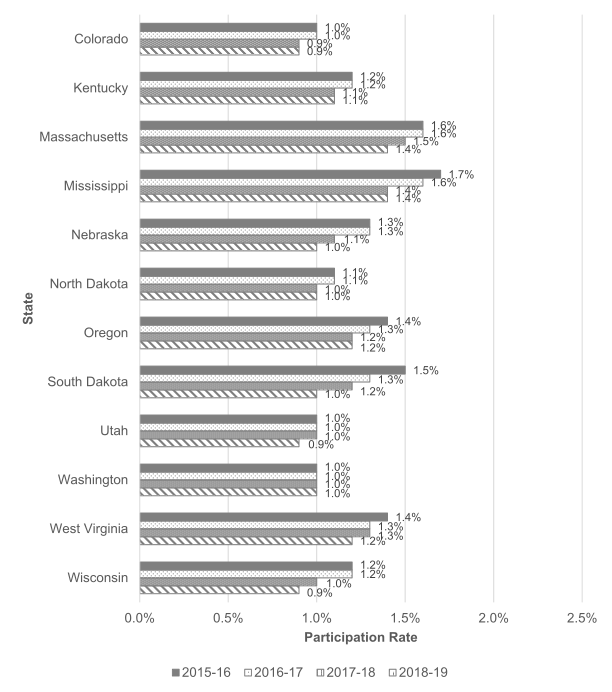
Note: States included in this figure had data for all years from 2015-16 through 2018-19.
Figure 8. States with an Increasing Pattern of AA-AAAS Participation Rates for Math Across Years
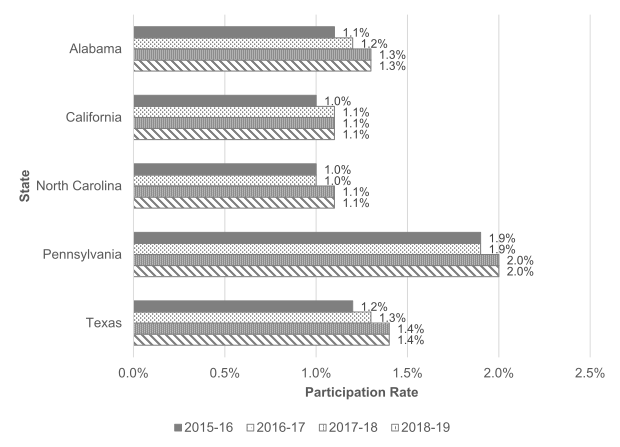
Note: States included in this figure had data for all years from 2015-16 through 2018-19.
Figure 9. States with an Increasing Pattern of AA-AAAS Participation Rates for Reading Across Years
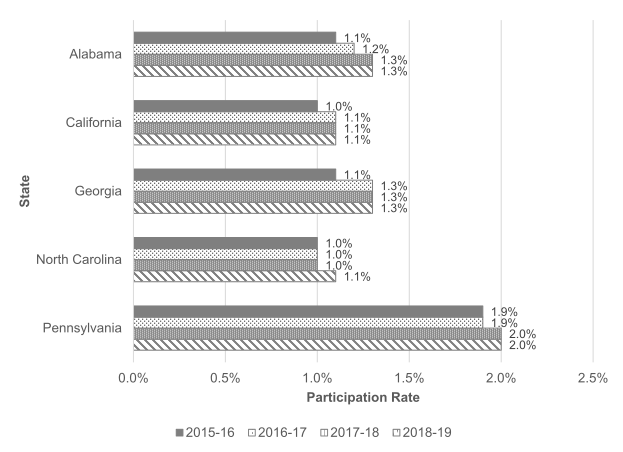
Note: States included in this figure had data for all years from 2015-16 through 2018-19.
In 2015, federal law introduced the requirement of a 1% cap at the state level on participation in the AA-AAAS, but did not provide information about the participation rate rounding rule. It did indicate the rate was based on the total number of tested students in each tested subject (e.g., math, reading, science). NCEO has summarized data on math and reading AA-AAAS participation in its APR Snapshot Brief series since 2008-09 (Thurlow et al., 2012; Thurlow & Wu, 2016, 2018; Vang & Thurlow, 2013; Wu et al., 2016, 2020, 2021, 2022; Wu & Thurlow, 2018, 2019). The focus of these reports has varied across years. NCEO first focused on rates based on the total population of students with IEPs, and then on states with participation rates below 1% based on total enrollment. More recently NCEO calculated participation rates based on total tested students in a subject but focused on states with participation rates less than 1.0%.
In this Brief, we focused specifically on AA-AAAS participation rates using the calculation approach and rounding rules now used by the U.S. Department of Education. Only four years of data were available to us. There was no data for 2019-20 because testing was waived that year due to the pandemic. Even though testing resumed in 2020-21, those data were sporadic and generally considered unreliable because of varying participation rates and non-comparable administration conditions. As a result, we did not attempt to gather 2020-21 data to include in this Brief. For the four years since the passage of ESSA, 2015-16 through 2018-19, we examined both participation rates and patterns of decreasing and increasing rates.
Data limitations for our analysis include the fact that data were not available for all states for all years. Still, the number of states meeting the 1.0% requirement was fairly stable at about 15 states for both math and reading from 2015-16 through 2017-18. There was a notable but small increase in the number of states meeting the requirement in 2018-19 (to 18 states). Whether this increase represents a trend is impossible to say because testing was waived in 2020, and data available for 2020-21 are not considered reliable.
We also found that a limited number of states met the 1.0% requirement across all of the four years for which data were available (six states in math; seven states in reading). When we compared states’ rates in 2018-19 to those in 2015-16, we found that about 50% of states with data for both years showed lower rates in 2018-19 compared to 2015-16.
Patterns in rates across the four years were variable in most states for both math and reading. Some states showed consistent decreases in AA-AAAS participation rates (11 states in math; 12 states in reading). A few states showed consistent increases in AA-AAAS participation rates (five states in math; five states in reading), and most of those states had relatively low rates at the beginning of the time period. All the states in the group of states with a pattern of increasing rates eventually did not meet the 1.0% requirement in 2018-19 even though some of them met the requirement in 2015-16. States with a decreasing pattern more often met the requirement in 2018-19 than in 2015-16. More states made this progress in meeting the requirement in reading than in math.
The implications of the data in this Brief are limited by the lack of data in the years after 2018-19. Although some states showed rates below 1.0% or reductions in rates across the years, this analysis should be updated as more years of data become available. It will be important to continue to document AA-AAAS participation rates to determine whether sufficient progress is being made in ensuring that participation in the AA-AAAS is 1.0% or less of total tested students.
1 This rounding rule was not used in previous NCEO APR Snapshot Briefs that had information on participation in the AA-AAAS (see Thurlow & Wu, 2018; Wu et al., 2020, 2021, 2022; Wu & Thurlow, 2019).
2 The number of states with data each year for math was 47, 49, 47, and 46 in 2015-16, 2016-17, 2017-18, and 2019-19, respectively. The number of states with data each year for reading was 47, 49, 47, and 45 in 2015-16, 2016-17, 2017-18, and 2019-19, respectively. The states without data varied by subject (math, reading) and year. The data for all states are available in Table 1.
Rooney, P., & Ryder, R. (2019). Information regarding consequences for states not meeting the requirement to assess not more than 1.0 percent of students on the alternate assessment. https://www2.ed.gov/admins/lead/account/saa/state1capconsequences19final.pdf
Thurlow, M., & Wu, Y.-C. (2018). 2015-2016 APR snapshot #18: AA-AAS participation and performance. National Center on Educational Outcomes.
Thurlow, M., & Wu, Y.-C. (2016). 2013-2014 APR snapshot #12: AA-AAS participation and performance. National Center on Educational Outcomes.
Thurlow, M., Altman, J., & Vang, M. (2012). 2008-2009 APR snapshot #3: AA-AAS participation and performance. National Center on Educational Outcomes.
Vang, M., & Thurlow, M. (2013). 2010-2011 APR snapshot #6: AA-AAS participation and performance. National Center on Educational Outcomes.
Wu, Y.-C., & Thurlow, M. L. (2019). 2016-2017 APR snapshot #21: AA-AAS participation and performance. National Center on Educational Outcomes.
Wu, Y.-C., & Thurlow, M. (2018). 2014-2015 APR snapshot #15: AA-AAS participation and performance. National Center on Educational Outcomes.
Wu, Y.-C., Lazarus, S. S., & Liu, K. K. (2021). 2017-2018 APR snapshot #24: AA-AAAS participation and performance. National Center on Educational Outcomes.
Wu, Y.-C., Lazarus, S.S., Liu, K. K., & Thurlow, M. L. (2022). 2018-2019 APR snapshot #27: AA-AAS participation and performance. National Center on Educational Outcomes.
Wu, Y.-C., Liu, K. K., Lazarus, S. S., & Thurlow, M. L. (2020). 2017-2018 APR snapshot #23: Students in special education assigned assessment accommodations. National Center on Educational Outcomes.
Wu, Y.-C., Thurlow, M., & Vang, M. (2016). 2011-2012 APR snapshot #9: AA-AAS participation and performance. National Center on Educational Outcomes.
The authors of this Brief were Yi-Chen Wu, Sheryl S. Lazarus, and Martha L. Thurlow
NCEO Director, Sheryl Lazarus; NCEO Assistant Director, Kristin Liu.
All rights reserved. Any or all portions of this document may be reproduced and distributed without prior permission, provided the source is cited as:
Wu, Y.-C., Lazarus, S. S., & Thurlow, M. L. (2023, March). Meeting the 1% AA-AAAS participation requirement (NCEO Brief #29). National Center on Educational Outcomes.
The Center is supported through a Cooperative Agreement (#H326G210002) with the Research to Practice Division, Office of Special Education Programs, U.S. Department of Education. The Center is affiliated with the Institute on Community Integration at the College of Education and Human Development, University of Minnesota. Consistent with EDGAR §75.62, the contents of this report were developed under the Cooperative Agreement from the U.S. Department of Education, but do not necessarily represent the policy or opinions of the U.S. Department of Education or Offices within it. Readers should not assume endorsement by the federal government.
Project Officer: David Egnor
NCEO works in collaboration with Applied Engineering Management (AEM), Center for Parent Information (CPIR), Council of Chief State School Officers (CCSSO), National Association of State Directors of Special Education (NASDSE), and WestEd.
 |
|||
The University of Minnesota is an equal opportunity employer and educator.
This publication is available in alternative formats upon request. Direct requests to:
National Center on Educational Outcomes
University of Minnesota
2025 East River Parkway, Room 1-330
Minneapolis, MN 55414
Phone 612/626-1530