NCEO Brief |
July
2011
Number 4
|
A New Series of Briefs for the Race to
the Top (RTTT) Assessment Consortia
Understanding Subgroups in Common
State Assessments:
Special Education Students and ELLs
Although most assessment developers have
a sense of the nature of the general
student population, they often lack an
understanding of the characteristics of
special education students and English
Language Learners (ELLs) who will
participate in the assessment. The
Race-to-the-Top Assessment Consortia
have the rare opportunity to know who
these students are and to apply that
knowledge as they design and develop
their common assessment systems.
This Brief presents information on the
characteristics of special education
students and ELLs in the Consortia
states. It provides recommendations for
the Consortia about steps to take as
they design their assessment systems.
Special Education Students
Special education students comprise 13%
of the population of all public school
students. (This and other general
percentages in this Brief are based on
children ages 3-21. This age range is
the most common one for which data are
available across data sets used to
describe students with disabilities and
English language learners.) Yet, individual states vary in
their percentages of special education
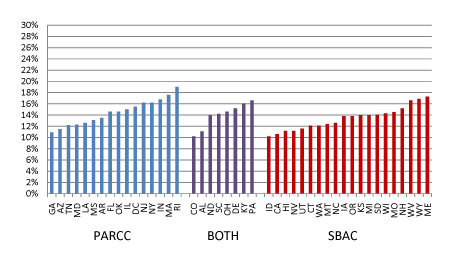
students. Figure 1 shows the percentages
of students receiving special education
services in Consortia states in 2008–09.
Figure 1. Percentage of
Students Receiving Special Education
Services in Consortia States in 2008-09

Data were
adapted from National Center for
Education Statistics, Common Core of
Data (CCD), “State Non-fiscal Survey of
Public Elementary/Secondary Education,”
2008-09 representing children ages 3-21
via http://nces.ed.gov/transfer .asp?location=www.ideadata.org/PartBdata.asp.
Data from Vermont (a member of SBAC)
were not included in the CCD data set.
The information on state membership in
this figure was accurate as of June,
2011.
In the Partnership for the Assessment of
Readiness for College and Careers
(PARCC) Consortium, the population of
public school students in special
education ranged from 10% to 19%. In the
SMARTER Balanced Assessment Consortium
(SBAC), the special education population
ranged from 10% to just under 18%.
One way to describe the characteristics
of special education students is by
their disability category. Yet, students
within a single category have diverse
needs. And, most of the 6.5 million
special education students (except for a
portion with the most significant
cognitive disabilities who may fall in
such categories as intellectual
disabilities, autism, and multiple
disabilities) participate in the general
state assessment. They do not
participate in an alternate assessment
based on alternate achievement
standards.
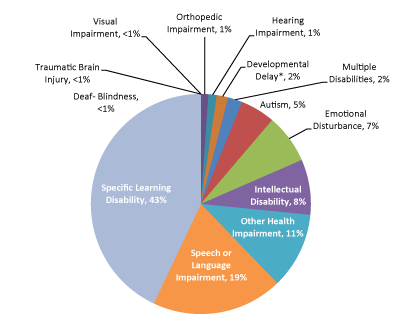
Nationally, there are 13 special
education disability categories. Figure
2 shows these categories, along with
their prevalence nationally.
Figure 2. Percentage of
Students in Special Education Disability
Categories Nationally in Fall 2008

Data were adapted from
Table 1-3 (Students ages 6 through 21
served under IDEA, Part B, by disability
category and state: Fall 2008) via
www.IDEAdata.org for the 50 states.
*Developmental delay is applicable to
children ages 3 through 9.
The percentages of students in each
category vary tremendously across
states. For example, the percentages of
special education students with specific
learning disabilities (LD) varied from
15% of the special education population
in one state to 60% in another. The LD
range for PARCC was from 15% to 54% of
special education students. For SBAC,
the range was from 15% to 60%. The
percentage of students with intellectual
disabilities varied from 3% to 19% in
both the PARCC states and the SBAC
states.
These variations in size and composition
imply that special education populations
may differ in specific ways across the
member states in each Consortium.
English Language Learners
English language learners are defined
here as those students receiving
services for their limited English
proficiency. In the 50 states,
approximately 9% of the population of
public school children is considered to
be ELLs. Figure 3 shows the percentages
of students who received ELL services in
the Consortia states in 2008–09.
Figure 3. Percentage of
Students Receiving ELL Services in
Consortia States in 2008-09

Data were adapted from
NCES Common Core Data (2008-2009) “Local
Education Agency Universe Survey”
representing children ages 3-21 via
http://nces.ed.gov/ccd. Data from Maine
(a member of SBAC), Maryland, Oklahoma,
and Rhode Island (members of PARCC) were
not included in the CCD data set. The
information on state membership in this
figure was accurate as of June, 2011.
In PARCC states, the percentages of ELLs
ranged from 1% to nearly 12% of the
public school population. In SBAC
states, the percentages of ELLs ranged
from just under 1% to 24%. These
state-level percentages can conceal some
large degrees of variability in the size
of the ELL population between and within
school districts in a state. States with
a small overall population of ELLs may
still have school districts with large
percentages of ELLs.
ELLs come from a variety of home
language backgrounds. Across the nation
in 2008, the five home languages that
states most frequently report for ELLs
are: Spanish, Vietnamese, Chinese,
Arabic, and Russian. Still, states
differ in the top five home languages
found in their own ELL populations.
Figure 4 shows the extent to which
Consortia states share one or more of
the nation’s top five home languages.
Figure 4. Appearance of the
Nation’s Five Most Common Home Languages
in Consortia States' Top 5 Languages

Data were
adapted from State Consolidated
Performance Reports available on the
federal government Department of
Education website via
http://www2.ed.gov/admins/lead/account/consolidated/sy07-08part1/index.html#ak.
The information on state membership in
this figure was accurate as of June,
2011.
States in both Consortia vary with
regard to sharing one or more of the
nation’s five most common home languages
(Spanish, Vietnamese, Chinese, Arabic,
and Russian) as one of their top five
language groups for ELLs. In PARCC, two
states report only one of those common
languages in their top five while one
state reports all five of them. In SBAC,
one state reports none of the nation’s
most common languages are among its top
five language groups while two other
SBAC states report that all five
languages are among its top five
language groups. It is important to note
that Consortia states with one or fewer
of the nation’s most common home
languages also had at least two American
Indian and Alaska Native languages
included among their state’s top five
home languages.
Spanish is a top five home language in
almost all of the states in both
Consortia, but there are more than 60
other languages that comprise the top
five home languages across the 50
states. (The number of home languages in
individual states often is reported as
much higher than this number; often
these counts include variations of one
language--Mandarin and Chinese may be
counted as two languages in some
states). More than 10 of these languages
are American Indian and Alaska Native
languages, even though the percentage of
these students nationally who are ELLs
may be relatively small. Both Consortia
have member states that report two or
more American Indian and Alaska Native
languages among the top five home
languages.
ELLs with Disabilities
ELLs with disabilities also are an
important part of the assessment
population. Like other special education
students or other ELLs, most of these
students will participate in the general
state assessment rather than an
alternate assessment.
Nationally, ELLs with disabilities
comprise almost 8% of the population of
public school students with
disabilities. Yet, the percentages in
individual states vary. Figure 5 shows
the percentages of ELLs with
disabilities in Consortia states in
2008–09.
Figure 5. Percentage of
Special Education Students Receiving ELL
Services in Consortia States in Fall
2008

Data were
adapted from 2008 Part B Educational
Environments Tables 2-2, 2-3, 2-5a, 2-6a
representing children ages 3-21 via
www.IDEAdata.org. Data from Vermont (a
member of SBAC) were not included in the
IDEAdata.org data set. The information
on state membership in this figure was
accurate as of June, 2011.
In PARCC states, the percentages of ELLs
with disabilities ranged from just over
0% to 12% of the special education
population. In SBAC states, the
percentages ranged from nearly 0% to
28%.
Recommendations
The student characteristics data
presented in this Brief demonstrate the
diversity of special education students,
ELLs, and ELLs with disabilities. They
also show the variability in these
student populations across states within
Consortia. The Consortia should ensure
that they understand both the
characteristics of these students and
the variability that exists across their
member states.
Several recommendations are provided
here for Consortia to consider as they
develop assessment systems that include
all students, including special
education students, ELLs, and ELLs with
disabilities.
- Do not assume that the labels of
groups adequately describe the
characteristics of the students. There
is considerable variability within each
of the groups described here, and that
variability is multiplied when states
are grouped together in the Consortia.
It is essential to look beyond the group
names of special education students,
ELLs, and ELLs with disabilities, and to
develop appropriate mechanisms to
accurately understand the
characteristics of each of them in
greater depth (see Resources).
- Recognize that populations of special
education students, ELLs, and ELLs with
disabilities vary across the states in
the Consortia. Each state is unique in
the size and composition of the special
education population, the prevalence of
various home languages for ELLs, and
other factors relevant to its assessment
system. The Consortia should consider
the implications of this variation
across states as they develop assessment
systems that can be used by all of their
states.
- Recognize that almost all special
education students, ELLs, and ELLs with
disabilities will be participants in the
assessment systems that the Consortia
are developing. Misperceptions about the
severity of disability or lack of
English language skills are rampant.
Most special education students do not
have the significant cognitive
disabilities that might result in their
participation in an alternate assessment
based on alternate achievement
standards. Most ELLs are not fluent in a
language other than English, but rather
are limited in both their English and
home language proficiency. Taking time
to truly understand the characteristics
of students who will be participants in
the assessments is an important step in
making assessment design choices that
support the validity of the assessment
system for all subgroups.
- Address the needs of special
education students, ELLs, and ELLs with
disabilities throughout the design,
development, and testing of assessments.
These needs may require that assessments
have embedded accessibility features and
include accommodations for some
students. These groups should also have
experiences with formative and interim
assessments, and they must be included
in all piloting and field testing items
with embedded accessibility features and
accommodations available.
- Form work groups to develop
participation and accommodations
policies. These groups should develop
summaries of the characteristics and
needs of special education students,
ELLs, and ELLs with disabilities who may
participate in the assessment system.
These work groups should explore the
accessibility principles that will guide
the assessment development process, from
the initial development and review of
items, to the development of policies,
and to the approaches for reporting and
using assessment results.
Resources
Allocating Federal Funds for
State Programs for English Language
Learners. (2011). National Research
Council. Washington, DC: National
Academies Press.
Developing Common Accommodations
Policies: Discussion Points for
Consortia. (2011). NCEO.
Minneapolis, MN: University of
Minnesota, National Center on
Educational Outcomes.
Disabilities and Reading:
Understanding the Effects of
Disabilities and Their Relationship to
Reading Instruction and Assessment.
(2009). Thurlow, M. L., Moen, R. E.,
Liu, K. K., Scullin, S., Hausmann, K.
E., & Shyyan, V. Minneapolis, MN:
University of Minnesota, Partnership for
Accessible Reading Assessment.
Don’t Forget Accommodations! Five
Questions to Ask When Moving to
Technology-based Assessments.
(2011). Minneapolis, MN: University of
Minnesota, National Center on
Educational Outcomes.
English Language Learners with
Disabilities: Promising Practices.
(2009, Spring). AccELLerate! (Special
Issue), 1(3).
Meeting the Needs of Special
Education Students: Recommendations for
the Race-to-the-Top Consortia and
States. (2011). Thurlow, M. L.,
Quenemoen, R. F., & Lazarus, S. S.
Washington, DC: Arabella Advisors.
Participation Guidelines for New
Assessments: Thinking Through Their
Development. (2011). Minneapolis,
MN: University of Minnesota, National
Center on Educational Outcomes.
Shifting Trends in Special
Education. (2011). Scull, J., &
Winkler, A. M. Washington, DC: Thomas E.
Fordham Institute.
The State of Learning
Disabilities. (2011). Cortiella, C.
New York, NY: National Center for
Learning Disabilities.
Universal Design and Multi-method
Approaches to Item Review. (2008).
Johnstone, C. J., Thompson, S. J.,
Miller, N. A., & Thurlow, M. L.
Educational Measurement: Issues and
Practice, 27(1), 25-36.
|
 NCEO
Brief #4 NCEO
Brief #4
July
2011
This
Brief
reflects
many
years of
work by
all NCEO
staff.
Contributors
to the
writing
of this
Brief
were,
listed
alphabetically,
Kamarrie
Davis,
Kristi
Liu,
Sheryl
Lazarus,
and
Martha
Thurlow.
NCEO
Co-Principal
Investigators
are
Martha
Thurlow,
Sheryl
Lazarus,
and
Rachel
Quenemoen.
All rights reserved. Any or all portions of this document may be reproduced and distributed without prior permission, provided the source is cited as:
NCEO.
(2011,
July).
Understanding
subgroups
in
common
state
assessments:
Special
education
students
and ELLs
(NCEO
Brief
#4).
Minneapolis,
MN:
University
of
Minnesota,
National
Center
on
Educational
Outcomes.
NCEO Brief is published by the National Center on Educational Outcomes. The Center is supported through a Cooperative Agreement (#H326G050007) with the Research to Practice Division, Office of Special Education Programs, U.S. Department of Education. Opinions expressed herein do not necessarily reflect those of the U.S. Department of Education or Offices within it.
This document is available in alternative formats upon request.
National Center on Educational Outcomes
University of Minnesota • 207 Pattee Hall
150 Pillsbury Dr. SE • Minneapolis, MN 55455
Phone 612/626-1530 • Fax 612/624-0879
The University of Minnesota is an equal opportunity employer and educator.
|
Top of page |


 NCEO
Brief #4