Prepared by:
Martha L. Thurlow, Karen L. Langenfeld, J. Ruth Nelson, Hyeonsook Shin, and JoAnne E. Coleman
May 1998
This document has been archived by NCEO because some of the information it contains is out of date.
Any or all portions of this document may be reproduced and distributed without prior permission, provided the source is cited as:
Thurlow, M. L., Langenfeld, K. L., Nelson, J. R., Shin, H., & Coleman, J. E. (1998). State accountability reports: What are states saying about students with disabilities? (Technical Report 20). Minneapolis, MN: University of Minnesota, National Center on Educational Outcomes. Retrieved [today's date], from the World Wide Web: http://cehd.umn.edu/NCEO/OnlinePubs/Technical20.htm
Public reports on education reflect the ways in which
accountability is handled by the state. The
extent to which students with disabilities are included in these reports is an important
index of the extent to which responsibility is taken for the education of these students.
This analysis presents information on accountability reports
sent to us from 48 states and Washington, DC. Our
analysis of the 113 reports we received focused on the accountability systems in general
and, specifically, on how students with disabilities are represented in the reports. Results of this analysis include the findings of:
•
extreme variability in reporting practices across states
•
presence of
little information on students with disabilities
a. Only
11 states include test-based outcome data for students with disabilities in their reports.
b. Five
states produce a separate special education report.
c. Many
states include input/context and/or process indicators for students with disabilities.
d. Every
state is unclear on at least one educational indicator in the accountability system as to
whether students with disabilities were included.
The following recommendations are made as a result of our
analysis:
•
Specify the target audience for each report, and gear the
information to that audience.
•
If possible, gain input from the targeted audiences on
information needs.
•
Provide a “pyramid of information” with a brief,
easy-to-understand report for quick reference, and more detailed information available to
those who need it.
•
Avoid a great deal of overlap or inconsistency among
reports.
•
Make the purpose of the accountability system clear, and
provide the reader with information on the appropriate and inappropriate use of
information (such as whether to make comparisons among districts).
•
Choose educational indicators carefully and maintain some
consistency among different reports.
•
Be clear about the role of students with disabilities in
data and standards. If making references to
“all” students, then “all” students should include students with
disabilities.
•
While special education reports can be very useful in
providing detailed information about students with disabilities, regular education reports
should also include information on students with disabilities.
•
When making comparisons among schools, districts, and
states, and even when making comparisons over time, comparisons should be based on similar
populations. It is important to know the
characteristics of the students whose scores are being compared, such as the number of
students with disabilities, the socioeconomic status of students, and other
characteristics.
Background
During the past five to ten years of educational reform, policymakers, school administrators, legislators, and the general public have pressed to know whether education is working for students. In response to this, education has developed outcomes-based accountability systems, which are systematic methods to assure those inside and outside the educational system that schools and students are moving toward desired goals (Brauen, O'Reilly, & Moore, 1994). An accountability system is more than the assessment of outcomes; it requires that student performance be reported routinely and that consequences follow (Brauen et al., 1994). According to Brauen et al., consequences may be distributed to either individuals, such as a student or a teacher, or to systems, such as a program or school. Consequences may include sanctions, such as failure to graduate or loss of personnel, and/or rewards, such as public recognition of success or increased funding (Bond, Braskamp, & Roeber, 1996; Brauen et al., 1994; Geenen, Thurlow, & Ysseldyke 1995).
The most common way of documenting progress for accountability systems has been through the development of state accountability reports that regularly present indicators of the status of public education, including student assessment data, data on students and teachers, and school finance data (CCSSO, 1995). Indicators are statistical measures of some aspect of the educational system (College of Education & Human Development, 1996). In 1995, the Council of Chief State School Officers (CCSSO) produced a document on state accountability reports that was based on a survey of state assessment directors. A partnership between CCSSO and the North Central Regional Educational Laboratory (NCREL) annually produces the State Student Assessment Program Database, which includes data obtained from annual surveys of state assessment directors. These reports are excellent summaries of state reporting purposes, levels of statistics reported, frequency of reporting, whether these reports were mandated, and whether rewards and/or sanctions were attached to reporting in the state (Bond et al., 1996; CCSSO, 1995). Bond et al. indicated that most of the 45 states with currently functioning statewide assessment programs use each of their assessment components for two to four of the following six purposes: improving instruction and curriculum; program evaluation; school performance reporting; student diagnosis or placement; high school graduation; and school accreditation.
Until recently, little information was available on where students with disabilities fit into state accountability systems. Ysseldyke (1995) as quoted by Bond et al. (1996) noted that 6 to 14 percent of the total tested elementary population and 5 to 10 percent of the total tested high school population were students with disabilities. Forty-one states allow students with disabilities to be excluded from the state assessment program (Thurlow, Scott, & Ysseldyke, 1995). These students can be exempted from the assessment if the assessment is not appropriate for them (content is not included in student's IEP), and for most states, a student is included or excluded based on IEP recommendations. It also has been reported that even when students with disabilities participate in the statewide assessment program, their scores might not be included in the state, district, or school averages (Erickson, Thurlow, & Ysseldyke, 1996).
Elliott et al. (1996) reported that 41 states had written guidelines about the participation of students with disabilities in their statewide assessment programs. Thirty-nine of these states reported that they offered special testing accommodations for students with disabilities. Of the 133 different assessments employed by the states in 1994, participation rates could be estimated by state special education directors for only 49 (Erickson, Thurlow, & Thor, 1995). Thurlow, Scott, and Ysseldyke (1995b) further found that of the 24 states that described what they do with data on students with disabilities in their written guidelines, more than half (n=14) stated that data from students with disabilities were not included in their accountability reports; however, eight states did document the number of students excluded from the assessments. According to Elliott et al. (1996), it is not uncommon for those students with disabilities who do participate in assessments to have their scores deleted, their results shared only with parents, or no record kept of their even taking the test.
States vary in their reporting practices. As Elliott et al. (1996) pointed out, some states make decisions about reporting based on whether a student receives an accommodation or on what type of accommodation the student receives. It is also not uncommon for students with disabilities to be excluded from participation rates for the assessment. Elliott et al. contend that if students with disabilities are not assessed in some manner and their results are not reported, then accountability for the quality of their educational experience may be compromised.
To better understand the status of students with disabilities, we examined actual accountability reports from states, rather than analyzing policies or personnel reports about practice. We looked at the kind of accountability data reported, the presence of comparative data, and the breakdown of results for groups of students, particularly students with disabilities. Thus, our focus was on information that was not included in the CCSSO survey and State Student Assessment Programs Database. Our primary objective was to document the extent to which students with disabilities and their assessment results are included in state accountability reports, and to address and recommend ways to move toward systematic and inclusive reporting practices.
The accountability documents for this analysis were obtained by calling the state assessment directors or their designees in each of the 50 states and Washington DC, beginning in fall 1995. The calls were made based on the information from the CCSSO (1995) report, which listed accountability documents for each state as well as interview information about the state’s accountability system. Unless otherwise indicated, our analysis is based solely on the information contained in the written documents, and not based on other sources of information. Second and third calls were made to a few states that had not responded by early fall, and all documents were obtained by May of 1997. We occasionally received updated information for the original documents, and these were included in our data coding, but we did not formally solicit updated information for this analysis. Accountability reports were collected from all states except California (testing program currently under revision), Minnesota (currently developing an accountability system), and Wyoming (no formal accountability documents available). We did not include reports of special studies or evaluations of specific programs in our analysis.
Each document was thoroughly examined, using a checklist of commonly used indicators of educational performance, and descriptive notes regarding each accountability document. The indicators were selected by first perusing several existing models of education (e.g., Oakes, 1986; Shavelson, McDonnell, & Oakes, 1989, Shavelson, McDonnell, Oakes, & Carey, 1987). In addition, several of the documents we had received were scanned to determine whether additional types of indicators were needed. The checklist and descriptive notes were completed simultaneously. Essentially, raters started at the beginning of each report, marking the indicators present and writing notes. Any information that was found on students with disabilities was noted.
Limitations and Cautions
This analysis was limited by some of the following factors:
Accountability systems are changing, dynamic processes. A detailed analysis of this type will necessarily have some information that is out of date by the time of publication. In addition, the documents we obtained contain data ranging from the 93-94 school year to the 95-96 school year.
Different accountability systems have different definitions of accountability. Our requests were answered by state assessment directors in different ways. For example, some states included reports based solely on financial information. Other states may have had the same types of reports, but did not consider them to be accountability documents so they did not send them.
This analysis is based on documents, not interviews or other sources of information. Exceptions include accountability information obtained through the World Wide Web.
This analysis includes over 100 documents, obtained at various times from the fall of 1995 through May 1997. Many people have contributed to the daunting task of reading and coding each report. Every effort was made to maintain internal consistency and reliability throughout this process. This was accomplished by repeated rechecking of coding, and final consistency checks by two individuals.
Results
The following sections contain summary information about the accountability documents given to us by each of the states and Washington DC. The information is taken from the tables in the appendix (Tables A–D), the state summaries, which are in a separate document available from NCEO (Thurlow, Langenfeld, Nelson, Shin, & Coleman, 1997), and the documents themselves. Much more information is available in these tables and in the state summaries than could be summarized here.
How
are Data Reported?
There is a great amount of variability in accountability reporting across states. There is
also variability within state documents when more than one report is produced by a single
state.
Number of reports. As shown in Table 1, a number of states compile their accountability data into a single report (n=16). Thirty-two states provided multiple accountability documents. North Carolina and Oklahoma each provided six accountability documents, and New York provided the most (n=7). For more information, see Table A in the appendix.
Table 1.
Number of Accountability Reports Sent to NCEO by State Assessment Directors |
|
# of Reports |
States |
7 |
New York |
6 |
North Carolina, Oklahoma |
5 |
South Carolina, Georgia |
4 |
North Dakota, New Hampshire, Ohio,
Texas, Utah, Vermont |
3 |
Louisiana, New Jersey |
2 |
Alabama, Arizona, Arkansas,
Connecticut, Florida, Hawaii, Idaho, Illinois, Indiana, Kansas, Ken-tucky, Michigan,
Missouri, Nebraska, Pennsylvania, Rhode Island, Tennessee, Virginia, Washington |
1 |
Alaska, Colorado, Delaware,
Washington DC, Iowa, Maine, Maryland, Massachusetts, Mississippi, Montana, Nevada, New
Mexico, Oregon, South Dakota, West Virginia, Wisconsin |
Length of reports. Accountability documents ranged in length from two to approximately 600 pages. Unique documents included small pocket size reports or posters with general summary information. Some documents provided highly detailed special education data.
Level of data reported. States varied considerably in the level of data reported, which refers to the level of detail given in the accountability documents. Reports may provide state, district, and/or schoolwide averages for test data during a particular school year. Figure 1 shows the level of data reported by each of the states, according to all of the documents sent to us by each state. (Table B in the appendix gives more detailed information, providing the level of data reported for each document.) States may have any combination of state, district, and school-level reporting, and these may vary from document to document, and from one indicator to another. The combination of the first two columns in Figure 1 (State & District only, and State, District & School), makes it clear that most states do provide accountability data at the state and district levels (N=41). Twenty-eight states actually report data at all three levels. Four states provide only state level data (Colorado, Iowa, Montana, and Oregon).
Focus of Documents
We looked at the focus of reports as being directed toward inputs/contexts, processes, or outcome indicators, where indicators are statistical measures of some aspect of the educational system (College of Education & Human Development, 1996). Our analysis revealed a great deal of variability in the focus of reports. In the analysis, “inputs/contexts” refers to accountability indicators that describe the student’s learning environment as well as demographic characteristics, financial and human resources of the particular district’s population (e.g., student-teacher ratio, cost) (Bruininks, Deno, McGrew, Shriner, Thurlow, & Ysseldyke, 1991). Process indicators describe student participation and school district evaluation (e.g., enrollment, attendance, accreditation status). Outcome indicators are nontest and test data indicators that focus on the end result of a student’s learning process or are indices of the products of a reciprocal interaction between the individual and school or life experiences.
Figure 2 shows the number of states that report on inputs, processes, and outcomes for regular education students, and for students with disabilities. Of the states that sent us information, all but four (Delaware, Kentucky, Montana, and Washington) included information on the inputs/contexts of education for regular education students. All states but four (Delaware, Idaho, Montana, Washington) included information on the educational process. All states included information on the outcomes of education. Table A in the appendix shows the focus of reporting, aggregating all of the reports that were sent to us by the states. Tables C and D in the appendix show the various inputs/contexts, processes, and outcomes indicators reported in each accountability document. More detailed information is contained in the separate document containing state summaries (Thurlow et al., 1997).
Students with disabilities. From Figure 2, it is obvious that while all states included outcome information in at least one report, only 11 states reported outcome information for students with disabilities. The most commonly reported information for students with disabilities was process information (see the section on Educational Indicators for additional information on the types of indicators reported for students with disabilities).
Purposes
of Documents and Targeted Audiences
This analysis includes only those purposes, consequences, and targeted audiences that were specifically mentioned in the introductions to documents or were clearly stated within the text. It should be noted that the purpose of producing an accountability report can be different from the purpose of an accountability system. Yet, this may not be clear in the statements found in the reports.
Purposes and consequences of accountability system. Figure 3 shows the number of states that mentioned specific purposes or consequences in the introductions to their reports. Since most states had multiple reports, and often stated more than one purpose, the numbers in the figure overlap. The columns show the specific purposes that we targeted in our analysis. Eight states use the information in their accountability reports for accreditation purposes, while five states report financial aid as a purpose of the accountability system. Technical assistance was cited as a purpose/consequence of the information in four states’ accountability reports. Finally, only one state (Virginia) used the information reported in its accountability document for diploma purposes.
Thirty-two states fall into the “other” category, with the majority of these stating the purpose of their reports was “to provide information,” without mention of why the data were collected, or how the data should be used. Other purposes were to: comply with state requirements for testing or legal operation of schools; measure the progress of education; make policy decisions; generate local, district, and national comparisons; use as a tool for progress toward meeting Goals 2000; aid in curriculum development; describe the role and function of the state department of education; increase partnerships between schools and neighborhoods; and provide a picture of school management. Twenty-eight states did not mention a purpose in at least one of their accountability documents.
High stakes testing. Many reports do not mention the stakes attached to particular tests, or do not make the stakes of testing clear. For example, Texas only mentions that the TAAS (Texas Assessment of Academic Skills) is a graduation exit exam in the glossary section of one of its documents. Several documents mention the TAAS without mentioning the stakes. Ohio sent us data without mention of how any of the tests reported are used. Of the 17 states that had a graduation exam at the time of this report, only one state (Virginia) stated this purpose clearly at the very beginning of the document when commenting on the purposes and consequences of its accountability system.
Target audience. Figure 4 shows the number of states that mentioned a specific audience by name in the introduction to their reports, or in the title of their reports. The majority of states do not specify who their target audience is in at least one of their reports (N=31). While not shown on the figure, we also counted 14 states that did not specify a target audience in any of their reports. From looking at Figure 4, it is evident that:
The most common target audience of reports is the general public (27 states).
18 states direct their reports to the government (local school boards, state legislature, or federal government).
Teachers and administrators also appear to be an important audience: 16 states direct their reports to teachers and administrators and other school personnel.
Only nine states specifically mention parents as the target audience (though parents are probably included under those reports directed to the general public)
Reports directed at “other” audiences (n=6) included: special education community (from a special education document), students, researchers, and assessment personnel.
Types
of Indicators Used
Accountability reports use a wide range of indicators. Figures 5 and 6 show the educational indicators that we used in our analysis, and the number of states with at least one document reporting each indicator. A glossary of all of the indicators used in the analysis is included in the appendix. Tables C and D in the appendix show the indicators used in each report. More detailed information is included in the state summaries document (Thurlow et al., 1997).
We found a variety of common and unique educational indicators. Examples of common indicators included such things as detailed financial information (such as levy data and expenditures), staffing information (such as teacher education), and postsecondary outcomes (such as percentage of students attending college or employment rates). Some unique indicators included absenteeism rates, student mobility rates, and minutes spent in math and reading instruction.
Special education students. In Figures 5 and 6, it is evident that the most common educational indicator used for special education students is enrollment (N=25). Enrollment data for special education students often includes detailed information on the number of students in each disability category, average daily membership, and referral data. Other special education indicators included special programs, and detailed expenditures. A few states included such indicators as time spent in regular education versus separate settings, number of students exiting special education and reasons for exit, staff and case load ratios, and racial/ethnic gender special education classification rates. Again, little outcome data for students with disabilities were reported, particularly with test data.
National
and Longitudinal Comparisons
We were interested in knowing whether states used their students’ data in national comparisons. We found that 11 states provided national comparison data (Colorado, Illinois, Iowa, New York, North Carolina, North Dakota, Pennsylvania, South Carolina, Utah, Vermont, West Virginia). Most of these states reported data on the National Assessment of Educational Progress (NAEP), a low-stakes national achievement test as well as state or district assessment data. Two states used the national percentile rank on the Stanford Achievement Test to make national comparisons (Utah and West Virginia). Vermont specifically used student results on selected portions of a multiple choice section of their Mathematics Uniform Test and compared them to the 1990 NAEP. Illinois did not specify which nationally normed achievement test was used to make national comparisons, but it did generate data on national comparisons. North Dakota not only made national comparisons to the NAEP, but also to the International Assessment of Educational Progress (IAEP). The IAEP is a similar normed achievement test, but data are collected on an international level.
In order to look at trends and to check academic progress from year to year, longitudinal data can also be included within accountability reports. Thirty-four states report on comparisons to prior year(s) in at least one accountability document (see Table D in the appendix). Figure 7 shows an example of a state (Virginia) that reports test and nontest data from 1990-1994:
Figure 7: Example of Virginia Report with Data from Multiple Years
Meeting
State Standards
Some states report their assessment scores in terms of whether they met prescribed state standards (e.g., the percentage of students passing the standard of 50% on a nationally normed test). Our analysis of reports showed that 15 states reported whether their students met the prescribed state standards (see Table C in the appendix): Alaska, Connecticut, Delaware, Georgia, Indiana, Kansas, Louisiana, Maryland, Michigan, Nebraska, New York, North Carolina, Ohio, Rhode Island and South Carolina. For the purposes of this analysis, we included those reports that mentioned standards, benchmarks or goals (including those in Goals 2000) when reporting data on students.
Many states, however, are unclear as to the relationships among curriculum,
standards, and assessments. Kansas makes the
link very clear in its single accountability document, giving data on students’
performance as well as descriptions of innovative programs that demonstrate the link
between curriculum and assessment. While it is clear in some of the reports that
standards exist, it is often unclear whether students are meeting the standards, or what
the specific standards are. In the following
example, Louisiana clearly describes a standard and expected outcomes in its report card:
The tables reflect both the number of students taking the test and the percent of students who meet or exceed standards for the respective grade levels. Thus, the percent of students passing a specific test is the percent scoring at or above the performance standard that the state has set in that subject area (District Composite Report, Catahoula Parish, March 1995, p. 41)
Special education students. Many states do not mention whether students with disabilities are included in state standards; however, six states reported whether students with disabilities met state standards (Connecticut, Delaware, Louisiana, New York, North Carolina and Rhode Island). While the term “all students” is mentioned often, a definition of “all” usually is not given.
What
Do the Documents Look Like?
In thoroughly examining the reports of the 48 states (including Washington, DC) that sent documents to us, we found 48 different approaches—all with different indicators highlighted or excluded. Many states use tables or spreadsheets, and some have switched from paper formats to the Internet to communicate their results. A uniform format does not exist. If states provide test data, then the methods of reporting those data also vary considerably. We did find that two sections usually are included in reports: some type of outcome data and financial data for regular education students.
Examples of different formats are given below. Some formats are more understandable than others, and some formats may be more useful for one type of audience (such as a researcher or a school administrator) but not for others (such as parents or the general public).
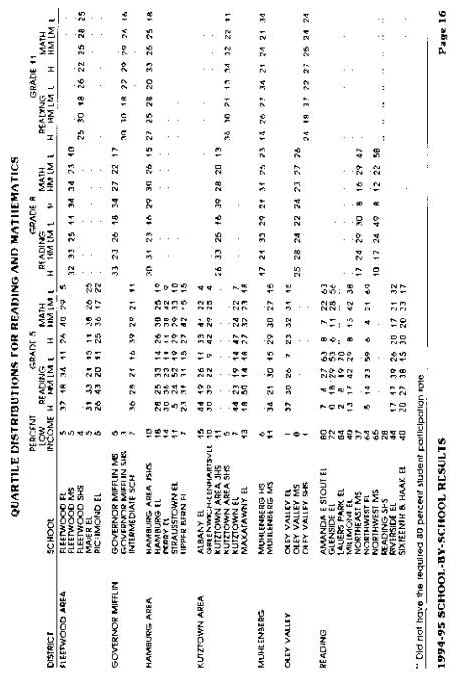
Spreadsheets. For the purposes of this analysis, we termed data presented in columns as “spreadsheet format.” This type of format can present a great deal of information in a limited space, but can be very difficult to read, particularly for the general public, which is most frequently identified as the target audience of reporting. Often spreadsheet data are seen in large reports including state, district, and school level data for an entire state. An example of this includes the Illinois report card which is available on diskette rather than in printed form, and includes 15,000,000 bytes of information on over 700 indicators. Figures 8 and 9 show examples of typical spreadsheet data presentation. In Figure 8, detailed special education enrollment data are given according to district. In Figure 9, reading and mathematics scores are given by district and school.
Figure 8. Example of New Jersey Report Using a Spreadsheet Format
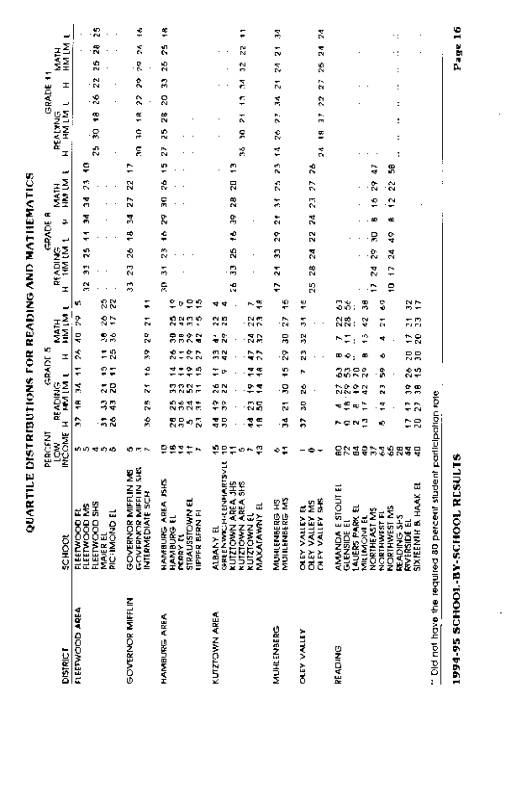
Figure 9. Example of Report Using a Spreadsheet Format
Data tables. Data tables are easier to read than pages of spreadsheet data. They often can convey a great deal of information in limited space. Figure 10 shows a data table containing useful information about test scores for regular and special education students as well as student scores disaggregated by race, gender, free or reduced price lunch, repeater and non-repeaters, and within the age range and over the age range.

Figure 11 shows data tables that are included in a report displaying all information for a single district on one page. These types of reports, which often include bar graphs and other types of illustrative data are usually easier to read than the large spreadsheet reports, but still can be very bulky.
Figure 11. Example of Report with All Data for District on One Page
Bar graphs. Bar graphs of data often are found in reports with a narrative focus, rather than straight data presentation, and can be very useful in illustrating points when the report is attempting to highlight particular issues. Figure 12 shows a narrative report that uses bar graphs and data tables to illustrate a report on outcomes for students with disabilities. Figure 13 shows a different type of bar graph used to illustrate testing results.
Figure 12. Example of Report Using Narrative and Graphs
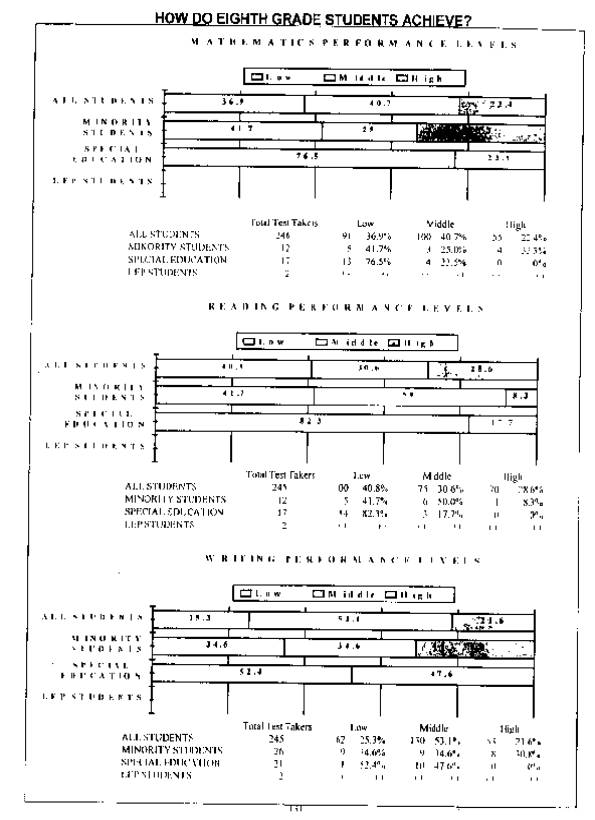
Figure 13. Example of Report Using Bar Graphs

Narratives. Some reports mainly use narratives to discuss educational indicators. Figure 14 shows a section from a regular education report that discusses the importance of students with disabilities meeting state standards, but the report actually contains only enrollment data.
Figure 14. Example of Report Using Narrative

Are
These Documents Understandable?
Given that state accountability reports target a variety of audiences with a variety of educational needs, it is important to ask about the extent to which the documents are understandable. With so much information to share, the most convenient way to communicate results is usually through tables, spreadsheets, and graphs. District and school level information can be very cumbersome in terms of length of reporting, even when the data are presented in clear, easy-to-understand language.
Some states provide each district or school with an individual report, containing state-level information, as well as district and school level information for that particular district. Some states attempt to group districts with similar characteristics (such as size and socioeconomic status) so that fair comparisons can be made, and other states simply present data and allow readers to draw their own conclusions. Further, a few states give specific instructions on how to interpret data. Some states encourage readers to make district by district or school comparisons, while a few states caution readers not to make such comparisons.
Sometimes the various indicators are not defined at all or not defined well. Some reports use glossaries that define the various indicators and terms used or explain the methods of calculating the various indicators, and others simply present data with little or no explanation. The following is an example in which the educational indicators are adequately defined:
Advanced Courses—This indicator is based on completion of (and having received credit for) at least one advanced course in grades 9-12. The course list (shown in appendix C) includes all advanced courses as well as all AP (Advanced Placement) courses except for two, computer science A and AB. Course completion information is reported to PEIMS (the Public Education Information Management System) at the end of the school year. The values are calculated as follows:
Number of students who completed at least one advanced academic course in
1993-1994 [divided by] number of students who completed at least one course in 1993-94
(Glossary for the Academic Excellence Indicator System, Texas 1994-95 Report, p.2)
It is evident that “understandability” clearly varies from one state to the next, and even from one state document to the next.
Students with Disabilities in Accountability
Reporting
For every state that sent us a report, there was at least one educational indicator in at least one report for which it was not clear whether students with disabilities were included. As indicated in Table A in the appendix, of the 44 states that included input data, 13 included students with disabilities, either aggregated with the regular education data, or disaggregated as separate data. Similarly, for the 44 states with process data, 30 included (aggregated or disaggregated) data on students with disabilities.
Outcome data, on the other hand, were aggregated or disaggregated for students with disabilities in only 11 of the 47 states plus Washington DC. In fact, close to half of the states provided information about the inputs/contexts and/or educational processes for students with disabilities, but did not mention anything about outcome data for students with disabilities. Table 2 provides a summary of the kind of outcome data included by the 11 states that report on these data. As indicated, few of these states include students with disabilities in all of their outcome measures. For those that do disaggregate data, it is often not clear whether the total scores also include students with disabilities.
Table 2: States that Report Test-Based Outcome Data for
Students with Disabilities |
||
State |
Name of Test |
Notes on Reporting |
Connecticut |
Connecticut Mastery Test Connecticut
Academic Performance Test |
Statewide percentage of students and special education students
at or above state goal. It is not clear
whether scores of students with disabilities are included in the general test scores. Disaggregated data on students with disabilities. It is not clear whether scores of students with
disabilities are included in the general test scores.
These data are in a separate special education report. |
Delaware |
Interim
Assessment Program |
Aggregates all students with the exception of some Limited
English Proficiency students and some special education students. Scores for students who were assessed with minor
accommodations are aggregated into general test reporting and scores for students who were
assessed with major accommodations are not included.
Accountability report does not include definitions of major or minor
accommodations. No disaggregated data are
provided. |
Georgia |
Graduation
Tests |
Includes
aggregated and disaggregated data on students with disabilities. Excludes students with disabilities from
comparisons to prior years. Scores of students with disabilities are excluded from reporting
on the Curriculum-Based Assessment Program. It is not clear whether students with disabilities are included
in the Writing Assessment for grades 5 & 8, Advanced Placement Exams, or in
standardized achievement testing. |
Kansas |
Kansas
Assessments in Mathematics, Reading, & Writing Mastery of
Algebraic Concepts |
Lists the number of students with disabilities by category who
were tested, but it is not clear whether these scores are aggregated into reported
results. Gives disaggregated data. |
Louisiana |
CAT 5, ACT,
SAT Louisiana
Educational Assessment Program (LEAP), & Louisiana High School Graduation Exit Exam |
Reports
aggregated data for students identified as gifted/ talented, speech impaired, and/or
hospital/homebound only. Scores of other
students with disabilities are excluded. Disaggregates the percentage of students with disabilities
attaining cutoff scores. It is not clear
whether scores of students with disabilities are included with the regular test scores. These data are in a separate special education
report. |
Table 2, cont. |
||
State |
Name of Test |
Notes on Reporting |
New York |
Pupil Evaluation Program Tests in Reading, Writing and Math Regents
Preliminary Competency Tests, Regents Competency Test Occupational Education Proficiency Examinations in communication
systems, produc-tion systems, transportation sys-tems, and clothing and textiles |
Disaggregated data. It is not clear whether scores of students
with disabilities are included with the regular test scores. Disaggregated
data. It is not clear whether scores of students with disabilities are included with the
regular test scores. Reports
data for students with disabilities and regular education students who are in vocational
programs. Disaggregated data are presented in
both separate and general reports. |
North Carolina |
End-of-grade
and end-of-course tests in reading, writing and mathematics |
Disaggregated
data. It is not clear whether scores of students with disabilities are included with the
regular test scores. It is not clear whether students with disabilities are included
in standardized testing or in the National Assessment of Educational Progress (NAEP). |
Rhode Island |
MAT7 |
Disaggregated and aggregated data |
South Carolina |
MAT7 South
Carolina Basic Skills Assessment Program |
Disaggregated
and aggregated data Disaggregated
and aggregated data It is not clear whether scores of students with disabilities are
included in reporting of Advanced Placement or college entrance examination (SAT/ACT)
results. |
Texas |
Texas
Assessment of Academic Skills (TAAS), TAAS/TASP Equivalency Test (secondary exit exam),
End-of-course Biology Exam, ACT, SAT |
Disaggregated
data. It is not clear whether scores of students with disabilities are included with the
regular test scores. Students may be exempted from the TAAS if they (1) have received
a special education exemption as determined by a review committee and specified in the
student’s IEP, or (2) have received a Limited English Proficiency exemption, as
determined by a review committee. |
Virginia |
Virginia
Literacy Passport Tests in reading, writing and mathematics for Grade 6 |
Disaggregated
results. Students with disabilities who are
pursuing a special diploma are not required to participate in the Literacy Testing
Program. It is not clear whether students with disabilities are included
in standardized testing or in Advanced Placement exams. |
Ten states (Alabama, Arizona, Delaware, Georgia, Louisiana, Missouri, New Jersey, New York, Texas and West Virginia) specifically reported that they exclude students with disabilities’ outcome data from at least one of their reports or do not include data on students with disabilities on one outcome indicator. These states were very clear as to what their reporting practices are when it comes to students with disabilities.
Figure 15 shows how one state reports a broad list of conditions under which students may be exempted from state testing. It is not clear in this report whether some or all students in these categories were excluded.
Figure 15. Example of Report Detailing Exemptions
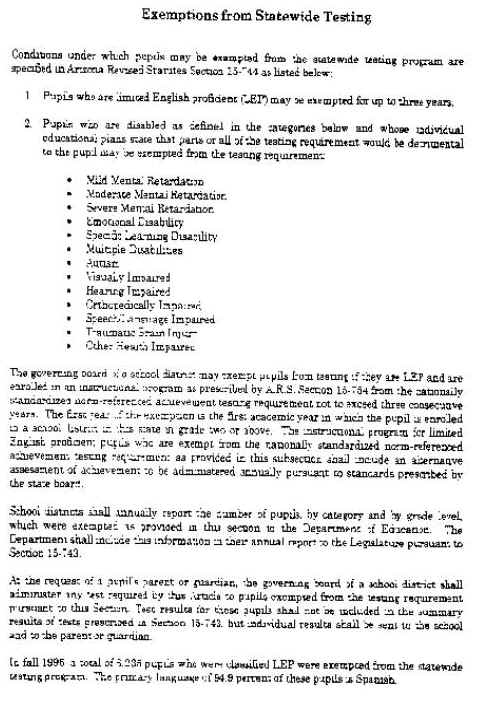
Accountability documents that reported on the exemption of students from testing were rare. Only eight states (Alaska, Arizona, Connecticut, Maryland, New York, Texas, Vermont and Washington) reported the number of students exempted from testing. Of those eight, four states (Connecticut, New York, Texas and Washington) specified the number of students with disabilities exempted from the test. Figure 16 shows one state, Washington, that requires districts to submit an “answer document” for every student enrolled. If a student is not tested, then districts must provide brief descriptive information about the student and indicate the reason he or she was not tested. Some of the reasons for exemption included: absent, special education student, limited English proficient student, withdrawn, student parent refusal, disruptive, temporary crisis, no reason given.
Figure 16. Example of Report with Information on Exemptions
Separate special education reports. Of the 47 states (plus Washington DC) that have a current accountability report, a handful devote a separate document to state special education student outcomes. Five states (Arkansas, Connecticut, Louisiana, New Jersey, and New York) report on various indicators for special education students. Only Connecticut, Louisiana, and New York have test-based outcome data in the separate special education report. Ohio has a separate special education report, but it does not provide state level data. Connecticut indicates that it creates its special education report because it has the “duty to provide opportunities for all students with disabilities to achieve statewide student goals” (Special Education in Connecticut 1994-95, CT State Dept. of Education, January 1996, p. 1). New Jersey reports that its special education document is designed as a reference book to assist New Jersey’s special education community in planning and evaluating educational efforts for pupils with educational disabilities. New York and Connecticut also specifically state in their reports that they compile this information in order to meet state requirements to describe special education programs, and educational results for students with disabilities; however, only three states (Connecticut, Louisiana, New York) also provide test data for students with disabilities in their reports. Of special note, Connecticut and New York also report the number of students exempted from testing in their special education reports. Of the states that produce a special education report, two states (Connecticut and New York) also include information on special education students in another accountability document that the state annually produces.
Disaggregated special education student data. Of the 11 states that report test-based outcome data on students with disabilities (see Table 2), 10 provide disaggregated data (all except Delaware). Eight of these states present these data in their regular accountability reports (Georgia, Kansas, North Carolina, New York, Rhode Island, South Carolina, Texas, and Virginia). Two states (Connecticut and Louisiana) present their test-based outcome data only in a separate special education report (New York presents data in both types of reports). Figure 17 shows another example (see also Figure 13) of how a state reports testing results and other outcome data for students with disabilities.
Summary
Variability is the best word to summarize what we found in our analysis of state reports. Accountability reports can contain a great deal of useful information, and serve many purposes for many different audiences. Many differences exist in the reporting of regular and special education. These differences are highlighted in Table 3.
Figure 17. Example of Report Showing Outcome Data for Students with Disabilities
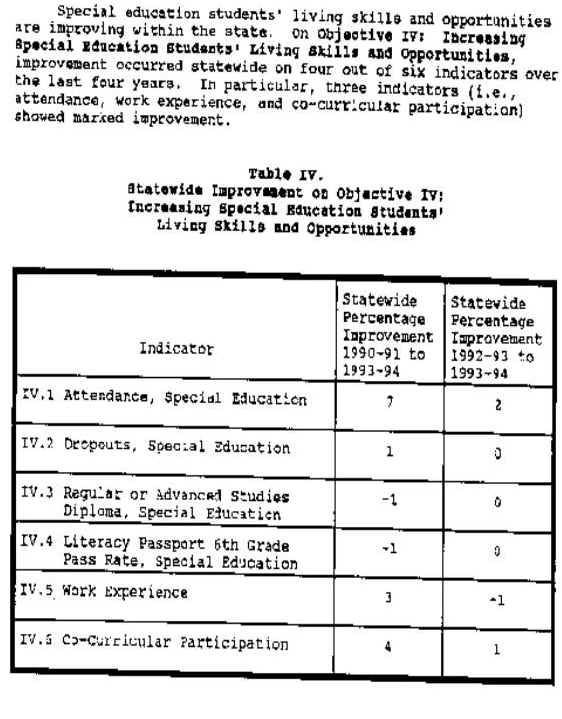
Table 3:
Regular Versus Special Education in State Accountability Reporting |
|
Regular Education |
Students with Disabilities |
All states report outcome data. Most states report on a variety of educational indicators, with
inputs, processes and outcomes included. Most states report regular and special education in the same
report. |
Few states report outcome data for students with disabilities. Cost data
(inputs) and enrollment (process) are the most commonly reported educational indicators. Every state
reports some data for which it is unclear whether students with disabilities were
included. Of the five states with a special education report, two states do
not mention students with disabilities in any other report. |
Issues and Recommendations
Accountability systems will always vary by state, according to the needs and circumstances relevant to that state; however, even within this needed variability, there are some common recommendations that are relevant to all states:
• Specify the target audience for each report, and gear the information to that audience.
• If possible, gain input from the targeted audiences on information needs.
• Provide a “pyramid of information” with a brief, easy-to-understand report for quick reference, and more detailed information available to those who need it.
• Avoid a great deal of overlap between reports.
• Make the purpose of the accountability system clear, and provide the reader with information on the appropriate and inappropriate use of information (such as whether to make comparisons between districts).
• Choose educational indicators carefully and maintain some consistency among different reports.
We also have the following suggestions for reporting on students with disabilities.
• Be clear about the role of students with disabilities in data and standards. If making references to “all” students, then “all” students should include students with disabilities.
• While special education reports can be very useful in providing detailed information about students with disabilities, general accountability reports should also include information on students with disabilities.
• When making comparisons among schools, districts, and states, and even when making longitudinal comparisons, comparisons should be based on similar populations. It is important to know the characteristics of the students whose scores are being compared, such as the number of students with disabilities, the socioeconomic status of students, and other characteristics.
Public Law 105-17, the reauthorization of IDEA, was recently passed by Congress and signed into law by President Clinton. It requires that students with disabilities be included in accountability reporting. Now is the time to look at how states approach accountability reporting, and incorporate suggestions for best practice in including data for students with disabilities in these reports. If students with disabilities are not included in accountability reporting, it is difficult for parents, educators, administrators, government personnel and the general public to know that these students are making adequate progress toward educational goals! Indeed, accountability reports will need to disaggregate the data of students with disabilities, choose educational indicators carefully, and provide clear information to all intended audiences.
References
Arizona Department of Education. (1996). Arizona pupil achievement testing 1995-1996 school year. Phoenix, AZ: Author.
Bond, L.A., Braskamp, D., & Roeber, E. (1996). The status report of the assessment programs in the United States: State Student Assessment Programs Database school year 1994-1995. Washington, DC: Council of Chief State School Officers and North Central Regional Laboratory.
Brauen, M.L., O'Reilly, F., & Moore, J. (1994). Issues and options in outcomes-based accountability for students with disabilities. Rockford, MD: Westat, Inc.
Bruininks, R.H., Deno, S.L., McGrew, K.S., Shriner, J.G., Thurlow, M.L., & Ysseldyke, J.E. (1991). Assessing educational outcomes: State activity and literature integration (Synthesis Report 1). Minneapolis, MN: University of Minnesota, National Center on Educational Outcomes.
College of Education and Human Development. (1996). Minnesota educational accountability reporting system: Feasibility and design study (vol. 1). Minneapolis, MN: College of Education and Human Development, University of Minnesota.
Connecticut State Board of Education. (1997). Special education in Connecticut 1995-1996. Hartford, CT: Author.
Council of Chief State School Officers. (1995). State education accountability reports and indicator reports: Status of reports across the states 1995. Washington, DC: Council of Chief State School Officers.
Elliott, J.L., Thurlow, M.L., & Ysseldyke, J.E. (1996). Assessment guidelines that maximize the participation of students with disabilities in large-scale assessments: Characteristics and considerations (Synthesis Report 25). Minneapolis, MN: University of Minnesota, National Center on Educational Outcomes.
Erickson, R.N., Thurlow, M.L., & Thor, K.A. (1995). State special education outcomes 1994. Minneapolis, MN: University of Minnesota, National Center on Educational Outcomes.
Erickson, R.N., Thurlow, M.L., & Ysseldyke, J.E. (1996). Neglected numerators, drifting denominators, and fractured fractions: Determining participation rates for students with disabilities in statewide assessment programs (Synthesis Report 23). Minneapolis, MN: University of Minnesota, National Center on Educational Outcomes.
Geenen, K., Thurlow, M.L., & Ysseldyke, J.E. (1995). A disability perspective on five years of education reform (Synthesis Report 22). Minneapolis, MN: University of Minnesota, National Center on Educational Outcomes.
Louisiana Department of Education Office of Research and Development. (1995). 1993-94 Louisiana progress profiles: District composite report of Catahoula Parish. Baton Rouge, LA: Louisiana Department of Education.
New Jersey State Department of Education. (1997). Special education: A statistical report for the 1995-1996 school year. Trenton, NJ: Author.
Oakes, J. (1986). Educational indicators: A guide for policymakers. Santa Monica, CA: RAND, Center for Policy Research in Education.
Oregon Department of Education. (1996). Oregon report card 1995-96: An annual report to the state legislature on Oregon public schools. Salem, OR: Oregon Department of Education.
Pennsylvania Department of Education. (1995). The Pennsylvania system of school assessment: 1994-95 school-by-school results. Harrisburg, PA: Author.
Rhode Island Department of Education. (1994). Rhode Island public schools: 1994 District profiles. Providence, RI: Author.
Shavelson, R., McDonnell, L., & Oakes, J. (1989). Indicators for monitoring mathematics and science education. Santa Monica, CA: RAND.
Shavelson, R., McDonnell, L., Oakes, J., & Carey, M. (1987). Indicator systems for monitoring mathematics and science education. RAND’s report to the National Science Foundation (NSF). Santa Monica, CA: RAND.
South Carolina Department of Education. (1995). Data update: 1995 results of the Basic Skills Assessment Program (BSAP). Columbia, SC: Author.
South Dakota Department of Education and Cultural Affairs. (1996). Education in South Dakota: A statistical profile. Pierre, SD: Author.
Texas Education Agency. (1995). Glossary for the Academic Excellence Indicator System: 1994-95 Report. Austin, TX: Author.
Thurlow, M.L., Langenfeld, K.L.H., Nelson, J.R., Shin, H., & Coleman, J.E. (1997). State summaries: Information in accountability reports (Working Report 5). Minneapolis, MN: University of Minnesota, National Center on Educational Outcomes.
Thurlow, M.L., Scott, D.L., & Ysseldyke, J.E. (1995a). A compilation of states' guidelines for accommodations in assessments for students with disabilities (Synthesis Report 18). Minneapolis, MN: University of Minnesota, National Center for Educational Outcomes.
Thurlow, M.L., Scott, D.L., & Ysseldyke, J.E. (1995b). A compilation of states' guidelines for including students with disabilities in assessment (Synthesis Report 17). Minneapolis, MN: University of Minnesota, National Center on Educational Outcomes.
Virginia Department of Education. (1995). Summary of statewide results: 1995 Outcome accountability project. Richmond, VA: Virginia Department of Education.
Washington Department of Education. (1996). Fall 1995 district-level summaries: Grades 4, 8, and 11. Olympia, WA: Washington Department of Education.
Ysseldyke, J.E. (1996). Overview of the issues of participation and inclusion of students with disabilities in large-scale assessment programs. A presentation at a Council of Chief State School Officers SCASS Special Education Assessment meeting in Tampa, Florida.