Prepared by Lynn Walz, Sandra Thompson, Martha Thurlow, and Richard Spicuzza
This document has been archived by NCEO because some of the information it contains is out of date.
Any or all portions of this document may be reproduced and distributed without prior permission, provided the source is cited as:
Walz, L., Thompson, S., Thurlow, M., & Spicuzza, R. (2000). Minnesota's Comprehensive Assessments: 1998 and 1999 participation and performance of students with disabilities (Minnesota Report No. 32). Minneapolis, MN: University of Minnesota, National Center on Educational Outcomes. Retrieved [today's date], from the World Wide Web: http://education.umn.edu/NCEO/OnlinePubs/MnReport32.html
This report focuses on the participation and performance of students with disabilities on the initial administration of Minnesota’s Comprehensive Assessments (MCAs). Assessments in Mathematics and Reading were initially administered to students in third and fifth grade in 1998 and 1999. The test of Written Composition was administered to fifth graders only. Data used in this report were compiled through the Minnesota Assessment Project, a four-year, federally funded project from the Office of Educational Research and Improvement to the Minnesota Department of Children, Families and Learning, in collaboration with the National Center on Educational Outcomes (NCEO) at the University of Minnesota. The Minnesota Assessment Project has published many reports on the participation and performance of students with disabilities and English language learners in statewide assessments. These reports are available on-line at http://education.umn.edu/NCEO.
The participation
and performance of students with disabilities within a statewide assessment process are
important to study, especially in light of the 1997 reauthorization of the federal
Individuals with Disabilities Education Act (IDEA). This act sets the expectation that all
students with disabilities will participate in statewide assessments, with accommodations
as needed, or through participation in alternate assessments. In addition, states must
report the number of students participating in the regular assessment and the performance
of those students. This must be done in the same way and with the same frequency as the
performance of students not receiving special education services is reported. The
reauthorized IDEA has placed greater emphasis on the access of students with disabilities
to the general education curriculum and their participation in it, and on district and
state assessments that drive the curriculum. In Minnesota, as in most states, IDEA sets
the stage for the initiation of increased participation. (See Appendix A for Assessment
Provisions of IDEA.)
Title I of the
Improving America’s Schools Act of 1994 (IASA) requires all states to develop high
standards for the academic achievement of all students, particularly those who are low
achieving. Furthermore, the law specifies that educational accountability is to be
improved through the use of state assessment systems designed to show how well students
are achieving the challenging state student performance standards expected of all
students. According to the National Research Council (1999), standards provide a way to
focus support for schools that have difficulty educating all students to the same high
level. The National Research Council calls upon states to monitor the implementation of
standards and to make changes where needed. Students who seem to have particular
difficulty achieving high standards are students with disabilities.
Historically, many
students with disabilities have been excluded from assessment and accountability systems
across the United States. Although assessments have been the primary means to evaluate
educational accountability, students with disabilities have been excluded to a great
extent (Erickson, Thurlow, & Thor, 1995; Thurlow, Elliott, & Ysseldyke, 1998).
Increasingly, states are making significant efforts to include all students and to report
the performance of students with disabilities on statewide tests (see Thurlow, Langenfeld,
Nelson, Shin & Coleman, 1998). Many states are just beginning to have the capacity to
disaggregate statewide assessment data by disability, but most are still not able to
calculate the percentages of students with disabilities actually participating in the
assessments (Thompson & Thurlow, 1999).
Minnesota Comprehensive Assessments
Minnesota has
developed a system of high standards that are being implemented at all grade levels.
Students must complete standards in specific areas during their high school years to earn
a high school diploma. In order to determine whether elementary and middle school students
are learning the concepts and skills needed to complete the high school standards when
they are older, the Minnesota Department of Children, Families and Learning (CFL) has
created preparatory standards for students in kindergarten through grade eight. To assess
progress toward the preparatory standards, CFL has developed and implemented statewide
assessments in Reading and Mathematics in third and fifth grades, with a test of Written
Composition added in fifth grade. In addition to testing third and fifth graders, the
Basic Standards Tests, administered as a graduation requirement beginning in eighth grade,
are also used as a measure of accountability. Comprehensive assessments are currently
being developed for eleventh graders.
The Minnesota
Comprehensive Assessments (MCAs) are criterion-referenced tests used for district
accountability purposes, and as tools for making decisions about curriculum and
instruction. The tests were first administered in February of the 1997-98 school year, and
are to be administered on an annual basis. The MCAs represent one component of Minnesota’s
educational accountability system. The tests are designed to monitor the educational
system in Minnesota and in each district. Although individual student scores can be
reported from the MCAs, the tests are designed for system accountability rather than
individual student or teacher accountability. There is no passing score that all students
are expected to achieve; rather, performance is reported at four proficiency levels.
State, district, and school test results are used in several ways:
•
to measure the success of schools and districts in improving
student achievement over time;
•
to generate information for school improvement and
accountability;
•
to allow for identification of programming and strategies that
work; and
•
to allow for comparison of schools and districts in Minnesota.
The MCAs were
designed by a team of more than 200 Minnesota educators in addition to national experts in
Reading and Mathematics. The Reading and Mathematics tests have multiple choice and short
answer items. There are 10 forms of the test with 49 common items (58 possible points) and
11 additional items, called “matrix items,” that vary across test booklets (14
possible points). Individual student results are reported only on the common items found
in every student’s test booklet. School or district results include both the common
items and the matrix items. Tests are untimed, with one test given each day.
At grade 3, the
Mathematics test includes questions about shape, space, and measurement; number sense; and
chance and data handling. For example, to assess the number sense standard, the test may
ask students questions about counting whole numbers and identifying odd and even numbers.
The Reading test covers informational material (e.g., from textbooks), practical
information (e.g., recipes), and literature. On average, test items are written at a third
grade reading level.
At grade 5, the
Mathematics test includes items in the same areas as those assessed in grade 3: shape,
space, and measurement; number sense; and chance and data handling. However, the types of
problems are different. For example, to assess the number sense standard at grade 5,
students may be asked questions about place value, number operations, estimating, and
calculator use. The Reading test covers material in the same categories as those on the
third grade test (informational material, practical information, and literature), with the
average passage written at a fifth grade level.
The test of Written
Composition was only administered in fifth grade. Students were expected to write a short
essay based on one of four types of story prompts: narrative, problem/solution,
descriptive, and clarification. Each essay was rated on a four-point scale across the
domains of composing, style, sentence formation, usage/grammar, and mechanics/spelling.
Each of the story prompts was administered to a proportion of fifth graders.
MCA scores are
reported within four proficiency levels. Raw scores are converted to scale scores and
categorized within Levels I – IV, as shown in Table 1 (similar to the National
Assessment of Educational Progress performance levels). Students reaching Levels III and
IV have demonstrated the capacity to successfully achieve Minnesota’s high standards
and are on track to achieving Minnesota’s Graduation Standards. A desired goal is to
have all students performing at or above Level II. Although it is assumed that all
students will benefit from the focused approach that the Graduation Standards offer, it is
likely that students who score at Levels II and I are most dependent on focused,
performance-based instruction. Parents and teachers of these students should weigh the
assessment results against other evidence of achievement.
Table 1. MCA Performance Levels
Level IV: Students at this level demonstrate evidence of advanced academic performance, knowledge, and skills that exceed the level necessary for satisfactory work in the high standards in the elementary grades. |
Level III: Students at this level demonstrate evidence of solid academic performance and competence in the knowledge and skills necessary for satisfactory work in the high standards in the elementary grades. |
Level II: Students at this level demonstrate evidence of partial knowledge and skills necessary for satisfactory work in the high standards in the elementary grades. |
Level I: Students at this level demonstrate evidence of limited knowledge and skills necessary for satisfactory work in the high standards in the elementary grades. |
Students with
Individualized Education Programs (IEPs) or 504 Accommodation Plans (504 Plans) are
expected to participate in the MCAs as generally administered or with approved
accommodations (see Minnesota’s Accommodation Guidelines in Appendix B). Because data
from these tests are used for system accountability, modifications to the test are not
allowed. Results of these tests do not influence a student’s graduation or promotion
status. Students with IEPs or 504 Plans who are unable to participate meaningfully in the
MCAs will be included in the accountability system through participation in an alternate
assessment designed by CFL. The alternate assessment includes various rating scales for
developmental academics or functional skills and was required to be in place by July 1,
2000 (see Appendix A, Assessment Provisions of IDEA).
The CFL collected
the data analyzed for this report through the Minnesota Automated Recording Student System
(MARSS), Minnesota’s data management system. Statistical analyses were run by
Minnesota Assessment Project (MAP) researchers. The analyses were translated into tables,
discussed by the MAP team, and this report was written. Before publication, special
education and assessment consultants at the Minnesota Department of Children, Families and
Learning reviewed this report.
There are several
cautions to consider in the interpretation of these data. The cautions fall into four
areas: reporting by grade, reporting by primary disability, reporting only students with
disabilities who receive special education services, and other considerations.
Reporting by grade. The data included in this
report are presented by student grade and disability. Student grade is defined as the
grade a student is in during the testing year. The participation rate is calculated by
dividing the number of students tested in a particular grade by the total number of
students enrolled in that grade.
The official special
education child count that is reported to the federal government is calculated on December
1 and reported by age. These numbers cannot be used to calculate test participation rates
because tests are administered by grade, not by age. Pupil enrollment information is
calculated by grade on October 1 of the testing year. This raises some concerns, since
there are about five months between the child count date and the test administration date,
during which time some students move in and out of districts, and in and out of the state.
Reporting by primary disability. Students are
reported only by their primary disability, even though many of them have additional
disabilities (e.g., students with a speech impairment and a learning disability may only
be reported as having a learning disability). Using only primary disabilities reduces
child count error by ensuring that no student is reported more than once. Unduplicated
child count data are essential for calculating participation rates – these data
become the denominator. However, the fact that a student may have more than one disability
increases the number of factors that may contribute to student performance. We cannot draw
inferences about the data in these more complex ways because we do not have the
information needed to do so.
Reporting only students with disabilities who receive
special education services. Throughout this report, we refer to the group under
consideration as “students with disabilities.” However, the students counted in
the report for 1998 include only those receiving special education services during the
testing year. We were able to include additional information about students with 504
Accommodation Plans in 1999. Students with disabilities who do not qualify or choose not
to receive special education services have not been identified.
Additional reporting considerations. There are
three additional reporting considerations to take into account. The first is that data
from a small number of students are not included because the data were inaccurate or
incomplete. Second, there are some students who are included in the child count who did
not take the MCAs because they received their education in private or home-schools. Third,
students in some special education categories are not included in these analyses because
the group is too small in number to maintain the anonymity of individual students.
As you view the
figures and tables throughout this report, keep in mind that the numbers and percentages
represent a broad number of factors. Only if all things were equal could we look at a
change in percentage and say it truly represented a change in test participation or
performance. Still these data are the first to portray the participation and performance
of students with disabilities on Minnesota’s Comprehensive Assessments.
Results
Participation
School districts
across Minnesota included nearly 85% of third and fifth graders with IEPs or 504 Plans in
the 1998 and 1999 MCAs. Minnesota’s 1998 and 1999 participation rates on statewide
assessments for students with disabilities are among the highest in the United States
(Thompson & Thurlow, 1999). The number and percent of students participating in the
third and fifth grade MCAs are reported here for 1998 and 1999, by grade and by test.
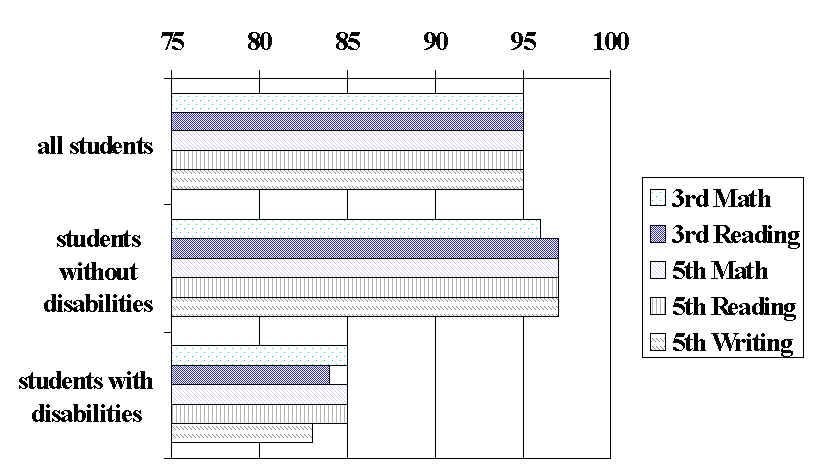
As shown in Figures 1 and 2, participation rates were fairly consistent across grades, tests, and years, with an overall participation rate of about 95% for all students tested. Students with disabilities participated at an average rate of 84%. Table 2 presents these data both by number and percent. Based on these data, it is assumed that roughly 16% of students with IEPs or 504 Plans were either exempt from testing, absent on at least one testing day, or were not tested for a variety of other reasons.
Figure 1. 1998 MCA Participation Rates
Figure 2. 1999 MCA Participation Rates
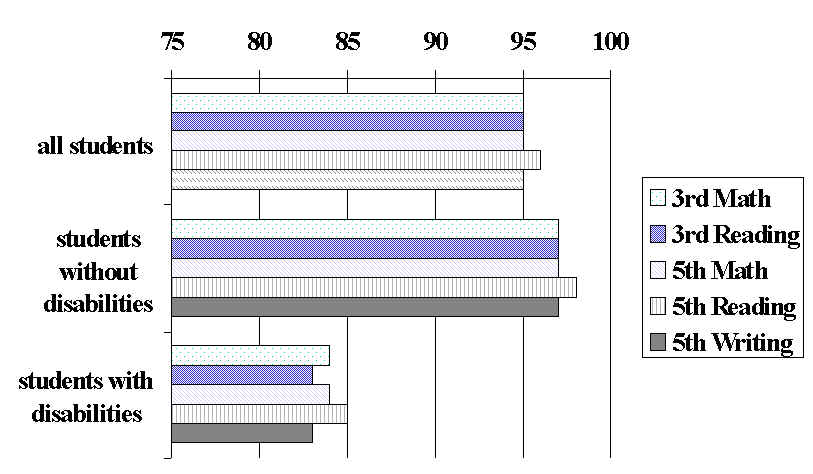
Table 2. 1998 and 1999 MCA Participation, Grades 3 and 5
|
*Number Enrolled |
No. Tested Math |
% Tested Math |
No. Tested Reading |
% Tested Reading |
No. Tested Writing |
% Tested Writing |
1998 - Grade 3 all students students without disabilities students with disabilities |
63577 55549 8028 |
60646 53399 6847 |
95% 96% 85% |
60552 53801 6751 |
95% 97% 84% |
|
|
1999 - Grade 3 all students students without disabilities students with disabilities |
64725 56660 8065 |
61596 54854 6742 |
95% 97% 84% |
61645 54964 6681 |
95% 97% 83% |
|
|
1998
- Grade 5 all students students without disabilities students with disabilities |
63368 54094 9274 |
60332 52484 7848 |
95% 97% 85% |
60465 52620 7845 |
95% 97% 85% |
60336 52670 7666 |
95% 97% 83% |
1999 - Grade 5 all students students without disabilities students with disabilities |
64069 54465 9604 |
61071 52970 8101 |
95% 97% 84% |
61539 53361 8178 |
96% 98% 85% |
61044 53046 7998 |
95% 97% 83% |
* Number Enrolled is based upon enrollment count by CFL on October 1 of each school year. MCAs are administered in February of each school year.
Participation rates
by disability are shown in Table 3. Enrollment remained stable across grades 3 and 5 for
students representing most disability categories. The exceptions are in the categories of
learning disability and emotional/behavioral disorders. The number of students receiving
special education services in these categories increased by about 50% from third to fifth
grade.
Table 3. Participation Rates by Disability
Participation of Students with Learning
Disabilities
|
*Number Enrolled |
# Tested Math |
% Tested Math |
# Tested Reading |
% Tested Reading |
# Tested Writing |
% Tested Writing |
1998
- Grade 3 |
2990 |
2722 |
91 |
2667 |
89 |
|
|
1999
- Grade 3 |
2719 |
2406 |
88 |
2369 |
87 |
|
|
1998
- Grade 5 |
4166 |
3758 |
90 |
3763 |
90 |
3703 |
89 |
1999
- Grade 5 |
4094 |
3679 |
90 |
3742 |
91 |
3677 |
90 |
Participation of Students with Speech
Impairments
|
*Number Enrolled |
# Tested Math |
% Tested Math |
# Tested Reading |
% Tested Reading |
# Tested Writing |
% Tested Writing |
1998
- Grade 3 |
2538 |
2314 |
91 |
2318 |
91 |
|
|
1999
- Grade 3 |
2691 |
2453 |
91 |
2467 |
92 |
|
|
1998
- Grade 5 |
2194 |
1842 |
84 |
1843 |
84 |
1874 |
85 |
1999
- Grade 5 |
2216 |
1919 |
87 |
1934 |
87 |
196 |
86 |
Participation of Students with
Emotional/Behavioral Disorders
|
*Number Enrolled |
# Tested Math |
% Tested Math |
# Tested Reading |
% Tested Reading |
# Tested Writing |
% Tested Writing |
1998
- Grade 3 |
881 |
782 |
89 |
769 |
87 |
|
|
1999
- Grade 3 |
904 |
782 |
87 |
772 |
85 |
|
|
1998
- Grade 5 |
1297 |
1112 |
86 |
1126 |
87 |
1077 |
83 |
1999
- Grade 5 |
1319 |
1126 |
85 |
1120 |
85 |
1090 |
83 |
Participation of Students with Mild to
Moderate Mental Impairments
|
*Number Enrolled |
# Tested Math |
% Tested Math |
# Tested Reading |
% Tested Reading |
# Tested Writing |
% Tested Writing |
1998
- Grade 3 |
592 |
340 |
57 |
333 |
56 |
|
|
1999
- Grade 3 |
537 |
289 |
54 |
287 |
53 |
|
|
1998
- Grade 5 |
569 |
392 |
69 |
384 |
67 |
347 |
61 |
1999
- Grade 5 |
559 |
341 |
61 |
329 |
59 |
309 |
55 |
Participation of Students with Other
Health Impairments
|
*Number Enrolled |
# Tested Math |
% Tested Math |
# Tested Reading |
% Tested Reading |
# Tested Writing |
% Tested Writing |
1998
- Grade 3 |
414 |
363 |
88 |
356 |
86 |
|
|
1999
- Grade 3 |
452 |
383 |
85 |
378 |
84 |
|
|
1998
- Grade 5 |
453 |
419 |
92 |
421 |
93 |
407 |
90 |
1999
- Grade 5 |
622 |
520 |
84 |
530 |
85 |
514 |
83 |
Participation of Students with Moderate
to Severe Mental Impairments
|
*Number Enrolled |
# Tested Math |
% Tested Math |
# Tested Reading |
% Tested Reading |
# Tested Writing |
% Tested Writing |
1998
- Grade 3 |
200 |
11 |
6 |
8 |
4 |
|
|
1999
- Grade 3 |
210 |
12 |
6 |
11 |
5 |
|
|
1998
- Grade 5 |
184 |
17 |
9 |
14 |
8 |
<10 |
<10 |
1999
- Grade 5 |
182 |
13 |
7 |
11 |
6 |
11 |
6 |
Participation of Students Who Are Deaf
or Hard of Hearing
|
*Number Enrolled |
# Tested Math |
% Tested Math |
# Tested Reading |
% Tested Reading |
# Tested Writing |
% Tested Writing |
1998
- Grade 3 |
128 |
120 |
94 |
115 |
90 |
. |
|
1999
- Grade 3 |
138 |
120 |
87 |
119 |
86 |
|
|
1998
- Grade 5 |
151 |
133 |
88 |
133 |
88 |
129 |
85 |
1999
- Grade 5 |
201 |
192 |
96 |
190 |
95 |
182 |
91 |
Participation
of Students with Autism
|
*Number Enrolled |
# Tested Math |
% Tested Math |
# Tested Reading |
% Tested Reading |
# Tested Writing |
% Tested Writing |
1998
- Grade 3 |
127 |
78 |
61 |
73 |
57 |
|
|
1999
- Grade 3 |
170 |
101 |
59 |
94 |
55 |
|
|
1998
- Grade 5 |
100 |
54 |
54 |
53 |
53 |
50 |
50 |
1999
- Grade 5 |
123 |
71 |
58 |
74 |
60 |
69 |
56 |
Participation of Students with Physical
Impairments
|
*Number Enrolled |
# Tested Math |
% Tested Math |
# Tested Reading |
% Tested Reading |
# Tested Writing |
% Tested Writing |
1998
- Grade 3 |
119 |
91 |
76 |
85 |
71 |
|
|
1999
- Grade 3 |
138 |
106 |
77 |
103 |
75 |
|
|
1998
- Grade 5 |
117 |
90 |
77 |
80 |
68 |
72 |
62 |
1999
- Grade 5 |
134 |
104 |
78 |
104 |
78 |
92 |
69 |
Participation of Students with Visual
Impairments
|
*Number Enrolled |
# Tested Math |
% Tested Math |
# Tested Reading |
% Tested Reading |
# Tested Writing |
% Tested Writing |
1998
- Grade 3 |
21 |
15 |
71 |
16 |
76 |
|
|
1999
- Grade 3 |
25 |
21 |
84 |
17 |
68 |
|
|
1998
- Grade 5 |
22 |
17 |
77 |
15 |
68 |
13 |
59 |
1999
- Grade 5 |
35 |
25 |
71 |
28 |
80 |
25 |
71 |
Participation of Students with
Traumatic Brain Injuries
|
*Number Enrolled |
# Tested Math |
% Tested Math |
# Tested Reading |
% Tested Reading |
# Tested Writing |
% Tested Writing |
1998
- Grade 3 |
18 |
11 |
61 |
11 |
61 |
|
|
1999
- Grade 3 |
20 |
17 |
85 |
15 |
75 |
|
|
1998
- Grade 5 |
18 |
12 |
67 |
11 |
61 |
12 |
67 |
1999
- Grade 5 |
18 |
16 |
89 |
16 |
89 |
16 |
89 |
Participation of Students with 504
Accommodation Plans
|
*Number Enrolled |
# Tested Math |
% Tested Math |
# Tested Reading |
% Tested Reading |
# Tested Writing |
% Tested Writing |
1999
- Grade 3 |
56 |
51 |
91 |
48 |
86 |
|
|
1999
- Grade 5 |
99 |
92 |
93 |
97 |
98 |
95 |
96 |
Participation rates
of students across disability categories were similar in 1998 and 1999. Students with 504
Accommodation Plans participated at a rate even higher than students without disabilities.
Students with learning disabilities (87% - 91%) and students with speech/language
impairments (84% - 92%) also participated at very high rates, as did students with
emotional/behavioral disorders (83% - 89%). Participation of students with moderate to
severe mental impairments was the lowest (4% - 9%). Participation rates of students with
deaf/blindness are not reported in order to protect the identity of individual students (N
< 10). Figures 3 through 7 compare participation rates by disability across years,
grades, and tests.
Figure 3. Participation:
3rd Grade Math by Disability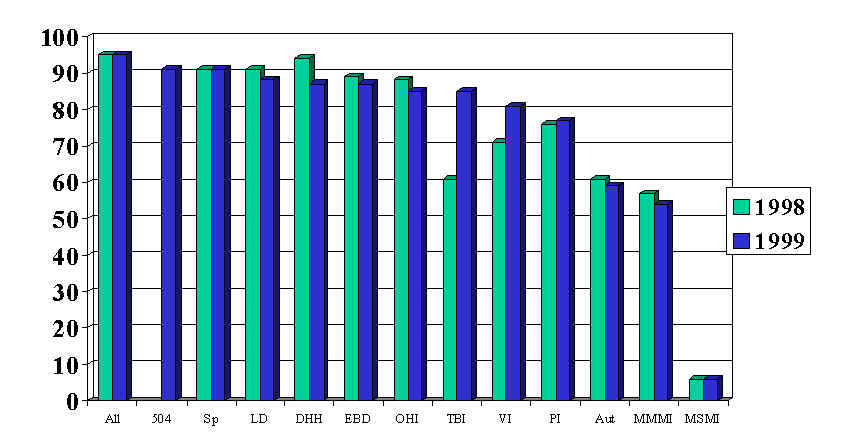
Figure 4. Participation:
3rd Grade Reading by Disability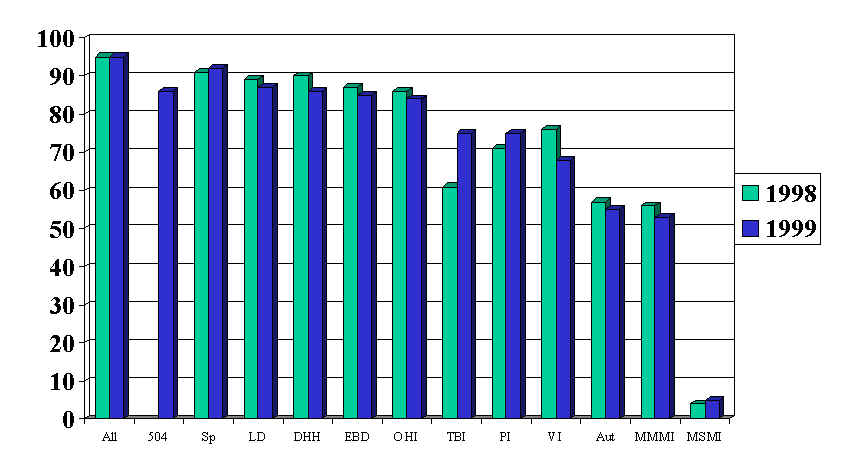
Figure 5. Participation:
5th Grade Math by Disability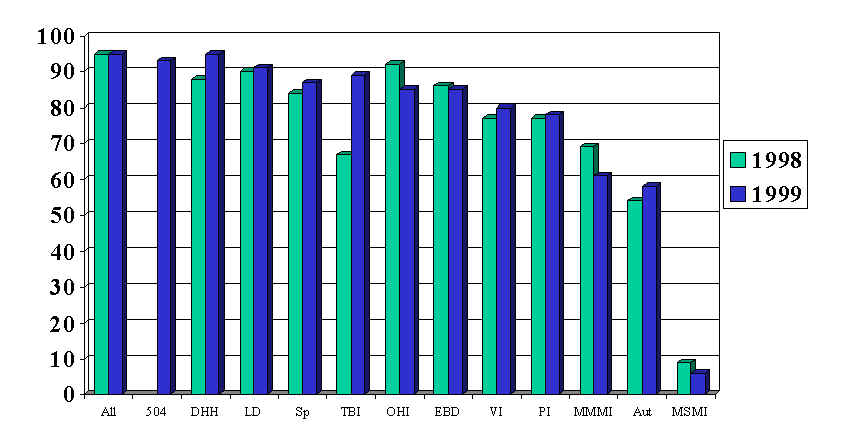
Figure 6. Participation:
5th Grade Reading by Disability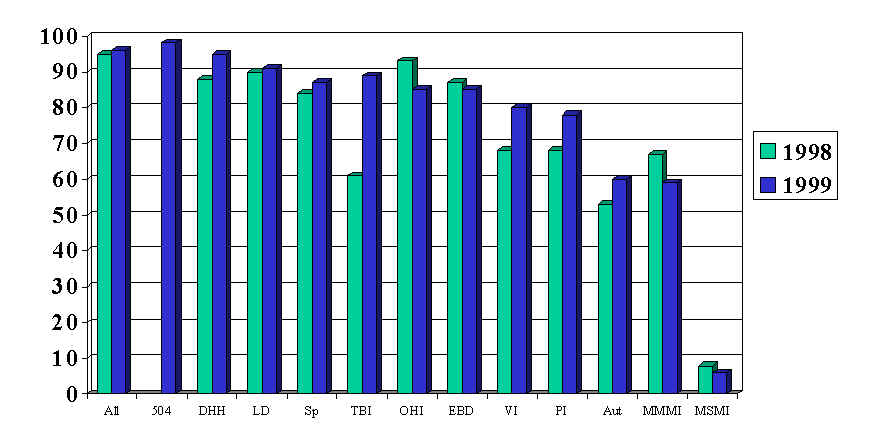
Figure 7. Participation:
5th Grade Written Composition by Disability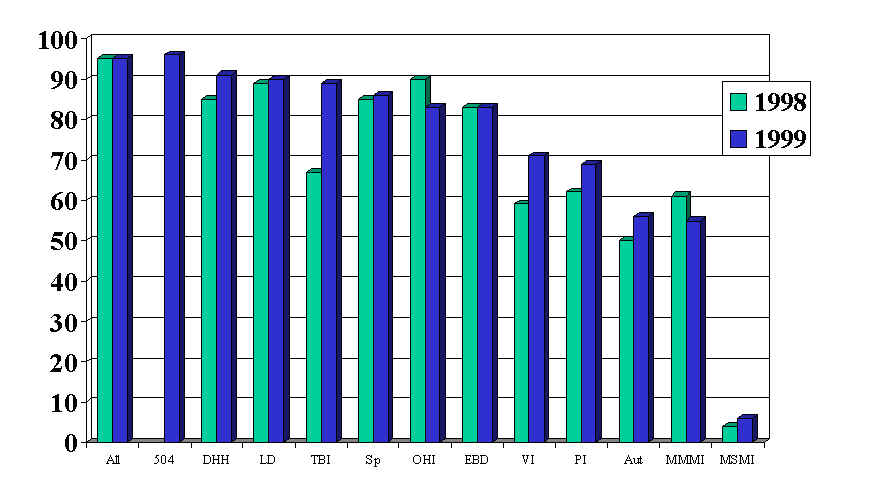
Performance
MCA raw scores were
converted to scale scores using NAEP (National Assessment of Educational Progress)
performance guidelines. The expected mean was approximately 1400 with a standard deviation
(SD) of about 200 for all students tested. Scale scores are important to study for an
overall picture of average performance, but it is also important to examine the MCAs in
the context through which performance is most commonly viewed; that is through proficiency
levels. MCA scale scores are divided into four performance levels that vary from grade to
grade and test to test, as shown in Table 4. The following section summarizes the
performance of third and fifth graders using both scale scores and proficiency levels.
Table 4. Performance Level Scale Scores
|
Level I |
Level II |
Level III |
Level IV |
3rd Grade Mathematics |
=1209 |
1210-1499 |
1500-1739 |
1740 = |
3rd Grade Reading |
=1279 |
1280-1499 |
1500-1689 |
1690 = |
5th Grade Mathematics |
=1259 |
1260-1499 |
1500-1709 |
1710 = |
5th Grade Reading |
=1239 |
1260-1499 |
1500-1709 |
1710 = |
5th Grade Writing: Descriptive |
=1029 |
1030-1499 |
1500-1919 |
1920 = |
5th Grade Writing: Narrative |
=1109 |
1110-1499 |
1500-1989 |
1990 = |
5th Grade Writing: Problem Solving |
=1129 |
1130-1499 |
1500-1969 |
1970 = |
5th Grade Writing: Clarity |
=1139 |
1140-1499 |
1500-2019 |
2020 = |
Third Grade Performance
Scale Scores. Figures 8 and 9 show the mean scale
scores for third graders in Mathematics and Reading across both testing years. On average,
1999 third graders scored higher than third graders in 1998, with a greater increase in
Mathematics than in Reading. The performance of students across all disability categories
averaged about .5 to 1 standard deviation (100 to 200 scale score points) below the
expected mean. Students receiving speech and language services nearly met the expected
mean, while students with mild to moderate and moderate to severe mental impairments
averaged 1.5 to 2.5 standard deviations below the expected mean. Note that the number of
students with moderate to severe mental impairments tested was very low (<15), limiting
interpretation of the results.
Figure 8. Performance: Mean Scale Scores
3rd Grade Math by Disability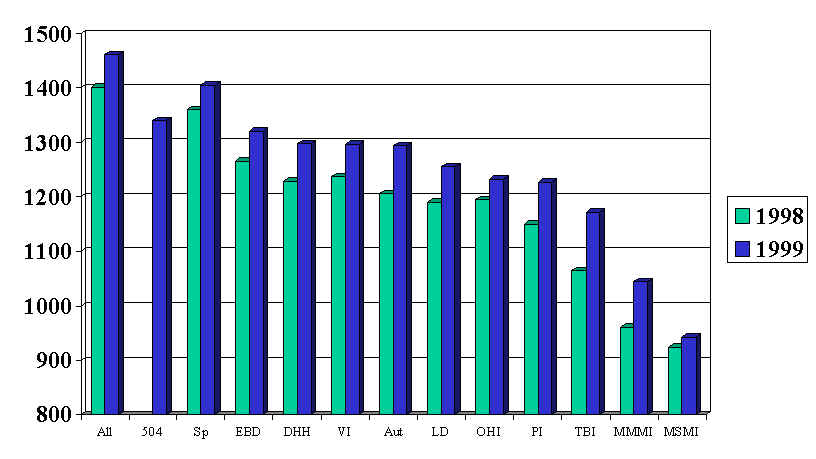
Figure 9. Performance: Mean Scale Scores
3rd Grade Reading by Disability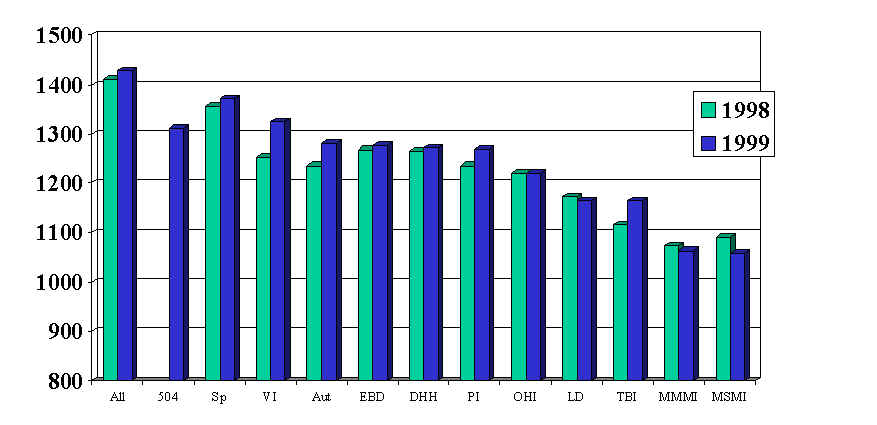
Proficiency Levels. As expected, between 70% and
80% of all third graders tested scored within Levels II or III on both tests, both years
(Table 5). The percent of all students, including students with disabilities, scoring at
Level IV increased from 1998 to 1999. In 1998, 45% of students with disabilities scored at
Level I in Mathematics and 59% scored at Level I in Reading. By 1999, the percent of
students with disabilities scoring at the lowest level dropped by 10% in Mathematics and
4% in Reading.
|
No. Level I |
% |
No. Level II |
% Level II |
No. Level III |
% Level III |
No. Level IV |
% Level IV |
1998 - Grade 3 Math all students students without disabilities students with disabilities |
10774 7683 3086 |
18 14 45 |
28541 25753 2788 |
47 48 41 |
17765 16956 809 |
29 32 12 |
3566 3404 162 |
6 6 2 |
1999 - Grade 3 Math all students students without disabilities students with disabilities |
7479 5142 2323 |
12 9 35 |
28144 25052 3066 |
46 46 46 |
20528 19444 1076 |
33 35 16 |
5445 5216 226 |
9 10 3 |
1998
- Grade 3 Reading all students students without disabilities students with disabilities |
13720 9711 4009 |
23 18 59 |
25460 23555 1893 |
42 44 28 |
17930 17123 716 |
30 32 11 |
3442 3319 122 |
6 6 2 |
1999 - Grade 3 Reading all students students without disabilities students with disabilities |
12746 9070 3652 |
21 17 55 |
24250 22268 1967 |
39 41 30 |
19834 18980 846 |
32 35 13 |
4815 4646 168 |
8 8 3 |
Figures 10 and 11
show the proficiency levels of third graders by disability in 1999. Students receiving
speech and language services were the highest performing group of students with
disabilities on both tests. Figure 10 shows that about 30% of students with speech
impairments, emotional/behavioral disorders, deaf/hard of hearing, and visual impairments
scored within the lowest proficiency level in Mathematics. Forty to fifty percent of
students with autism, learning disabilities, other health impairments, physical
disabilities, and traumatic brain injuries scored at Level I in Mathematics, with 90% to
100% of students with mild to moderate and moderate to severe mental impairments scoring
at this level. Except for these last two groups, about the same percent of students across
disability categories scored at Level II, with fewer at Level III, and a very small number
reaching Level IV.
Figure 10. Performance: 1999 Proficiency Levels
3rd Grade Math by Disability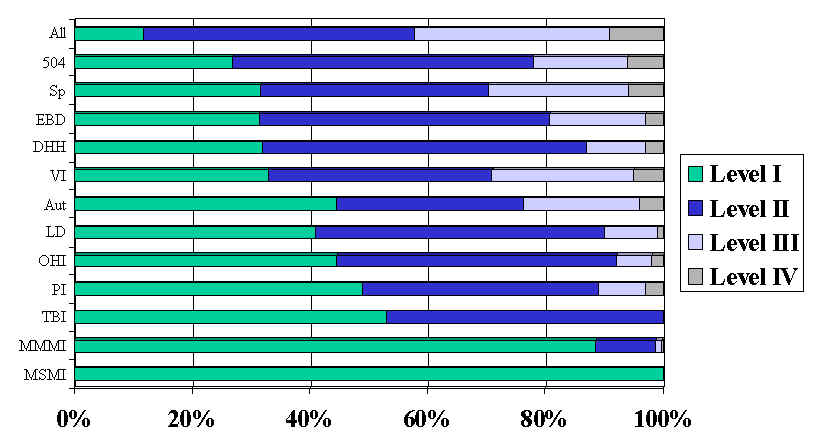
Figure 11. Performance: 1999 Proficiency Levels
3rd Grade Reading by Disability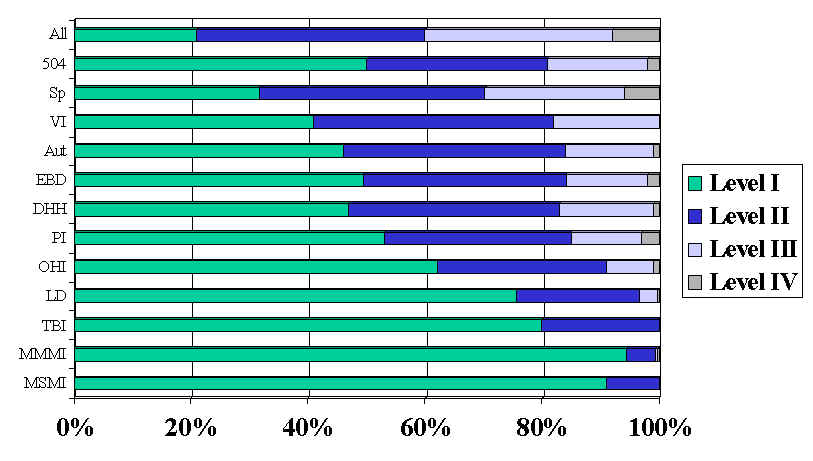
Overall, more
students scored within Level I on the Reading Test than on the Math test. Over 40% of
third graders with all disabilities except speech impairments scored at Level I in
Reading. The percent of students reaching Level II was lower than the percent at Level I. Fewer than 20% of students across most disability
categories scored above Level II in Reading. No students with mild to moderate or moderate
to severe disabilities scored above Level II. Even though many of the mean scale scores
improved from 1998 to 1999, few of the increases were great enough to increase overall
proficiency levels.
Fifth Grade Performance
Scale Scores. Figures 12 to 14 show the mean scale
scores for fifth graders in Mathematics, Reading, and Written Composition across both
testing years. The average performance of all fifth graders tested set the expected mean
at about 1400. As a group, students with disabilities averaged about .75 SD below the
expected mean.
Figure 12. Performance: Mean Scale Scores
5th Grade Math by Disability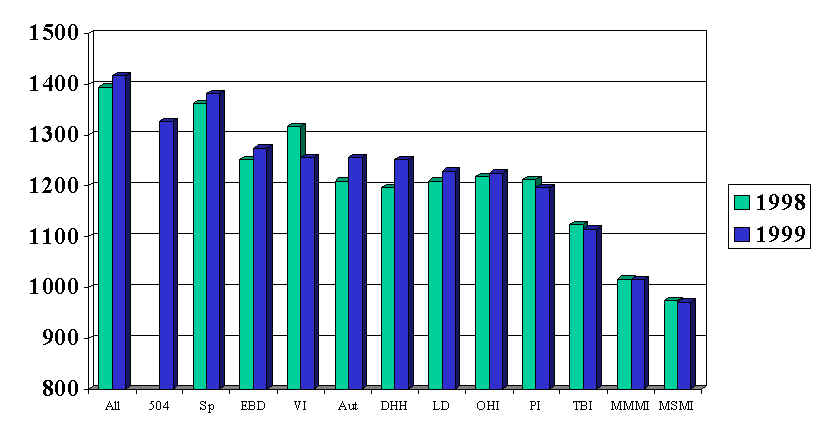
Figure 13. Performance: Mean Scale Scores
5th Grade Reading by Disability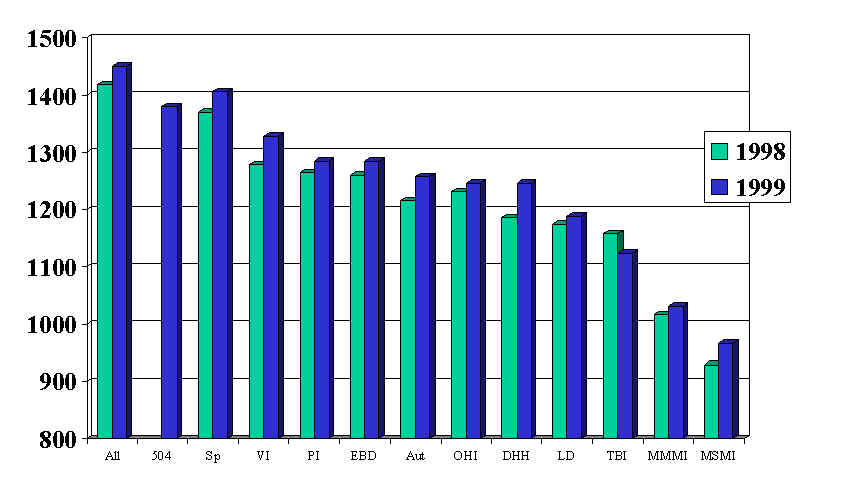
Figure 14. Performance: Mean Scale Scores
5th Grade Written Composition by Disability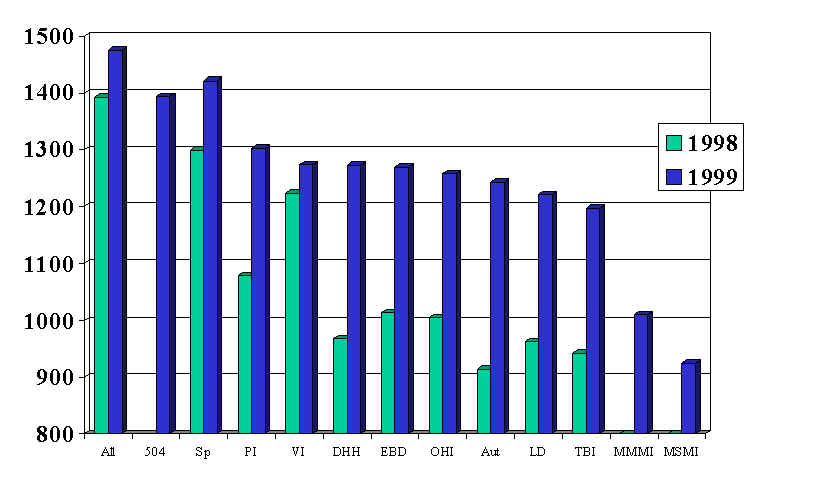
Students with speech
impairments and students with 504 Plans performed within a normal range of the expected
mean scale score. Students representing most other disability groups performed between .5
and 1.0 SD below the expected mean. The mean scale scores of students with mild to
moderate and moderate to severe mental impairments were at least two standard deviations
below the expected mean.
As with the third
graders, on average, 1999 fifth graders scored higher than fifth graders in 1998. The
greatest difference between 1998 and 1999 appeared on the test of Written Composition,
where increases in scale scores averaged about 200 points. The performance of students
across all disability categories averaged about .5 to 1 SD (100 to 200 scale score points)
below the expected mean. Students receiving speech and language services nearly met the
expected mean, while students with mild to moderate and moderate to severe mental
impairments averaged 1.5 to 2.5 standard deviations below the expected mean.
Proficiency Levels. Similarly to third graders,
between 70% and 76% of all fifth graders tested scored within Levels II and III on the
Mathematics and Reading tests, both years (Table 6). All but eight percent scored within
Levels II and III on the test of Written Composition. Ninety two percent of participants
on the test of Written Composition scored within Levels II and III in 1999. Less than 25%
of students with disabilities scored within Level I, the smallest percent of any test.
Over half of the participants with disabilities scored within Level II. Broken down by
type of story prompt, students scored the highest on the problem/solution prompt in both
1998 and 1999. Students received the lowest scores on the descriptive story prompt in 1998
and on the narrative story prompt in 1999. The distribution across types of prompts was
not proportional for students with disabilities in 1998. A greater number of students with
disabilities received the descriptive story prompt in 1998, which may partially explain
why the scores were so much lower than they were in 1999.
|
No. Level I |
% |
No. Level II |
% Level II |
No. Level III |
% Level III |
No. Level IV |
% Level IV |
1998 - Grade 5 Math all students students without disabilities students with disabilities |
12343 894 4156 |
20 16 53 |
29235 26357 2870 |
48 50 37 |
15776 15053 719 |
26 29 9 |
2978 2875 102 |
5 5 1 |
1999 - Grade 5 Math all students students without disabilities students with disabilities |
11207 7316 3861 |
18 14 48 |
27640 24525 3066 |
45 46 38 |
18796 17834 951 |
31 34 12 |
3428 3295 131 |
6 6 2 |
1998
- Grade 5 Reading all students students without disabilities students with disabilities |
12607 7970 4637 |
21 15 59 |
24759 22491 2267 |
41 43 29 |
18321 17536 785 |
30 33 10 |
4778 4621 156 |
8 9 2 |
1999 - Grade 5 Reading all students students without disabilities students with disabilities |
11138 6756 4356 |
18 13 54 |
22947 20394 2510 |
37 38 31 |
20516 19517 976 |
33 37 12 |
6938 6694 239 |
11 13 3 |
1998 - Grade 5 Writing all students students without disabilities students with disabilities |
12064 8275 3805 |
20 16 50 |
22971 20223 2747 |
38 38 36 |
20664 19661 1001 |
34 37 13 |
4641 4529 112 |
8 9 1 |
1999 - Grade 5 Writing all students students without disabilities students with disabilities |
3224 1492 1752 |
5 3 22 |
30218 25268 4950 |
50 48 62 |
25915 24656 1259 |
42 46 16 |
1687 1650 37 |
3 3 .5 |
The percent of all
fifth graders, including students with disabilities, scoring at Level IV increased from
1998 to 1999, except on the test of Written Composition, where there was more movement
toward the middle levels. In 1998, 53% of students with disabilities scored at Level I in
Mathematics, 59% scored at Level I in Reading, and 50% scored at Level I in Written
Composition. By 1999, the percent of students with disabilities scoring at the lowest
level dropped to 48% in Mathematics, 54% in Reading, and all the way down to 22% in
Written Composition.
Figures 15 to 17 show the proficiency levels of fifth graders by disability in 1999. The groups are listed in order of mean performance, from highest to lowest. As with the third graders, fifth graders receiving speech and language services were the highest performing group of students with disabilities on all three tests both years. Proficiency levels were similar across Mathematics and Reading, but much higher for all groups on the test of Written Composition.
Figure 15. Performance: 1999 Proficiency Levels
5th Grade Math by Disability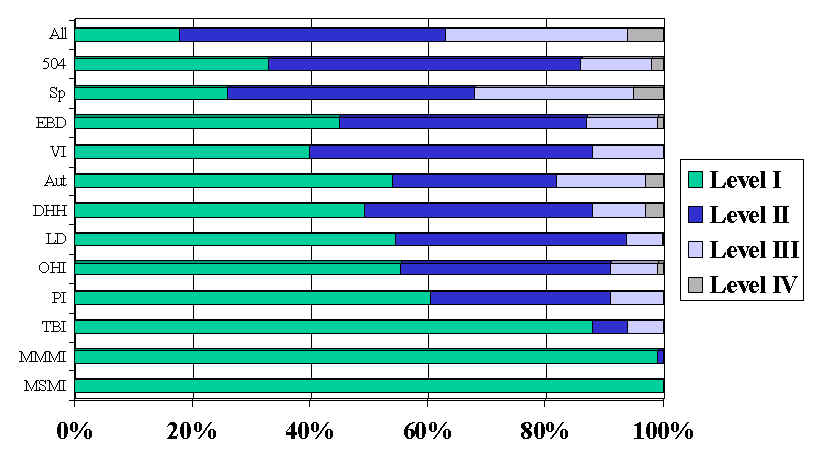
Figure 16. Performance: 1999 Proficiency Levels
5th Grade Reading by Disability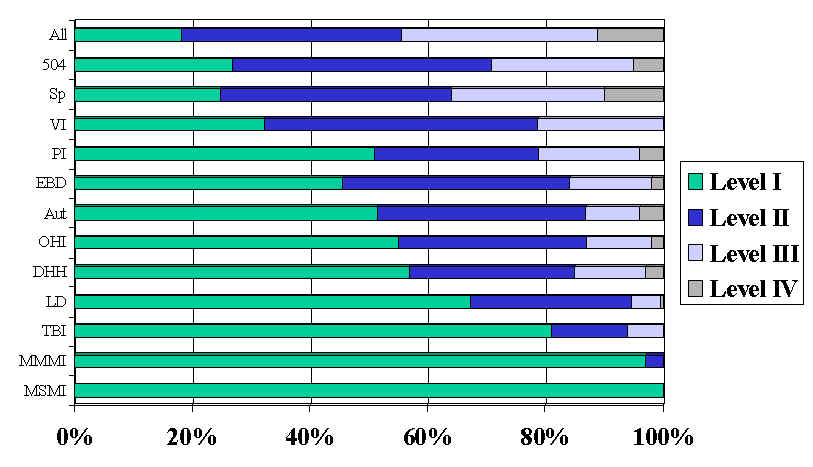
Figure 17. Performance: 1999 Proficiency Levels
5th Grade Written Composition by Disability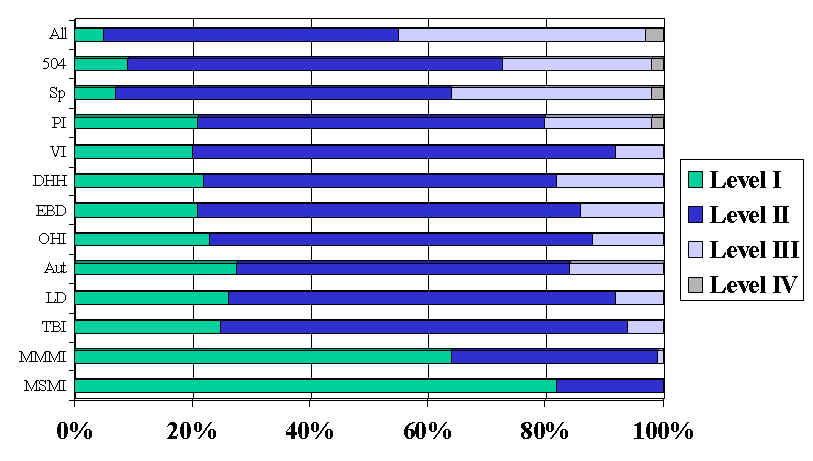
Discussion
Overall, a high
percent of students with disabilities participated in Minnesota’s Comprehensive
Assessments. Students representing most disability categories participated at a rate of
over 80%. As might be expected, less than 10% of students with moderate to severe mental
impairments participated. Students with mild to moderate mental impairments, autism, or
physical impairments participated at rates of 50 to 75%. Participation rates are possible
to calculate with a fairly high degree of accuracy in Minnesota because information about
special education and 504 accommodation services is reported on a statewide database.
These high
participation rates indicate that Minnesotans support the philosophy and practice of
“all means all” for participation in statewide assessments. It will be important
to monitor the use of alternate assessments in the year 2000-01 to confirm that all
students continue to be included in statewide assessment and reporting. If current levels
of participation continue, about 2% of students at each grade level (15 to 20% of students
with disabilities) will participate in alternate assessments each year.
Minnesota’s
Comprehensive Assessments were designed so that about 70% of all participants would score
within Levels II and III. Students with speech impairments and students with 504
Accommodation Plans scored within these parameters. However, most other students with
disabilities score between .5 and 2.5 standard deviations below the mean for all test
takers.
School district
personnel can view the performance of students with disabilities in a variety of ways. It
could be assumed that since low achievement is a criteria for special education
eligibility, it would be reasonable to expect that students receiving special education
services would score much lower than their peers without disabilities.
District personnel
could investigate the use of test accommodations to find how many students with
disabilities use accommodations to decrease the effects of their disability on test
performance, even in elementary school. Documenting test accommodation use would help to
assure that students who might benefit from accommodations receive them on testing days.
Including the type of accommodations used during testing on the district report, so that
the information can be aggregated at the state level, would be helpful in refining
policies about allowable testing accommodations.
Another question to
ask is whether students with disabilities have access to instruction toward the high
standards on which the MCAs are based. Are students with disabilities included in
instructional settings that address the preparatory standards and prepare them for the
High School Standards? If students with disabilities are receiving standards based
instruction, is the rigor comparable to that expected in general education? Schools that
are successfully including students with disabilities in instruction toward high standards
are finding that good support in general education settings, with accommodations as
needed, and lots of hands-on, practical instruction, may raise expectations that students
with disabilities can meet high standards (Thompson, Thurlow, Parson, & Barrow, 2000).
Minnesota has
embraced the inclusion of all students in statewide testing and reporting. In the future
it will be critical to continue this trend, while also working toward improved achievement
of students with disabilities.
References
Erickson, R.,
Thurlow, M., & Thor, K. (1995). 1994 state
special education outcomes. Minneapolis, Minnesota: University of Minnesota, National
Center on Educational Outcomes.
Thompson, S. J.,
& Thurlow, M. L. (1999). 1999 state special
education outcomes: A report on state activities at the end of the century.
Minneapolis, Minnesota: University of Minnesota, National Center on Educational Outcomes.
Thompson, S. J.,
Thurlow, M. L., Parson, L., & Barrow, S. (2000). Initial
perceptions of educators as they work toward including students with disabilities in
Minnesota’s High Standards (Minnesota Report 25). Minneapolis, Minnesota:
University of Minnesota, National Center on Educational Outcomes.
Thurlow, M. L.,
Elliott, J. L. & Ysseldyke, J. E. (1998). Testing
students with disabilities: Complying with district and state requirements. Thousand
Oaks, CA: Corwin Press.
Thurlow, M. L.,
Langenfeld, K. L., Nelson, J. R., Shin, H., & Coleman, J. E. (1998). State accountability reports: What are states saying
about students with disabilities? (Technical Report 20). Minneapolis, Minnesota:
University of Minnesota, National Center on Educational Outcomes.
United States Code
Service (1999). 20 USCS section 6301 [On-line].
Available: http://web.exis-nexis.com/congcomp/document
IDEA
Requirements
Section 612 –
State Eligibility (a) (17)
(A)
in general
Students with disabilities are included in general State and
district-wide assessment programs, with appropriate accommodations, where necessary. As
appropriate, the State or local educational agency –
(i) develops guidelines for participation of
students with disabilities in alternate assessments for those students who cannot
participate in State and district-wide assessment programs; and
(ii) develops and, beginning not later than
July 1, 2000, conducts those alternate assessments.
(B) Reports
The State educational agency makes available to the public, and
reports to the public with the same frequency and in the same detail as it reports on the
assessment of nondisabled students, the following:
(i) the number
of students with disabilities participating I regular assessments,
(ii) the number
of those students participating in alternate assessments
(iii) (I) the
performance of those students on regular assessments (beginning not later than July 1,
1998) and on alternate assessment (not later than July 1, 2000), if doing so would be
statistically sound and would not result in the disclosure of performance results
identifiable to individual students.
(II) data relating to the performance of
students described under subclause (I) shall be disaggregated –
(aa) for assessments conducted after July 1,
1998; and
(bb) for assessments conducted before July 1,
1998, if the State is required to disaggregate such data prior to July 1, 1998.
Section 614 –
Individualized education program
The term ‘individualized education program’ or ‘IEP’
means a written statement for each child with a disability that is developed, reviewed,
and revised in accordance with this section and that includes –
(v) (I) a
statement of any individual modifications in the administration of State or districtwide
assessments of student achievement that are needed in order for the child to participate
in such assessment; and
(II)
if the IEP Team determines that the child will not participate in a particular State or
districtwide assessment of student achievement (or part of such an assessment), a
statement of –
(aa) why that
assessment is not appropriate for the child; and
(bb) how the
child will be assessed.
Appendix B
Accommodations
Allowed on Minnesota Comprehensive Assessment Tests
Guidelines for
accommodations:
An accommodation is
defined as any change in testing conditions that does not alter the validity or
reliability of the state standard. Accommodations may not compromise the security of the
test and should be consistent with the goals of the student’s IEP or 504 plan.
Students who have accommodations will have their tests scored according to state scoring
procedures.
Typically,
accommodations allow a change in one or more of the following areas:
• presentation format
• test setting
• scheduling or timing
• response format
Since the testing
requirements vary, not every accommodation is appropriate or permitted for every test.
Specific accommodations are indicated for specific subject areas. Accommodations, which
require alternate test booklets, testing materials or special handling, are noted.
Alternate materials must be requested on the Statewide Testing Registration/Order form.
When selecting
accommodations for students, IEP or 504 teams should consider the needs of the student in
daily instructional situations as well as any additional needs that might arise in a
secure testing situation. Students may require
multiple accommodations such as interpreted directions and extended time. The
following is a suggested list of accommodations. If you wish to provide an accommodation
not listed, please check with either the division of Special Education or the Office of
Graduation Standards at the Minnesota Department of Children, Families, and Learning.
Alternate
Presentation Formats
Accommodation |
Test |
Directions may be given in any format necessary to accommodate students (signing, auditory amplification, repeating, etc.) Test administrators must use the script in the testing manual to explain the task to students. They will not be allowed to go beyond the script in giving or clarifying directions. Directions are found in the test administration manual. These are non-secure documents and may be received prior to test administration. |
Mathematics Reading Written Composition |
Large-print is an enlarged copy of the test. Students who use the large-print edition will be allowed to mark their answers on the large-print test booklets. (Large print is in Times Roman and is available in 14, 18, 24 and 36-point font size.) School testing personnel must transfer answers to a scannable answer sheet. Transfer of answers must be documented (including the names of the school personnel involved) on the Testing Report form. Be sure to check the accuracy of any transferred answers. |
Mathematics Reading Written Composition *Special Order Materials |
Braille versions of all tests are available to students who are blind or partially sighted, and are trained in this system. Student responses may be recorded in one of the following ways: · recorded by a proctor, · marked in the booklet by the student, · recorded with a typewriter or word processor, · dictated to a scribe, or · recorded by the student using a Braillewriter or a slate and stylus. A copy of Braille tests will be provided in regular print to test administrators or proctors working with students at the time of testing. School testing personnel must transfer answers to a scannable answer sheet. Transfer of answers must be documented (including the names of the school personnel involved) on the Testing Report form. Be sure to check the accuracy of any transferred answers. |
Mathematics Reading Written Composition *Special Order Materials |
Magnification or low vision aids may be used by visually impaired students to read tests. |
Mathematics Reading Written Composition |
Templates to reduce visual print field may be used by students to read tests. |
Mathematics Reading Written Composition |
Audiocassettes may be provided for students who have difficulty with printed words or numbers and/or who acquire knowledge primarily through the auditory channel. (Materials must be ordered separately). Note: Cassettes should be ordered for each student and administered using headphones or in individual stations. |
Mathematics *Special Order Materials |
A script of the audiocassette may be provided for testing personnel to read or interpret the Mathematics test for any student who has difficulty with printed words or numbers and for whom the audiocassette is not appropriate. |
Mathematics *Special Order Materials |
Interpretation of the Mathematics test may be provided for deaf or hard of hearing students. The audiocassette or the audiocassette script must be used for interpreting as it has been carefully prepared to maintain the validity of the test. Only literal interpretation of the script is acceptable as an accommodation. |
Mathematics *Special Order Materials |
Large print answer booklets may be provided for students who, due to the size of their handwriting, require more space for Written Composition. |
Written Composition *Special Order Materials |
Short segment test booklets may be ordered for students who are unable to take the entire test in one sitting. These tests may be administered only on the official date during the designated instructional test day. (These are only available for the Basic Standards Test.) |
Mathematics Reading *Special Order Materials |
Alternate Scheduling and Setting Formats
Accommodation |
Test |
Extended time may be provided to any student. While each test has a suggested amount of time for test administration, there is no limit to the amount of time a student may be allowed with in the officially designated instructional test day. Every student should be given sufficient time to respond to every test item. |
Mathematics Reading Written Composition |
Individual or small group administration may be provided to students who may need to take a test alone in a room or with a small group of students. For example, students who will need additional time, use an audiocassette version of the Mathematics, etc. should be allowed to test in a separate room. |
Mathematics Reading Written Composition |
Special settings may be provided for students. tests may be administered in rooms with special lighting, acoustics, or furniture to accommodate needs. |
Mathematics Reading Written Composition |
Testing time during instructional day may be adjusted according to the needs of the student. Students may test at any time during the officially designated instructional test day. |
Mathematics Reading Written Composition |
Alternate Response Formats
Accommodation |
Test |
Braille Writers may be used by students who are trained to use them. Since Braille Writers include "spellcheckers" which cannot be removed from the machine, a monitor must verify that the student has not activated this portion of the Braillewriter program. Answers must be transferred to a scannable answer sheet by school testing personnel. Transfer of answers must be documented (including the names of school personnel involved) on the Testing Report form. Be sure to check the accuracy of any transferred answers. |
Mathematics Reading Written Composition |
Word processors or similar assistive devices may be used if the IEP or 504 team determines it would be appropriate. Students may not have access to the following features of word processing programs: spell check, thesaurus, grammar check, or other reference or preparation materials. Student responses to the Test of Written Composition, which are produced by word processors, must be attached to the scannable Writing booklet. Personal information must be filled in by testing personnel in the district. (Answer documents require special handling for return to NCS.) Answers for the Reading and Mathematics tests must be transferred to a scannable answer booklet by school personnel. Transfer of answers must be documented (including the names of school personnel involved) on the Testing Report form. Be sure to check the accuracy of any transferred answers. |
Mathematics Reading Written Composition |
Voice-activated computers may be used by students who are trained to use them. Students may not have access to the following features of word processing programs: spell check, thesaurus, grammar check, or other reference or preparation materials. For the test of Written Composition, dictated spelling and punctuation must be verified by the student author. Students must spell out every word and give punctuation for a scribe to write following the dictation of the composition. Scribes must be impartial and should be experienced in transcription. They must write EXACTLY what the student dictates. Students may be given scripted responses for editing purposes. Student responses to the test of Written Composition, which are produced by voice-activated computers, must be attached to the scannable Writing booklet. Answers for the Reading and Mathematics tests must be transferred to a scannable answer sheet by school personnel. Personal information must be filled in by testing personnel in the district. Transfer of answers must be documented (including the names of school personnel involved) on the Testing Report form. Be sure to check the accuracy of any transferred answers. |
Mathematics Reading Written Composition |
Writing directly in the test booklet is permitted for any student. For example, students may wish to use a highlighter on the Reading selections or write out calculations next to Mathematics problems. Note: Grade 5 test booklets are not scored. Answers must be transferred to the answer document. (See the section below.) |
Mathematics Reading Written Composition |
Mark answers in the test booklets. Students may record answers directly onto the test booklets. School testing personnel must transfer answers to the scannable answer sheet. For grade 5, the transfer of answers must be documented (including the names of school personnel involved) on the Testing Report form. Be sure to check the accuracy of any transferred answers. Grade 3 students have scannable test booklets. |
Mathematics Reading |
Tape recorders may be used to record answers if the student is unable to mark a scannable answer sheet. Answers must be transferred to a scannable answer booklet by school testing personnel. Transfer of answers must be documented (including the names of school personnel involved) on the Testing Report form. Be sure to check the accuracy of any transferred answers. |
Mathematics Reading |
Tape recording of the Reading Test may be done in individual testing settings. The student may read the Reading test into a tape recorder. The tape may be replayed by the student as the test is taken. |
Reading |
Tape recording of pre-Writing is permitted in individual testing settings. Students may record their ideas to assist in pre-Writing organization. The students may replay their dictation as they organize their compositions. |
Written Composition |
Scribes may be provided for students whose visual motor responses inhibit their ability to write answers. Scribes must be impartial and should be experienced in transcription. They must write EXACTLY what the student dictates. Students must spell out every word and give punctuation for a scribe to write following the dictation of the composition. Students may be given scripted responses for editing purposes. Personal information must be transferred to a scannable answer sheet by school testing personnel. The transcription must be documented (including the names of school personnel involved) on the Testing Report form. |
Written Composition |
An Abacus may be used in place of a calculator on the calculator portion of the Mathematics test. |
Mathematics |