Prepared by Kristin Liu, Deb Albus, Martha Thurlow, John Bielinski, and Rick Spiccuza
This document has been archived by NCEO because some of the information it contains is out of date.
Any or all portions of this document may be reproduced and distributed without prior permission, provided the source is cited as:
Liu, K., Albus, D., Thurlow, M., Bielinski, J., & Spiccuza, R. (2000). Factors related to the performance of LEP students on Basic Standards Tests (Minnesota Report No. 27). Minneapolis, MN: University of Minnesota, National Center on Educational Outcomes. Retrieved [today's date], from the World Wide Web: http://education.umn.edu/NCEO/OnlinePubs/MnReport27.html
Large-scale assessment data are often used along with other
information to plan school improvement efforts. These improvement efforts, however, may
lack important information about student needs because state assessment reports and
research on large-scale assessments tend to treat students with non-English language
backgrounds or with limited English proficiency as one large group with one set of needs.
For such students, educational researchers have recommended disaggregating test scores and
other data by language group, by type of accommodation used, and by whether students are
receiving English as a second language (ESL) services or not (August, Hakuta, Olguin &
Pompa, 1995; National Center for Education Statistics, 1996). These recommendations are
supported by recent research that reported differences in test scores among students with
different non-English language backgrounds, and between those who were receiving ESL
services and those who were not (Liu, Thurlow, Thompson & Albus, 1999). In addition,
Cota (1997) found that the educational history of students with limited English
proficiency had an effect on their current academic performance. Other factors which may play a role in
students’ performance include their socio-economic status, mobility, length of time
in the U.S., and length of time in U.S. schools. Educators
and policymakers need to know which factors significantly affect student performance so
they can plan to meet students’ complex and diverse needs.
This report summarizes data that were collected during 1996-98 to
examine more in depth the factors related to the performance of students with non-English
language backgrounds in Minnesota state assessments.
Definitions of the groups of students that were studied are given, the
Minnesota assessment is characterized, and the factors that were analyzed are described.
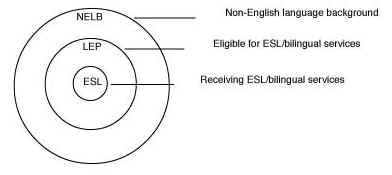
All the students in this study had a non-English language
background (NELB). A NELB student is a
student who speaks or has had significant exposure at home to a language other than
English. Defining students as
“NELB” does not necessarily mean they have limited English proficiency, nor does
it differentiate between students who may need ESL or bilingual services now, or who may
have received services in the past. In this report, a student with limited English
proficiency (LEP) is defined as a NELB student who has met the Minnesota criteria for
being eligible for ESL services. LEP students
may or may not be receiving services. The subgroup of LEP students who are receiving
services are defined in this report as ESL students.
These definitions are shown graphically in Figure 1.
Figure 1. Definitions of Non-English Language Background Students by Subgroups
In Minnesota, students must pass Basic Standards Tests (BSTs),
which are minimum competency tests of reading, mathematics, and writing, to earn a high
school diploma. Students take the reading and
mathematics portions first in the 8th grade, and may repeat them one to two times per year after that
until they pass with a 75% correct score or higher. The
writing test is administered for the first time in 10th grade. These requirements apply to all students including NELB
students. While there has been some attention paid to ESL students (i.e., those receiving
services), the needs of NELB students not receiving services have not received much
attention when the state examines the relationship between BST scores and school
improvement efforts. This is a significant
omission since school and program improvement is among the major goals when administering
these and other tests.
This study was conducted using a record review approach to
analyze student background characteristics that affect participation and performance of
various subgroups of NELB students on Minnesota’s Basic Standards Tests. We sought to examine the relationships between
test performance and mobility, educational history, home language, receiving ESL services,
and English language proficiency test scores. An urban district and a rural district
participated in this study. Two high schools were chosen from each district along with one
junior high school and alternative school sites.
Site Descriptions: District One
District One’s junior and senior high schools were located
in a rural town with a population of 19,000. The student population consisted of
Caucasians (79.7%), Hispanics (17.5%), African-Americans (1.0%), Asians (.7%), and others
(1.1%). A total of 1, 858 students received free or reduced price lunch in the district.
The number of NELB students attending the junior high, senior high, and alternative
learning center was 291. Of these, 161 students in grades 7-12, were identified as having
limited English proficiency, and 129 were receiving ESL or bilingual education services.
The average student-teacher ratio in ESL/bilingual education
classes in grades 7-12 was 10:1. There were 13 ESL licensed teachers. None of the regular
education teachers taught ESL or bilingual classes. Four educational assistants worked in
ESL/bilingual education.
The average time students spent in ESL services depended on the
student’s grade level and English proficiency. In the junior high school, time in ESL
classes varied between 1-3 class periods a day. In the senior high, all students receiving
ESL services did so for one block a day (with 4 blocks making up a day).
District 1 Alternative Sites
One alternative site had 90 students with 42% eligible for free
or reduced priced lunch. Twenty-two percent of these students received ESL or bilingual
services. There was no information available
for teacher staff in that year. The average daily attendance was 42 students. The
Inter-district Mobility Index was 50.9, and the Intra-district Mobility Index was 51.8.
These indicies showed that approximately half of the students moved each year, either
between districts or within the district.
For the second alternative site there was an enrollment of 27
students with 78% eligible for free or reduced priced lunch. Thirty percent of the
students received LEP services, and all of them were receiving special education services.
The average daily attendance was 24 students. The Inter-district Mobility Index was 74.1
and the Intra-district Mobility Index was 55.6. Similar to the first alternative site,
there was no information available on teaching staff.
Site Descriptions: District Two
District Two’s middle school served grades 6 through 8, and
was located in a Midwest metropolitan city with a population of 2.68 million. As of fall
1997, the middle school population was 725 students. Approximately 76% had free lunch
status. NELB students made up 29% of the student population. The ethnic background of this
student body was Asian students (21%), African American (36%), Hispanic (14%), and
American Indian (6%); 23% of the students had other ethnic backgrounds, predominately
Caucasian. A total of 209 students was identified as eligible for ESL or bilingual
education services. Of these, 197 students in 7th and 8th grades received services.
The bilingual education program in this District Two middle
school was both a maintenance bilingual education program and a transitional bilingual
program. Students were dismissed from services either by early exit (less than 3 years) or
late exit, depending on student needs. ESL programming consisted of either one scheduled
class in one or two school days or a newcomer remedial class. On average, students had
participated in ESL and/or bilingual services for 2 years.
The average student-teacher ratio in ESL/bilingual classes was
16:1, which compared to an average student-teacher ratio in regular education classes of
24:1. There were five bilingual education teachers and three ESL teachers in the
ESL/bilingual education program. Two of these teachers were licensed bilingual education
teachers and two were licensed ESL teachers. One teacher was a regular education teacher
with a provisional license. In addition to this teaching staff, there were three
ESL/bilingual educational assistants working in the program.
District Two’s senior high had a total of 438 students
receiving ESL/bilingual services, with 264 of these being in grades 9 and 10. The average
student-teacher ratio for regular education classes and the ESL/bilingual program is 25:1.
The school had six licensed bilingual teachers and eight teachers licensed in ESL. Also,
there were three educational assistants working in the ESL/bilingual program. The
bilingual program was Dual Immersion/2-way bilingual education with no “exit
program.”
Six research staff collected data over a span of 1-1/2 years.
Although staff aimed to collect all data from students’ cumulative files (Cum F),
this was not possible due to incomplete data. Supplemental information was collected from
the districts’ databases, ESL/bilingual teacher files, and ESL coordinator reports.
Of the 646 files reviewed across all sites, there were 99 files
that could not be used due to extreme lack of data, (e.g., only student name and free or
reduced lunch indicator were available). Another 22 files were unable to be used due to
lack of information such as an identification number in the Minnesota Automated Reporting
Student System. It should also be noted that the record review for 10th graders started at one of the sites was not completed due to
time constraints. The reviewed 10th grader files are not included in this report. The total number
of files reviewed and used by district and site are provided in Table 1.
Table 1. Files Reviewed and Used by Site
|
District
1 |
District
2 |
||||
|
Sr.
High (9th
only) |
Jr.
High |
ALC
(1) |
ALC
(2) |
Sr.
High |
Jr.
High |
Files
Reviewed |
64 |
47 |
21 |
5 |
390 |
119 |
Files
used |
62 |
45 |
8 |
0 |
298 |
115 |
Table 2 shows the types of information that were collected and
the sources from which data were collected across sites. It is interesting to note that
several pieces of information were available from two sources or more, but that some
information was only available from one source. The sources of information were not
necessarily the same in the two districts.
Table 2. Information Collected and Sources
Information
Collected |
District
1 Sources |
District
2 Sources |
|||||
|
Cum
File |
ESL
File |
District |
ESL
Coord |
Cum
File |
District |
ESL
Coord |
Home
Language |
X |
X |
|
|
X |
X |
|
Gender |
X |
X |
|
|
X |
X |
|
Birthdate |
X |
X |
|
|
X |
X |
|
Graduation
Year |
X |
|
|
|
X |
|
|
ESL
Services |
X |
X |
|
X |
X |
X |
X |
BST
Scores |
X |
|
X |
|
X |
X |
|
Economic
Indicator |
|
|
X |
|
|
X |
|
Country
of Origin |
X |
X |
|
|
X |
|
|
Time
in U.S. |
X |
|
X |
|
X |
|
|
Time
in U.S. schools |
X |
|
|
|
X |
|
|
Time
in District |
X |
|
|
|
X |
|
|
School
Changes |
X |
|
|
|
X |
|
|
Achievement
tests |
X |
X |
|
|
X |
|
|
Language
Proficiency Tests |
X |
X |
|
|
X |
|
|
Note: ESL file data were from a set of records kept by ESL teachers. These data were repetitive of data from cumulative files and were used to help fill in data possibly missing from cumulative files. ESL Coordinator data involved information about student placement which in some, but not all cases, was provided at the district level.
Issues in Collecting Data
Data collectors encountered several difficulties while collecting
data. Because many files were incomplete or contained no records from previous schools, it
was difficult to obtain information on academic history, past or current LEP or bilingual
status, and current grade placement. In other files, there was an abundance of other
information that reviewers needed to look through to find the data relevant to this study.
Some information that was available was difficult to interpret because of a lack of
clarity in the definition of language minority students and conflicting information on
home language forms. Other files lacked educational history, test scores and transcripts,
usually due to high mobility of students. Even when data were available, other problems
arose with interpreting them. For example, it was often difficult to calculate moves
between schools within a district because of school name changes or restructuring of
grades in schools. More specific information on data issues encountered in this study is
reported in Liu and Thurlow (2000).
Despite the attempts of data collectors to maintain consistency
throughout the data collection process, changes in procedures were unavoidable. This
occurred, for example, when collecting data on the students’ LEP status. Originally
the plan was to collect LEP status data from the cumulative file. However, student
cumulative file data were incomplete and hard to interpret. Thus, data collectors decided
to consult ESL coordinators’ reports and school district data offices for information
on ESL program start dates in order to identify students as LEP.
Data collectors had to select among the numerous data entries in
cumulative files. For example, in calculating the number of school changes it was decided
that one change (from elementary to junior high or from junior high to senior high) was
the norm for students. Data collectors recorded the number of transfers and later
categorized them into “less than three” and “three or more.” In
addition, for one district in our study, some schools had additional possible changes,
particularly in K-2 and K-4 schools; these were counted as school transfers.
Data Collection Reliability
During data collection, every fifth file (20%) was independently
reviewed a second time by a project staff member who had not taken part in the first
review. Then the first and second file reviews were analyzed for accuracy. Inter-rater
agreement on five types of information was checked: home language, most recent test scores
on major standardized achievement tests and language proficiency tests, all the Basic
Standards Tests scores for 1996 and 1997, and English as a Second Language (ESL) status.
For standardized achievement tests, inter-rater agreement was checked only for the most
common tests.
The data were checked for agreement in two ways. First, all items
coded by either the first data collector or the reliability check person were compared.
This comparison is found in Table 3 under “All items.” The 91% agreement was
high, perhaps because this analysis counted data that were missing. Because it is
relatively easy to get agreement that data are missing, this agreement estimate gives an
inflated index of agreement.
Table 3. Agreement Rate
All
items |
Existing
Items
|
||
Number compared
|
1048 |
Number compared
|
419 |
Number
agreed |
957 |
Number
agreed |
330 |
Percent
agreed |
91% |
Percent
agreed |
79% |
A second agreement check compared only those items where at least
one reviewer found information in a file. This percentage, under “Existing
items,” is lower at 79%. Still this is an acceptable agreement rate.
Some of the difference in agreement might be due to the fact that
the decision about how to collect ESL services changed during the data collection process,
causing some inconsistency in the collection of these data. All inconsistencies were
resolved by choosing the more official cumulative file data over data from less official
sources.
Findings were examined in several ways. First, we looked at the
missing data. Next, we analyzed BST performance as a function of several student
characteristic variables, including (1) demographic characteristics, (2) home language,
(3) multiple time test takers, (4) ESL and bilingual services, and (5) NRT and language
proficiency test scores.
Missing Data
Missing data were a significant problem in this study. For
example, records often did not contain data on what kinds of services were received by
students (ESL/bilingual) or whether students were continuing to receive them. Across
sites, we were not able to find gender or “free or reduced lunch status” (an
indicator of socioeconomic status) for 1-5% of the students. Missing data created very
significant problems for looking at number of school changes and number of years in U.S.
schools. On these variables, there were no data for 40-86% of the students.
Demographic Characteristics and BST Performance
Characteristics for students across all sites, for those students
whose files could be used, are provided in Table 4. Different Ns for categories (i.e.,
Gender) are due to missing or conflicting data.
Table 4. Demographic Characteristics of Students Across All Sites
Characteristic
|
|
Count
|
Percent |
Gender
|
Male
|
262 |
51.5% |
Female |
247 |
48.5% |
|
Total |
509 |
100.0% |
|
Grade
|
8 |
160 |
30.5% |
9 |
218 |
41.6% |
|
10 |
146 |
27.9% |
|
Total |
524 |
100.0% |
|
School
Changes |
<
3 |
144 |
84.2% |
=
3 |
27 |
15.8% |
|
Total |
171 |
100.0% |
|
Home
Language |
Hmong |
111 |
30.4% |
Laotian |
16 |
4.4% |
|
Spanish |
134 |
36.7% |
|
Somali |
39 |
10.7% |
|
Other |
65 |
17.8% |
|
Total |
365 |
100.0% |
|
Lunch
Status |
Pay
in full |
73 |
14.4% |
Reduced |
23 |
4.5% |
|
Free |
412 |
81.1% |
|
Total |
508 |
100.0% |
The students in our sample included students in grades 8, 9 and
10, most of whom received free or reduced lunch support and who moved fewer than three
times after coming to the U.S. The students had a variety of home languages, but most were
Hmong and Spanish. These data are not limited to students who had been in a district a
certain number of years, who had been in the U.S. or in U.S. schools a specific number of
years (see Table 5).
Table 5. Years in District, U.S. Schools, and U.S. for Students Across All Sites
Characteristic |
Valid
N |
Mean |
Median |
Range |
Time in District
|
363 |
3.54 |
2.5 |
0 to 12 |
Years
in U.S. Schools |
220 |
5.67 |
6.5 |
0 to 14 |
Years
in U.S. |
320 |
7.80 |
6.5 |
0
to 17.5 |
While the average time in district was 3.5 years, the time varied
for individuals from 0 to 12 years in district. The average length of time in U.S. schools
was 5.6 years and the average length of time in the U.S. was 7.8 years.
We combined the students in Districts 1 and 2 to analyze the relationships between characteristics and BST performance. Significant correlations found were for “Years in U.S. Schools” and “School Changes.” ‘Years in U.S. schools’ data are shown in Figure 2.
Figure 2. Years in U.S. Schools by BST Scores
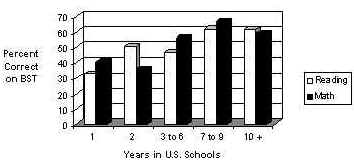
Analyses of relationships between student background
characteristics and BST performance revealed that the number of years a student had been
in U.S. schools was moderately related to BST performance (rread=.479; rmath=.497).
We examined the effect of the number of school changes on BST
performance. After controlling for gender, free/reduced lunch status, time in district,
and the number of years in U.S. schools, we found a significant difference in the
performance of students with fewer than 3 school changes on the reading test compared to
students with 3 or more changes (p=.04). The mean performance of students with fewer than
three school changes (57.6) was significantly higher than that of students with 3 or more
changes (42.0). The difference on the math test was not statistically significant.
Home Language and BST Performance
Table 6 shows the average BST reading and math scores for first time test takers from various home languages. Students were separated out into groups by highest number of students in a group. “Other Languages” includes students from lesser represented language groups in the database: Afghan, Amharic/Tigrinia/Oromo, Arabic, Bosnian, Cambodian, Cebuano, Chinese, Croatian, French, Hindi, Lao Polish, Nuer, Portuguese, Romanian, Spanish, Swahili, Ukranian, Vietnamese, and English dialects.
Table 6. Average Percent Correct by Home Language on First Tests
Language
|
|
Reading |
Math |
Hmong |
Mean
|
42.5% |
49.8% |
S.D. |
19.05 |
18.3 |
|
N |
104 |
103 |
|
Laotian |
Mean |
56.2% |
59.2% |
S.D. |
19.86 |
19.25 |
|
N. |
15 |
15 |
|
Spanish |
Mean |
51.6% |
56.5% |
S.D. |
18.75 |
19.62 |
|
N. |
115 |
116 |
|
Somali |
Mean |
42.3% |
39.2% |
S.D. |
14.73 |
14.91 |
|
N. |
26 |
25 |
|
Other |
Mean |
53.8% |
55.2% |
S.D. |
19.78 |
19.13 |
|
N. |
55 |
23 |
Across groups, students averaged about 49% correct on their first
reading test. Individual language group means for reading ranged from 42% to 56% correct.
On the first math test the total group averaged about 52% correct with individual language
groups ranging from 39% to 59% correct. It should be noted that within this sample are
students from a voluntary test year (1996) as well as students who may have been taking
the test for the first time in another year.
Multiple Time Test Takers and BST Performance
Table 7 shows the average mean scores for NELB (including LEP) students taking the BST reading and math tests the first time compared to the same students’ second or third time taking the tests.
Table 7. Average Gain in Scores of NELB Students from 1st to 2nd and 1st to 3rd Tests
|
Reading (n=186) |
Math (n=167) |
Reading (n=55) |
Math (n=47) |
||||
1st
Test |
2nd
Test |
1st
Test |
2nd
Test |
1st
Test |
3rd
Test |
1st
Test |
3rd
Test |
|
Mean
% Correct |
42.4% |
53.2% |
49.4% |
55.3% |
37.8% |
61.0% |
44.5% |
62.9% |
S.D. |
15.4 |
18.5 |
12.9 |
16.4 |
14.9 |
17.9 |
11.0 |
16.8 |
Test
Gains |
11
pts |
6
pts |
24
pts |
18
pts |
||||
*Note: Only a subset of students took the tests 3 times
As might be expected the gains between the 1st and 3rd test
attempts are greater than between the 1st and 2nd attempts. Gains ranged from 6 to 11
points from the 1st to 2nd test, compared to an 18 to 24 point gain from the 1st to 3rd
tests. Also, there was a higher average gain in reading than math. This may be explained
perhaps by more focused instruction and remediation in reading skills. Also, it may be
harder to teach students all the possible types of math problems that might appear,
including problems that require fairly sophisticated reading skills.
Re-testing by Home Language
Tables 8 and 9 show the BST performance of NELB (including LEP) students for the first and second test attempts by home language group on reading (Table 8) and math (Table 9). All groups showed increases in median test performance, except Somali students; this group had too few students to be reliable. Gains were largest for the Hmong and Spanish language groups. All groups showed increases on the second math test except for Spanish students; the scores of this group stayed the same. Again, the Somali group had too few students to be reliable.
Table 8. Median Percent Correct of NELB Students on First and Second Reading Tests
|
Home Language Groups of NELB Students
|
||||
|
Hmong (n=54)
|
Laotian (n=12)
|
Spanish (n=17)
|
Somali
(n=3) |
Other
(n=27,
26) |
|
Median |
Median |
Median |
Median |
Median |
1st
Test |
33% |
58% |
53% |
50% |
45% |
2nd
Test |
45% |
64% |
65% |
30% |
51% |
Table 9. Median Percent Correct of NELB Students on First and Second Math Tests
|
Home Language Groups of NELB Students
|
||||
|
Hmong (n=58)
|
Laotian (n=8)
|
Spanish (n=13)
|
Somali
(n=3) |
Other
(n=3) |
|
Median |
Median |
Median |
Median |
Median |
1st
Test |
43% |
54% |
54% |
28% |
50% |
2nd
Test |
54% |
60% |
54% |
31% |
62% |
Table 10 and 11 show the change in reading and math BST scores from the first attempt, grouped by percent correct, to the second attempt.
Table 10. Changes in Mean and Median Reading Scores from First to Second Tests
|
2nd
Test |
||
%
Correct on 1st Test |
N
in Group |
Mean
Gain for
Group in
% Pts |
Median
Gain for
Group in % Pts |
1-30% |
52 |
16.3
|
12.5
|
31-45% |
66 |
10.7
|
10.0
|
46-55% |
23 |
7.2 |
7.5 |
56-65% |
22 |
9.3 |
5.8 |
66-75% |
13 |
5.8 |
10.0
|
All
Groups |
176 |
11.3
|
10.0
|
Table 11. Changes in Mean and Median Math Scores from First to Second Tests
|
2nd
Test |
||
Percent
Correct on 1st Test |
N
in Group |
Mean
Gain for
Group in % Pts |
Median
Gain for
Group in % Pts |
1-30% |
13 |
8.1
|
0.0
|
31-45% |
50 |
8.5
|
8.8
|
46-55% |
35 |
3.5
|
2.9
|
56-65% |
34 |
4.7
|
7.4
|
66-75% |
21 |
3.1
|
4.1 |
All
Groups |
153 |
5.7
|
4.4 |
Overall, the average change in score from first to second time
testing in reading was 11.3 percentage points (median = 10). The median gain was largest
for the lowest scoring group (12.5 points), and the gains in the other groups were not all
that different. Of course, it is important that students with the lowest scores,
particularly below 30% correct, show larger gains because more gain is required to pass.
If the gains were to be constant on each additional test, then one might predict that
students in the lowest group would not pass prior to their anticipated graduation year.
However, the scores of individual students changed in different ways from the first to
second attempt. For example, when we looked at individual student data, we found one
student who had a score on the second test that was 35 percentage points lower than on the
first test. We also found at least one other student who had a score on the second test
that was 63 percentage points higher than on the first test.
The gains on the math test were not as great as on the reading
test. Overall, the average gain was less than 6 percentage points, and the median gain was
just over 4 points. The median gain was smallest in the lowest performing group (median
gain = 0), and largest in the group of students who scored between 31% and 45% correct on
the first test (median = 8.8). If this rate were to continue, one might predict that
students scoring below 55% correct on the first test would not pass by the anticipated
graduation year.
Table 12 shows the total number and percent of NELB students who passed the BSTs on their second attempt. Because of small numbers of students for whom these data are available we do not have good data to answer the question of how many NELB students from each language group passed the test after failing once. However, among the groups with more reliable information, 24% of Spanish students and 23% of “other languages” students passed the second reading test. Hmong students had the lowest percentage passing the second reading test, at 9%. For math, the highest percentages of those passing was “other languages” (17%) and Hmong (11%).
Table 12. Students Passing Reading and Math BSTs on the Second Attempt
|
N
Taking |
N
Passing |
%
Passing |
|
Hmong |
Reading |
54 |
5 |
9% |
Math |
58 |
6 |
11% |
|
Laotian |
Reading |
12 |
3 |
25% |
Math |
8 |
1 |
13% |
|
Spanish |
Reading |
17 |
4 |
24% |
Math |
13 |
1 |
8% |
|
Somali |
Reading |
3 |
1 |
33% |
Math |
3 |
0 |
0% |
|
Other |
Reading |
26 |
6 |
23% |
Math |
23 |
4 |
17% |
|
*
Percentages
have been rounded
ESL Bilingual Services and BST Performance
Table 13 shows the BST performance of NELB students who received ESL or bilingual services or did not receive services, during the year of testing. Students receiving services scored lower in reading and in math compared to those students not receiving services. This is not unexpected given the fact that students receiving services are learning the English language as well as content areas in school. Both students receiving services and those not receiving services scored slightly lower in reading than math across the years of testing.
Table 13. Median Percent Correct of NELB Students Receiving ESL Services
|
ESL
Services |
No
ESL Services |
|||
Median
% Correct |
Valid
N |
Median
% Correct |
Valid
N |
||
Reading |
1996 |
30% |
24 |
63% |
21 |
1997 |
40% |
44 |
64% |
28 |
|
1998 |
45% |
171 |
70% |
34 |
|
Math |
1996 |
41% |
24 |
65% |
23 |
1997 |
43% |
44 |
75% |
27 |
|
1998 |
49% |
173 |
76% |
37 |
|
Tables 14 and 15 show the percentages of NELB students passing the BSTs by whether they were receiving services. As reflected in the tables, students receiving services had lower numbers of students passing in reading and in math compared to students not receiving services. Among the students receiving services, the difference between the total numbers passing for reading and math was not great. For students not receiving services, the difference in numbers passing reading and math was also not great. However, for both groups the actual numbers of students passing the BSTs increased from 1996 to 1998.
Table 14. Reading Test Passing Rates of Students Receiving ESL Services
|
Pass |
Not
Pass |
|||
No. |
% |
No. |
% |
||
1996 |
Service
(n=24) |
0 |
0.0% |
24 |
100.0% |
No
Service (n=21) |
9 |
42.9% |
12 |
57.1% |
|
1997 |
Service
(n=44) |
0 |
0.0% |
44 |
100.0% |
No
Service (n=28) |
6 |
21.4% |
22 |
78.6% |
|
1998 |
Service
(n=171) |
20 |
11.7% |
151 |
88.3% |
No
Service (n=34) |
16 |
47.1% |
18 |
52.9% |
|
Table 15. Math Test Passing Rates of Students Receiving ESL Services
|
Pass |
Not
Pass |
|||
No. |
% |
No. |
% |
||
1996 |
Service
(n=24) |
1 |
4.2% |
23 |
95.8% |
No
Service (n=21) |
6 |
26.1% |
17 |
73.9% |
|
1997 |
Service
(n=44) |
1 |
2.3% |
43 |
97.7% |
No
Service (n=28) |
15 |
55.6% |
12 |
44.4% |
|
1998 |
Service
(n=171) |
27 |
15.6% |
146 |
84.4% |
No
Service (n=34) |
19 |
51.4% |
18 |
48.6% |
|
NRT and Language Proficiency Tests and BST Performance
The districts in the study used two different English language
proficiency tests. One used the LAS (Language Assessment Scale) oral proficiency measure
in combination with the reading test if the oral score was high enough. The other used the
Woodcock Language Proficiency Battery sub-tests. We found a relationship only between the
Broad English cluster (WBR) sub-test and the BSTs. Scores from the LAS oral test, Woodcock
Broad English cluster, and results from four Norm Referenced Tests (NRT) were correlated
to student performance on the BSTs. Scores from
four NRTs were combined to maximize the sample size. The most commonly used NRT was the
California Achievement Test (85%), followed by the Iowa Test of Basic Skills (14%). Only
NRT test scores occurring within two years of the BST administration were included in the
analysis. Also, almost all the proficiency tests included in this analysis sample were
administered within two years of BSTs. Keeping the sample to within two years of the BSTs
was to control for the effect of time between the proficiency and norm referenced tests
and the BSTs.
Correlations between scores on the BSTs and the language
proficiency measures are shown in Table 16. The Woodcock Broad English test had the
highest correlation with reading and math BST performance.
Table 16. Correlation Between Achievement on BSTs and Other Tests
Other
Tests
|
Reading
BST
|
Math
BST
|
||
Pearson
Correlation |
N
taking these tests |
Pearson
Correlation |
N
taking these tests |
|
LAS
Oral Test
|
0.561 |
90 |
0.419 |
93 |
Woodcock-
Broad English |
0.728 |
60 |
0.755 |
60 |
NRT
Reading |
0.652 |
212 |
0.598 |
210 |
NRT
Math |
0.377 |
184 |
0.485 |
182 |
The relationships are represented graphically in Figures 3 to 6.
The WBR test correlated more strongly with both reading and math BSTs than did the other
two types of tests (LAS and NRTs). With the exception of a few outlying scores, there was
a strong relationship between WBR scores and BST scores.
Figure 3. WBR with BST Reading
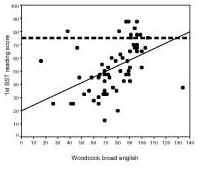
Figure 4. WBR with BST Math
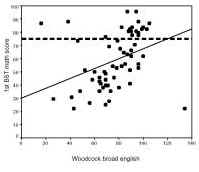
Figure 5. NRT with BST Reading
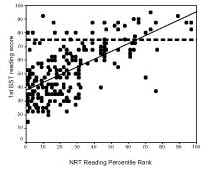
Figure 6. NRT with BST Math
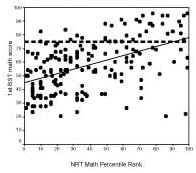
NRT math scores did not correlate strongly with the Math BST.
Almost all students passing the BST math test scored above the 50th percentile on an NRT math test. However, students scoring above
the 70th percentile on an NRT math test were equally as likely to fail
the BST math test as to pass it. Therefore, there is no NRT score at or above which one
can be confident that the student will pass the BST math test. Although NRT reading
comprehension scores were moderately correlated with BST reading scores, the spread of
scores on the NRTs for students passing the BST was very broad (1st percentile to the 98th percentile). In order to be confident (above a 50/50 chance)
that a student will pass the BST reading test, the student must score above the 75th percentile on an NRT reading comprehension test.
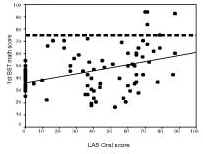
The LAS and BST Performance
Predicting whether a student will pass the BST based on recent
oral LAS scores is limited by two factors: (1) Most students in this sample for whom we
have LAS scores did not pass the BST. Only three students taking the LAS within three
years of the BST passed the reading test, and five passed the math test. (2) Students with
high scores (above 60) on the LAS were equally as likely to score poorly on the BST as
they were to pass the BST. Students with high LAS scores (above 60) were evenly
distributed between scores of 20 and 80 on the BST.
The relationship between LAS scores and BST scores are shown graphically in Figures 7 and 8. It is evident from these figures that the relationship between scores from the two types of measures is low.
Figure 7. LAS with BST Reading
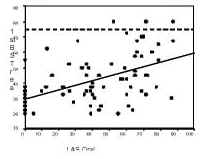
Figure 8. LAS with BST Math
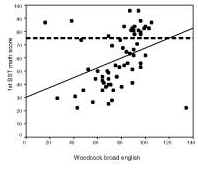
Woodcock Broad English Test and BST Performance
One cannot predict with any certainty from a particular WBR score
that a student will pass the BSTs. All but two students passing the reading BST the first
time scored above 80 on the WBR. However, nearly one-half of the students scoring above 80
on the WBR did not pass the BST. It is generally the same for math as for reading, as
shown in Figures 9 and 10.
Figure 9. WBR with BST Reading
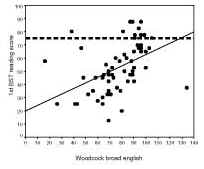
Figure 10. WBR with BST Math
Research on LEP student participation and performance in
large-scale assessments tends to treat all LEP students as one group with the same needs
(Lucas, 1997). Also, research does not address the needs of specific groups of NELB
students who may be classified as LEP but who may or may not be receiving ESL services.
Examining the needs of specific subgroups is important for school improvement efforts that
incorporate test data. In-depth record reviews are a viable approach for schools to
undertake to better understand the educational needs of specific groups of students and to
address their needs through programs and instruction. However, school personnel must first
make concerted efforts to improve data collection and data keeping. This study highlights
the issues educators and researchers need to consider when using data found in school
records.
Students in our record review sample were predominantly those in
grades 8, 9 and 10, most of whom received free or reduced lunch supports, those who
primarily have moved fewer than three times after coming to the U.S., and who have a
variety of home languages, but particularly Hmong and Spanish. The data are not limited to
students who have been in a district a certain number of years. Similarly, they are not
limited to students who have been in the U.S. or in U.S. schools a specific number of
years.
Findings from this study that may have implications for NELB and
LEP students in general fall into three areas. First, there is a fairly strong negative
correlation between the number of school changes and BST performance. It is possible that
there may be a general negative correlation between school changes and test scores
(Kerbow, 1996) or number of absences (Cota, 1997). Extra instructional efforts may need to
be directed toward those students who have frequently changed schools, especially those
with more than three school changes. It is possible that these students are missing out on
test taking strategies as well as content, so both might need to be a focus of
instruction. We acknowledge the difficulty of targeting these extra instructional efforts
to a population that may not remain in one place for very long, and recommend future study
in the area of best practices in assessment preparation for these students.
Second, there was a strong correlation between years in U.S.
schools and BST performance. Thus, the performance of LEP students does improve with
increased time in the U.S. Students’ improved performance with more language
instruction was also shown in a California study (Cota, 1997).
Third, there are interesting relationships between language
proficiency measures and BST performance. We found that initial performance on language
proficiency tests, which are typically given to new students for evaluation purposes and
ESL placement, did not correlate with later performance on the BSTs. In fact, we found
that virtually all students who were given a language proficiency test within three years
of taking the BST did NOT pass the BST during the years of the study. One plausible
conclusion would be that LEP students who have had ESL/bilingual services fewer than three
years are going to need more than three years to pass the BSTs.
While data for one of the districts indicated that about half of
the students who earned a score above 55% correct on their first BST reading passed the
second time they took the test, no such relationship was found for math for the students
in this study. And, the relationship for reading is not strong. Students who performed
among the lowest the first time tested sometimes passed the second time. And, not all
students who scored very close to passing the first time tested passed the second time.
These data suggest that it is probably an unwise strategy to focus instructional efforts
more on those whose scores appeared to be closest to passing. Rather, devoting efforts
equally remains the best strategy for improving performance. However, these results are
from a district level analysis. Examination of performance from first to subsequent
attempts for statewide BST takers may be different.
Addressing the differences among language groups in our study is
limited by incomplete data. For this reason, many analyses do not allow us to say much
about Somali and Laotian speaking students even though the actual numbers of students
enrolled in study sites may be larger than represented here. There were few large
differences among groups in performance, either for first time testing or for re-testing,
when the Somali and Laotian language groups were not considered.
Of the more significant outcomes of this study is a recognition
of the importance of clear, organized, data management for LEP students. It is often
assumed that students’ information is complete and accessible within schools or
districts, but this is not always the case. A problem in the course of this study clearly
was the lack of data. Collecting information for this study required a combination of
sources, which still resulted in gaps of information, and in some cases conflicting
information. A better record keeping system at the school level in cooperation with
district data management seems to be an essential step toward better understanding the
needs of LEP students and possible ways to address them.
August, D., Hakuta, K., Olguin, F., & Pompa, D. (1995).
Evaluating the inclusion of LEP students in systemic reform. In Issues and strategies in evaluating systemic reform. Papers
prepared for the U.S. Department of Education, Office of the Under Secretary, Planning and
Evaluation Service.
Cota, I. (1997). The role of previous educational learning
experiences on current academic performance and second language proficiency of
intermediate school limited English proficient students. Bilingual Research Journal, 21:2 & 3, Spring
and Summer.
Kerbow, D. (1996). Patterns
of urban student mobility and local school reform: A technical report [On-line].
CRESPAR, Center for Research on the Education of Students Placed at Risk: Report # 5.
Program 7 Systemic and Policy-Related Studies, Johns Hopkins University and Howard
University. Available: http://www.csos.jhu.edu/crespar/Reports/report05entire.html.
Liu, K., Thurlow, M., Thompson, S., & Albus, D. (1999). Participation and performance of students from
non-English language backgrounds: Minnesota’s 1996 Basic Standards Tests in reading
and math. Minneapolis: University of Minnesota, National Center on Educational
Outcomes.
Liu, K., & Thurlow, M. (2000) Linking student and programmatic characteristics to
test performance: Issues & solutions. Manuscript in preparation.
Lucas, T. (1997). Into,
through and beyond secondary school: Critical transitions for immigrant youths.
McHenry, IL: Delta Systems, Co., Inc.
National Center for Education Statistics. (1996). Proceedings of the conference on inclusion
guidelines and accommodations for LEP students in the NAEP: December 5-6 1994 (NCES
96-86[1]). Washington, DC: U.S. Department of Education, Office of Educational Research
and Improvement.