Kate Nagle, Charity Funfe Tatah Mentan, Anthea Brady, Kathy Strunk, Martha L. Thurlow, and Sheryl S. Lazarus
A publication of:
NATIONAL CENTER ON EDUCATIONAL OUTCOMES
In collaboration with
NCEO’s 2019 1.0% Peer Learning Group (PLG 3)
The Center is supported through a Cooperative Agreement (#H326G160001) with the Research to Practice Division, Office of Special Education Programs, U.S. Department of Education. The Center is affiliated with the Institute on Community Integration at the College of Education and Human Development, University of Minnesota. The contents of this report were developed under the Cooperative Agreement from the U.S. Department of Education, but does not necessarily represent the policy or opinions of the U.S. Department of Education or Offices within it. Readers should not assume endorsement by the federal government.
Project Officer: David Egnor
All rights reserved. Any or all portions of this document may be reproduced and distributed without prior permission, provided the source is cited as:
Nagle, K., Mentan, C.F.T., Brady, A., Strunk, K., Thurlow, M. L., & Lazarus, S. S. (2020). Start with the end in mind: An infographic to guide decisions about student participation in the alternate assessment. National Center on Educational Outcomes.
Acknowledgments
This Infographic resource was developed through the work of Peer Learning Group (PLG) 3, “Building Capacity of IEP Teams and Parents in Making Decisions about Assessment Participation,” which took place from October-December, 2019.
In addition to the authors of this document, it took a team to ensure that PLG 3 was successful. Members of this team included, in addition to the authors (in alphabetical order): Sharon Hall, Maureen Hawes, Susan Hayes, Judy Lee, Travis Peterson, and Tanner Petry.
Staff from 45 states and the District of Columbia participated in the PLG 3 webinar calls. The participating states are listed here. This Guide would not exist had it not been for their active participation in PLG 3.
| Alabama Alaska Arizona Arkansas California Colorado Connecticut Delaware District of Columbia Florida Georgia Hawaii Illinois Indiana Iowa Kansas Kentucky Louisiana Maine Maryland Massachusetts Minnesota Mississippi |
Missouri Montana Nebraska Nevada New Jersey New Mexico New York North Carolina North Dakota Ohio Oregon Pennsylvania South Carolina South Dakota Tennessee Texas Utah Vermont Virginia Washington West Virginia Wisconsin Wyoming |
The 2015 reauthorization of the Elementary and Secondary Education Act, known as the Every Student Succeeds Act (ESSA), includes a 1.0% cap on state-level participation rates in the alternate assessment aligned to alternate academic achievement standards (AA-AAAS). No limit was placed on district or school rates, but districts must provide justifications if they expect their rate to be above the 1.0% threshold. In addition, states are to provide oversight to districts. Furthermore, states and districts are to ensure that parents and guardians understand the implications of their child’s participation in the AA-AAAS.
These requirements mean that states, districts, schools, and Individualized Education Program (IEP) teams need to think carefully about which students should be included in the AA-AAAS. Because parents need to understand the implications of their child participating in the AA-AAAS and educators need to be able to clearly communicate this information to parents, this infographic tool is presented in a concise and straightforward manner.
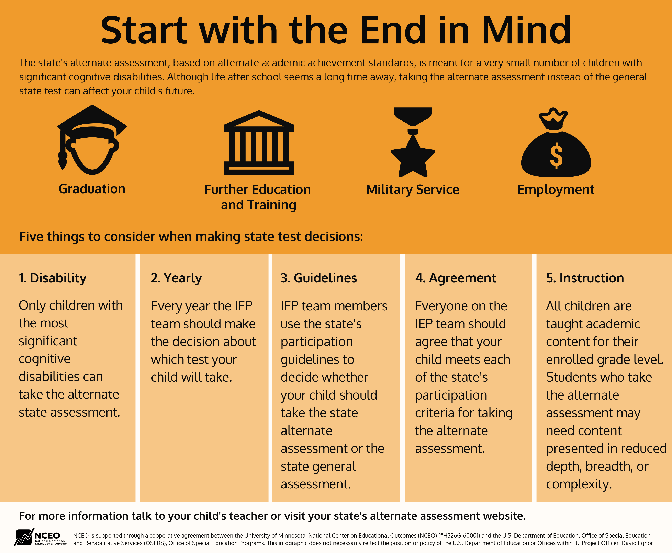
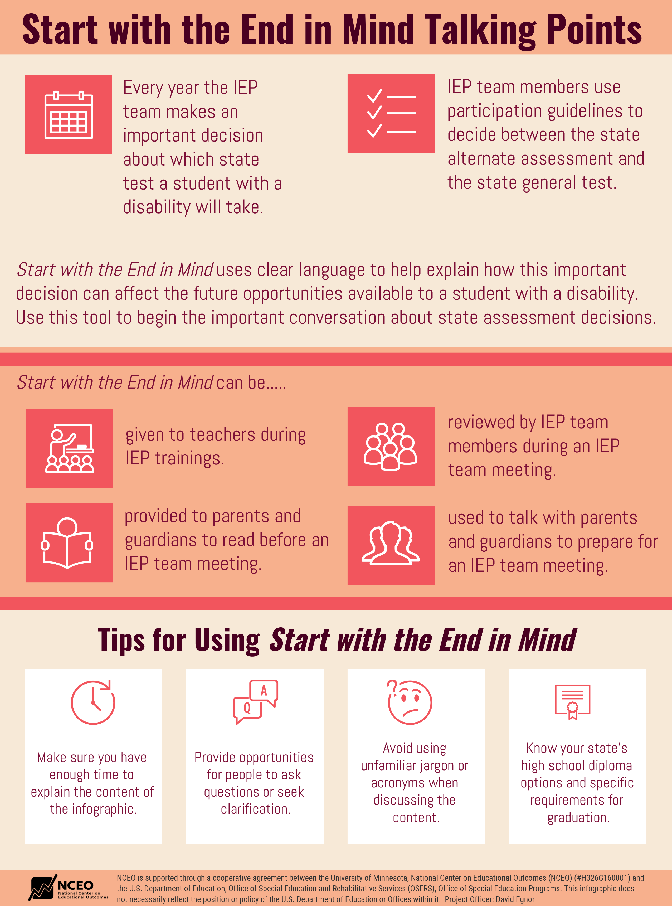
This infographic is designed to provide guidance about decision making for a student’s participation in the state’s AA-AAAS, which is meant for a very small number of students with significant cognitive disabilities. Start with the End in Mind uses clear language to help explain how this important decision can affect the future opportunities available to a child with a disability. It may be given to teachers in IEP trainings, provided to parents and guardians to read before an IEP team meeting, reviewed by an IEP team during an IEP team meeting, and used to talk with parents and guardians to prepare for an IEP team meeting.
The infographic may be used as it is currently portrayed, or it may be used as a model for development of an infographic that is customized to meet the specific needs of a state, district, or school. The infographic is one of three tools developed by states and technical assistance centers working together in NCEO’s 2019 1.0% Peer Learning Group 3. The two other tools that were developed can support the information presented here (tools may be found at: https://nceo.info/Resources/tools). They include:

