Uneven Transparency: NCLB Tests Take Precedence in Public Assessment
Reporting for Students with Disabilities
It has been more than a decade since researchers
first realized the importance of including all students in statewide tests
(McGrew, Thurlow, Shriner, & Spiegel, 1992; Zlatos, 1994). Since that time, much
has changed with regard to accountability at the state, district, and school
levels. Where schools once were required to base progress of students with
disabilities only on individualized goals and accountability focused on school
compliance with federal procedures, accountability now is driven by student
performance on statewide tests (McLaughlin & Thurlow, 2003). Public reporting of
state assessment participation and performance information has been tracked by
the National Center on Educational Outcomes (NCEO) since 1997.
At the same time that researchers were recognizing that students with
disabilities needed to be included in statewide assessments, legislation to
require public reporting was moving in this direction as well. In 1994, the
Elementary and Secondary Education Act (ESEA) required that students with
disabilities be considered part of “all students” and thus be included in
statewide tests and then measured against state standards. In 1997, the
Individuals with Disabilities Education Act (IDEA) first required that states
ensure that all students with disabilities participate in all state and district
assessments. In 2001, ESEA was reauthorized as the No Child Left Behind Act
(NCLB), which proposed specific guidelines for the participation of students and
subgroups in statewide tests and also required states to publicly report student
participation and performance for accountability (Fast, Blank, Potts, &
Williams, 2002). The purpose of this was to ensure that all students achieve
proficiency by 2013–2014. This was followed most recently by the reauthorization
of IDEA (2004) as the Individuals with Disabilities Education Improvement Act.
It required that states ensure that all students with disabilities “are included
in all general State and districtwide assessment programs, including assessments
described in section 1111 of the ESEA, 20 U.S.C. 6311, with appropriate
accommodations and alternate assessments, if necessary, and as indicated in
their respective IEPs.” As in IDEA 1997, IDEA 2004 requires that:
The State educational agency (or, in the case of a districtwide assessment,
the Local educational agency) makes available to the public, and reports to
the public with the same frequency and in the same detail as it reports on
the assessment of nondisabled children, the following:
(i) The number of children with disabilities participating in regular
assessments, and the number of those children who were provided
accommodations in order to participate in those assessments.
(ii) The number of children with disabilities participating in alternate
assessments described in subparagraph (C)(ii)(I).
(iii) The number of children with disabilities participating in alternate
assessments described in subparagraph (C)(ii)(II). (Section 612(a)(16)(D))
Since NCLB was passed, there has been an increase in the number and type of
reports that states provide to the public. When comparing the 2000–2001 school
year to 2001–2002 school year, the number of states that publicly reported
participation and performance data increased from 28 to 35 (Thurlow & Wiley,
2004; Thurlow, Wiley, & Bielinski, 2003). In 2002–2003, this number further
increased to 36 states (Wiley, Thurlow, & Klein, 2005). The number of states
that reported participation and performance information for their alternate
assessment has also shown increases. More specifically, 22 states reported this
information in 2001–2002 while 29 reported it in 2002–2003 (Thurlow & Wiley,
2004; Wiley et al., 2005).
Some writers have suggested that most states are able to demonstrate performance
improvements in all subgroups, except for students who are learning English and
students with disabilities (Schwartzbeck, 2003). Because of this perception, as
well as the NCLB requirement, it is crucial that we continue to follow the
methods of publicly reporting information on students with disabilities.
The 2003–2004 school year is the second year that states are required to report
on the performance of students with disabilities on their state math and reading
assessments based on state standards. This report marks the eighth in a line of
NCEO reports that document state public reporting policies. In addition, this
report is the first to include the unique states (i.e., American Samoa, Bureau
of Indian Affairs, Commonwealth of Marianna Islands, District of Columbia, Guam,
Palau, Puerto Rico, Republic of the Marshall Islands, Micronesia, Virgin
Islands). Additionally, the 2003–2004 school year may be when some states have
had time to revise their tests and accountability systems to be more in line
with the tenets of NCLB. This report will seek to illuminate these changes as
well as discuss the common ways in which states are reporting these results to
the public.
Method
We began our search for information by reviewing every state’s Department of
Education Web site as well as the Web sites for the 10 unique states (i.e.,
American Samoa, Bureau of Indian Affairs, Commonwealth of Marianna Islands,
District of Columbia, Guam, Palau, Puerto Rico, Republic of the Marshall
Islands, Micronesia, Virgin Islands). We began collecting data in September 2004
and collected information for the 2003–2004 school year. We recorded the names
of the assessments that were administered and documented whether participation
and performance information was reported for students with disabilities. We also
examined the way in which participation was reported and whether participation
and performance information were reported for students who took the test with
accommodations. By September 2004, a large percentage of the states had already
posted their 2003–2004 assessment data online in a way that made the data easy
to locate and understand.
On February 4, 2005, we mailed a letter to each state director of assessment
outlining our findings from the state’s Web site (Appendix A). We asked them to
review our findings, correct any misinformation, and provide the public document
or Web site where the correct information was available. We asked that they send
us these changes by February 28, 2005. Many states directed us to a Web page
that we had not found in our search. While a few sent paper copies of
information, we were able to find this information on state Web sites as well.
Several states gave us dates by which they expected their disaggregated
assessment results to be posted. Overall, we received responses from 42
directors of assessment.
To ensure that our findings were as accurate as possible, we followed up these
efforts with a letter to each state’s director of special education (Appendix
B). These letters were mailed on May 12, 2005. The letters asked the directors
to review our findings and make any changes by June 9, 2005. For states that had
already provided a response from the director of assessment, we noted that in
the letter by stating that “these results were verified by your state’s director
of assessment, but if you have anything to add, please let us know.” For states
whose director of assessment did not respond, we sent the same letter to the
director of special education as we had sent to the director of assessment. In a
few cases where we had been able to verify some of the information sent to us by
the director of assessment, we sent a personalized letter documenting what
information we still needed. These letters were sent out to the directors of
special education on June 2, 2005, and changes were due back by June 17, 2005.
Of the 50 states and 10 unique states to which we sent letters, 27 responded
with either corrections or to verify that the information that we had was
correct.
Finally, there were still four states for which we had not heard back from
either the director of assessment or the director of special education. For
three of these states we had found information on students with disabilities for
all their regular and alternate assessments. For the other state, results were
reported annually at the district level, but not the state level.
It should be noted that in three cases, personnel indicated that information was
publicly available on request. When this occurred, we attempted to obtain this
information. In cases where substantial effort was extended to obtain
participation or performance data, but we could not obtain the document, the
information was not considered publicly reported.
Characteristics of State Assessment Systems
Appendix C lists all the state mandated general assessments that we identified
for the 50 states and the 10 unique states. This list includes the state, the
name of the test, the grades and content areas tested, and whether the state had
publicly available disaggregated participation and performance data for students
with disabilities for their 2003–2004 state assessments. For the 50 states, we
identified 112 separate statewide tests. Thirty–five states had more than one
general assessment. For the unique states, six separate assessment systems were
found and no state gave more than one assessment.
Because very little information was available from the unique states, the
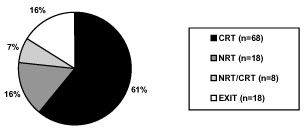
following results include only information from the 50 states. Figure 1 breaks
down the 112 testing systems by type: norm-referenced tests (NRT),
criterion-referenced tests (CRT), exit tests used as a gate for graduation or
earning a particular type of diploma (EXIT), and tests that combined
standardized NRTs with additional state-developed test items (NRT/CRT). While we
recognized that many exit exams may also be NRTs, CRTs, or both, the high stakes
consequences for students of these exit exams indicated a need to create a
separate category for these tests.
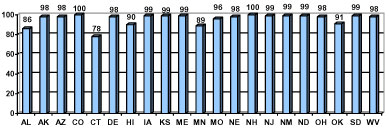
To summarize participation rate information, we selected one grade to portray in
Figure 8. In most states, participation in the middle school/junior high school
math test was used. If the state tested in more than one grade in the middle
school level, the 8th grade test data were used. Appendix E contains information
about the tests and exact grades used for Figure 8. Percentages in the figure
are rounded to the nearest whole number. Not all states provided data broken
down in this way. In nine states (i.e., Illinois, Kentucky, Massachusetts,
Michigan, New York, North Carolina, Rhode Island, Virginia and Wisconsin), the
data were given for the math test but the grade levels were all aggregated. In
California, a rate was provided but it was number of students with disabilities
tested out of all students rather than a percent of students with disabilities
who were tested. In Idaho, a percent of participation was given for the
elementary reading assessment that was not included in this analysis. It is
important to note that results in Figure 8 were obtained from different types of
tests that were being used in these states. Nevertheless, during this 2003–2004
academic year, participation rates ranged from 78% to 100% and 16 out of the 21
states had participation rates of 95% or higher.
Alternate Assessment Participation Results
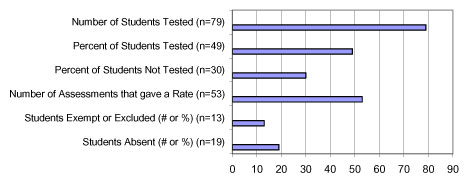
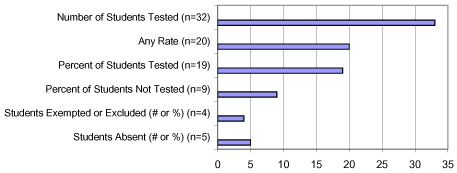
Figure 9 illustrates how states reported participation for their alternate
assessment. Much greater participation information was provided this year
(2003–2004) compared to the previous testing year. Appendix F outlines in more
detail all the ways that information is reported. Thirty-five states provided
participation information for their alternate assessments. All states provided
information on just one alternate assessment except for North Carolina which
provided information on two alternate assessments. For Figure 9, North Carolina
is reflected as one state and all of the ways that participation data were
reported in the two alternates were counted.
Similar to reporting for the
regular assessment, the most common way of reporting participation information
for the alternate assessment was to give the number of students tested. This was
done by 32 states; 20 states gave a rate, which was either the percent of
students tested, not tested, or both. Four states provided the number or percent
of students who were exempt or excluded, and five states provided either the
number or percent of students who were absent.
Figure 9. Participation Reporting Approaches for Alternate
Assessments (Number of States = 32)
Twenty states provided a rate of either the percent of students tested or the
percent not assessed in their alternate assessments. These rates are shown in
Figures 10, 11, and 12. Appendix G provides more details about the grades and
content areas included in the figures. When possible, we tried to use rates from
8th grade math. We divided this information into three figures because there
were three different ways in which participation data were presented by states.
Six states gave the percent of students assessed out of the total number who
were eligible/recommended to take the alternate assessment (Figure 10). North
Carolina administered two alternate assessments (NC-1 indicates the AAAI and
NC-2 indicates the Portfolio Assessment), and both of these are shown in Figure
10.
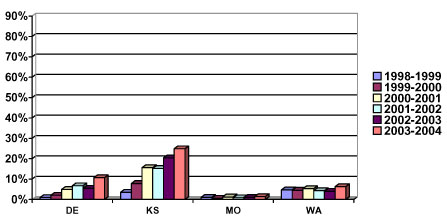
Eight states provided information on the percent of students assessed on the
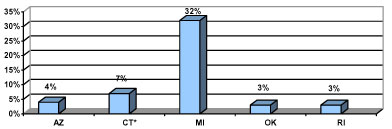
alternate assessment out of all the students enrolled (see Figure 11). Finally,
five states provided information about the number of students who participated
in the alternate assessment out of all students with disabilities (see Figure
12). Three states (Iowa, Illinois, Wisconsin) included alternate assessment
participation with other general assessments. Because these percentages also
reflect the participation of students with disabilities in the general
assessments, they are not included here.
Figure 10. Percentages of Students with Disabilities Assessed
with the Alternate Assessment Out of the Total Number of Students
Recommended/Eligible for the Alternate Assessment
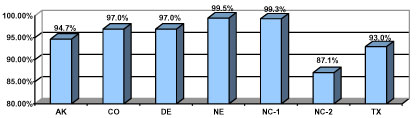
Figure 11. Percentages of Students with Disabilities Assessed
with the Alternate Assessment Out of the Total Number of Enrolled Students
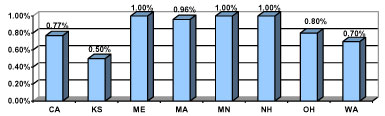
Figure 12. Percentages of Students with Disabilities Assessed
with the Alternate Assessment Out of the Total Number of Students with
Disabilities
Other Information Collected for 2003–2004
In our analysis of state reporting for 2003–2004, we looked at additional
characteristics of states’ publicly reported information. Specifically, we
looked at information available on accommodations used, and if available,
performance when accommodations were used. We also examined the quality of
Web-based reporting.
Accommodations
Sixteen states provided state-level information about students who took an
assessment with an accommodation. In some cases, states reported on standard
accommodations (those considered to not change the constructs measured by the
assessment), in other cases they reported on nonstandard accommodations (which
generally were considered to change the constructs measured—and might be
referred to as “non-allowed”—although IEP teams could select them), and in other
cases they reported on both or did not specify which.
Table 2 describes the information the 16 states provided. Appendix H contains
additional information about the data provided by these states, with details
about the participation and performance of students in each category that the
state provided. New Mexico indicated that accommodation results are available on
request. Four states reported student participation and performance by specific
accommodation (e.g., directions read orally, braille, extended time), whereas
twelve states provided only overall information on students who, in general,
used accommodations.
Table
2. States that Reported State-Level Information about Accommodations for Reading
or Math
|
State |
Standard/Non-standard
Accommodation |
Participation |
Performance |
For whom |
|
Arizona |
Standard and Non-Standard |
Yes |
No |
SWD
|
|
Colorado* |
Standard
|
Yes |
Yes |
ALL
|
Non-Standard
|
Yes |
No |
ALL
|
|
Iowa |
Non-Standard
|
Yes |
No |
SWD
|
|
Indiana |
Standard
|
Yes |
Yes |
SWD
& ALL
|
|
Kansas |
Not specified |
Yes |
No |
SWD
&
ALL
|
|
Kentucky |
Standard |
Yes |
Yes |
SWD
|
|
Louisiana* |
Standard |
Yes |
Yes |
ALL |
|
Maine |
Not Specified
|
Yes |
No |
SWD
|
|
Michigan |
Standard & Non-Standard
|
Yes |
Yes |
ALL
|
|
Missouri* |
Not Specified
|
Yes |
Yes |
SWD
|
|
Nebraska |
|
Yes |
No |
SWD & ALL |
|
North Carolina* |
Standard & Non-Standard |
Yes |
Yes |
ALL
|
|
Ohio |
Standard |
Yes |
Yes |
SWD
& ALL
|
|
Oklahoma |
Non-Standard |
Yes |
No |
SWD
|
|
Rhode Island |
Non-Standard |
Yes |
No |
SWD
|
|
Wyoming |
Standard & Non-Standard |
Yes |
No |
SWD
|
Note: SWD=
Students with Disabilities
* Report by specific
accommodation.
** For New Mexico, information can be requested.
Quality Analysis of Web-based Reporting
As we analyzed the participation and performance reporting on states’ Department
of Education Web sites, it became evident that some states presented data in a
much more accessible format than others. Because assessment data are reported on
the Web in most states, it is crucial that these data be clear and easy to
access. We examined the quality of the states’ reporting on their Web sites. It
is important to note, however, that because Web sites are frequently updated, it
is possible that some of our findings no longer hold true.
Several states (e.g., California, Connecticut, Washington, and Wisconsin) used
drop down menus that allowed an individual to select the test, year, grade, and
status of students of interest. The Web site then displayed a chart of the data
scores in question. In some cases, these charts were relatively easy to
understand and provided a way of assessing how the test was scored and what
percentage of students attained satisfactory scores. Other states provided the
percentage of students attaining a given score, but it was not clear which set
of scores constituted satisfactory completion of the test (e.g., New York for
the Regents Competency Test). Several states had written summaries of their
state’s test results (e.g., Colorado, Massachusetts, Ohio, and Oklahoma). Others
had PowerPoint slides that contained some of the participation and performance
information (e.g., Oklahoma). In several cases, states directed us to the
state’s Annual Performance Report (APR). This report provides information on a
variety of aspects of how states serve students with disabilities, including
some of the information addressed in this report (e.g., participation and
performance of students on general and alternate assessments, the use of
accommodations).
Assessment Performance in 2003–2004
General Assessment Performance Results
We examined the performance of all students, and then the performance of
students with disabilities. When examining performance across states, it is
important to remember that state tests are different, both in terms of content
and proficiency levels. The tests may emphasize different standards and are
likely to differ in difficulty. In addition, there may be variability across
states in the percentages of students with disabilities whose scores are
reported. Thus, it is not appropriate to compare performance across states. It
is possible, however, to examine the performance differences within each state
between all students and students with disabilities.
Performance results are reported for both reading and math assessments because
these content domains are the ones assessed by most states and are the content
areas required first by NCLB to be assessed, reported, and included in
accountability. For greater comparability in what we report, and because states
are now moving away from norm-referenced tests toward wider use of
criterion-referenced tests, we only report performance on CRTs. We also report
performance on exit exams that students are required to pass to graduate from
high school with a standard diploma.
We separated grade levels into three categories: elementary (3–5), middle school
(6–8), and high school (9–12). For our summary, we chose to present only one
grade for each level. When available, 4th grade was used to represent the
elementary level, 8th grade to represent the middle school level, and 10th grade
to represent the high school level. These grades were chosen because they are
the grades at which the greatest number of states test students. If data from
those grades were not available, the grade below was used, followed by the
remaining grade if no other data were available. The number in the parenthesis
next to the state’s name indicates the grade from which the data were obtained.
Appendix I reports the name of the test we used and the grade.
Although most states reported the performance of all students and then the
performance of subgroups, such as students with disabilities, some states did
not report the performance of all students. When these data were not available,
the performance of general education students was given. Because the performance
of general education students as a group may be slightly higher than the
performance of all students as a group, we have indicated those states with “all
students” actually based only on general education students by an asterisk after
the name of the state.
It should further be noted that one state (Vermont) only provided subtest scores
on its assessments. In this case, subtest scores for reading skills and math
basic understanding are reported. States were dropped if they only reported
aggregated scores across grades. Thus, Rhode Island is not reflected in any of
the figures because it provided only aggregated data across grades for its
students with disabilities. Additionally, some states aggregated across a
particular group of grades. For example, West Virginia aggregates across the
elementary, middle, and high school grades. These scores are included but
identified by using “EL” for elementary aggregation, “MS” for aggregation across
the middle school grades, and “HS” for aggregation across high school.
Reading Performance
Figures 13–15 present the reading performance of students. The performance of
students with disabilities in reading is generally much lower than the
performance of all students. There are a few instances where the percentage of
students with disabilities scoring proficient was higher than the percentage of
all students scoring proficient. Both Arizona and Georgia reported higher rates
of proficient elementary students with disabilities in reading compared to all
students.
The gaps in performance are variable, with few evident patterns. Gaps between
students with disabilities and general education students increased with grade
level.
Figure 13. Elementary School Reading Performance on
Criterion-Referenced Tests
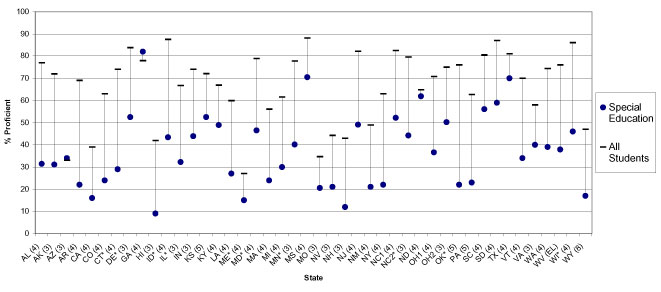
Figure 14. Middle School Reading Performance on
Criterion-Referenced Tests
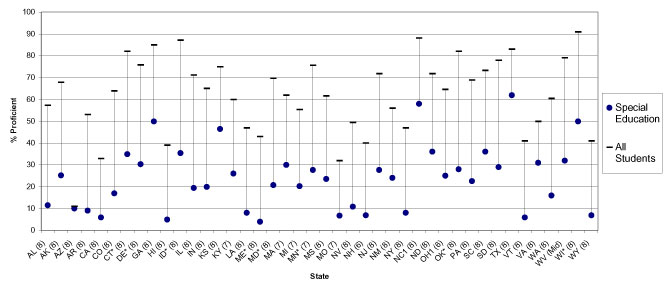
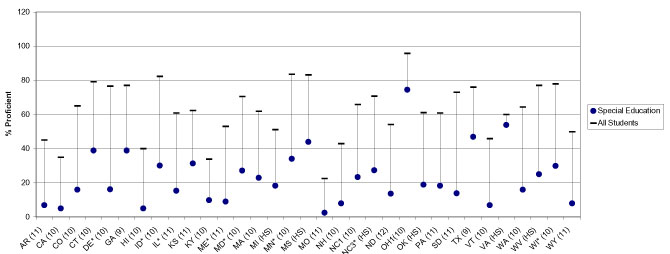
Figure 15. High School Reading Performance on
Criterion-Referenced Test
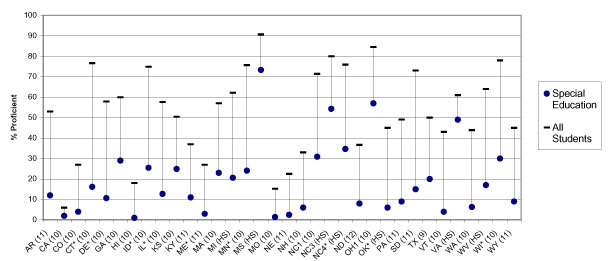
Mathematics Performance
Performance of all students and students with disabilities on states’ 2003–2004
mathematics assessments is shown in Figures 16–18. The figures cover elementary,
middle, and high school. The same cautions apply to these figures as applied to
the reading figures.
As shown in Figures 16–18, the gap between students with disabilities and all
students on math assessments is quite similar to the gap found for reading
assessments. The gap for math assessments exists in all states and varies
considerably from state to state. Generally, the gap increases by grade level.
Students with disabilities typically perform lower when compared to either
regular education or all students. However, there are a few instances where this
is not the case. At the elementary level, there are two instances where a higher
percentage of students with disabilities achieved proficiency when compared to
all students at that grade level (Georgia and Virginia).
Figure 16. Elementary School Mathematics Performance on
Criterion-Referenced Tests
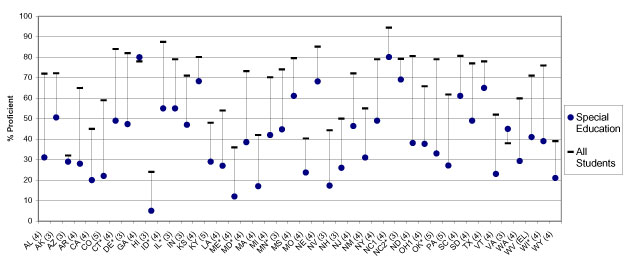
Figure 17. Middle School Mathematics Performance on
Criterion-Referenced Tests
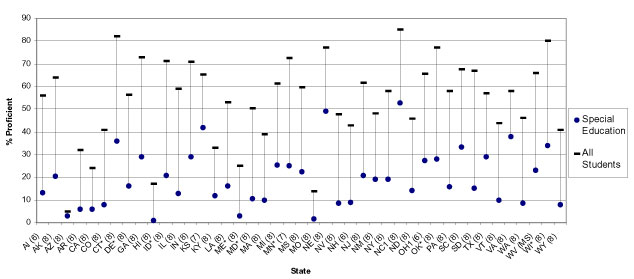
Figure 18: High School Mathematics Performance on
Criterion-Referenced Tests
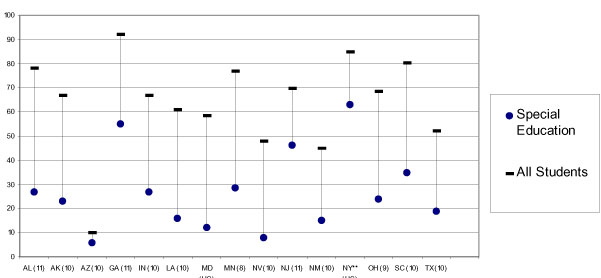
Figures 19 and 20 show the results of high school reading and math exit exams.
States administer exit exams in different grades. The number in the parenthesis
next to the state’s name indicates the grade from which the data come. If the
exit exam incorporates multiple high school grades, this is indicated by “HS.”
Only those states that report disaggregated results for students with
disabilities are included in these figures. These results reflect only the first
administration of the exit exam. States offer multiple retest opportunities for
their exit exams, and the percent passing increases with each retest. Often the
gaps between general and special education students become very small on
retesting. New York offers two exit exams: the Regent’s Comprehensive Exam and
the Regent’s Competency Test. The Regent’s Competency Test is a “safe harbor”
assessment implemented only for students with disabilities and those who
received special education services in previous years. However, New York
provides a percentage of students who passed both tests. This percentage is
presented in Figures 19 and 20.
The figures presented here for first administration show that large gaps exist
for exit exams, though the percent of students passing the exit exams varies
widely by state. The data have to be viewed in light of unique state policies
about the ways in which students can earn proficient scores. In some states,
such as Arizona for example, students can pass the assessment with a lower score
than students without disabilities.
Figure 19. Percent Passing Minimum Competency/High School
Reading Exit Exam
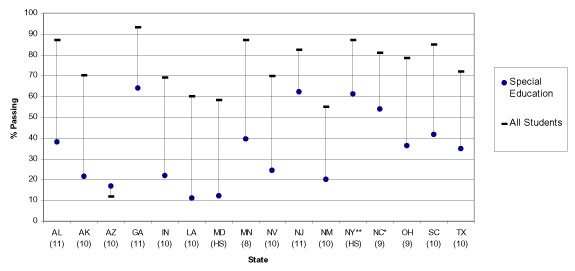
Figure 20. Percent Passing Minimum Competency/High School
Mathematics Exit Exam
Assessment Performance: Trends
As part of an earlier analysis (Thurlow et al., 2003), we examined the
performance of students with disabilities for states that had at least three
years of publicly reported data. In light of the changes that were brought about
by NCLB, we decided to examine states that reported six years of data using the
same assessment. In 2000–2001, 13 states had publicly reported information on
their statewide tests for three years for both math and reading (California,
Delaware, Indiana, Kentucky, Louisiana, Maryland, Minnesota, Missouri, New
Jersey, New York, Texas, Utah, and Washington). Colorado reported three years of
information only for the reading test and Kansas reported information only for
the math test. In 2003–2004, 11 states have six years of publicly reported
information on their statewide tests (California, Colorado, Delaware, Indiana,
Kansas, Kentucky, Louisiana, Missouri, New Jersey, New York, and Washington).
Similar to the previous report, we have six years of information for Colorado
for the reading test and from Kansas for the math test. Texas and Maryland were
no longer included because they had changed their tests. Minnesota, which did
not report performance information in 2002–2003 (Wiley et al., 2005) and Utah,
which aggregated its performance information across all grades in 2003–2004,
also could not be included in the six year analyses.
Reading Tests
Figures 21–23 show the percentages of students with disabilities achieving
proficiency on state assessments at the elementary, middle, and high school
levels. In general, it appears that for elementary school students with
disabilities a higher percentage of students are achieving proficiency in
reading in the later years. A few states have some spikes or drops (California,
Louisiana), but it may be that tests were being adjusted with the passage of
NCLB.
At the middle school level, it appears that most states had a higher percentage
of students achieving proficiency in 2001–2002. The exceptions are California
and Louisiana. At the high school level, a much smaller percentage of students
achieved proficiency, but this number gradually increases in later years.
Figure 21. Six-Year Trends of the Percentage of Elementary
Students with Disabilities Who Achieved Proficiency on Statewide Reading Exams
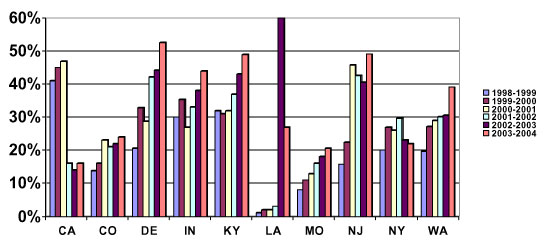
Figure 22. Six-Year Trends of the Percentage of Middle School
Students with Disabilities Who Achieved Proficiency on Statewide Reading Exams
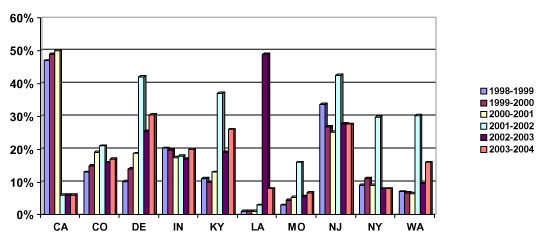
Figure 23. Six-Year Trends of the Percentage of High School
Students with Disabilities Who Achieved Proficiency on Statewide Reading Exams
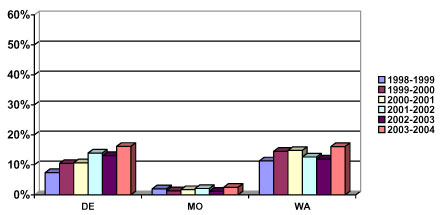
Math Tests
Figures 24–26 show the percentages of students with disabilities achieving
proficiency on state assessments at the elementary, middle, and high school
levels for math. In general, it appears that for elementary school students with
disabilities a higher percentage of students are achieving proficiency in math
in later years, particularly when comparing the years after NCLB was passed. A
few states have some spikes or drops (California, Louisiana), but it may be that
tests were being adjusted with the passage of NCLB.
A similar pattern can be observed at the middle and high school level as well.
Again, California and Louisiana have spikes prior to 2003–2004, but this may be
the result of changes in the test. When comparing the 2001–2002 school year to
2003–2004, and with the exception of Louisiana, students with disabilities are
achieving a higher level of proficiency in 2003–2004.
Figure 24. Six-Year Trends of the Percentage of Elementary
Students with Disabilities Who Achieved Proficiency on Statewide Mathematics
Exams
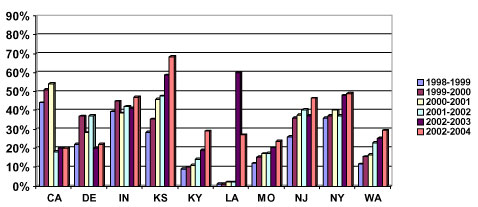
Figure 25. Six-Year Trends of the Percentage of Middle School
Students with Disabilities Who Achieved Proficiency on Statewide Mathematics
Exams
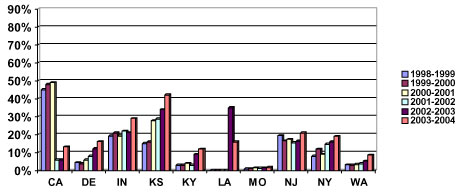
Figure 26. Six-Year Trends of the Percentage of High School
Students with Disabilities Who Achieved Proficiency on Statewide Mathematics
Exams
Discussion
There have been many areas of improvement for statewide public reporting. For
public reporting of general assessments, it appears that about the same number
of states are reporting information for all their tests, regardless of whether
they are included in state accountability systems (35 in 2003–2004 compared to
36 in 2002–2003). However, for tests in NCLB accountability systems, improvement
is evident. In 2003–2004, 44 states reported both performance and participation
information for all the tests in their NCLB accountability system while 40 did
so in 2002–2003.
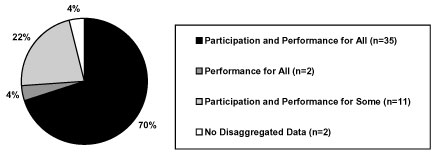
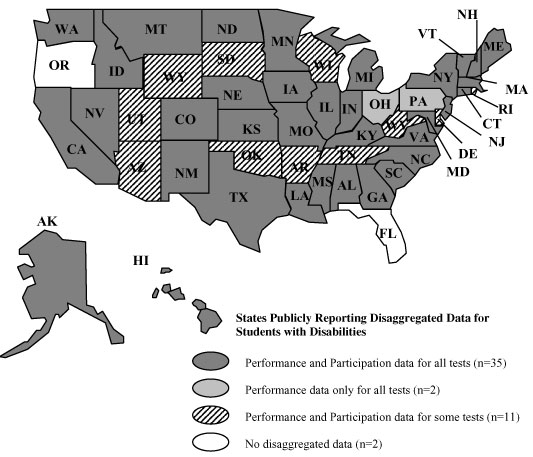
A total of 48 states reported some state-level information about students with
disabilities on their state assessments. Of these states, 35 reported
participation and performance for all their assessments, 11 reported
participation and performance data for some of their tests, 2 only reported
performance information, and 2 did not report information. This is close to the
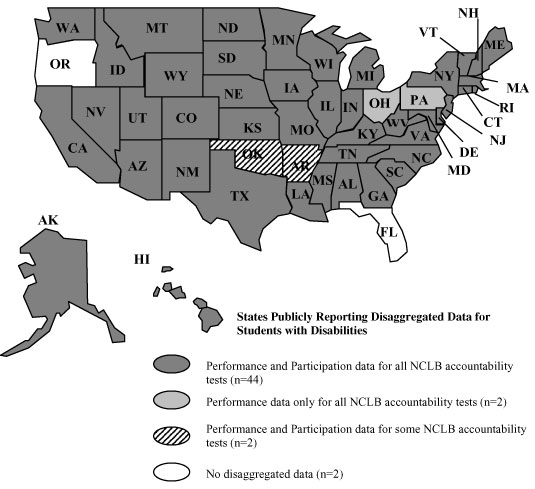
results of 2002–2003 (Wiley et al., 2005). However, when considering only tests
that are part of NCLB accountability systems, 44 reported participation and
performance information for all their assessments, 2 reported participation and
performance information for some of their assessments, 2 reported performance
information for all their assessments, and 2 did not report information.
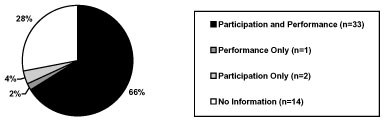
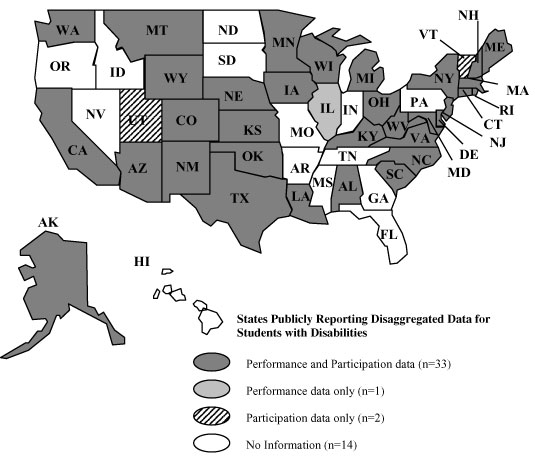
When examining alternate assessments, only 36 states reported any information.
This is the same as 2002–2003. However, more states reported both participation
and performance data for their alternate assessments (33 in 2003–2004 compared
to 29 in 2002–2003). One state reported only performance data (compared to 4 in
2002–2003) and 2 reported only participation data for their alternate assessment
(compared to 3 in 2002–2003). Fourteen states did not report participation or
performance information about their alternate assessment.
For their general assessments, 34 states reported either the percent of students
tested or not tested for at least one of their assessments (53 assessments
total). This is a much more informative way of presenting data than just giving
the number of students tested. However, the number of students tested still
continues to be the most common way of reporting participation (79 assessments).
The number or percent of students who were exempt or excluded from assessments
was given for 1 test and the number or percent of students absent was given for
19 tests. For their alternate assessments, the most common way of reporting
participation information was to give the number of students tested, which was
done by 32 states. Twenty states gave a rate, which is an increase from 15 in
2002–2003.
When we examined the performance of students for the general assessment, we
found that large gaps existed between students with disabilities and all
students. Though some gaps were much larger than others, the gaps were
noticeable for all states that provided performance data. Gaps were larger at
higher grades. In a few instances, a higher percentage of students with
disabilities achieved proficiency compared to all students. This finding should
be followed in future years to see whether this is a trend for students with
disabilities in these states.
It appears that across years there are gradual improvements in the percentage of
students with disabilities who achieve proficiency on statewide reading and math
tests. These trends are most evident in the elementary grades, and seem to
dissipate somewhat at the middle school level and even more at the high school
level (though it is difficult to tell this because so few states have data). It
will be important to continue to follow these trends.
In the second year following NCLB, it is interesting to see that many states are
making strides toward reporting disaggregated participation and performance
data, at least as it relates to the tests in their accountability systems. Still
there are improvements that could be made, particularly in relation to reporting
on alternate assessments. Fourteen states are still not reporting participation
and performance data for this assessment. It may be that this is because states
are revising these assessments in light of new requirements (throughout 2003).
Yet, the number seems higher than expected.
There have definitely been improvements since 2002–2003 in the reporting of
state assessment data, and this trend will likely continue for 2004–2005.
Continued checking on the reporting practices of states and on the participation
levels and performance achieved by students with disabilities is important.
References
Fast, E. F., Blank, R. K., Potts, A., & Williams, A. (2002). A guide to
effective accountability reporting. Washington, DC: Council of Chief State
School Officers.
McGrew, K. S., Thurlow, M. L., Shriner, J. G., & Spiegel, A. N. (1992).
Inclusion of students with disabilities in national and state data collection
programs (Technical Report 2). Minneapolis, MN: University of Minnesota,
National Center on Educational Outcomes.
McLaughlin, M. J., & Thurlow, M. L. (2003). Educational accountability and
students with disabilities: Issues and challenges. Educational Policy,
17(4), 431–451.
No Child Left Behind Act of 2001, 20 U.S.C. 6301 et seq. (2002).
Schwartzbeck, T. D. (2003). Targeting subgroups. School Administrator, 60(11),
16–20.
Thurlow, M. L., & Wiley, H. I. (2004). Almost there in public reporting of
assessment results for students with disabilities (Technical Report 39).
Minneapolis, MN: University of Minnesota, National Center on Educational
Outcomes.
Thurlow, M. L., Wiley, H. I., & Bielinski, J. (2003). Going public: What
2000–2001 reports tell us about the performance of students with disabilities
(Technical Report 35). Minneapolis, MN: University of Minnesota, National Center
on Educational Outcomes.
Wiley, H. I., Thurlow, M. L., & Klein, J. A. (2005). Steady progress: State
public reporting practices for students with disabilities after the first year
of NCLB (2002–2003) (Technical Report 40). Minneapolis, MN: University of
Minnesota, National Center on Educational Outcomes.
Ysseldyke, J. E., Thurlow, M. L., Langenfeld, K. L., Nelson, J. R.,
Teelucksingh, E., & Seyfarth, A. (1998). Educational results for students
with disabilities: What do the data tell us? (Technical Report 23).
Minneapolis, MN: University of Minnesota, National Center on Educational
Outcomes.
Zlatos, B. (1994). Don’t test, don’t tell: Is “academic red-shirting” skewing
the way we rank our schools? The American School Board Journal 191(11),
24–28.
Appendix A
Verification Letter to State Assessment Director
The National Center on Educational Outcomes is examining states’ public reports
on 2003–2004 school year assessment results. We have reviewed your Web
site for both participation and performance data on your statewide assessments.
At this time, we were unable to find any information regarding the name of the
tests you administer, the grades and subject areas that are tested or the
results of those tests. We were also unable to find any information on how
participation information is reported for students with disabilities (if it is
available) and whether information is given about students who took assessments
with individual accommodations.
Please provide us with information on the name of the tests you administer,
the grades and subject areas tested by each test as well as where we can find
participation and performance data for these tests. Our goal is to (a)
identify all components of each state’s testing system, (b) determine whether
each state reports disaggregated test results for students with
disabilities, (c) describe the way participation information is presented, and
(d) describe how states report results for students who took the test with
accommodations or modifications.
If there is publicly reported information available for your state, please
provide us with the public document and/or website that contains the accurate
information. Address your responses to Jenny Klein at the above address.
If you have any questions about our request, please call Jenny Klein at (612)
626-0658 or email: klei0321@umn.edu. If we do not hear from you by
February 28, 2005, we will assume there is no publicly available
information.
Thank you for taking the time to provide this information.
Sincerely,
Jenny Klein
Graduate Research Assistant
Martha Thurlow
Director
Table 1: Tests Administered and Results Found
Please review this table for its accuracy, make any changes (if necessary),
and fill in any blank spaces.
|
State |
Test |
Grades Tested |
Subject Areas |
Is Disaggregated Info for Students with
Disabilities Reported (Yes/No) |
Is this test part of the state
accountability system? (Yes/No) |
|
AL |
|
|
|
Participation |
Performance |
|
|
Direct Assessment of Writing [CRT] |
5,7 |
Writing |
Yes |
Yes |
|
|
High School Graduation Exam
[EXIT] |
12
|
Reading, Language, Math, Science, Social Studies |
Yes |
Yes |
|
|
Stanford Achievement Test, 10th ed. (SAT-10) [NRT] |
3-8 |
Reading, Language, Math, Science. Social Studies |
Yes |
Yes |
|
|
Alternate
Assessment |
3-8, 11, 12 |
Not specified |
Yes |
Yes |
|
Table 2: Participation Information for Students with
Disabilities
Please review this table, which describes the way in which participation
data are publicly reported in your state. A dot in the box indicates information
is reported in this way. Please add a “Y” if you know of any other method of
participation reporting, and please provide us with the information that is
reported in that way (either a hard copy or a web-link).
State
|
Test |
Number
Tested |
Number Not Tested |
Number Exempt |
Number Excluded |
% of students tested |
% of students not tested |
%
Exempt |
% Excluded |
Number and/or Percent Absent |
|
AL |
HS Graduation Exam |
Y |
|
|
|
|
|
|
|
|
|
SAT-10 |
Y |
|
|
|
|
|
|
|
|
|
DAW |
Y |
|
|
|
|
|
|
|
|
|
Alternate |
Y |
|
|
|
|
|
|
|
|
Blank cell = no data
Table 3: Accommodations
We are interested in examining if and how states report information
about students who take assessments using accommodations. Please change our
responses (if necessary) to reflect information that is reported for your state.
If you do make changes, please provide us with the information (either a
hard-copy or a web-link).
|
Test |
Allowable Accommodations |
Non-allowable Accommodations |
|
|
Participation |
Performance |
Participation |
Performance |
|
HS Graduation Exam |
No |
No |
No |
No |
|
SAT-10 |
No |
No |
No |
No |
|
DAW |
No |
No |
No |
No |
|
Alternate |
No |
No |
No |
No |
Appendix B
Letters to State Directors of Special Education
(Two forms depending on input from Assessment Director. Example here is if
letter was verified by the Assessment Director. If no verification, letter was
the same as in Appendix A.)
The National Center on Educational Outcomes is examining states’ public reports
on 2003–2004 school year assessment results. We have reviewed your
state’s Web site for both participation and performance data on your statewide
assessments. Attached tables reflect what we believe to be the tests your state
administers and the results that we have found thus far on the Web (Table 1),
how participation information is reported for students with disabilities (if it
is available) (Table 2), and whether information is given about students who
took assessments with individual accommodations (Table 3). These tables have
been verified by your state’s Director of Assessment, but if you have anything
to add, please let us know.
Please review the tables and verify their accuracy. Our goal is to (a)
identify all components of each state’s testing system, (b) determine whether
each state reports disaggregated test results for students with
disabilities, (c) describe the way participation information is presented, and
(d) describe how states report results for students who took the test with
accommodations or modifications.
If any data element is inaccurate, please provide us with the public document
and/or website that contains the accurate information. Address your responses to
Jenny Klein at the above address.
If you have any questions about our request, please call Jenny Klein at (612)
626-0658 or email: klei0321@umn.edu. If we do not hear from you by
June 16, 2005 we will assume that our summaries are accurate.
Thank you for taking the time to verify our findings.
Sincerely,
Jenny Klein
Graduate Research Assistant
Martha Thurlow
Director
Table 1: Tests Administered and Results Found
Please review this table for its accuracy, make any changes (if necessary),
and fill in any blank spaces.
|
State |
Test |
Grades Tested |
Subject Areas |
Is Disaggregated
Info for Students with Disabilities Reported (Yes/No) |
Is this test part
of the state accountability system? (Yes/No) |
|
AL |
|
|
|
Participation |
Performance |
|
|
Direct Assessment
of Writing
(criterion-referenced) |
5,7 |
Writing |
Yes
|
Yes
|
Yes |
|
High School
Graduation Exam
(Exit Exam) |
12 |
Reading, Math,
Science, Social Studies, Language |
Yes |
Yes |
Yes |
|
SAT-10
(norm-referenced) |
3-8 |
Reading, Language,
Math, Science, Social Studies |
Yes |
Yes |
Yes |
|
Alternate
Assessment |
3-8,11,12 |
Not specified |
Yes |
Yes |
No |
Table 2: Participation Information for Students with
Disabilities
Please review this table, which describes the way in which participation
data are publicly reported in your state. A dot in the box indicates information
is reported in this way. Please add a “Y” if you know of any other method of
participation reporting, and please provide us with the information that is
reported in that way (either a hard copy or a web-link).
|
State |
Test |
Number
Tested |
Number Not Tested |
Number Exempt |
Number Excluded |
% of students tested |
% of students not tested |
%
Exempt |
% Excluded |
Number and/or Percent Absent |
|
AL |
Direct Assessment
of Writing |
Y |
|
|
|
|
|
|
|
|
|
HS Grad. Exam |
Y |
|
|
|
|
|
|
|
|
|
SAT-10 |
Y |
|
|
|
|
|
|
|
|
|
Alternate
Assessment |
Y |
|
|
|
|
|
|
|
|
Blank cell = No data
Table 3: Accommodations
We are interested in examining if and how states report information about
students who take assessments using accommodations. Please change our responses
(if necessary) to reflect information that is reported for your state. If you do
make changes, please provide us with the information (either a hard-copy or a
web-link).
|
Test |
Standard Administration |
Nonstandard Administration |
|
|
Participation |
Performance |
Participation |
Performance |
|
Direct Assessment
of Writing |
No |
No |
No |
No |
|
High School
Graduation Exam |
No |
No |
No |
No |
|
SAT-10 |
No |
No |
No |
No |
|
Alternate
Assessment |
No |
No |
No |
No |
Appendix C
2003–2004 State Assessment Systems and Status of
Disaggregated Data