Universal design of assessment has been an important step forward in making tests more accessible to students with disabilities. An issue affecting the universal design approach is the need to review individual items, potentially hundreds of them. Ideally, there would be a statistical procedure available that would first identify items that are potential sources of problems for students with disabilities. This paper illustrates one method of determining whether items are functioning differentially for students with disabilities in comparison to their non-disabled counterparts. Using various statistical analysis techniques, a large statewide mathematics data set was investigated for items that may have design issues. Multiple methods were used as a means for compensating for the lack of statistical power that is often present when analyzing data for populations with small group sizes. Results indicated that items can be flagged for further review based on differential functioning across disability groups or types of analysis.
Introduction
Research on the design of assessments has demonstrated that when test items are designed to be accessible from the beginning, positive results can occur (Grise, Beattie, & Algozzine, 1982; Johnstone, 2003). Assessments created with access for the greatest number of students (universally designed assessments) are recommended as an important way to improve assessment participation and performance for all students.
Universally designed assessments are one outcome of the universal design approach to all of education called for in the 2004 reauthorization of the Individuals with Disabilities Education Act (IDEA) (Public Law No: 108-446). IDEA 2004 cites the Assistive Technology Act of 2004 by defining universal design as “a concept or philosophy for designing and delivering products and services that are usable by people with the widest possible range of functional capabilities, which include products and services that are directly accessible (without requiring assistive technologies) and products and services that are interoperable with assistive technologies.” The application of universal design principles to educational assessments is based on arguments of accessibility and equity. Thompson, Johnstone, and Thurlow (2002) specifically suggested that assessments are universally designed if they are accessible to a wide variety of students, have items that are clearly related to intended assessment constructs, are minimally biased, can be presented with accommodations for students with disabilities, have clear instructions and procedures, are comprehensible to a wide audience, and are legible.
Careful scrutiny of assessment items during design stages through field testing may improve the accessibility of tests overall. This report focuses on techniques that can be used for analyzing the results of field test items with representative samples of student subgroups. The objective of this report is to provide states and test designers methods of analysis for discovering which test items are valid for all students and which items may have issues related to universal design. These methods are demonstrated through an analysis of one state’s assessment results.
Three strategies are currently recommended by the Universal Design Project at the National Center on Educational Outcomes (NCEO) for determining whether assessments are universally designed. The first strategy is called the “think aloud method” (Johnstone, Miller, & Thompson, in press), also known as cognitive labs or protocol analysis. This qualitative method asks individual students from target groups and comparison groups to complete items while verbalizing all of their thoughts. This method has been found to be an effective way of uncovering design features that cause confusion and misunderstanding for students. The think aloud method, however, is limited in scope because it requires items to be pre-selected and can only be effectively conducted on a relatively small sample of students (Johnstone et al., in press).
The second strategy is the use of a set of considerations for item development and review. Currently, many states have some form of expert review, often called “content,” “sensitivity,” or “bias” review panels. These panels review hundreds to thousands of potential test items in order to find and change or eliminate bias toward particular populations. These reviews, however, are often unstructured and costly because items can be quickly rejected. In an effort to increase the effectiveness of these processes, NCEO solicited input and validation from experts in a variety of fields, resulting in Considerations for the Development and Review of Universally Designed Assessments found in Thompson, Johnstone, Anderson, and Miller (2005). These considerations function as thinking points for item reviewers.
The third strategy for ensuring universal design of assessments is to conduct large-scale statistical analyses on test item results. This paper describes four statistical techniques that are currently used in field practice by researchers and provides an example of the results of these techniques in a state. The statistical techniques described were used to flag items that may have been biased against certain groups.
Typically, test companies examine items using one of the methods described in this paper—differential item functioning (DIF). Although useful for large groups, DIF becomes less accurate as the size of the group gets smaller. Our purpose in this research was to use a variety of methods of analysis, partially because of small group size, in order to detect problematic items.
None of the methods of analysis described in this report yielded indisputable information largely because each technique loses validity for low incidence populations (such as students with specific types of disabilities). When used in combination with other available strategies (think alouds, considerations), however, patterns may emerge that help to detect problematic items. Use of the statistical techniques described in this report cannot resolve item-related issues entirely, but can provide a realistic starting point to aid states and test companies in searching out items that cause problems unrelated to the content tested.
Method
Overview
This paper describes a variety of techniques for using assessment data to determine whether items are universally designed. Methods of analysis are described, followed by a secondary analysis of all possible “flagged” items. The secondary analysis acts as a way to create a manageable list of items with potential issues.
Analysis of statewide field test data is most efficient when specific groups of interest are identified a priori. Information can be elicited from databases on broad-based groups such as free and reduced lunch status, gender, or ethnicity. Smaller sub-groups may be examined within larger groups. For example, students with disabilities can be examined by disability category (learning disabilities, visual impairment, hearing impairment, emotional disturbance, etc.), accommodation group (read aloud, extended time, large print, etc.), or a combination of the disability category and accommodation group (e.g., students with learning disabilities who receive read aloud accommodations). The advantage of targeting subgroups is that very specific information can be derived. The disadvantage of such actions is that sub-group size is often very small.
Sample
This study made use of extant data from a large, Midwestern state’s assessment database. The sample consisted of students with disabilities who participated in the large-scale mathematics assessment at grades 4 and 8. The data selected are from the year 2000.
Subgroups selected for analysis represented a variety of disability categories, including learning disability, speech disorder, mental retardation, emotional/behavioral disorder, other health impaired, hearing impaired, language impaired, partial sight, blind, physical impairment, autism, traumatic brain injury, deaf/blind, and multiple disabilities. The number of students in each group ranged from five (deaf/blind) to 5,464 (learning disability) in 4th grade and from four (deaf/blind) to 5,498 (learning disability) in 8th grade, demonstrating the disparity in population size for various disabilities.
Data were also examined based on accommodation provided. Students of all disability types predominately received five types of accommodations, including oral test accommodations (referred to as “read aloud”), extended time, Braille, large print, and signed assistance. Sample sizes for accommodations also demonstrated disparities. For example, only 13 grade 4 students used large print tests while 4,427 students received read aloud accommodations. In grade 8 the pattern was similar, with 12 students receiving large print accommodations and 2,876 receiving read aloud accommodations. Sample sizes for all groups and accommodation conditions are provided in Table 1.
Instrumentation
Data for this analysis are from a Midwestern state’s 2000 large-scale mathematics assessment at grades 4 and 8. The entire test was a norm-referenced multiple choice test. Students took the test under various conditions of accommodation, as well as under standard conditions. All data (accommodated and standard) were included in the data set and all were entered in terms of correct or incorrect student responses for each item.
Table 1. Sample Size by Grade Level, Disability, and Accommodations Use
|
Disability |
4th Grade |
8th Grade |
|
Learning Disability |
5464 |
5498 |
|
Speech |
804 |
90 |
|
Mental Retardation |
445 |
724 |
|
Emotional/Behavioral Disorder |
573 |
731 |
|
Other Health Impaired |
332 |
252 |
|
Hearing Impaired |
67 |
76 |
|
Language Impaired |
539 |
192 |
|
Partial-See |
25 |
17 |
|
Blind |
10 |
5 |
|
Physical Impairment |
33 |
27 |
|
Autism |
20 |
36 |
|
Traumatic Brain Injury |
17 |
16 |
|
Deaf/Blind |
5 |
4 |
|
Multiple Disabilities |
55 |
64 |
|
Accommodation |
|
|
|
Students Receiving Read-aloud |
4427 |
2876 |
|
Students Receiving Extended Time |
2668 |
1329 |
|
Students Receiving Braille |
25 |
20 |
|
Students Receiving Large Print |
13 |
12 |
|
Students Receiving Signed Assistance |
49 |
27 |
Approaches to Item Analysis
There are multiple methods for examining data to detect design issues. This section explores four methods, moving from simple methods based on classical test theory to those with increasing complexity based on more contemporary item response theories. Rationale, explanations, and data from the state’s mathematics assessment in 4th and 8th grades are reported for the following: Item Ranking, Item Total Correlation, Differential Item Functioning (DIF) using Contingency Tables, and DIF using Item Response Theory (IRT) approaches. All analyses are conducted within a grade level (i.e., no cross-grade analyses were conducted).
Analysis Approach 1: Item Ranking
Item ranking is a procedure that requires a comparison of item ranks from different groups to determine whether certain items are more challenging (and potentially biased) for particular students. Item ranking assumes that every item has a particular degree of difficulty and is usually expressed with a P (probability) statistic. For example, if 60% of students in a population answered an item correctly, its P-value (Total) would be (.60). P-values can also be calculated for groups (De Ayala & Kelley, 1997). Items can then be ranked from most to least difficult for the total population and for particular groups.
Current standards-based assessment requirements differ from results typically expected of item ranks. Accountability requirements in all states expect all students to achieve at comparable rates, therefore P-values for particular items should be similar across groups (i.e., items that are difficult for one group should be difficult for another group; items that are easy for one group should be easy for another group). When item ranks vary across groups, it may be an indication that certain items are particularly difficult for one group of students. Such difficulty may be a result of the item placement in the test (e.g., slower students may not attempt items at the end of the test; De Ayala & Kelley, 1997), a possible reflection that certain students have not had the opportunity to learn content (Abedi, Herman, Courtney, Leon, & Kao, 2004), or an indication of item bias (Popham & Lindheim, 1980).
There are three steps to determine differences in item ranks.
1. Determine the P-value for each item for a target group (students with disabilities) and a reference group (students without identified disabilities).
2. Rank items from lowest to highest in terms of P-value (items ranked will range from the most difficult to the easiest for a group).
3. Examine groups for discrepancies in item ranks.
The importance of discrepancies in rank order depends on both the number of items and student results. If a discrepancy exists between groups on a particular item, the item may warrant further investigation. Decision rules as to whether an item is problematic can vary. In this study it was determined that a five “rank” difference was sufficient for flagging an item for further analysis.
We chose five “ranks” as a rule to flag items by first considering the sampling distribution under the null hypothesis. The sampling distribution depends on several quantities such as the number of items (which determines the range of rank differences), item difficulties (because ranks are based on item difficulties), and sample sizes (smaller sample sizes lead to larger variability of rank differences). The null hypothesis is that the rank of the item is the same for both groups (or more strictly, item difficulties are the same for both groups).
The sampling distribution of rank difference does not follow a standard distribution such as normal or t, so it is difficult to obtain in an analytical form. Thus, it was estimated by statistical simulation. Sample sizes of focal groups vary across disability categories, so simulation was performed for each of the disability and accommodation categories. Data were generated in each simulation to estimate type I error rates. The same set of simulations was repeated for the 4th and 8th grades.
Medians of type I error rates for the 4th and 8th grades are .120 and .090 (see Figure 1), respectively. So, for about half of the comparisons, we tested at significance level 10% or less by using the critical value of rank difference 5. It should be noted that the type I error rate can be very high when the sample size of the focal group is very small. It can be as high as .70. Therefore, other methods of analysis are warranted to ensure defensible conclusions about items.
Figure 1. Type 1 Error for Item Rank Statistics
Analysis Approach 2: Item Total Correlation
A second method for flagging items for possible universal design issues is Item Total Correlation (ITC). ITC analysis examines how items correlate to other items on the same test. Therefore, ITC analysis is a within group investigation. ITC determines how well an item’s P-value (see analysis approach 1) correlates with other test items in the test for a particular group. Crocker and Algina (1986) suggested that ITC should be at least .20 for any particular item. In other words, a particular item’s P-value should positively correlate at a rate of .20 with the combined p-values of other items on the test. Such a rate would ensure a reasonable level of reliability. If an item does not correlate with the rest of the test, it may be problematic. A second set of tests will determine whether there are statistically significant differences between ITCs for target and comparison groups.
Stark, Chernyshenko, Chuah, Lee, and Wadlington (2001) noted that testing ITC and flagging items with low ITC is typically part of the test development process. Therefore, checking ITC for target groups is a valuable exercise because such data are sometimes overlooked during field testing of items.
The first step in calculating ITC is to compute a Pearson point-biserial item-total correlation (rpb) for each item separately, for both the target and reference group. Items that have an initial ITC of less than .20 may be problematic (Crocker & Algina, 1986). A second step in determining potentially problematic items is to determine whether ITCs are statistically different between groups. Statistical tests must then be conducted, item-by-item, for target and reference groups.
Before beginning target group comparisons, it is important to note that group sizes may be very small, causing range restrictions in variance of ITC. Therefore, to more accurately compare groups, a correction suggested by Hunter and Schmidt (1990) can be used:
p = po / a.
In this formula, p is the corrected correlation, po is the computed correlation, and a is derived by calculating the following formula:
![]()
Here, u is the ratio of the standard deviation of the target group for an item to that of the reference group for that item (SDtarget/SDreference).
In this study, ITCs and simple t-tests were used to determine whether there was a statistically significant difference between target and reference groups for a particular item. If a statistically significant difference is found on a particular item, the magnitude of that difference can be tested using Cohen’s (1988) index. The magnitude (q) is computed using the formula:
![]()
According to Cohen (1988), differences of q = .10 are considered small, differences of q =.30 are considered medium, and differences of q = .50 are considered large.
To ensure that findings are statistically reasonable, confidence intervals are constructed. For each item with a significant and large difference, a 95% confidence interval was constructed around the ITC for each group using the following formula:
![]()
(* = multiply)
In this formula, zp represents the standardized correlation coefficient using Fisher’s z-transformation, which was determined using an r- to z-table. N, in this formula, represents the target group size. Following the construction of each confidence interval, z-values were transferred back to r-values using the r- to z-table.
Cohen’s indices of q that are large (.50 or higher) and confidence intervals that are low (.20 or lower) may indicate a problematic item. These values were used in this study to flag an item for further analysis.
Analysis Approach 3: Differential Item Functioning: Contingency Table Methods
Analysis of Differential Item Functioning (DIF) seeks to determine whether a particular item is substantially more difficult for one group than another after the overall differences in knowledge of the subject tested are taken into account. Analyses are predicated on the notion that items should be of similar difficulty level for students of equal achievement levels across target and reference groups. DIF occurs when one item is substantially more difficult for a particular group after students were matched for achievement levels. For example, if equally achieving students with disabilities and non-disabled students were compared by item, and the students with disabilities scored substantially lower on an item than their non-disabled peers, that item would have DIF and possibly universal design shortcomings. DIF does not mean that an item is more difficult for one group than for another, but implies that items function differentially according to student characteristics that are not related to achievement (e.g., disability, gender, and ethnic background; The College Board, 2004).
DIF statistics are calculated by computing the proportion of students who answer an item correctly, within a given overall test score range, in target and reference groups. Statistically significant findings may point to an item’s problematic nature. Two types of analyses can be used for DIF statistics: Mantel-Haenszel Chi Squares and SPD-X calculations.
Mantel-Haenszel Chi-Square statistic (MHc2) and log odds ratio (bMH) for target and comparison groups are calculated using any statistical analysis program (e.g., SIBTEST, SAS). Items for which the chi-square statistic is significant, and D (which represents -2.35 bMH) is significantly different from 0, may have universal design issues. One weakness of MHc2 analyses is that some target groups in this research have few, if any, students in particular achievement categories (sample sizes of less than 50 are unreliable for MHc2 statistics). To minimize error, samples were divided into 5 ability levels based on total score. Small sample sizes, however, were still present. Therefore a second test, used in combination with MHc2, was calculated to determine whether DIF was present for target groups.
This second test of DIF analysis was calculated using the following equation:
![]()
In this equation, p represents the proportion of students answering the item correctly at raw score level j for corresponding target (T) and reference groups. Once Dp is calculated, SPD-X is then calculated for each target group using the following equation:

In this formula, j is the raw score level, S is the highest raw score value, and nTj is the target group size at the specified raw score level (one of the features of DIF analysis is that subjects are sorted by raw score achievement as well as qualitative group). SPD-X calculations can be conducted using DIF software.
Large positive results for SPD-X indicate that an item is differentially difficult for a target group and may, therefore, have universal design issues. There is no significance test for SPD-X calculations, so decision rules are largely based on local considerations. Universal Design Project researchers examined the statewide database and determined that SPD-X calculations of .05 indicated that several items had potential universal design shortcomings.
Analysis Approach 4: Differential Item Functioning: Item Response Theory Approaches
Differential Item Functioning can also be determined using Item Response Theory approaches. IRT analyses focus on individual items and presents statistics based on the “latent traits” of individual test takers (Baker, 2001). In theory, all test takers have latent traits in terms of ability. IRT applications require these traits to be quantified. Rather than calculating DIF using results from individual items with assumed equality of achievement, IRT applications allow researchers to investigate item difficulty based on the individual traits of test takers. In other words, items are weighed for difficulty, but balanced by the latent traits of individuals.
Typically, when items are investigated using IRT approaches, two parameters are measured: item difficulty and item discrimination. Items that are considered difficult have a low P-value for all test takers in a group. Discrimination parameters describe the item’s ability to discriminate students who are high and low achievers. In theory, high achieving students should have a high probability of answering an item correctly. Conversely, low achieving students should have a low P-value. Difficulty and differentiation can be plotted on a graph that represents student latent traits on a scale (x-axis) and P-value for the item (y-axis). Items that are appropriately difficult and discriminating are represented by an S-curve. Figure 2 demonstrates an S-curved item that has a low P-value for low achievers, medium P-value for medium achievers, and high P-value for high achievers.
Figure 2. IRT "S" Curve
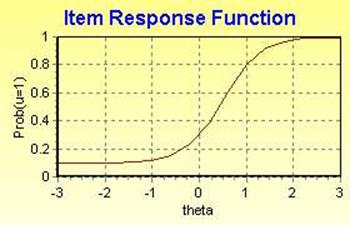
Source: Baker, 2001
DIF can also be calculated using IRT approaches by using a freely available, downloadable program called IRTLRDIF (see http://www.unc.edu/~dthissen/dl.html). This program calculates three different item parameters: (a) discrimination, (b) difficulty, and (c) guessing (Birnbaum, 1968). For each item (and each group) IRTLRDIF provides estimates for (a), (b), and (c), and a latent trait distribution (S-curve) with 100 equidistant points. The probability that a person with a given latent trait will answer the item correctly (Pq), or the value of the latent trait curve, is represented (and solved) with the formula below:
![]()
If calculating for 2 groups, 100 points on each S-curve will produce 200 “Pq’s” for each item. To evaluate the magnitude of differences in parameters (differential item functioning for groups, controlling for latent traits and guessing) the following formula was calculated:

In this formula, dGr(q) is the density of the proficiency distribution of the target group at the latent trait value (Holland & Wainer, 1993). Items with significant DIF and a large difference in item parameters (DIF ³ .05) may have universal design issues.
A second set of calculations can be computed using SIBTEST software. To determine DIF, SIBTEST can be run for reference and focal (target) group files. Any items that have a beta of greater or equal to .05 and a P-value smaller than .05 may be problematic.
SIBTEST is an efficient test, but care must be taken before performing calculations. Any cases that have missing information (items omitted) must be excluded from SIBTEST calculations. Because of the missing data constraints encountered during SIBTEST calculations, a column labeled “SIBTEST N” is also reported in the Results section. This column represents the N calculated after cases with missing data were eliminated.
Results
As expected, results varied from analysis to analysis, providing the need for further investigation. Therefore, results are reported in two categories—by analysis and by group. It is noteworthy that all items had universal design issues for some group (i.e., there were six analyses in four broad categories conducted on 19 groups). Among the 114 analysis cells (6 x 19) for each grade level, every item was found in at least one cell, as is demonstrated in the preliminary results found in Table 2 (grade 4) and Table 3 (grade 8). In these tables, items are reflected by letters, and the order of the letters does not reflect the actual order of the items. This protects the security of the original assessment. Finding that all items have been flagged for potential design problems is very helpful. This is why a cross categorical secondary analysis is needed.
Table 2. Items with Universal Design Issues: 4th Grade
Group |
N |
Item rank |
Item-total correlation |
M-H |
SPD-X |
IRT-LRDIF |
SIBTEST |
SIB(N) |
Learning Disability |
5464 |
None |
None |
A,C,D,G,K,L, |
O,Y |
A,B,C,E,G, H,I,J, |
X |
4752 |
|
Speech |
804 |
None |
None |
M,V,X |
None |
B,M,V,X |
X |
735 |
|
Mental Retardation |
445 |
A,H,K,L,M, |
A,B,C,D, |
1,2,3,4,5,6,7,8,9, |
K,S, |
A,B,C,D,E,F, |
A,W |
301 |
|
Emotional/ |
573 |
A,O |
CC |
A,J,K,L,M,N,O, |
None |
B,C,F,G,J, |
O,AA |
458 |
|
Other Health Impaired |
332 |
A,F,H,O |
FF |
C,G,H,K,M, |
G,P,Y |
A,C,G,N,P,R, |
G,P,Y |
287 |
|
Hearing Impaired |
67 |
A,H,K,T,DD |
B,R |
T |
G,H,T,X, DD,EE |
N |
None |
60 |
|
Language Impaired |
539 |
A,O,AA |
None |
A,G,H,K,L,M, |
A,Y |
A,C,D,E,H,K, |
A,T,AA |
470 |
|
Partial-See |
25 |
A,G,H,M, |
None |
Z,EE |
B,D,G,I,M,N, |
N,O,U,Z |
D |
22 |
|
Blind |
10 |
J,K,L,T,V, |
D,E,G,I,M, |
K |
J,K,L,T,V,X,Y, |
None |
None |
|
|
Physical Impairment |
33 |
G,N,T,S, DD |
None |
C,N,W,Z |
B,C,D,N,S, W,Z, CC,EE |
C,N,V,W,Z |
C,CC |
30 |
Autism |
20 |
G,K,M,N,T,Z,AA |
None |
G,I,K,M,N, |
D,I,K,M,N,Q,Z, |
A,B,F,H,J, N,V,W,Z, AA |
R,X,AA |
18 |
|
Traumatic Brain Injury |
17 |
A,G,M,Q,R,S |
None |
S |
A,E,F,G,M, |
C,P,Q,DD |
S |
15 |
|
Deaf/Blind |
5 |
H,L,M,O,S,W,Y, AA |
G,V,AA |
AA |
B,H,L,M,O, |
G,AA |
None |
|
|
Multiple Disabilities |
55 |
A,O,S,Y,DD |
C |
C,M,N,O,S, |
B,M,N,O, |
C,E,N,S,V, |
None |
50 |
|
Students Receiving Read-aloud |
4427 |
A,O |
None |
A,C,G,I,J,K, |
O,S,X,Y |
A,B,C,D,E, AA,CC,EE |
X,P |
3855 |
|
Students Receiving Extended Time |
2668 |
A,O |
None |
A,C,G,I,K,L, |
O,S,Y |
A,B,C,D,E,G,H,J,K, |
P,X |
2351 |
|
Students Receiving Braille |
25 |
A,B,I,L, M,O,T |
None |
B,I,O |
B,I,L,M,O, P,CC,EE |
B,F,I,L,O,AA |
B |
18 |
|
Students Receiving Large Print |
13 |
A,E,H,Z, EE |
K,S |
EE |
B,E,H,N,P,Y, |
F,DD,EE |
None |
11 |
|
Students Receiving Signed Assistance |
49 |
A,G,M,N,O |
O,Z |
A |
A,C,G,M,N, |
O,V,Y |
None |
47 |
Table 3. Items with Universal Design Issues: 8th Grade
Group |
N |
Item rank |
Item-total correlation |
M-H |
SPD-X |
IRT-LRDIF |
SIBTEST |
SIB(N) |
Learning Disability |
5498 |
E,X,AA |
DD,EE |
A,B,D,E,G,H,J, |
H,K,O,X |
A,C,D,E,F,G,H,I,J, |
H,X,AA |
4307 |
|
Speech |
90 |
F,Z |
V |
L |
D,F,H, |
A,D,L,V,Z |
D |
70 |
|
Mental Retardation |
724 |
H,J,K,O, |
A,G,J,Q,R, |
A,B,D,G,H,I, |
D,J,K,L,N,O,P, |
C,D,E,F,G, |
D,I,K,L,N,Q,R |
283 |
|
Emotional/ |
731 |
R,X,AA |
G,DD |
A,B,E,G,H,J,K, |
H,L,O,R,X |
A,B,D,F,G,H,K, CC,DD,EE |
X,AA, DD |
465 |
|
Other Health Impaired |
252 |
Q,X |
C,Z |
H,K,O,P |
none |
C,F,P,Q,V,Z |
Q |
188 |
|
Hearing Impaired |
76 |
A,I,J,K, |
D,F,M,T, |
I,J,K,P,Z |
A,I,J,K,P,AA |
I,J,K,P,V,X,Z, |
J.K |
57 |
|
Language Impaired |
192 |
R,AA |
AA,F,G,M, |
D,H,K,L,O,R,V |
D,K,O,R |
D,E,F,K,M,Q, |
D,M |
141 |
|
Partial-See |
17 |
E,I,K,O, X,Y,AA |
EE,FF |
L |
B,E,H, |
L,O,R,W,DD |
None |
15 |
Blind |
5 |
B,H,I,K,L,N, |
C,F,P,S, |
None |
A,B,H,I,J,K,L,
|
S,AA |
None |
|
|
Physical Impairment |
27 |
R,V |
A,F,G,U, CC,EE |
L,T |
F,L,O,R,X,DD, EE |
C,L,T,CC |
A,R,U, CC,EE |
20 |
|
Autism |
36 |
E,H,I,K, O,X,Y |
G,P,EE |
L,O,P |
F,G,I,L,P,W,Z, EE |
B,L,P,U,Z |
F,G,I,J,Q,S,T, W,Z, DD,EE |
16 |
|
Traumatic Brain Injury |
16 |
H,I,J,K,L,O, |
Q,V,BB,CC |
None |
C,D,H,
|
None |
None |
|
|
Deaf/Blind |
4 |
F,L,O,R,W,X |
None |
K,V |
A,B,F, |
None |
None |
|
Multiple Disabilities |
64 |
F,I,L,O,P,W |
AA |
A,H,O,R,W,X |
H,N,O, |
A,G,R,X,Y,AA |
None |
45 |
|
Students Receiving Read-aloud |
2876 |
E,O,R,AA |
G,Q,CC,DD |
A,B,D,E,G,H,J, |
H,K,L,O,R,X |
A,C,D,F,G,H,I,J,K,L, |
D,I,K,X,AA,DD |
2233 |
|
Students Receiving Extended Time |
1329 |
E,O,R,X,AA |
Q,AA,DD, EE |
B,D,E,G,H,J,K,L, |
H,K,L,O,R,X |
A,C,D,F,G,H,J,K,L, CC,DD,EE |
H,J,K,L,N,R,X, |
1078 |
|
Students Receiving Braille |
20 |
B,I,J,K,O, |
DD |
I,K,L |
B,H,I,J,K,L,O, |
C,G,I,DD |
Q,AA, DD |
17 |
|
Students Receiving Large Print |
12 |
H,J,K,L, |
DD,EE |
L,O,W |
I,K,L,O,P,T,U, X,Z,AA |
A,F,L,O,P,W, |
J,O,P,S,T,X,Y, |
11 |
|
Students Receiving Signed Assistance |
27 |
D,H,J,N, |
None |
D,K,N,P,V |
D,G,H,J,K, |
A,C,D,J,N,V |
G,I,K,S,T,AA, |
21 |
To derive meaningful decisions from multiple analyses and groups, a framework was needed to select a manageable number of items that could be re-examined for elements that are not universally designed. In the case of this research, the decision rule was set so that if at least half of the groups had flagged items, or an item was flagged by at least half of the analyses, the item would be considered potentially problematic and in need of further consideration. This meant that each analysis as well as each disability group and accommodation use group would be re-examined for flagged items. For example, in our cross-analysis examination, if an item was flagged in each half of the disability groups, that item would be considered potentially problematic. Likewise, if data indicates that an item was flagged for half of the accommodations groups, it would also be considered potentially problematic. These methods are somewhat biased because they produce more findings for low incidence disability populations. Still, they are one method that can be used to sift through large numbers of flagged items.
Likewise, if within a particular group, an item was shown to be potentially problematic across at least half of the analysis methods, that particular item would be considered potentially problematic. This method does not favorably weigh analyses that use recent advances in IRT theory, but is still a reasonable method for decision making considering all of the methods selected are hampered by low sample sizes.
Fourth Grade Results
We first examined all of the flagged items for all students in our sample. Only item A was considered potentially problematic using Item Rank methods. In this same grade level, no items were considered potentially problematic using Item Total Correlation, but three items (M,N, and Z) were considered potentially problematic when using Mantel-Haenszel methods. Only one item was of concern using SPD-X (number Y) and none was an issue using SIBTEST. Finally, IRT-LRDIF analysis found items C, N, V, and W to be potentially problematic. In 4th grade items M and N were considered problematic at least three times using different analysis methods. Item A also appeared twice. These items are candidates for further examination to determine whether there are universal design issues that need to be rectified.
Next we examined items within disability and accommodation groups. When we examined specific categories of disability, results varied among groups. There were three potentially problematic items for students with learning disabilities (O, X and Y). Item X was also considered problematic for students that receive speech/language services. Students with mental retardation, however, had nine problematic items (A, K, L, M, O, S, W, Y, and Z). Students with emotional/behavior disorders had two potentially problematic items (O and AA) and students with other health impairments had three items (G, P, and Y). Students with hearing impairments had only one potentially problematic item (T).
Items M, Z, and EE were considered potentially problematic for students with partial sight, but no item was considered problematic for students who were blind. Potentially problematic items were found in data for students with physical impairments (items C, N, W, and Z) and students with autism (items K, M, N, Z, and AA). Students with traumatic brain injury had items Q and S deemed problematic and students that were both deaf and blind had only item AA as potentially problematic when all analyses were considered. Finally, items C, N, O, S, and Y were considered problematic for students with multiple disabilities. Across 4th grade students with disabilities, items O, Z, and AA were considered potentially problematic in four disability groups and items M, N, S, and Y were flagged in three disability groups, indicating possible design issues for students on several items.
Among accommodations users, results were more uniform. Read aloud accommodations users had items A, O, P, S, X and Y deemed potentially problematic. Although students who were blind had no items considered problematic above, Braille users had four items (B, I, L, and O) that appeared problematic. Even though items M, Z, and EE were problematic for students with partial sight, large print users only had one potentially problematic item (EE). Finally, items A and O were potentially problematic for ASL users. Item O was potentially problematic for every accommodation group, except large print users. Item A was also potentially problematic for three accommodations groups, indicating a possible need for item design examination.
Table 4 shows the different items that were found to be potentially problematic across groups. Differences in item behavior for disability groups demonstrate the heterogeneous test-taking characteristics of students with disabilities. Based on these findings, it is conceivable that items A, M, N, O, S, and Z all have universal design shortcomings, with items A, M, N, and O appearing as the most frequently flagged items. Such items are candidates for review or revision using considerations of universal design as guidelines (Thompson et al., 2005).
Table 4. Flagged Items: 4th Grade
|
Analysis or Group |
Potentially Problematic Items |
|
Item Rank |
A |
|
Item Total Correlation |
none |
|
Mantel-Haenszel |
M,N,Z |
|
SPD-X |
Y |
|
IRT-LRDIF |
C,N,V,W |
|
SIBTEST |
none |
|
Disability |
|
|
Learning Disability |
O,X,Y |
|
Speech/Language |
X |
|
Mental Retardation |
A,K,L,M,O,S,W,Y,Z |
|
Emotional/Behavioral Disorder |
O,AA |
|
Other Health Impaired |
G,P,A |
|
Hearing Impaired |
T |
|
Partial Sight |
M,Z,EE |
|
Blind |
none |
|
Physical Impairment |
C,N,W,Z |
|
Autism |
K,M,N,Z,AA |
|
Traumatic Brain Injury |
Q,S |
|
Deaf/Blind |
AA |
|
Multi-disabled |
C,N,O,S,Y |
|
Accommodation |
|
|
Read-aloud Accommodation |
A,O,P,S,X,Y |
|
Extended Time Accommodation |
A,O,P,S,X,Y |
|
Braille |
B,I,L,O |
|
Large Print |
EE |
|
American Sign Language |
A,O |
Eighth Grade Results
Eighth grade results were drawn from a different set of items, therefore any similarities in item numbers found between 4th and 8th grade results is irrelevant. When examining items across disability groups, five methods of analysis yielded information about potentially problematic items. Item rank analyses found items O, R, X, and AA to be potentially problematic. Item Total Correlation, however, only indicated that item DD should be considered potentially problematic. Mantel-Haenszel statistics identified two potentially problematic items (K and L). In this grade level, SPD-X statistics found the most items to be potentially problematic (H, K, L, O, R, and X) while items L, V, and Z were potentially problematic using IRT-LRDIF. Finally SIBTEST indicated no problematic items using the “half” rule discussed above. A cursory glance at cross-analysis data demonstrates that item L was found to be problematic using three tests, and items K, O, R, and X were found to be potentially problematic twice across analyses.
The decision rule for finding potentially problematic items also elicited several items within disability groups, based on half of the tests flagging an item. In the 8th grade, items E, H, K, O, X, AA, and FF were found to have universal design issues for students with learning disabilities. Items D, L, and Z were found to be problematic for students with speech impairments while items A, D, G, J, K, L, N, O, P, Q, R, X, CC, and DD were potentially problematic for students with mental retardation. Items G, H, L, O, R, X, AA, and DD were potentially problematic for students with emotional/behavior disorders. Only item Q was found to be problematic, however, for students with other health impairments. Students with hearing impairments had items I, J, K, and Q as potentially problematic items. Students with partial sight had item L as potentially problematic while students who are blind had item S as a potentially problematic item. Items L, R, and EE were deemed problematic for students with physical impairments. Items G, I, L, O, P, Z, and EE were problematic for students with autism. Only item BB was flagged often enough to be considered problematic for students with traumatic brain injury. No items were flagged often enough to be considered problematic for students who are deaf/blind. Finally, items O, R, W, and X were considered problematic for students with multiple disabilities. In total, five disability groups had K, L, O, and R flagged so many times that these items were considered potentially problematic.
In terms of accommodations users (most often students with disabilities), students who received read aloud accommodations had items D, G, H, K, O, R, X, AA, CC, DD, and EE flagged so often that they were considered problematic. Students receiving extended time had items H, I, J, K, O, R, AA, CC, DD, and EE considered problematic. Students receiving Braille accommodations had items I, K, AA, and DD as potentially problematic items. Although students with partial sight had only item L flagged enough to be considered problematic, those who received large print accommodations (largely students with partial sight) had items L, O, P, T, Y, Z, and AA indicated as problematic. Finally, students who received ASL translation services had items D, J, K, N, and P as their potentially problematic items. The large number of potentially problematic items for accommodations users may indicate that issues are present when the test is presented in accommodated formats. Accommodations data demonstrated that items K, O, AA, and DD were potentially problematic for three accommodations groups.
Overall, a variety of items were found to be potentially problematic for disability and accommodations groups, as represented in Table 5. Patterns did emerge, however, especially in 8th grade data where items K and O were found to be problematic across all three secondary analyses.