Thurlow, M., Wiley, H. I., & Bielinski, J. (2003). Going public: What 2000-2001 reports tell us about the performance of students with disabilities (Technical Report 35). Minneapolis, MN: University of Minnesota, National Center on Educational Outcomes. Retrieved [today's date], from the World Wide Web: http://education.umn.edu/NCEO/OnlinePubs/Technical35.htm
Executive Summary
This report is the fifth analysis of state reports conducted by the National Center on Educational Outcomes (NCEO) to examine the extent to which states publicly report information about students with disabilities in statewide assessments. We present descriptions of statewide testing systems and examine whether these systems include participation and performance information for students with disabilities, as indicated by publicly available data. Much of our information was obtained by analyzing states’ Department of Education Web sites. If disaggregated results were not posted, the states were then asked to submit public documents that included these results.
In 1997, the Individuals with Disabilities Education Act (IDEA) mandated that all states publicly report participation and performance information for students with disabilities. According to the law, each state:
makes available to the public, and reports to the public with the same frequency and in the same detail as it reports on the assessment of nondisabled children, the following: (i) The number of children with disabilities participating in regular assessments. (ii) The number of those children participating in alternate assessments. (iii)(I) The performance of those children on regular assessments (beginning not later than July 1, 1998) and on alternate assessments (not later than July 1, 2000), if doing so would be statistically sound and would not result in the disclosure of performance results identifiable to individual children. (II) Data relating to the performance of children described under subclause (I) shall be disaggregated….
The intent of this requirement was clarified further in the Comments section of the regulations:
In order to ensure that students with disabilities are fully included in the accountability benefits of State and district-wide assessments, it is important that the State include results for children with disabilities whenever the State reports results for other children. When a State reports data about State or district-wide assessments at the district or school level for nondisabled children, it also must do the same for children with disabilities.
States seem to have been challenged by these requirements. Previous analyses of public reports showed that few states (16 in our last analysis) reported both participation and performance results for students with disabilities on all of their tests. This year the number rose to 28. We found that another 16 states reported test results for students with disabilities on at lease some of their state assessments. This number was similar to last year’s count of 15 states. Thus, a total of 44 states reported participation or performance for at least some state tests administered in 2000-2001, compared to the 31 states that did so for their 1999-2000 assessments. States that report disaggregated performance results tended to also report disaggregated participation results. Only four states that reported performance results for all their tests did not also report participation data.
States varied in the ways in which they reported participation. Most states reported the number of students with disabilities who were tested. Ten states went beyond the federal requirements to report participation rates. Two more states reported enough numerical information to calculate participation rates. In addition to indicating which states reported on participation and performance, in this report we also include figures showing actual performance of students with disabilities from those states that had three-year performance trend data available. The results clearly show the achievement gap between special education students and other students, and the graphs indicate that the ways in which states present trend data suggest that the size of the gap increases as grade level increases.
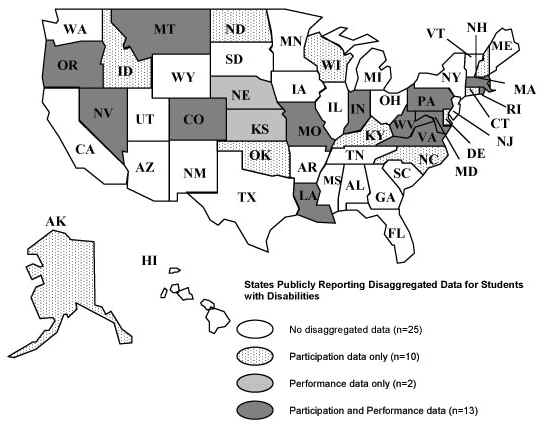
Many states are beginning to report on the alternate assessment for students with disabilities who are not able to take the general assessment, even with accommodations. Thirteen states publicly reported both participation and performance results for their alternate assessment. An additional ten states reported participation only, and two states reported performance only. When asked about their alternate assessment, many Directors of Assessment and Directors of Special Education explained that they were working on making their assessment more reliable and more effective.
Based on our analysis of assessment data, we present the following recommendations for more effective and informative reporting:
Provide data in a timely manner – no more than 6 months after test administration.
Establish reporting practices consistent with IDEA 97, which includes disaggregation of data for all assessments for which the performance of general education students is reported as well as for alternate assessments.
Report participation rates for students with disabilities based on test day enrollment, and clarify who is included every time data are reported.
Report the number and percent of students with disabilities using accommodations.
Report disaggregated performance results for all subgroups in the same data table.
Post all Web-based assessment results under a clear heading and post results for students with disabilities in the same place as results for all students.
Overview
In 1997 the National Center on Educational Outcomes (NCEO) began collecting data on the extent to which states publicly reported participation and performance information about students with disabilities on their statewide assessments. This effort arose in part because of the recognition that the exclusion of students with disabilities from statewide assessments produces an inaccurate picture of how well public education is working for all students (Thurlow, House, Boys, Scott, & Ysseldyke, 2000; Thurlow, Ysseldyke, Erickson, & Elliott, 1997). Similarly, if students participate in statewide assessments, but their assessment results are not reported, the quality of education these students receive is jeopardized (Elliott, Thurlow, & Ysseldyke, 1996). When results are not made publicly available, teachers and administrators feel less pressure to ensure that students with disabilities are making adequate progress.
Despite the importance of public reporting, there is a surprising lack of information or research on public data reporting (Thompson, Thurlow, & Lazarus, 2001). In their search, Thompson et al. found that some literature did address school improvement and state data requirements, but not research-based information on the ways in which data can be presented in performance reports.
Thurlow, Quenemoen, Thompson, and Lehr (2001) focused on reporting in one of six principles of inclusive assessment and accountability systems: "Principle 3. All students with disabilities are included when student scores are publicly reported, in the same frequency and format as all other students, whether they participate with or without accommodations, or in an alternate assessment" (p.3). This principle is further delineated through four characteristics that clarify how all students are reflected in reports, even those who might not achieve scores that can be calculated.
Federal regulations also address the importance of publicly reporting information about students with disabilities. The 1997 Individuals with Disabilities Education Act (IDEA) required that each state:
makes available to the public, and reports to the public with the same frequency and in the same detail as it reports on the assessment of nondisabled children, the following: (i) The number of children with disabilities participating in regular assessments. (ii) The number of those children participating in alternate assessments. (iii)(I) The performance of those children on regular assessments (beginning not later than July 1, 1998) and on alternate assessments (not later than July 1, 2000), if doing so would be statistically sound and would not result in the disclosure of performance results identifiable to individual children. (II) Data relating to the performance of children described under subclause (I) shall be disaggregated….
The intent of this requirement was clarified further in the Comments section of the regulations:
In order to ensure that students with disabilities are fully included in the accountability benefits of State and district-wide assessments, it is important that the State include results for children with disabilities whenever the State reports results for other children. When a State reports data about State or district-wide assessments at the district or school level for nondisabled children, it also must do the same for children with disabilities.
This requirement was in response, in part, to findings of nonparticipation in assessments. For example, in 1992, only 19 states reported assessment information, with most reporting participation rates of less than 10% of students with disabilities (Shriner & Thurlow, 1992). As time passed, more states began reporting participation information, and then the numbers of states reporting performance information also increased (Bielinski, Thurlow, Callender, & Bolt, 2001; Thurlow, Langenfeld, Nelson, Shin, & Coleman, 1998; Ysseldyke, Thurlow, Langenfeld, Nelson, Teelucksingh, & Seyfarth, 1998).
These reports reveal that each year since 1997, more states have reported disaggregated data for students with disabilities along with the data for the total student population. When data collection began in 1997, only 11 states provided disaggregated performance data for students with disabilities and 30 states provided disaggregated participation information (Thurlow, Nelson, Teelucksingh, & Ysseldyke, 2000). The numbers have slowly grown across the years, to the point that for 1999-2000 assessments (Bielinski et al., 2001), 31 states reported participation and performance data for at least one of their general statewide assessments.
Our analyses of 2000-2001 assessments added an examination of alternate assessment participation and performance results. Because these assessments were to be developed, implemented, and results reported by July 2000, we expected 2000-2001 to be the first year in which results would to appear on states’ Web sites and in printed reports.
Study Procedures
Previous studies had shown us that states are increasingly using Web sites to make assessment data available to the public more quickly than is possible with paper reports; thus, we began our data collection process by reviewing each state’s Department of Education Web site. We started collecting data in the fall of 2001 and continued until May of 2002, focusing our efforts on assessments given during the 2000-2001 school year. When we started, many states had already posted their 2000-2001 assessment results in a way that made them easy to locate and clearly presented.
In late January 2002, we mailed a form letter to each state assessment director that outlined our findings for his or her state based on data posted on the Web. Included in this letter was a table that outlined the names of the state’s assessments, the grades and content areas tested, and the availability of disaggregated participation and performance results for students with disabilities (see Appendix A). We requested that if the information we had was incomplete or incorrect, the states should send us the correct information or changes to the information before February 22, 2002. Because we were collecting data in the form in which they were publicly reported, many states mailed us printed reports of the assessment results. Other states gave us dates by which the results would be posted online. We then e-mailed or called states for which we still had not found or been sent disaggregated results on any of their assessments. Overall, only one state did not respond to e-mails or phone messages. We set May 31, 2002 as the deadline after which we would no longer accept information. This date gave states a full year to compile their assessment results.
In order to ensure that our findings were as accurate as possible, we followed up these efforts with a letter to each state’s Director of Special Education. Letters were mailed to the 23 states for whom we had at least one missing piece of disaggregated data. These letters, mailed on September 4, 2002, asked the Directors to review the information and to alert us to any incorrect information by September 20, 2002. The letter sent to Directors of Special Education is included in Appendix B. Of the 23 states to which we sent letters, 12 responded with either corrections or to verify that we were correct.
In May we mailed a letter to every director of assessment and asked whether his or her state had reported data on an alternate assessment administered to students during the 2000-2001 school year (see Appendix C). We received 28 responses. We then examined the state Web sites of those states from which we did not receive a response. If we found no publicly reported participation and performance results, we assumed that they did not report this information.
Characteristics of State Assessment Systems
Appendix D lists all the state mandated general assessments we were able to identify for the 50 states. This list includes the state, the name of the test, the grades and content areas tested, and whether the state had publicly available disaggregated participation and performance information for students with disabilities for their 2000-2001 assessments. We identified 118 separate statewide tests or testing systems. Thirty-six states had more than one assessment. All of the states now have a state mandated assessment (although Iowa’s has voluntary participation, compared to last year in which both Iowa and Nebraska did not).
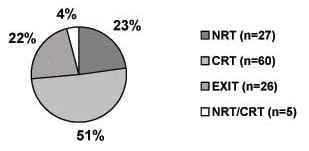
Figure 1 breaks down the 118 testing systems by type: norm-referenced tests (NRT), criterion-referenced tests (CRT), exit tests used as a gate for graduation or earning a particular type of diploma (EXIT), and tests that combined standardized NRTs with additional state-developed test items (NRT/CRT). While it is recognized that exit exams may also be NRTs, CRTs, or both, the high stakes consequences for students on these exit exams indicated a need to examine these tests separately.
Figure 1. Types of General Assessments
States Reporting Disaggregated 2000-2001 General Assessment Data for Students with Disabilities
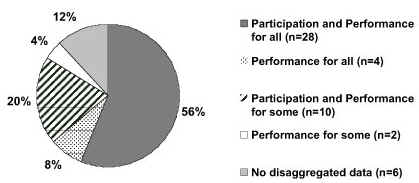
Figure 2 summarizes the different ways general assessment data were reported by states. Fifty-six percent of states reported disaggregated participation and performance information for all their assessments, 8 percent reported performance for all assessments (but not participation data), 20 percent reported participation and performance for some assessments, 4 percent reported only performance for some assessments, and 12 percent did not report any disaggregated information.
Figure 3 indicates which of the 50 states: (1) reported participation and performance for all of their general state assessments (56%), (2) reported performance results on all general assessments, but not participation data (8%), (3) reported performance and participation for some of their general assessments (20%), (4) reported performance results for some of their general assessments, but not participation data (4%), and (5) did not report either participation or performance results for any of their general assessments (12%). States that reported disaggregated data for students with disabilities at the state level generally reported results at the district and school levels too.
Figure 2. States that Disaggregate General Assessment Results for Students with Disabilities
Twenty-eight states reported test participation and performance results for students with disabilities on all of their tests. As evident in Figure 3, there is no geographic pattern to these states. They are located on both coasts, in the middle, in the north, and in the south. They are states with both large and small student populations. The states that reported disaggregated 2000-2001 participation and performance data for their general assessments did so regardless of whether they had one assessment or multiple assessments (18 of the 28 states had more than one assessment), and regardless of whether they tested in just a few grades or in as many as 10 grades.
Figure 3. States that Report 2000-2001 Disaggregated Results for Students with Disabilities
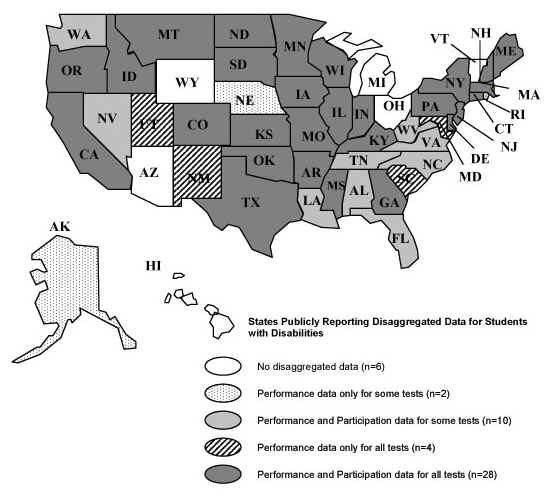
Ten states reported participation and performance on some, but not all of their general assessments. In most instances, these states did not have participation or performance results on at least one of their tests. Six states (Alabama, Florida, Louisiana, Rhode Island, Washington, West Virginia) were missing participation and performance information on only one test. Each state had a total of two to four assessments.
Results from Web-based General Assessment Reports
Before asking states to send us printed reports, we examined each state’s Department of Education Web site for disaggregated participation and performance information. We looked for seven types of information:
Gave participation number
Gave participation rate, such as the percent who participated
Gave enrollment so a rate could be calculated
Gave rate with a definition of how the rate was calculated
Gave the percent of students who were proficient
Gave a definition of "proficiency"
What is reported (e.g., percent passing, percentile rank, etc.)
Some of the criteria we used reflect the same concepts with increasing levels of detail (e.g., gave participation number and gave participation rate such as the percent of student with disabilities who participated). Appendix E shows the details of our findings.
After reviewing states’ Department of Education Web sites, we found four states (Connecticut, Hawaii, Nevada, Rhode Island) that did not have 2000-2001 test results posted by May 31, 2002. Of the 46 states that did post results, 31 posted disaggregated results for students with disabilities on at least some of their assessments.
The majority of states that posted disaggregated results online posted the number of students who participated in the assessment. However, it is likely that most visitors to Web sites will be interested in participation "rates." People want to know whether all, most, some, or just a small percent of students were tested; testing rates provide a useful context for interpreting results. Of the 50 assessments that had a participation number, 7 also gave that number as a rate, such as the percentage of students tested. Seven assessments had an enrollment count so that a rate could be calculated, though four of those overlapped with assessments that already provided a rate. Only one state (California) specified that the rate was calculated based on the number of students enrolled on the day of testing. This is generally considered to be the best method because it clearly depicts what percentage of all the students were tested (Erickson, Ysseldyke, & Thurlow, 1997).
Almost all of the assessment results posted online stated either the number or percent of students who were proficient or gave a percentile rank score. For 48 assessments, results were reported as a percentage proficient or a proficiency level; for 13 assessments, scores were reported as a percentile rank (PR) or national percentile rank (NPR). One state (Montana’s ITBS/ITED) reported both proficiency levels and a percentile rank. However, of those 49 assessments (including Montana’s) for which a percentage was reported, only 23 provided a definition of proficiency by breaking student performance down into proficiency levels greater than just proficient and not proficient. Many states used a spectrum with qualifiers, such as below basic, basic, proficient, and advanced. States that only gave a percentile rank were not considered to provide a definition of proficiency unless they specified that students scoring above a certain percentile rank were considered proficient. Of those assessments with results in the form of a percentile rank, only Montana took the percentile rank and transformed it into proficiency levels. California did divide its SAT-9 and SABE/2 into three levels (25th, 50th, and 75th percentile) but did not specify which level was considered proficient.
Quality of Web-based Reports
Our extensive review of all states’ Department of Education Web sites revealed that some states presented data in a more accessible format than other states. Because most states are reporting test results on the Web, and because there is a wide range in accessibility and clarity of data, it is appropriate now to evaluate states’ Web-based reporting of disaggregated data for students with disabilities. The focus of the evaluation is on the clarity of the posted results (e.g., how easy disaggregated results are to find, how easy they are to understand). Because states regularly modify their Web-based reporting, it is possible that some of our findings no longer hold true.
To describe what we found, we identified the elements that we would like to see on a Web site. The following three criteria were evaluated (see Appendix F):
The word(s) on which one must click on the Department of Education’s Homepage
How many steps, or "clicks," it took to get from the state’s Homepage to the disaggregated results
The proximity of special education data to regular education/all students data
In order to find disaggregated information on the Web, one must follow a series of steps or "clicks." The search begins by clicking on a word or phrase posted on the state’s Department of Education Homepage. Many states used clearly defined words, such as "Assessment" or "Test Results." On some states’ Web sites, the user is required to click on the specific test name, such as "MSPAP" or "STAR-Stanford 9" to access the data. Still others had more obscure phrases such as "Reports," "Publications and Newsletters," and "Divisions and Units" as the first step in accessing test results from the Homepage. Some of the labels were easy to identify because they were near the top of the page and in large print, whereas others were difficult to identify because they were in small print or required scrolling far down the Web page. Larger sized words that clearly indicated assessment results provided the clearest first step to finding disaggregated results.
To get from a Department of Education Homepage to disaggregated participation and performance results, it is necessary to follow several "clicks" that lead through a series of Web pages. The number of clicks it took to get from the Homepage to the actual data ranged from 2 to 7 clicks. The most common number of clicks between the Homepage and the disaggregated data was 3. Figure 4 shows the range of steps required to find assessment results on Web sites, starting from the Homepage. The numbers reflect tests (total n = 62), not states, for which we found disaggregated test performance results. We found that the more clicks it took to reach the data, the easier it was to get lost along the way and the more difficult it was to find the results again at a later time.
Figure 4: The Number of "Clicks" from the Homepage to the Disaggregated Data

We also examined the proximity of special education data to the data of general education students and the total population of students. States that had the most comprehensive presentation of data posted disaggregated results either with, or clearly linked to, results for all students. Figure 5 illustrates the range of distances that results for students with disabilities were from results for general education students or the total population of students. This figure is based on the total number of tests (n = 62), not the number of states. As is evident in the figure, over half of the general assessments had results for students with disabilities on the same page with results for general education students or the total population of students.
Figure 5: Proximity of Special Education Data to Data for All Students or Regular Education
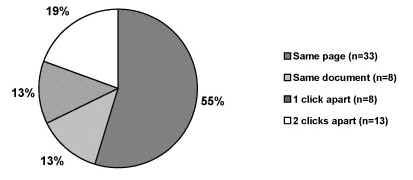
Of all the assessments with Web-based disaggregated data, 55% had results posted for all students on the same page as results for students with disabilities. Another 13% of assessments had the special education data on a Web site one click from the page on which the general education or total student population data were presented. Another 19% of the assessments required two clicks to get from the results for all students to the results for students with disabilities. For 13% of the assessments, a paper report was scanned onto the Internet, and both the special education data and the general education or total student population data were in the report, though not always on the same page.
States such as Colorado and Missouri presented particularly clear results. On their Homepages, assessment results were clearly labeled ("Assessment" and "Student Assessment/MAP," respectively) and clicking on these labels brought up a new Web page that had a list of testing years. Missouri specifically indicated that the results contained disaggregated data by labeling results, for example "Spring 01’ Disaggregated Data." Both of these states required only two clicks to move from the Homepage to the disaggregated data. Colorado presented disaggregated results for students with disabilities in a table along with results for all students. Missouri had separate tables for disaggregated results; results for all students were 2 clicks away from those.
Several states posted assessment results in more than one place on their Web sites and sometimes test results were reported differently in these locations. For instance, in one location a state may report results in the aggregate only, but in another place, the disaggregated results are posted. A person looking for disaggregated test results might click on the label "test results" and find only aggregated results or links to aggregated results. The link to disaggregated results might be on the same page but under a different, less obvious heading. For example, on one state’s Homepage, clicking on the heading "Stanford 9" leads to only aggregated results for that test, whereas clicking on another heading, "OEA Report Card" leads to disaggregated results for the Stanford 9. These situations may lead to the erroneous conclusion that the state did not report disaggregated results.
States Reporting 2000-2001 Alternate Assessment Data for Students with Disabilities
As shown in Figure 6, results from our mailing and from Web searches revealed that 13 states publicly reported both participation and performance results for their alternate assessments. An additional 10 states reported participation only, and 2 states reported performance only. Thus, 50% of states did not publicly report information about the alternate assessment, and the remaining 50% of states did report some type of information about their alternate assessment. Twenty-four percent of states reported both participation and performance for their alternate assessment. In responding to our mailing, many states indicated that they expect to report results next year after the alternate assessment becomes more reliable and all the "kinks" have been ironed out.
Figure 6. Information States Reported for their Alternate Assessment

Figure 7 illustrates which states reported alternate assessment participation and performance data. As with the general assessment data, there is no obvious geographic pattern to the states that did or did not report alternate assessment data.
Figure 7: States Publicly Reporting Data for the 2000-2001 Alternate Assessment
Three of the states that responded to our letter about the availability of alternate assessment data either in public reports or on Web sites indicated that they did not report alternate assessment participation results because fewer than 200 students in the state participated in the alternate assessment. These three states (Arkansas, Nebraska, and Wyoming) noted that 200 is the number reflected in their states’ confidentiality laws as the smallest number of students on which participation data can be reported at the state level.
General Assessment Participation Results
Among the states identified as reporting
disaggregated participation data on at least some tests, participation data were
reported in a variety of ways (see Appendix G). Figure 8 illustrates the number
of assessments with disaggregated participation data reported in particular
ways. As before, information is presented here according to assessment, not
state. For example, in Texas there are four tests, and each is counted
separately. Not all states are consistent in their reporting from one assessment
to another; thus, counting by assessments is a more delineated reflection of
reporting practices.
Figure 8. Participation Reporting Approaches (Number of Tests=76)

Sixty-three assessments had a count with only the number of students with disabilities or special education students tested. For one assessment, only the percentage of all enrolled students with disabilities who were tested was reported. For 11 assessments both the number of students with disabilities tested and the percent tested were reported. For 7 assessments, information about students who were not tested was provided. Students absent was given in 4 states. The number or percent of students with disabilities exempted or excluded also was provided in 9 states.
Most states provided participation data according to grade and content area tested. A few states provided more detailed disaggregated data. Some states disaggregated participation information by disability category (Colorado, North Carolina, and Virginia), while others also provided participation data by accommodated conditions (Colorado, Indiana, Kansas, Kentucky, Missouri, Minnesota, New Hampshire, Texas, and West Virginia).
Figure 9 illustrates participation rates reported in those states with clear participation reporting of rate information. While it may have been possible to calculate participation rates for other states as well, using the information that was reported, the problem of clarity arose. Because states used different terms, they did not always provide a clear definition of who was represented in the participation results, and we chose not to include them in this figure. For instance, Washington reported the percent of students in special education that were "exempt" as well as the percent of students in special education "not tested." Other states only reported a single exclusion rate, such as the percent of students with disabilities "exempted" or "not tested." It is possible that these terms have different meanings in different states. The best way for a state to calculate a rate is to use the number of students with disabilities tested divided by the total number of students with disabilities as given in the December 1st Child Count data (Ysseldyke et al., 1998).
Figure 9: Percentages of Students with Disabilities Participating in General Assessments in Those States with Clear Participation Reporting of Rates
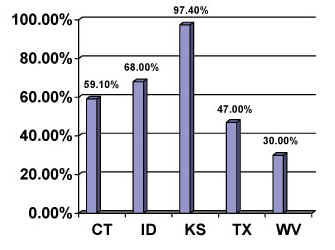
For purposes of summarizing participation rate information, we selected one grade to portray in Figure 9. In most states, participation in the middle school/junior high school math test was used. If the state tested in more than one grade in middle school, 8th grade data were used. For West Virginia, participation rates for students with disabilities who were considered to have participated in a standard administration of the test included all of those students across grades 3-11 (i.e., data were not disaggregated by grade). Rates are the number of students with disabilities tested divided by the total number of students with disabilities.
It is important to note that the results in Figure 9 were obtained from different types of tests that are being used in these states. The data reflect the variability in participation rates among those states that actually reported it and do not take into account the nature or purposes of the tests. Participation rates for the five states ranged from 30.0% to 97.4% for their 2000-2001 general assessments. Only one of the five states reported at least a 70% participation rate for its general assessment at the middle school/junior high school level; three states had at least a 50% participation rate.
General Assessment Performance Results
In addition to documenting the extent to which states reported the participation and performance of students with disabilities for their 2000-2001 assessments, we examined the reported performance levels of students with disabilities participating in statewide assessments. It is important to remember that the scores from each state are based on different tests; these tests may emphasize different standards and are likely to differ in difficulty. In addition, there is great variability across states in terms of the percentages of students with disabilities who are included in the assessments. Thus, it is not appropriate to compare performance across states. Despite these caveats, it is important to examine the performance of students with disabilities relative to the performance of all students within each state.
As indicated in Appendix D, some states only have one assessment within their assessment system whereas others have as many as nine. The results summarized here help to provide a snapshot of all the states’ assessments, the grade and content in which they are given, and whether performance data are publicly reported for students with disabilities.
We summarized reading and mathematics results because these content domains are the ones in which most states have assessments. We also separated the results by grade level (elementary, middle school, high school), and purpose of test (exit exam). Although it is not always clear how the results are used by the state, all tests were treated as school accountability tests except those with a name that indicated the test was an exit exam.
Although we organized our results by three school levels, elementary including grades 3-5, middle including grades 6-8, and high school including grades 9-12, our summary presents the results of only one grade for each level. Whenever possible, 4th grade was used to represent the elementary level, 8th grade to represent the middle school level, and 10th grade to represent the high school level. These grades were chosen because they are the grades at which the largest numbers of states test students. If a state does not assess children at those grades, then the grade below that level was selected (e.g., grade 3 was selected if grade 4 data were not available). If neither of those grades was available, then the other remaining grade was used (e.g., grade 5 for elementary if there is no grade 4 or 3).
Reading Tests
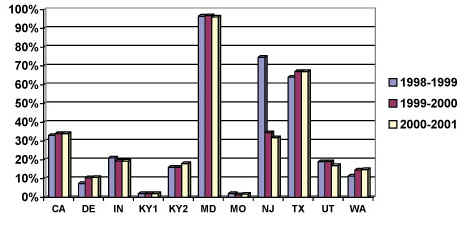
As in previous analyses, we wanted to examine the percentages of students with disabilities who were proficient on the states’ reading assessments. Results were compiled using data from the past three academic years (1998-1999, 1999-2000, and 2000-2001). We only included states that had three years of data for which the grade levels and assessments were the same. The three years of data were drawn from previous NCEO studies and any trend data on states’ Web sites. While the majority of states had three years of data for only one test, Kentucky had data for both the Core Content Test (criterion-referenced) and the CTBS/5 (norm-referenced). Therefore, we noted the Core Content Test as KY1 and the CTBS/5 as KY2 in our figures. Appendix H includes a list of the specific tests used for this analysis.
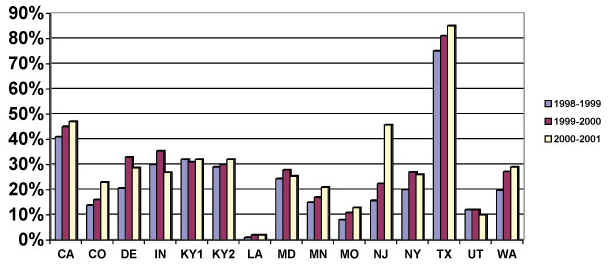
For the 15 sets of data for which we have
three years of elementary reading performance data (see Figure 10), eight
assessments (Colorado, California, Kentucky’s CTBS/5, Minnesota, Missouri, New
Jersey, Texas, Washington) showed consistent increases in student performance.
Louisiana increased by 1% from 1998-1999 to 1999-2000, but then stayed the same
the next year. The remaining six sets of data fluctuated, with results going up
and down. Of these six sets, three assessments (Delaware, Maryland, New York)
had increased their percent proficient when 2000-2001 was compared to 1998-1999,
two (Indiana, Utah) had reduced numbers of students who were proficient, and one
(Kentucky’s CCT) was the same when the two years were compared. Of the sets of
data with increases, most were moderate (between 6 and 10 percentage points),
but New Jersey’s assessment showed a dramatic increase, with the percent
proficient rising from 15.7% in 1998-1999 to 45.7% in 2000-2001.
Figure 10. Percent of Students with Disabilities Achieving Proficiency in Elementary School Reading
Of the 15 sets of data for which we have middle school reading data (see Figure 11), only 6 assessments (Colorado, California, Delaware, Maryland, Missouri, Texas) showed consistent increases across the three years. Texas’ increase was the most dramatic, going from 63% in 1998-1999 to 76% in 2000-2001. One set of data (Louisiana) remained the same over three years, and three sets of data (Indiana, New Jersey, and Washington) consistently decreased over three years, although for Washington, the decreases were minimal. The remaining five sets of data (Kentucky’s CCT, Kentucky’s CTBS/5, Minnesota, New York, Utah) went up one year and down another. When performance in 2000-2001 was compared to 1998-1999 in the five sets of data, performance went up in three (Kentucky’s CCT, Kentucky’s CTBS/5, Minnesota), and was the same in two (New York, Utah).
Figure 11. Percent of Students with Disabilities Achieving Proficiency in Middle School Reading
At the high school level (see Figure 12), performance results across three years were collected for 11 sets of data. Two sets of data (Delaware, Washington) showed consistent, though small, increases in the percentage of students with disabilities who were proficient. The percent proficient in these states rose by 3.25% and 3.50% from 1998-1999 to 2000-2001. Of all the sets of data, most changes were minimal, except for New Jersey where results fell 42.8% from 1998-1999 to 2000-2001. Of the remaining eight sets of data with mixed results, four assessments (Indiana, Maryland, Missouri, Utah) had decreases in performance after three years, the largest decrease being only two percentage points in Utah. Three sets of data (California, Kentucky’s CTBS/5, Texas) increased after three years, with the largest increase being only three percentage points (Texas). Kentucky’s CCT was the same for all three years. All of these tests are criterion-referenced tests except for California, Kentucky2, and Utah, which are norm-referenced.
Figure 12. Percent of Students with Disabilities Achieving Proficiency in High School Reading
Mathematics Tests
Similar to our analyses in reading, we examined the percentages of students with disabilities who were proficient on the states’ mathematics assessments for the three years 1998-1999, 1999-2000, and 2000-2001. Again, the states were the ones for which we had publicly available performance data for those three years. Because Kentucky had three years of data for two assessments, we noted the Core Content Test as KY1 and the CTBS/5 as KY2. Appendix H includes a list of the specific tests used for this analysis.
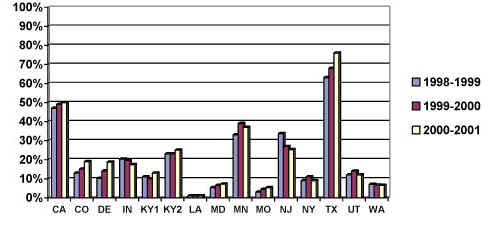
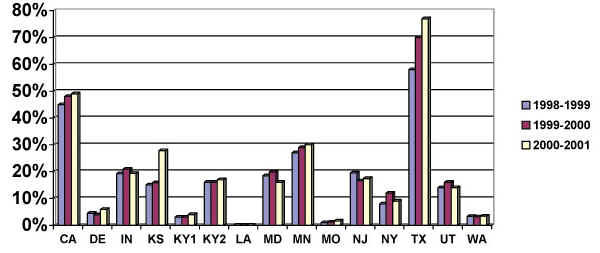
Elementary math data were available for 15 sets of data (see Figure 13). Of these, 9 assessments (California, Kansas, Kentucky’s CCT, Kentucky’s CTBS/5, Minnesota, Missouri, New York, Texas, Washington) showed consistent increases in the percentage of students with disabilities who were proficient based on a comparison of 2000-2001 to 1998-1999. The largest increase was in Kansas, where the percent proficient rose 17.4 percentage points from 28.3% to 45.7%. The remaining seven sets of data went up one year and down another year, except for Louisiana, which remained the same from 1998-1999 to 1999-2000, but then increased the next year. Of these fluctuating sets of data, three assessments (Delaware, New Jersey, New York) showed overall increases and three (Indiana, Maryland, Utah) showed overall decreases. The largest decrease was in Maryland, where the percent fell from 27% in 1998-1999 to 20.7% in 2000-2001.
Figure 13. Percent of Students with Disabilities Achieving Proficiency in Elementary School Mathematics

Fifteen sets of data had three years of performance results for middle school math assessments (see Figure 14). Performance for five sets of data (California, Kansas, Minnesota, Missouri, Texas) increased consistently over the three years, whereas one set of data (Louisiana) remained the same each year, with 0% proficient. The highest consistent increase was a total of 19 percentage points in Texas. The remaining nine sets of data went up one year and down the other year. Of those nine sets of data, when 2000-2001 was compared to 1998-1999, six assessments (Delaware, Indiana, Kentucky’s CCT, Kentucky’s CTBS/5, New York, Washington) showed increased performance, though the highest increase was only 1.45%. Two sets of data decreased (Maryland, New Jersey), with the largest decrease being 2.4 percentage points in Maryland. One set of data (Utah) did not show a change in its percent proficient from 1998-1999 to 2000-2001.
Figure 14. Percent of Students with Disabilities Achieving Proficiency in Middle School Mathematics
Twelve sets of data had rates for high school math test proficiency (see Figure 15). Of these, 4 (Delaware, Indiana, Kansas, Texas) had rates that rose consistently over the three-year period, and one (New Jersey) had rates that decreased consistently. The highest increase was in Texas where rates rose 16 percentage points from 1998-1999 to 2000-2001, and the largest decrease was in New Jersey where the rate fell 45.3 percentage points. Both Utah and Kentucky’s CCT had rates that remained the same each year of the three-year period. Five sets of data (California, Kentucky’s CTBS/5, Maryland, Missouri, Washington) had mixed results, yet 4 (California, Kentucky’s CTBS/5, Missouri, Washington) of those had slightly higher rates after three years.
Figure 15. Percent of Students with Disabilities Achieving Proficiency in High School Mathematics

Exit Exam Results
States administer exit exams in different grades; the grade level in which each is administered is given in Appendix H. In examining the exit exam data for students with disabilities, we looked only that those states for which we had three years of data for the same test and grade.
Results for reading exit exams are shown in Figure 16. As is evident in this figure, results varied across the four states for which three years of exit exam data were available. Still, in none of the four states did the percent passing increase consistently across the three years. The percentage passing in Maryland rose by .3% and then fell .7%, and in Texas it rose 3% from 1998-1999 to 1999-2000, but then did not rise any farther the following year. Indiana fell by 1.7% the first year, and then held constant. The percent of students passing in New Jersey fell continuously over the course of the three-year period.
Figure 16. Percent of Students with Disabilities Achieving Proficiency on the Reading Exit Exam
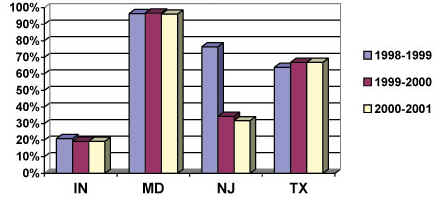
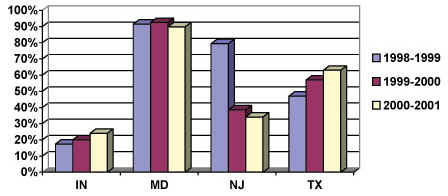
Figure 17 shows the math exit exam performance of students with disabilities in the four states for which data were available across three years. For the mathematics exit exams in the four states, there were some increases and some decreases across years. For example, the percent passing in Indiana and Texas rose steadily from 1998-1999 to 2000-2001. The percent passing in Maryland rose 1% from 1998-1999 to 1999-2000 and then fell 2.7%. The percent of students passing in New Jersey fell steadily across the three years.
Figure 17. Percent of Students with Disabilities Achieving Proficiency on the Mathematics Exit Exam
Discussion
This fifth analysis of state education public reporting shows that states have made much progress in their public reporting for students with disabilities. Nevertheless, we expected to see all states with statewide assessments reporting data on their general assessments, and most reporting on their alternate assessments.
A total of 44 states reported some assessment information for their general statewide assessments administered in 2000-2001; 28 of these reported both participation and performance data for students with disabilities on all of their general assessments. The 28 states is considerably higher than the 16 states that reported both participation and performance data on their 1999-2000 general assessments. The number of states reporting participation or performance on some of their general assessments, of course, was considerably higher at 44 states. This number is close to the 50 states that reported assessment data on at least some of their 2000-2001 general assessments in their most recent biennial performance reports to the U.S. Secretary of Education (Thurlow, Wiley, & Bielinski, 2002).
Public reporting on alternate assessments is another matter. The fact that only 25 states reported any alternate assessment data (either participation or performance) speaks both to the fact that the development of the assessments took longer than expected in some states and perhaps to the fact that it is more challenging for states to get alternate assessment results into the queue for public reporting. Only 13 states reported both participation and performance data for their alternate assessments, compared to the 28 states that reported both participation and performance data for all of their general assessments. It was also interesting to note that three states indicated that they did not report alternate assessment results because fewer than 200 students participated in the alternate assessment – apparently 200 is the number reflected in their states’ confidentiality laws as the smallest number of students for which data can be reported at the state level. It will be interesting to see how this type of policy plays out in the state plans for the reporting requirements of No Child Left Behind, particularly the requirement to define minimum subgroup sizes for reporting and accountability (see Linn, Baker, & Herman, 2002).
In terms of performance data that are reported for general assessments, we chose to look at those states that had three years of data on the same assessments in the same grades. These analyses highlight the variability from year to year. Performance data are variable, regardless of the content area or the school level. We also saw the lower levels of performance in higher grades compared to lower grades. Because the special education population is not static, higher performing students might be transitioned back into regular education while lower performing regular education students might enter special education. It is somewhat surprising, therefore, that states have not highlighted the complications of reporting trend information for their special education population (Bielinski & Ysseldyke, 2002). As Bielinski and Ysseldyke (2000) note, "Failure to document and account for changes in students’ special education status and previous exemption rates from testing could result in misinterpretations about the effectiveness of special education services."
For the first time this year, we were able to systematically look at the quality of Web reporting. While many states have clearly labeled links from their Department of Education Homepage to disaggregated assessment data, several states present unclear labels and post disaggregated results in a different location from aggregated results. Approximately half of the assessment results were within three clicks from the main Homepage and over half of the assessments posted disaggregated results with results for all students or regular education. We did not analyze alternate assessment data in the same ways that we did general assessment data. In another year, when many more states are publicly reporting these data, we will examine both the participation and performance information that is reported.
The 2001 federal reauthorization of the Elementary and Secondary Education Act, known as the No Child Left Behind Act (NCLB), requires that by the beginning of the 2003-2004 school year, assessment reports must be completed at the individual student, classroom, district, and state level (Fast, Blank, Potts, & Williams, 2002). Both states and districts must publicly report assessment results before the start of the next school year. This means that many states will need to increase the rate at which assessment results are analyzed and reported. This will undoubtedly lead to more Web-based reporting practices that are faster and less expensive than printing lengthy reports. Because NCLB also holds schools accountable for specific groups of students, as well as overall (Koenig, 2002), states will likely increase their focus on students with disabilities and ensure that a high percentage of these students are participating in the assessment process.
Recommendations for Reporting
Each time we engage in an analysis of states’ public assessment reports, we see progress both in terms of the number of states reporting and in the nature of the reports. Web-based reporting has become prevalent as a reporting vehicle, possibly because it is faster to prepare information for Web reporting than for hard-copy printing. Based on our analyses of both paper and Web reports, we make six recommendations:
1. Provide data in a timely manner – no more than 6 months after test administration. It is evident from our analyses of state reports from all of the states that some states have their data reported much more quickly than other states. There are many variables that affect the speed with which data can be scored, analyzed, and reported back to states, districts, and schools, including the number of students tested, the state’s financial resources to support quick turn-around, etc. With the requirements of No Child Left Behind for timely reporting of assessment results, the need for timely data summaries and disaggregations is even more critical. It is possible that states may decide to change their testing windows rather than try to speed up any more than already the turnaround time for test contractors.
2. Establish reporting practices consistent with IDEA 97, which includes disaggregation of data for all assessments for which the performance of general education students is reported as well as for alternate assessments. According to IDEA, states must report participation and performance for students with disabilities with the same detail and in the same frequency as for nondisabled students. However, our analysis found that only 28 states reported both participation and performance for students with disabilities on all the assessments for which information was provided about nondisabled students. IDEA also requires states to provide students who are not able to take the general assessment with an alternate assessment and to report those results publicly.
3. Report participation rates for students with disabilities based on test day enrollment, and clarify who is included every time data are reported. When states provide the number of students with disabilities tested, the information is less helpful than if the number is presented along with the percentage of students tested. Providing a rate makes it easier to obtain a picture of how many students are participating in general and alternate assessments. It is also important to explain who is being included in the count. When presenting the percentage of students with disabilities tested, some states use the entire student body as the denominator whereas others calculate the rate using the total number of students with disabilities as the denominator. States must specify which students they are using as the denominator and use a count based upon the enrollment on the day of testing.
4. Report the number and percent of students with disabilities using accommodations. Because of various disabilities, many students are not able to take the general assessment in its standard format. Therefore, students are provided with accommodations to compensate for their disability. However, many states separate these scores and consider them to be "non-standard." Some states do not include these scores when they report about student performance. If more than 50% of students with disabilities are taking the assessment under non-standard conditions, this raises questions about the test format. Consideration for revising the test to make it more accessible to students with disabilities is warranted.
5. Report disaggregated performance results for all subgroups in the same data table. Our analysis of Web-based reporting found that 31 states reported information about students with disabilities on-line. However, of the assessments with online results, only 55% of them showed results for students with disabilities on the same page as results for all students. Disaggregated results should be posted in close proximity to results for all students so that the information is easy to locate and to compare with other groups of students.
6. Post all Web-based assessment results under a clear heading and post results for students with disabilities in the same place as results for all students. When searching for assessment information, people often rely on a clear heading to point them in the right direction. Many states do have clear headings with words like "Assessment" or "Test Results." Others, however, have headings that are more obscure or are hidden under broad topics such as "Reports." When links to Web-based results are not clear, the accessibility of the data is compromised. Similarly, when a Homepage has a clear link to aggregated assessment results but an unclear, separate link to disaggregated results, this makes it less likely that people will find the disaggregated information.
References
Bielinski, J., & Ysseldyke, J. (2002). Effect of different methods of reporting and reclassification on trends in test scores for students with disabilities. Exceptional Children, 68, 189-200.
Bielinski, J., & Ysseldyke, J. (2000). Interpreting trends in the performance of special education students (Technical Report 27). Minneapolis, MN: University of Minnesota, National Center on Educational Outcomes.
Bielinski, J., Thurlow, M.L., Callender, S., & Bolt, S. (2001). On the road to accountability: Reporting outcomes for students with disabilities (Technical Report 32). Minneapolis, MN: University of Minnesota, National Center on Educational Outcomes.
Elliott, J.L., Thurlow, M.L., & Ysseldyke, J.E. (1996). Assessment guidelines that maximize the participation of students with disabilities in large-scale assessments: Characterizations and considerations (Synthesis Report 25). Minneapolis, MN: University of Minnesota, National Center on Educational Outcomes.
Erickson, R., Ysseldyke, J., & Thurlow, M. (1997). Neglected numerators, drifting denominators, and fractured fractions: Determining participation rates for students with disabilities. Diagnostique, 23 (2), 105-115.
Fast, E.F., Blank, R.K., Potts, A., & Williams, A. (2002). A guide to effective accountability reporting. Washington, DC, Council of Chief State School Officers.
Koenig, J.A. (2002). Reporting test results for students with disabilities and English-language learners: Summary of a workshop. Washington, DC: National Academy Press.
Linn, R.L., Baker, E.L., & Herman, J.L. (2002, Fall). Minimum group size for measuring adequate yearly progress. The CRESST Line, p. 1.
Shriner, J.G., & Thurlow, M.L. (1992). State special education outcomes 1991. Minneapolis, MN: University of Minnesota, National Center on Educational Outcomes.
Thompson, S.J., Thurlow, M.L., & Lazarus, S. (2001). Reporting on the state assessment performance of students with disabilities (Topical Review No. 3). College Park, MD: University of Maryland, Education Policy Reform Research Institute.
Thurlow, M.L., House, A., Boys, C., Scott, D., & Ysseldyke, J. (2000). State participation and accommodations policies for students with disabilities: 1999 update (Synthesis Report 33). Minneapolis, MN: University of Minnesota, National Center on Educational Outcomes.
Thurlow, M. Quenemoen, R., Thompson, S., & Lehr, C. (2001). Principles and characteristics of inclusive assessment and accountability systems (Synthesis Report 40). Minneapolis, MN: University of Minnesota, National Center on Educational Outcomes.
Thurlow, M.L., Ysseldyke, J.E., Erickson, R.N., & Elliott, J.L. (1997). Increasing the participation of students with disabilities in state and district assessments (Policy Directions 6). Minneapolis, MN: University of Minnesota, National Center on Educational Outcomes.
Thurlow, M.L., Langenfeld, K.L., Nelson, J.R., Shin, H., & Coleman, J.E. (1998). State accountability reports: What are states saying about students with disabilities? (Technical Report 20). Minneapolis, MN: University of Minnesota, National Center on Educational Outcomes.
Thurlow, M.L., Nelson, J.R., Teelucksingh, E., & Ysseldyke, J.E. (2000). Where’s Waldo? A third search for students with disabilities in state accountability reports (Technical Report 25). Minneapolis, MN: University of Minnesota, National Center on Educational Outcomes.
Thurlow, M.L., Wiley, H.I., & Bielinski, J. (2002). Biennial performance reports: 2000-2001 state assessment data. Retrieved February 24, 2003 from University of Minnesota, National Center on Educational Outcomes Web site: http://www.education.umn.edu/nceo/OnlinePubs/BPRsummary2002.doc
Ysseldyke, J.E., Thurlow, M.L., Langenfeld, K., Nelson, J.R., Teelucksingh, E., & Seyfarth, A. (1998). Educational results for students with disabilities: What do the data tell us? (Technical Report 23). Minneapolis, MN: University of Minnesota, National Center on Educational Outcomes.
Appendix A
Verification Letter to State Assessment Director
The National Center on Educational Outcomes is examining how states reported educational results for students with disabilities during the 2000-2001 school year. We have reviewed your state’s Website for both participation and performance data on your statewide assessments. The following table reflects what we believe to be the tests your state administers and the results that we have found thus far on the Web.
Please review the table and verify its accuracy. We will be writing a report using this information. The report will describe how states are reporting test results for students with disabilities. Our goal is to (a) identify all components of each state’s testing system and (b) determine whether each state reports disaggregated test results for students with disabilities. If any data element is inaccurate, please provide us with the public document and/or Website that contains the accurate information. Address your responses to Hilda Ives at the above address.
If you have any questions about our request, please call Hilda Ives at (612) 626-8913 or email:ives0016@umn.edu. If we do not hear from you by Friday, February 22, 2002, we will assume that the data are accurate.
Thank you for taking the time to verify our findings.
Sincerely,
Hilda Ives
Research Assistant
State |
Test |
Grades Tested |
Subject Areas |
Disaggregated Results for students with disabilities |
|
Participation |
Performance |
||||
Direct Assessment of Writing |
5,7 |
Writing |
No info
|
No info
|
|
High School Graduation Exam |
10,11,12 |
Yes |
Yes |
||
SAT-9 |
3-11 |
Yes |
Yes |
||
Appendix B
Letters to State Directors of
Special Education
(Two Forms Depending on Input from Assessment Director)
Letter To States With Results Verified by the Director of Assessment
The National Center on Educational Outcomes is examining how states reported educational results for students with disabilities during the 2000-2001 school year. The following table reflects what we believe to be the tests your state administers and the results that we have found thus far on the Web. These results were verified by your state’s Director of Assessment, but if you have anything to add, please let us know.
We will be writing a report using this information. The report will describe how states are reporting test results for students with disabilities. Our goal is to (a) identify all components of each state’s testing system and (b) determine whether each state reports disaggregated participation and performance results for students with disabilities. If any data element is inaccurate, please provide us with the public document and/or Website that contains the accurate information. Address your responses to Hilda Ives Wiley at the above address.
If you have any questions about our request, please call Hilda Ives Wiley at (612) 626-8913 or email: ives0016@umn.edu. If we do not hear from you by Friday, September 20, 2002, we will assume that the data are accurate.
Thank you for taking the time to verify our findings.
Sincerely,
Hilda Ives Wiley
Research Assistant
Martha Thurlow
Director
John Bielinski
Research Associate
State |
Test |
Grades Tested |
Subject Areas |
Disaggregated Results for students with disabilities |
|
Participation |
Performance |
||||
Direct Assessment of Writing |
5,7 |
Writing |
No info
|
No info
|
|
High School Graduation Exam |
10,11,12 |
Yes |
Yes |
||
SAT-9 |
3-11 |
Yes |
Yes |
||
Letter to States With Results NOT Verified by the Director of Assessment
The National Center on Educational Outcomes is examining how states reported educational results for students with disabilities during the 2000-2001 school year. We have reviewed your state’s Website for both participation and performance data on your statewide assessments. The following table reflects what we believe to be the tests your state administers and the results that we have found thus far on the Web.
Please review the table and verify its accuracy. We will be writing a report using this information. The report will describe how states are reporting test results for students with disabilities. Our goal is to (a) identify all components of each state’s testing system and (b) determine whether each state reports disaggregated participation and performance results for students with disabilities. If any data element is inaccurate, please provide us with the public document and/or Website that contains the accurate information. Address your responses to Hilda Ives Wiley at the above address.
If you have any questions about our request, please call Hilda Ives Wiley at (612) 626-8913 or email: ives0016@umn.edu. If we do not hear from you by Friday, September 20, 2002, we will assume that the data are accurate.
Thank you for taking the time to verify our findings.
Sincerely,
Hilda Ives Wiley
Graduate Research Assistant
Martha Thurlow
Director
John Bielinski
Research Associate
State |
Test |
Grades Tested |
Subject Areas |
Disaggregated Results for students with disabilities |
|
Participation |
Performance |
||||
Direct Assessment of Writing |
5,7 |
Writing |
No info
|
No info
|
|
High School Graduation Exam |
10,11,12 |
Yes |
Yes |
||
SAT-9 |
3-11 |
Yes |
Yes |
||
Appendix C
Letter to State Directors of Special Education about Alternate Assessments
The National Center on Educational Outcomes is examining how states reported results on their Alternate Assessment during the 2000-2001 school year. We would like to know if your state publicly reports participation and performance information for its Alternate Assessment. Please check the following boxes.
Participation: Yes &127; No &127;
Performance: Yes &127; No &127; If you mark yes on either of these, please send us the printed report containing this information or the specific Website on which it is posted. You can mail or fax it to Hilda Ives at the above address. Our report will include the information that you provide. The report will describe how states are reporting Alternate Assessment results for students with disabilities.Please return this by Friday, May 24th.
Thank you, and do not hesitate to contact me with any questions.
Sincerely,
Hilda Ives
Phone: (612) 626-8913
Fax: (612) 624-0879
Email: ives0016@umn.edu
Appendix D
2000-2001 State Assessment Systems and Status of Disaggregated Data
State |
Assessment
Component |
Grades |
Subject |
Disaggregated |
||
Part |
Perf |
|||||
Direct Assessment of Writing [CRT] |
5,7 |
Writing |
No |
No |
||
High School Graduation Exam |
10,11, 12 |
Yes |
Yes |
|||
Stanford Achievement Test, 9th ed. (SAT-9)
[NRT] |
3-11 |
Yes |
Yes |
|||
4,7 |
No |
No |
||||
Benchmark Exams [CRT] |
3,6,8 |
No |
Yes |
|||
High School Graduation Qualifying Exam [EXIT] Class of 2002 must pass portions of exam to receive an
endorsement on diploma |
10 |
No |
Yes |
|||
Stanford Achievement Test, 9th ed. (SAT-9)
[NRT] |
2-11 |
No |
No |
|||
AZ Instrument to Measure Scores (AIMS) [CRT] |
3,5,8 |
No |
No |
|||
AIMS [EXIT] |
10 |
No |
No |
|||
Stanford Achievement Test, 9th ed. (SAT-9)
[NRT] |
5,7,10 |
Complete
|
Yes |
Yes |
||
Benchmark Exams [CRT] |
4,6,8 |
Literacy [ |
Yes |
Yes |
||
Standardized Testing And Reporting Program (STAR) • SAT-9 [NRT] • Spanish Assessment of Basic Education
(SABE/2) [NRT] • Content Standard [CRT] |
2-11 2-11 2-11 |
Spelling (2-8), Science (9-11), Social Science (9-11) Spelling (2-8) English/Language Arts, Math (2-7,11) [Algebra I, II;
Geometry; Integrated 1,2,3 for 8-10] |
Yes Yes Yes |
Yes Yes Yes |
||
CO Student Assessment Program (CSAP) [CRT] |
3-10 |
Reading (3-10), Math (5,8,10), Writing (4,7,10), Science
(8) |
Yes |
Yes |
||
CT Mastery Test (CMT) [CRT] |
4,6,8 |
Math,
|
Yes |
Yes |
||
CT Academic Performance Test (CAPT) [EXIT] |
10 |
Yes |
Yes |
|||
DE Student Testing Program (DSTP) [SAT-9 for R,M with
other criterion measures; [NRT/CRT] |
3-6,8,10,11 |
Yes |
Yes |
|||
FL Comprehensive Assessment Test (FCAT) includes SAT-9 [NRT/CRT] |
3-10 |
Reading (NRT 3-10/CRT 4,8,10), Math (NRT 3-10/CRT 5,8,10), Writing (CRT 4,8,10) |
Yes CRT only |
Yes CRT only |
||
High School Competency Test (HSCT) [EXIT] (for those not exempted by their FCAT performance in 10th
grade ) |
11 |
No |
No |
|||
GA High School Graduation Test (GHSGT) [EXIT] |
11 |
English/Language Arts, Math, Science, Social Studies,
Writing |
Yes |
Yes |
||
Stanford Achievement Test, 9th ed. (SAT-9)
[NRT] |
3,5,8 |
Yes |
Yes |
|||
Criterion-Referenced Competency Tests (CRCT) [CRT] |
4,6,8 |
Yes |
Yes |
|||
Writing Assessment [CRT] |
8 |
Writing |
Yes |
Yes |
||
Stanford Achievement Test, 9th ed. (SAT-9)
[NRT] |
3,5,7,9 |
No test given |
No test given |
|||
ID Direct Assessments [CRT] |
4,8,11 |
Math (4,8), Writing (4,8,11) |
Yes |
Yes |
||
Tests of Achievement and Proficiency (TAP) [NRT] |
3-8 9-11 |
|
Yes (only report grades 4,8, & 11) Yes |
Yes (only report grades 4,8, & 11) Yes |
||
IL Standards Achievement Test (ISAT) [CRT] |
3,4,5,7,8 |
Yes |
Yes |
|||
11 (optional 12th grade re-take) |
Yes |
Yes |
||||
IN Statewide Testing for Educational Progress (ISTEP+)
[NRT/CRT] |
3,6,8 |
Language Arts, Math |
Yes |
Yes |
||
Graduation Qualifying Exam [EXIT] |
10 |
Language Arts, Math |
Yes |
Yes |
||
ITBS/ITED [NRT] (VOLUNTARY participation) |
3-11 |
Yes |
Yes |
|||
KS Assessment System [CRT] |
4-8,10,11 |
Yes |
Yes |
|||
Comprehensive Test of Basic Skills, 5th ed.
(CTBS/5) [NRT] |
3,6,9 |
Yes |
Yes |
|||
KY Core Content Test [CRT] |
4,5,7,8, 10-12 |
Yes |
Yes |
|||
Developmental
|
2,3 |
No |
No |
|||
Graduation Exit Exam- 21 [EXIT] |
10 |
Language Arts, Math |
Yes |
Yes |
||
3,5-7,9 |
Complete
|
Yes |
Yes |
|||
LA Educational Assessment Program (LEAP 21) [CRT] |
4,8 |
English/Language Arts, Math, Science, Social Studies |
Yes |
Yes |
||
4,8,11 |
Yes |
Yes |
||||
MD School Performance Assessment Program (MSPAP) [CRT] |
3,5,8 |
Yes |
Yes |
|||
MD Functional Tests [EXIT] |
9,11 |
Yes |
Yes |
|||
Comprehensive Tests of Basic Skills, 5th ed.
(CTBS/5) [NRT] |
2,4,6 |
No |
Yes |
|||
MA Comprehensive Assessment System (MCAS) [CRT] |
3-8,10 |
Yes |
Yes |
|||
MI Educational Assessment Program (MEAP) [CRT] |
4,5,7,8,11 |
No |
No |
|||
MN Comprehensive Assessment (MCA) [CRT] |
3,5 |
Yes |
Yes |
|||
Basic Standards Exam [EXIT] |
8,10 |
Yes |
Yes |
|||
Grade Level Testing Program ·
Terra Nova
Comprehensive Tests of Basic Skills, 5th
ed.
(CTBS/5) [NRT] ·
MS Curriculum Test (MCT) [CRT] ·
Writing Assessment [CRT] |
3-8 3-8 4,7 |
Writing |
Yes Yes Yes |
Yes Yes Yes |
||
Functional Literacy Exam (FLE) [EXIT] |
11 |
Yes |
Yes |
|||
MO Assessment Program (MAP) (Terra Nova survey) [NRT/CRT] |
3,4,5,7-11 |
Science (3,7,11), Social Studies (4,8,11), Math (4,8,10),
Communication Arts (3,7,11), Heath & Physical Education (5,9) |
Yes |
Yes |
||
Iowa Tests of Basic Skills/ |
4,8,11 |
Yes |
Yes |
|||
4,8,11 |
Writing |
No |
No |
|||
4,8,11 |
No |
Yes |
||||
Terra Nova
Comprehensive Tests of Basic Skills, 5th ed.
(CTBS/5) [NRT] |
4,8,10 |
Yes |
Yes |
|||
Writing Test [CRT] |
4,8 |
Writing |
No |
No |
||
Graduation Exam [EXIT] |
9-12 |
No |
No |
|||
NH Educational Improvement and Assessment Program (NHEIAP)
[CRT] |
3,6,10 |
English Language Arts, Math, Science (6,10), Social
Studies (6,10) |
Yes |
Yes |
||
High School Proficiency Test (HSPT 11) [EXIT] |
11 |
Yes |
Yes |
|||
Grade Eight Proficiency Assessment (GEPA) [CRT] Elementary School Proficiency Assessment (ESPA) [CRT] |
8 4 |
Language Arts/Literacy, Math, Science Language Arts/Literacy, Math, Science |
Yes Yes |
Yes Yes |
||
NM Articulated Assessment Program (NMAAP) (CTBS/5 & other
criterion measures) [NRT/CRT] |
3-9 |
No |
Yes |
|||
NM High School Competency Exam [EXIT] |
10 |
No |
Yes |
|||
NM Writing Assessment Program [CRT] |
4,6 (8 optional) |
Writing |
Yes |
Yes |
||
Occupational Education Proficiency Exams [EXIT] |
9-12 |
Occupational Education |
Yes |
Yes |
||
Regents Comprehensive Exams [EXIT] |
9-12 |
English, Foreign Languages, Math, History/Social Studies,
Science |
Yes |
Yes |
||
Regents Competency Test [EXIT] |
9-12 |
Math, Science, Reading, Writing, Global Studies, US Hist &
Gov’t |
Yes |
Yes |
||
NY State Assessment Program [CRT] |
4,8 |
English/Language Arts, Math, Science |
Yes |
Yes |
||
Iowa Tests of Basic Skills (ITBS) [NRT]:
representative sample |
5,8 |
No |
No |
|||
Testing System Grades 3-8 ·
Gr. 3 Pre-test [CRT] |
3 |
No |
No |
|||
·
End of Grade [CRT] |
3-8 |
Yes |
Yes |
|||
·
Writing test [CRT] |
4,7 |
Writing |
Yes |
Yes |
||
·
Open Ended [CRT] |
4,8 |
No |
No |
|||
·
Computer Skills [CRT] |
8 |
Computer |
Yes |
Yes |
||
Testing System Grade 9 – 12 ·
Competency [EXIT] |
9 |
No |
No |
|||
·
High School Comprehensive Test
[CRT] |
10 |
No |
No |
|||
·
End of Course [CRT] |
9-12 |
Biology, Chemistry, Economics, English I, Physical
Science, |
Yes |
Yes |
||
Comprehensive Tests of Basic Skills (CTBS/5) [NRT] |
4,6,8,10 |
Yes |
Yes |
|||
OH Proficiency Tests [CRT] |
4,6,10,12 |
No |
No |
|||
OH Proficiency Test [EXIT] |
9 |
No |
No |
|||
Core Curriculum Tests [CRT] |
5,8,11 |
Yes |
Yes |
|||
OR State Assessment [CRT] Certificate of Mastery for 10th [EXIT] |
3,5,8,10 |
Reading/Literature, Math, Math Problem Solving (5,8,10),
Writing, Science (8,10) |
Yes |
Yes |
||
PA System of School Assessment (PSSA) [CRT] |
5,6,8,9,11 |
Yes |
Yes |
|||
New Standards Reference Examinations [CRT] RI State Writing Assessment [CRT] RI Health Education Assess [CRT] |
4,8,10 3,7,10 5,9 |
Writing Health |
Yes Yes No |
Yes Yes No |
||
Palmetto Achievement Challenge Tests (PACT) [CRT] |
3-8 |
English/Language Arts, Math |
Yes |
Yes |
||
High School Exit Exam [EXIT] |
10 |
No |
Yes |
|||
Cognitive Skills Assessment |
1 |
Readiness (specific skills listed on printouts) |
No |
Yes |
||
Stanford Achievement Test, 9th ed. (SAT-9)
[NRT] Stanford Writing Assessment [NRT] |
2,4,8,11
5,9 |
Writing |
Yes Yes |
Yes Yes |
||
TN Comprehensive Assessment (TCAP) ·
TCAP Achievement Tests (CTBS/5)
[NRT] ·
Writing Test [CRT] ·
TN Competency Test [EXIT] (being
phased out) ·
Gateway Tests [EXIT] ·
High School Subject Tests [CRT] |
3-8 4,7,11 9-12 9-12 9-12 |
Writing
Math, Language Arts
End-of-course in Algebra I, English II, Biology Math Foundations II |
No Yes No No No |
No Yes No No No |
||
TX Assessment of Academic Skills (TAAS) [CRT] |
3-8 |
Yes |
Yes |
|||
Exit Level TAAS [EXIT] |
10-12 |
Yes |
Yes |
|||
Statewide End-of-Course Tests [CRT] |
9-12 |
Algebra I, English |
Yes |
Yes |
||
Reading Proficiency Tests in English [CRT] |
3-12 |
English Reading Proficiency |
Yes |
Yes |
||
Stanford Achievement Test, 9th ed. (SAT-9)
[NRT] |
3,5,8,11 |
Yes |
Yes |
|||
Core Criterion-Referenced Tests [CRT] |
1-12 |
Language Arts, Math, Science (4-12) |
Yes |
Yes |
||
VT Comprehensive Assessment System [CRT] |
2,4,6,8,10, 11 |
No |
No |
|||
VT Math and Writing Portfolio Assessments [CRT] |
4,5, 8,10 |
Math (4, 8, 10) Writing (5, 8) |
No |
No |
||
Standards of Learning (SOL) [CRT] |
3,5,8 |
English (3), English: Reading/Literature and Research
(5,8), English: Writing (5,8), Math, History, Science, Computer Technology
(5, 8) |
No |
Yes |
||
Standards of Learning [EXIT] |
9-12 (may be taken at an earlier grade if course-work
completed) |
English (9-11), Math (Algebra I, II, & Geometry),
History/Social Science (World History I & II, |
No |
Yes |
||
VA State Assessment Program (VSAP) (SAT-9, Form TA) [NRT] |
4,6,9 |
Yes |
Yes |
|||
Literacy Testing Program’s Literacy Passport Test [EXIT] |
11-12 |
No |
No |
|||
WA Assessment of Student Learning (WASL) [CRT] |
4,7,10 |
Yes |
Yes |
|||
3,6,9 |
No |
No |
||||
Stanford Achievement Test, 9th ed. (SAT-9)
[NRT] |
3-11 |
Basic Skills ( |
Yes |
Yes |
||
WV Writing Assessment [CRT] |
4,7,10 |
Writing |
No |
No |
||
WI Knowledge and Concepts Exam (WKCE) [CRT] |
4,8,10 |
Yes |
Yes |
|||
WI Reading Comprehension Test (WRCT) [CRT] |
3 |
Yes |
Yes |
|||
WY Comprehensive Assessment System (WyCAS) [CRT] |
4,8,11 |
No |
No |
|||
Terra Nova
Comprehensive Tests of Basic Skills, 5th ed. (CTBS/5) [NRT] |
4,8,11 |
No |
No |
|||
Appendix E
Web-based Participation and Performance Information
State |
Test |
Participation |
Performance |
|||||
No. |
Rate |
Gave enroll-ment so rate could be
calcu-lated |
Rate with defin-ition |
What is reported |
Has percent
of students proficient |
Has a definition of proficiency |
||
HS
Graduation Exam |
Yes |
No |
No |
No |
% |
Yes- has %
but no increments |
No |
|
SAT-9 |
Yes |
No |
No |
No |
PR (though
it does not say PR) |
Yes |
No |
|
AK |
HSGQE |
No |
No |
No |
No |
% |
Yes |
No |
Benchmark
Exams |
No |
No |
No |
No |
% |
Yes |
Yes- 2
defined levels |
|
CA |
SAT-9 |
Yes |
No |
No |
No |
PR |
No |
No- 3
levels-25th, 50th, and 75th%, but no
definition of proficiency |
CA
Standards Test |
Yes |
Yes |
Yes |
Yes “% of
total Nov. enrollment” |
% |
Yes |
Yes- 5
defined levels (not for writing section) |
|
SABE/2 |
Yes |
No |
No |
No |
PR |
No |
No- 3
levels-25th, 50th, and 75th %, but no
definition of proficiency |
|
CO |
CSAP |
Yes |
No |
No |
No |
% |
Yes |
Yes- 4
defined levels |
DE |
DSTP |
Yes |
No |
No |
No |
% |
Yes |
Yes- 2
defined levels (% meets or exceeds” and “% below standard). Also gives 5
numbered levels but numbers are not defined. |
GA |
GHSGT |
Yes |
No |
No |
No |
% |
Yes |
Yes- 3
defined levels |
Writing
Assessment |
Yes |
No |
No |
No |
% |
Yes |
Yes- 3
defined levels |
|
CRCT |
Yes |
No |
No |
No |
% |
Yes |
Yes- 3
defined levels |
|
SAT-9 |
Yes |
No |
No |
No |
NPR |
No |
No |
|
ID |
IDA |
Yes |
Yes |
No |
No |
Average
Score |
No |
No |
ITBS |
Yes |
Yes-but
not broken down by grade level |
No |
No |
NPR |
No |
No |
|
IL |
ISAT |
Yes |
No |
Yes |
No |
% |
Yes |
Yes- 4
defined levels |
PSAE |
Yes |
No |
Yes |
No |
% |
Yes |
Yes- 4
defined levels |
|
IN |
ISTEP+ |
Yes |
No |
No |
No |
% |
Yes |
Yes- 2
defined levels |
GQE |
Yes |
No |
No |
No |
% |
Yes |
Yes- 2
defined levels |
|
IA |
ITBS/ITED |
Yes- but
for 2 years |
No |
No |
No |
% |
Yes |
Yes- Gives
number for % performing at or above proficient level |
KS |
KAP |
No |
Yes |
Yes |
No |
% |
Yes |
Yes- 5
defined levels |
KY |
CTBS/5 |
Yes |
No |
No |
No |
NPR |
No |
No |
KCCT |
Yes |
No |
No |
No |
% |
Yes |
Yes- 8
defined levels |
|
MD |
MSPAP |
Yes |
No |
No |
No |
% |
Yes |
Yes- %
Satisfactory |
MFT |
Yes |
No |
No |
No |
% |
Yes |
Yes- %
passing |
|
CTBS/5 |
No |
No |
No |
No |
PR |
No |
No |
|
MA |
MCA |
Yes |
No |
No |
No |
% and raw
score |
Yes |
Yes- 4
defined levels |
MN |
MCA |
Yes |
No |
No |
No |
% |
Yes |
Yes- 4
defined levels |
BSE |
Yes |
No |
No |
No |
% and
Average Scale Score |
Yes |
Yes- %
passing |
|
MS |
CTBS/5 |
Yes |
No |
No |
No |
PR |
No |
No |
MCT |
Yes |
No |
No |
No |
% |
Yes |
Yes- 4
defined levels |
|
FLE |
Yes |
No |
No |
No |
% |
No (only
gives a composite score, not broken down by subject) |
No |
|
Writing
Assessment |
Yes |
No |
No |
No |
% |
No (gives
5 levels but levels are not defined) |
No |
|
MO |
MAP |
Yes |
No |
No |
No |
% |
Yes |
Yes- 5
defined levels |
MT |
ITBS/ITED |
Yes |
No |
Yes |
No |
% and NPR |
Yes |
Yes- 4
defined levels |
NE |
Assessment
of State Reading Standards |
No |
No |
No |
No |
% |
Yes |
Yes- 2
defined levels |
NH |
NHEIAP |
No |
No |
No |
No |
% |
Yes |
Yes- 2
defined levels |
NM |
NM Writing
Assessment |
Yes |
No |
No |
No |
Holistic
score as a % |
Yes |
Yes, but
levels are not defined on that sheet. Definition of what level is proficient
is in introduction. |
NMHSCT |
No |
No |
No |
No |
% and
scale score |
Yes |
Yes |
|
NY |
NYSAP |
Yes |
No |
No |
No |
% |
Yes |
Yes, but 4
levels are not defined on that sheet. Definition of what level is proficient
is in introduction. |
Regents
Comprehensive Exams |
Yes |
No |
No |
No |
% |
Yes |
Yes- %
passing |
|
Regents
Competency Test |
Yes |
No |
No |
No |
% |
Yes |
Yes-%
passing |
|
Occup.
Education Proficiency Exams |
Yes |
No |
No |
No |
% |
Yes |
Yes -%
passing |
|
NC |
NC Writing
Assessment |
Yes |
No |
No |
No |
% and # |
Yes |
No |
End-of-Course |
Yes |
No |
No |
No |
% and # |
Yes |
No |
|
End-of-Grade |
Yes |
No |
No |
No |
% and # |
Yes |
No |
|
Computer
Skills |
Yes |
No |
No |
No |
% and # |
Yes |
No |
|
OK |
CCT |
No |
No |
No |
No |
% |
Yes |
Yes-4
defined levels |
PA |
PSSA |
Yes |
No |
No |
No |
% |
Yes |
Yes-4
defined levels |
SC |
PACT |
Yes |
No |
No |
No |
% |
Yes |
Yes-4
defined levels |
HSEE |
No |
No |
No |
No |
% |
Yes |
Yes-%
meeting standard one level |
|
CSAB |
No |
No |
No |
No |
% |
Yes |
Yes- %
that met the standard |
|
SD |
SAT-9 |
Yes |
No |
No |
No |
NPR |
No |
No |
Stanford
Writing Assessment |
Yes |
No |
No |
No |
PR |
No |
No |
|
UT |
SAT-9 |
Yes |
No |
No |
No |
NPR |
No |
No |
CCRT |
Yes |
No |
No |
No |
% |
Yes |
Yes-4
defined levels |
|
VA |
SOL |
No |
No |
No |
No |
% |
Yes |
Yes-%
passing |
SOL Grad |
No |
No |
No |
No |
% |
Yes |
Yes-%
passing |
|
VSAP
(SAT-9) |
Yes |
No |
No |
No |
NPR and
Mean Scaled Scores |
No |
No |
|
WA |
WASL |
Yes |
Yes (but
unclear because gave both % not tested and % exempt |
No |
No |
% |
Yes |
Yes- 4
defined levels |
WI |
WKCE |
Yes |
Yes- but
gives % not assessed rather than % assessed |
Yes |
No |
% |
Yes |
Yes- 4
defined levels |
WRCT |
Yes |
Yes |
Yes |
No |
% |
Yes |
Yes- 5
defined levels |
|
Appendix F
Quality of Web-based Reports
State |
Test
|
Accessibility |
||
Word on
main web-page that indicates results |
# of clicks from homepage to results |
Proximity of special ed data to “all students” or “reg. ed.” |
||
HS
Graduation Exam |
Reports |
3 clicks |
1 click
apart |
|
SAT-9 |
Reports |
2 clicks |
Same page |
|
AK |
HSGQE |
Student
testing and Graduation Exam |
3 clicks |
Same
document |
Benchmark
Exams |
Student
Testing and Graduation Exam |
3 clicks |
Same
document |
|
CA |
SAT-9 |
STAR-Stanford 9 |
4 clicks |
1 click
apart on a pull-down bar |
CA
Standards Test |
STAR-
Stanford 9 |
4 clicks |
1 click
apart on a pull-down bar |
|
SABE/2 |
STAR-Stanford 9 |
3 clicks |
2 clicks
apart |
|
CO |
CSAP |
Assessment |
2 clicks |
Same page |
DE |
DSTP |
5 clicks |
Same page |
|
GA |
GHSGT |
Report
Card |
3 clicks |
Same page |
Writing
Assessment |
Report
Card |
3 clicks |
Same page |
|
CRCT |
Report
Card |
3 clicks |
Same page |
|
SAT-9 |
Report
Card |
3 clicks |
Same page |
|
ID |
IDA |
Statistical Data |
2 clicks |
Same page |
ITBS |
Statistical Data |
2 clicks |
2 clicks
apart (but note that sp. ed. is particularly hard to find since it is under
“Office Use W” |
|
IL |
ISAT |
Assessment |
2 clicks |
Same page |
PSAE |
Assessment |
2 clicks |
Same page |
|
IN |
ISTEP+ |
ISTEP and |
3 clicks |
Same page |
GQE |
ISTEP and |
3 clicks |
Same page |
|
IA |
ITBS/ITED |
Publications and Newsletters |
4 clicks |
Same
document |
KS |
KAP |
Assessments and Standards |
2 clicks |
Same
document (though “all students is on pg 17 and SWD is on pgs 109 and 148) |
KY |
CTBS/5 |
Use the
scroll down bar for CTBS/5 |
3 clicks |
Same page |
KCCT |
Use scroll
down bar for “Assessment and Accountability” |
5 clicks |
Same page |
|
MD |
MSPAP |
MSPAP |
4 clicks |
2 clicks
apart |
MFT |
MSPAP |
4 clicks |
2 clicks
apart |
|
CTBS/5 |
MSPAP |
4 clicks |
2 clicks
apart |
|
MA |
MCA |
MCAS |
3 clicks |
Same page |
MN |
MCA |
MN
Connecting Learning and Accountability for Students and Schools |
7 clicks |
Same page |
BSE |
MN
Connecting Learning and Accountability for Students and Schools |
7 clicks |
Same page |
|
MS |
CTBS/5 |
Student
Achievement |
6 clicks |
1 click
apart |
MCT |
Student
Achievement |
6 clicks |
1 click
apart |
|
FLE |
Student
Achievement |
6 clicks |
1 click
apart |
|
Writing
Assessment |
Student
Achievement |
6 clicks |
1 click
apart |
|
MO |
MAP |
Student
Assessment/MAP |
2 clicks |
2 clicks
apart |
MT |
ITBS/ITED |
Spring
2001 Statewide test results |
3 clicks |
Same page |
NE |
Assessment
of State Reading Standards |
2000-2001
State of the Schools Report Online |
3 clicks |
1 click
apart |
NH |
NHEIAP |
Reports
and Statistics |
3 clicks |
Same
document |
NM |
NM Writing
Assessment |
Divisions
and Units |
4 clicks |
Same page |
NMHSCT |
Divisions
and Units |
4 clicks |
Same page |
|
NY |
NYSAP |
Reports |
4 clicks |
Same
documents (1 page apart) |
Regents
Comprehensive Exams |
Reports |
5 clicks |
Same page
in document |
|
Regents
Competency Test |
Reports |
5 clicks |
Same page
in document |
|
Occupational Education Proficiency Exams |
Reports |
5 clicks |
Same page
in document |
|
NC |
NC Writing
Assessment |
Reports
and Statistics |
5 clicks |
2 clicks
apart |
End-of-Course |
Reports
and Statistics |
5 clicks |
2 clicks
apart |
|
End-of-Grade |
Reports
and Statistics |
5 clicks |
2 clicks
apart |
|
Computer
Skills |
Reports
and Statistics |
5 clicks |
2 clicks
apart |
|
OK |
CCT |
Report
Cards |
4 clicks |
Same page |
PA |
PSSA |
School
Profiles |
4 clicks |
Same page |
SC |
PACT |
Test
Scores |
4 clicks |
Same page |
HSEE |
Test
Scores |
3 clicks |
Same page |
|
CSAB |
Test
Scores |
3 clicks |
Same
document |
|
SD |
SAT-9 |
2000-2001
Education in SD: District and Statewide Profiles |
2 clicks |
Same page |
Stanford
Writing Assessment |
2000-2001
Education in SD: District and Statewide Profiles |
2 clicks |
Same page |
|
UT |
SAT-9 |
Evaluation/
Assessment |
7 clicks |
2 clicks
apart |
CCRT |
Evaluation/ Assessment |
5 clicks |
Same page |
|
VA |
SOL |
SOL
Standards of Learning |
3 clicks |
2 clicks
apart |
SOL Grad |
SOL
Standards of Learning |
3 clicks |
2 clicks
apart |
|
VSAP
(SAT-9) |
Pull down
bar: Assessment and Reporting |
3 clicks |
Same
document |
|
WA |
WASL |
Assessment
and Research |
3 clicks |
Same page |
WI |
WKCE |
Statistics
and Reports |
3 clicks |
Same page |
WRCT |
Statistics
and Reports |
6 clicks |
Same page
in document |
|
Appendix G
Disaggregated Participation Information
State |
Test |
Count |
Count Not Tested |
Count Exempt |
Count Excluded |
Percent of students tested |
Percent of students not tested |
Percent Exempt |
Percent Excluded |
Count and/or Percent Absent |
HS Graduation
Exam |
||||||||||
SAT-9 |
||||||||||
AR |
SAT-9 |
|||||||||
Benchmark Exams |
||||||||||
CA |
STAR: |
|||||||||
CO |
CSAP |
|||||||||
CT |
CMT
|
|||||||||
CAPT |
||||||||||
DE |
DSTP (SAT-9) |
|||||||||
FL |
FCAT (includes
SAT-9) |
|||||||||
GA |
GHSGT |
|||||||||
SAT-9 |
||||||||||
CRCT |
||||||||||
Writing
Assessment |
||||||||||
IDa |
IDA |
|||||||||
ITBS |
||||||||||
IL |
ISAT |
|||||||||
PSAE |
||||||||||
IN |
ISTEP+ |
|||||||||
GQE |
||||||||||
IAb |
ITBS/ITED
|
|||||||||
KS |
KAS |
|||||||||
KY |
CTBS/5 |
|||||||||
KCCT |
||||||||||
LA |
GEE- 21 |
|||||||||
ITBS/ITED
|
||||||||||
LEAP-21 |
||||||||||
ME |
MEA |
|||||||||
MD |
MSPAP |
|||||||||
MFT |
||||||||||
MA |
MCAS |
|||||||||
MN |
MCA |
|||||||||
BSE |
||||||||||
MS |
Grade Level
Testing Program |
|||||||||
FLE |
||||||||||
MO |
MAP (Terra
Nova survey) |
|||||||||
MT |
ITBS/ITED |
|||||||||
NV |
Terra Nova
CTBS/5 |
|||||||||
NH |
NHEIAP |
|||||||||
NJ |
ESPA/GEPA/HSPT |
|||||||||
NM |
NM Writing
Assessment Program |
|||||||||
NY |
Occupational
Education Proficiency Exams |
|||||||||
Regents
Comprehensive Exams |
||||||||||
Regents
Competency Test |
||||||||||
NYSAP |
||||||||||
NC |
Testing System Grades 3-8 ·
End of
Grade |
|||||||||
·
Writing test |
||||||||||
·
Computer Skills |
||||||||||
Testing System
Grades 9 – 12 ·
End-of-Course |
||||||||||
ND |
CTBS/5 |
|||||||||
OK |
CCT |
|||||||||
OR |
OSA |
|||||||||
PA |
PSSA |
|||||||||
RI |
New Standards
Reference Examinations RI State Writing
Assessment |
|||||||||
SC |
PACT |
|||||||||
SD |
SAT-9 Stanford Writing
Assessment |
|||||||||
TN |
TCAP ·
Writing Test |
|||||||||
TX |
TAAS |
|||||||||
Exit Level TAAS |
||||||||||
Statewide
End-of-Course Tests |
||||||||||
RPTE |
||||||||||
UT |
SAT-9 |
|||||||||
CCRT |
||||||||||
VA |
VSAP |
|||||||||
WA |
WASL |
|||||||||
WVc |
SAT-9 |
|||||||||
WI |
WKCE |
|||||||||
WRCT |
Note: Entries in this table
indicate data available for all grades where testing occurs, unless otherwise
notes. Entries indicate only those data
presented, not ones that could be calculated.
a In Idaho, participation rates for the ITBS and TAP were not broken
down by grade level. Only an overall
participation rate was provided.
b In
c In West Virginia, participation rates for the SAT-9 were not broken
down by grade level. Only an overall
participation rate was provided.
Appendix H
Three Year Data Analyses
| State |
Test |
Grades Used for Analysis |
SAT-9 |
4, 8, & 10 |
|
4 & 7 (Reading only) |
||
3, 8, & 10 |
||
3, 8, & 10 |
||
4, 7, & 10 (Math) |
||
KY Core Criterion Tests (in Figures as KY1) CTBS/5 (in Figures as KY2) |
4, 7, & 10 ( End of primary, 6, & 9 |
|
4 & 8 |
||
5 & 8 11 |
||
Basic Skills Test |
3 8 |
|
3, 7, & 11 ( |
||
4, 8, & 11 |
||
4 & 8 |
||
Exit Level TAAS |
4 & 8 10 |
|
SAT-9 |
5, 8, & 11 |
|
WA Assessment of Student Learning (WASL) |
4, 7, & 10 |