On the Road to Accountability: Reporting Outcomes for
Students with Disabilities
NCEO Technical Report 32
Published by the National Center on Educational Outcomes
Prepared by:
John Bielinski, Martha Thurlow, Stacy Callender, and Sara Bolt
December 2001
Any or all portions of this document may be
reproduced and distributed without prior permission, provided the source is
cited as:
Bielinski, J., Thurlow, M., Callender, S., &
Bolt., S. (2001). On the road to accountability: Reporting outcomes for
students with disabilities (TechnicalReport 32). Minneapolis, MN:
University of Minnesota, National Center on Educational Outcomes. Retrieved
[today's date], from the World Wide Web: http://cehd.umn.edu/NCEO/OnlinePubs/Technical32.htm
Executive Summary
This report is the fourth review of
state education reports conducted by the National Center on Educational Outcomes
(NCEO) to determine the public availability of important student outcome
information on students with disabilities. In this report, we include a
description of the assessment systems used in each state in the 1999-2000 school
year, and whether the state publicly reported participation and performance
results for students with disabilities on each test. We also examined the
participation data that were available, as well as the performance gap between
students with disabilities and the total population.
For this report, as with previous
reports, we requested all of the publicly available reports produced by state
departments of education that contain student outcome data such as achievement
test performance. We also examined test results that states reported on their
Web sites. We found that 35
states reported 1999-2000 test results for students with disabilities on at
least some of their state assessments. This is up from only 17 states the year
before, a year in which our analysis examined 1998-99 data, or data from earlier
years if 1998-99 data were not available.
Only 16 states reported participation
and performance results for students with disabilities on all of their 1999-2000 tests. Another 15 states reported participation
and performance data for some of their 1999-2000 tests. Most of the states that reported
disaggregated performance results also reported disaggregated participation
results, but not all did. Out of 64 tests in which disaggregated
performance results were reported, only 7 tests did not have participation data
also.
States reported participation data in
a variety of ways. Most states
reported the number of students with disabilities who were tested; only nine
states reported participation rates, and four other states reported
enough information to make it possible for the reader to calculate the
participation rate. Our analysis of the performance data reported by states
clearly showed the achievement gap between special education students and other
students. This gap is fairly
consistent across states, and also increases with higher grade levels.
Despite dramatic increases in the
number of states reporting disaggregated data on students with disabilities for
the 1999-2000 school year, reporting is still considerably less frequent than
might be expected. Further, some of the data are easier to find and understand.
The following recommendations for reporting are derived from our experiences in
attempting to find and analyze state data for students with disabilities:
- Provide data reports that meet minimum reporting requirements
to the public in a timely manner – no more than 6 months after a test was
administered.
- Establish clear guidelines for reporting practices consistent
with IDEA 97.
- Report participation rates based on the percent of
students enrolled on the day of testing.
- Regardless of how participation is reported, be sure to
include in the data tables a brief description of who is included in the
participation index (e.g., if the state reports the total number of all
students eligible, then tell the readers who was not eligible.
- Report the number and percent of students with disabilities
using accommodations.
- Report disaggregated results for all reporting categories
required by Title I in the same data table.
Overview
Reform efforts during the past decade emphasize the
importance of accountability for the outcomes of all students, including those with disabilities. To promote
accountability for all students,
states are required by both Title I and IDEA to report disaggregated results for
students with disabilities. Whenever students with disabilities are excluded
from assessment results, we obtain an inaccurate picture of how all students are
performing (Thurlow, House, Boys, Scott, & Ysseldyke, 2000; Thurlow, Ysseldyke,
Erickson, & Elliott, 1997). It is important to document the extent to which
states are making assessment results public and the degree to which students
with disabilities are included. And, as more states publicly report data, it is
important to examine the extent to which students with disabilities are being
included in assessments (participation) and the performance of students with
disabilities, as well as to study the achievement gap between students with
disabilities and the total population.
On an annual basis since 1997, the National Center on
Educational Outcomes (NCEO) has reviewed state reporting practices, specifically
looking at what states are reporting on the performance and participation of
students with disabilities in statewide large-scale assessments. These reviews
have shown slow movement toward public reporting on the participation of
students in assessments and on their performance (Thurlow, Langenfeld, Nelson,
Shin & Coleman, 1998; Thurlow, Nelson, Teelucksingh, & Ysseldyke, 2000;
Ysseldyke, Thurlow, Langenfeld, Nelson, Teelucksingh & Seyfarth, 1998).
For some time, states have provided little, if any,
explicit information on students with disabilities. In our first study on state
1997 reporting practices (Thurlow, Langenfeld et al., 1998), we examined 113
accountability reports collected between Fall 1995 and Spring 1997 and found
that only 11 states included disaggregated performance data on students with
disabilities. Of the 92 reports that did not contain performance data for
students with disabilities, 76 (82.6%) did contain performance data for students
without disabilities. It was more common to find enrollment data (N=30) than
outcome data for students with disabilities in these reports. Since most states
did not specify who was in their summary results, it was difficult to determine
whether students with disabilities were included in whole, in part, or entirely
excluded. Based on these findings, NCEO provided recommendations about ways to
improve state reporting practices (e.g., performance data on students with
disabilities should be publicly reported as often as data on regular education
students).
In the second examination of state reporting practices
in 1998 (Ysseldyke et al., 1998), NCEO again found few states that provided
information on students with disabilities. Also little change was found in the
type of information that was included in reports. Only a few states (N=13)
included disaggregated performance data on students with disabilities and even
fewer (N=11) provided disaggregated participation data in statewide assessments
for students with disabilities. However, enrollment data on students with
disabilities remained available for the majority of states (N=38); often, data
on time spent in various settings were also reported. As before, many of the
reports that did not contain data on students with disabilities did contain
performance data on students without disabilities (39 out of 56 reports, 69.6%).
Our summary of the performance data contained in the 115
reports (Ysseldyke et al., 1998) revealed lower performance for students with
disabilities compared to other students, and lower rates of participation (e.g.,
50-80%). For example, on state reading assessments, 30% to 50% fewer students
with disabilities met the state standard (or passed) when compared to students
without disabilities. Further analysis and interpretation of these results, such
as making comparisons among states, were limited because 37 states did
not report performance data and those states that did had low participation
rates for students with disabilities.
In the third examination of state reporting practices
during 1998-99 (Thurlow et al., 2000), NCEO anticipated dramatic changes in
reporting practices because the IDEA 97 requirements for reporting were in
place. Yet again, few states (N=17) included disaggregated performance data on
students with disabilities or provided disaggregated participation data for
students with disabilities (N=14) in statewide assessments. Over 50 out of 74
(67.6%) reports that contained outcome data on students without disabilities
still did not contain data on students with disabilities. Further analysis of
the data contained in the 165 reports that were reviewed again revealed lower
performance for students with disabilities compared to other students and vastly
different participation rates for students with disabilities ranging from 33% -
97% across states.
Despite the difficulties in interpreting the outcome
data provided for students with disabilities in the past, it is important to
continue examining how these students participate and perform in statewide
assessments (Thurlow et al., 1997). The lack of publicly
available information on students with disabilities is particularly troubling in
light of the findings from a survey of state assessment directors in which all
but five state directors indicated that their state disaggregated data on
students with disabilities (Thompson & Thurlow, 1999). These findings beg the
question: Where are the data that states say are disaggregated? If the data are
available, why are they not readily available to the public?
Current Study of State Reports – Looking for 1999-2000
Data
The purpose of this fourth study of state reports was to
continue to track state reporting practices on the participation and performance
of students with disabilities in statewide assessments. Our intention was to
document reporting practices on performance and participation for each state
assessment. In addition, we summarized reading and math test results for
students with and without disabilities. Our approach for this report differs
from that in our previous reports in that the unit of analysis for this report
is the state assessments, whereas the unit of analysis in our previous reports
was all publicly available print reports.
Study Procedures
The procedures used in this analysis of state reports
differed slightly from those used in previous years. The refinements in
procedure emerged from our previous experiences, as well as from advances in
reporting practices in the states (e.g., greater use of Web sites). Each year
since our first report, an increasing number of states has reported test results
on the World Wide Web. In some cases, the data available on the Web sites are
more comprehensive than the data available in print documents. Sometimes print
reports lag one or more years behind the results available on the state’s Web
site, and in other cases the state has discontinued detailed reporting of test
results in printed reports. For these reasons, and the relative ease with which
results can be accessed from the Web, we chose in this year’s analysis to
concentrate our efforts on Web-based reporting. However, we also requested from
the state assessment director in each state, a copy of all of the publicly
available reports that presented test results.
In contrast to previous years in which we collected the
most recent data available in each state, regardless of the year of the data,
this time we focused on a single year’s assessments – those from 1999-2000. For
example, for our analysis of reports publicly available between September, 1999
and June, 2000, there were 4 states in which data from 1996-97 testing were the
most recent, 41 states with 1997-98 data, and only 5 states with what might be
considered “current” 1998-99 data. By changing our data collection criteria to a
specific year instead of the most recent year, we are looking at data from tests
administered during the same academic year. The possible limitation of this
approach is that data will not be reflected for those states that report data
more than a year after the test is administered. We believe, however, that it is
reasonable to expect that disaggregated results, if the state reports them,
should be available within a year of testing.
A form letter was sent in August, 2000 to each state
assessment director requesting publicly available reports of test results for
the 1999-2000 academic year. Follow-up phone calls and e-mails were made
throughout the fall, until December, 2000. In January, 2001, a final follow-up
letter was sent to those states that had not responded to our inquiries.
Overall, 17 states did not respond to any of our inquiries; these included
states for which we had found data on Web sites. Another letter was sent to
every state assessment director in February to verify whether the information we
had from the Web and print documents was accurate in reflecting the statewide
assessment program. We did this by asking assessment directors to examine a
table that included the names of their assessments, the grades and content areas
tested, and the availability of disaggregated results for students with
disabilities (see example in Appendix A). The letter contained a deadline of
March 30th for responding. All of the data
presented in this report went through this verification process with state
assessment directors, although only a fraction of the assessment directors
responded to the verification information.
Another change in our methodology for this report was
that each state assessment, not print reports, was treated as the unit of
analysis. Our goal was to determine whether participation and performance
results were available for each test at each grade tested. In the past, we
focused on determining whether each report that had test data also had
disaggregated data for students with disabilities. A shortcoming of the approach
we used previously was that we could never be sure that we had received all
reports from a state. The accuracy and thoroughness of those data depended
solely on what the state assessment director provided and what we could find.
Ensuring thoroughness and accuracy of the data we obtained from assessment
directors was very time consuming and expensive.
With state assessments as the unit of analysis, we were
able to avoid some of these pitfalls. Every state department of education
includes some information about their assessments on the Web. We were able to
access this information to determine which assessments were used and in which
grades students were tested. Through our verification process (described above),
we were able to determine for which assessments the state provided to the public
participation and performance results for students with disabilities.
Defining Statewide Assessment Programs
Most state assessment programs are comprised of more
than a single test. Different assessments are used for different purposes. For
instance, a state may use an off-the-shelf nationally standardized test so that
performance can be compared to national norms, and a state-developed test to
measure the state’s content standards. Many states include a high stakes test
that students must “pass” in order to earn a diploma. In this report, we include
only tests that are mandated by state policy. Excluded from this list are tests
that are given by a state on a volunteer basis, such as NAEP, and college
entrance exams.
We used several criteria to distinguish between tests,
such as the name of the test, the type of test, and the purpose of the test. In
most instances, we could distinguish one test from another based on the name of
the test. For instance, Florida has two tests, one called the Florida
Comprehensive Assessment Test (FCAT) and another called the High School
Competency Test (HSCT). In other instances, we had to turn to the purpose of the
test. For example, we treated Arizona’s testing system as being comprised of
three tests: the Stanford Achievement Test given in grades 5, 7, and 10, the
Arizona Instrument to Measure Scores (AIMS) given in grades 3, 5, and 8, and the
AIMS given in 10th grade, even though two of them used
the same name (AIMS). The 10th grade AIMS is a high stakes test
that students must pass to earn a diploma, a purpose that separated it from the
AIMS in grades 3, 5, and 8. In a few instances, we treated state writing exams
as separate tests when there did not appear to be a link between the writing
test and other tests. For instance, Mississippi uses the Comprehensive Test of
Basic Skills (CTBS/5) for students in grades 3 through 8, and Mississippi gives
a writing test in grades 4 and 7. Although the writing test is part of their
Grade-Level-Testing-Program, it is not treated as part of their norm-referenced
testing program.
Despite our criteria, results were not always clear. For
instance, Mississippi has two writing assessments, one that is part of the
Functional Literacy Exam (FLE) and is given in 11th grade, and another (without a
specific name) that is administered in both 4th and 7th grades. Students must pass the writing test in 11th grade in order to earn a diploma,
but this is not true for the writing tests administered in 4th and 7th grade. In this instance, we treated
the writing assessments given in 4th and 7th grades as one assessment, and the FLE exams as another.
Most statewide assessment programs are multi-component
systems in which several content domains in several different grades are
assessed. For instance, Colorado’s Student Assessment Program (CSAP) tests
students in grades 3, 4, 5, 7, and 8 in four subject areas: reading, math,
writing, and science. There were instances in which the components had different
names, but appeared to be part of a single assessment system (i.e., serving the
same purpose). For instance, New Jersey has a test called the Grade Eight
Proficiency Assessment (GEPA), and another called the Elementary School
Proficiency Assessment (ESPA). Both systems assess in three content
areas—language arts, math, and science – and report performance in the same
manner. Because we could not identify a distinctly different purpose, we treated
the GEPA and ESPA as multiple components of the same assessment system.
Data Collection
Beginning in October 2000, state department of education
Web sites were accessed using the Achieve Web site (http://www.achieve.org)
“State Links” page as a quick link to several state departments and state
offices including accountability and assessment Web sites. Both participation
and performance data on required statewide assessments were collected. In
addition, other outcome data, including attendance rates, drop out rates, and
graduation rates were examined. These data were classified as being available
for all students, regular education only, special education only, or not
specified at the state and district/school level. Most of the reviews of state
Web sites were completed by December, 2000. The information gathered was
summarized and submitted to the state director of assessment for verification.
Additional information gathered in the review of print reports sent to NCEO was
included in these verification tables. A final review of the states’ Web sites
and print documents was conducted in March-April 2001 to ensure that the states
had sufficient time to report and submit their 1999-2000 data.
Characteristics of State Assessment Systems
Appendix B is a list of all of the state mandated
assessments we were able to identify for all 50 states. The list includes the
state, the name of the test, the grades and subject areas tested, and whether
the state had publicly available disaggregated participation and performance
results for students with disabilities. We identified 105 separate statewide
assessments. Thirty-three states had more than one assessment, and only Iowa and
Nebraska did not have a state mandated assessment program.
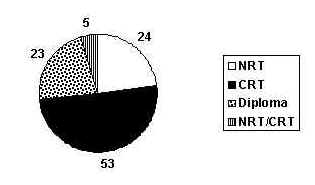
Figure 1 breaks down the 105 testing systems by type:
norm-referenced tests (NRT), criterion-referenced tests (CRT), tests used as a
gate for graduation or earning a particular type of diploma (DIPLOMA), and tests
that combined standardized NRTs with additional items used to generate state
criterion-referenced (or benchmark) scores (NRT/CRT). One half (N=53) of the 105
assessments were CRTs, 23 were DIPLOMA tests, 24 were off-the-shelf NRTs, and 5
were a combination NRT/CRT. Although there were 23 tests designated as DIPLOMA
tests, there were only 21 states with this type of test because New York had
three tests during 1999-2000 intended for different populations that were used
for graduation/diploma decisions. In New York, students could take the Regents
Comprehensive Exam, the Regents Competency Test, or the Career Education
Proficiency Exams.
Figure 1. Type of State Assessments
Which States Disaggregated 1999-2000 Data for Students with Disabilities?
Figure 2 is a map of the United States. This figure
indicates which states: (a) reported
participation and performance for all
of their state tests (solid black); (b) reported
performance results on all tests,
but not participation (diagonal lines); (c) reported performance and participation
for some of their tests (light gray); (d) reported performance results for some of their tests, but not
participation (dotted); and (e) did not
report participation or performance results for any of their assessment
systems (states in white). States that reported disaggregated data for students
with disabilities usually reported results at the state level and often at the
district level too.
Figure 2. States that Report 1999-2000 Disaggregated
Results for Students with Disabilities
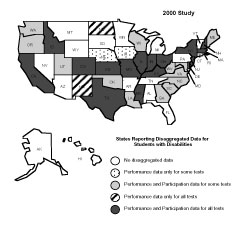
(See Appendix B for a complete list of states that
report 1999-2000 disaggregated results for students with disabilities.)
Sixteen states reported test participation and
performance results for students with disabilities on all of their tests. As evident in Figure 2, there is no geographic
pattern to these states. They are located at both coasts, in the middle, in the
north, and in the south. They are states with large populations of students, and
states with small populations. The states that are reporting on the
participation and performance of their students with disabilities do so
regardless of whether they have one or multiple assessments (10 of the 16 states
had more than one assessment), and regardless of whether they test in just a few
grades or in as many as 10 grades.
Fifteen states reported participation and performance
results on some, but not all of their tests. In most instances, these states did
not have participation results or performance results on at least one of their
tests. Four states had disaggregated participation and performance data on most
of their tests. Three of these states, Maryland, Rhode Island, and South
Carolina, were missing only disaggregated participation data on one test. The
other state, North Carolina, has nine assessments, and only one, the Competency
Exam, was missing disaggregated results. Two other states (New Mexico, North
Dakota) reported the performance of students with disabilities on all of their
tests, but did not report participation.
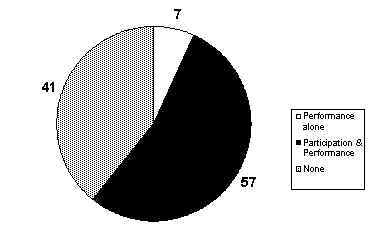
It is evident from the data that while many states
present some disaggregated data on students with disabilities, data often are
not reported for all of the state assessments. Looking at reporting as a
function of the total possible testing programs for which data could be reported
presents a slightly different picture. The pie chart in Figure 3 shows the
number of all of the 105 assessments for which performance, performance and participation, or neither were reported for students with
disabilities. For none of the state systems did states report only assessment
participation data. For 57 of the 105 tests (54.3%), states reported both
student participation and performance, and for
seven tests (6.7%), states reported only
performance. For almost half of the tests (N=41), neither participation nor
performance results were publicly reported.
Figure 3. State Assessments that Disaggregate Results
for Students with Disabilities
Going Beyond Reporting Requirements
Several states report results beyond what might be
considered minimal requirements. Some states are reporting trends, others are
reporting test score gains from one grade cohort to the next, and some states
are reporting results by disability category or accommodation category. Here we
summarize the results of a few of the states that have gone beyond minimum
reporting requirements. This summary is not meant to be exhaustive; rather we
intend to highlight particular practices.
The South Carolina Department of Education posts test
scores across two years in one of its Web based reports. That report includes
the percent of students passing the state’s High School Exit Examination for a
variety of groups, including students with disabilities, in two years—1999 and
2000. The table also includes the change in the percent passing from 1999 to
2000. These kinds of data, reported in a single table, make it easy to compare
gains in passing rates across various groups of students (e.g., general
education and special education). The Utah Department of Education includes a
similar table displaying two years of results for students taking the Stanford
Achievement Test, 9th Edition. That report includes the
change in Median Percentile Ranks from 1999 to 2000 for students in special
education.
Some states report results by disability category. North
Carolina reports participation and performance results for students taking the
Third Grade Pretest and Computer Skills Test for the 13 federal disability
categories. Colorado also reports performance and participation by disability
category. Colorado’s results are reported alongside the results for other
student groups, which makes it easy for the reader to make comparisons. Colorado
also reports results for several accommodations categories, including Braille,
large-print version, teacher-read directions, scribe, and extended/modified
timing. Reporting results in this way allows the reader to easily recognize what
accommodations students are using and how frequently they are using those
accommodations.
The Texas Department of Education produces a print
report that provides results for students with disabilities using the same
reporting categories that are used for the general education students. These
reporting categories include all of the Title I reporting categories, namely,
gender, ethnicity, economic disadvantage, Title I, migrant, and limited English
proficient, along with some additional categories, namely bilingual, ESL,
gifted/talented, at-risk, and career/technology education. In this way, Texas
reports results in the same way for students in special education as it does for
students in general education.
New York produces a report called the “Pocketbook.” This
pocket-sized report gives results for students with disabilities on a variety of
outcome indicators, including earning a high school diploma, dropout, test
results, and participation in post-secondary education. For some of the tests,
the report includes figures that display trends across three years of test
scores.
Participation Results
Among the 31 states identified as reporting
disaggregated participation data for students with disabilities, participation
data were reported using a variety of approaches. Many states reported a count
of the number of students with disabilities or special education students
tested. Others reported the percentage of all enrolled students with
disabilities who were tested. Still others reported participation information as
the number or percent of students with disabilities excluded, exempted, or
absent. Figure 4 illustrates the number of states reporting disaggregated
participation information in particular ways.
Figure 4. Participation Reporting Approaches
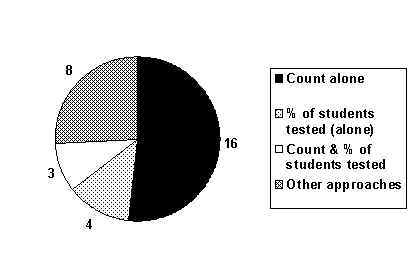
Some states disaggregated participation information
according to disability category (Colorado, North Carolina), and accommodated
conditions (Colorado, Indiana, North Carolina, Rhode Island). Most states
provided participation according to grade and content area tested. Further
information on approaches used to report participation for students with
disabilities on state assessment systems is provided in Appendix C.
Figure 5 represents the reported participation rates for
several states that clearly identified the percent of students with disabilities
tested. It may have been possible to calculate participation rates for other
states as well, given the information that was reported. However, due to the
different terms used by states and the lack of a clear description of who was
represented in the participation results, it was difficult to ascertain who was
included or excluded under various headings. For instance, Washington reports
the percent of students in special education “exempt” as well as the percent of
students in special education “not tested.” Other states only report a single
exclusion rate such as the percent of students with disabilities “excluded,”
“exempted,” or “not tested.” It is possible that these terms have different
meanings in different states.
Figure 5. Percent of Students with Disabilities Tested1
among States Reporting this Information
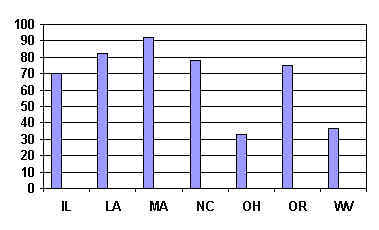
For most states, participation in the middle
school/junior high school age math test was used. For WV, participation rates
represent those reported for all students (grades 3-11), and for LA they
represent rates reported for all 8th grade students.
Figure 5 represents the reported participation
rates for several states that clearly identified the percent of students with
disabilities tested. It may have been possible to calculate participation rates
for other states as well, given the information that was reported. However, due
to the different terms used by states and the lack of a clear description of who
was represented in the participation results, it was difficult to ascertain who
was included or excluded under various headings. For instance, Washington
reports the percent of students in special education “exempt” as well as the
percent of students in special education “not tested.” Other states only report
a single exclusion rate such as the percent of students with disabilities
“excluded,” “exempted,” or “not tested.” It is possible that these terms have
different meanings in different states.
Performance Results
In addition to documenting the extent to which states
are reporting the participation and performance of students with disabilities,
we examined the performance of students with disabilities participating in
statewide assessments. It is important to remember that the scores from each
state are based on different tests; these tests may emphasize different
standards and are likely to differ in difficulty. In addition, there is great
variability across states in terms of the percentages of students with
disabilities who are included in the assessments. Thus, it is not appropriate to
compare performance across states.Despite these caveats, it is important to
examine the performance of students with disabilities relative to the
performance of all students within each state.
As indicated in Appendix B, there is a tremendous amount of data available in
some states; the results summarized here represent only a sample of these
publicly available results. Our purpose here is to provide a snapshot of the
results. Results are summarized in reading and mathematics because these content
domains are the ones assessed by most states. We also separate results by type
of test (NRT, CRT), grade level (elementary, middle school, high school), and
purpose of test (graduation exam, school accountability measure). Although it is
not always clear how the results are used by the state, the name of the test
usually indicates which tests are graduation exams; all other tests were treated
as school accountability tests. We present results by three school levels:
elementary (grades 3-5), middle (grades 6-8), and high school (grades 9-12). For
our summary, we chose to present only one grade for each level. Whenever
possible, 4th grade was used to represent the elementary level, 8th grade to
represent the middle school level, and 10th grade to represent the high school
level. These grades were chosen because they are the grades at which the
greatest number of states test students.
Norm-Referenced Reading Tests
Figures 6-8 illustrate the average national percentile
ranks for students with disabilities (SWD) and for all students in those states
that reported results for a commercially developed off-the-shelf reading test.
Drop-lines depict the size of the achievement gap between all students in a
grade and students with disabilities.
Figure 6 shows that as a group, students with
disabilities in elementary school performed below the 50th percentile, generally falling
between the 25th and 30th percentile. This contrasts with the
total population of students in the same grade in each state, which typically
performed above the 50th percentile. The achievement gap was
similar across states, varying between 20 and 30 percentile points. The figure
shows that the higher the average performance of the overall population, the
higher the performance of students with disabilities.
Figure 6. Elementary School Reading
Performance on Norm-Referenced Tests
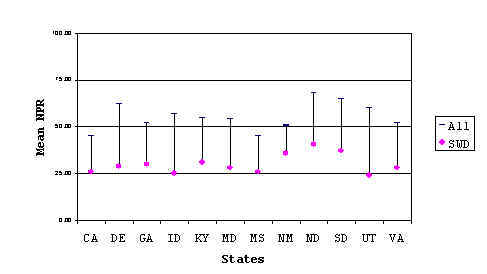
Figure 7 presents disaggregated middle school results on
norm-referenced reading tests for a sample of states. The performance gap in
middle school was generally larger than the gap observed for the elementary
school sample. Students with disabilities, on average, scored below the 25th percentile rank, whereas the overall
population generally scored above the 50th percentile rank. The increase in the
gap seems to be due to a decrease in the performance of the population of
students with disabilities.
Figure 7. Middle School Reading
Performance on Norm-Referenced Tests
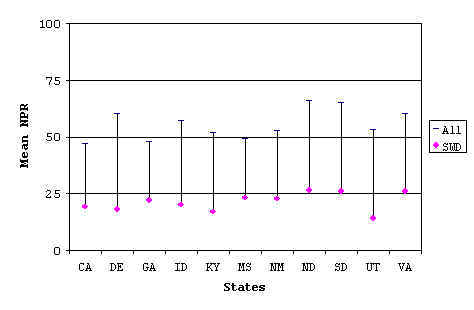
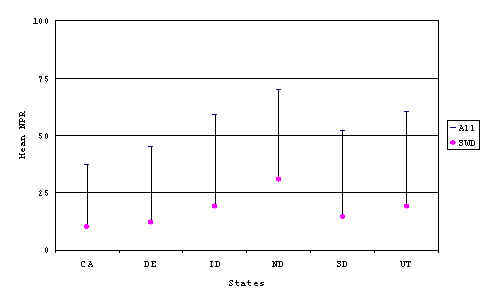
Figure 8 presents average percentile ranks for high
school students on norm-referenced reading tests. There is a large difference in
the mean scores of students with disabilities compared to the mean for all
students within a state. The mean percentile rank for students with disabilities
ranged from 10 to 30, whereas the mean for all students ranged from 37 to 70.
The performance gap between these groups of students varied to some degree
across states, but in general there appears to be approximately a 35% difference
between these groups of students.
Figure 8. High School Reading Performance on
Norm-Referenced Tests
What is evident across the three figures (Figures 6, 7,
and 8) is that the average percentile rank of the population of students with
disabilities decreased as grade level increased. Furthermore, the decrease among
students with disabilities was greater than the corresponding decrease in the
total population. For example, in California the mean percentile rank for
students with disabilities was about 25, 20, and 10 for elementary, middle
school, and high school respectively, whereas the corresponding mean percentile
ranks in the overall population were 45, 45, and 40. A similar pattern was
observed in prior reports (Thurlow, Ysseldyke, Nelson, & Teelucksingh, 2000;
Ysseldyke et al., 1998). Bielinski and Ysseldyke (2000) discussed some possible
explanations for this pattern. They suggested that changes in the
characteristics of who receives special education services and who is tested can
account for much of the increase in the gap. They demonstrated that
classification into special education and declassification (i.e., going back
into general education) is tied to prior achievement; the lowest achieving
general education students are the ones who get classified into special
education, whereas the highest achieving special education students are the ones
who get declassified. Over time, this results in an increasingly low achieving
special education population.
Meeting State Proficiency Benchmarks in Reading
Figures 9-11 present the percent of students meeting
state proficiency benchmarks (i.e., at or above the proficient level defined by
the state) at each of the school levels. As we did for the NRTs, we provide drop
lines in these figures to depict the achievement gap. These figures reveal that
there is greater variability among states for CRT performance than there was for
NRT performance.
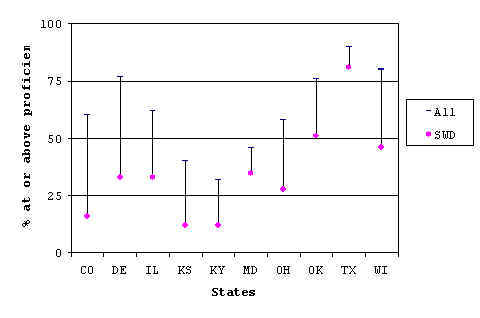
Figure 9 shows that the percentage of elementary
students with disabilities meeting the requirements ranged from 12% to over 75%
across this sample of states. The variability likely reflects variation in the
overall difficulty of the tests as well as differences in the percentage of the
special education population tested. This conjecture is supported by the fact
that those states with higher rates of students with disabilities reaching
proficiency also had high rates of all students reaching proficiency; states
with low rates of students with disabilities meeting proficiency also had low
rates of students in the total population reaching proficiency.
Figure 9. Percent of Elementary School Students at or
Above State Proficiency Benchmark in Reading
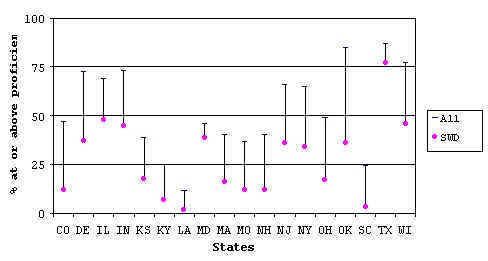
Results for middle school students on
criterion-referenced reading tests demonstrated a similar trend to that for
elementary students (see Figure 10). Like the norm-referenced results, the gap
between students with disabilities and the total population increased from
elementary grades to middle school grades on the criterion-referenced results.
In five of the eight states, less than one-fifth of the students with
disabilities met the benchmark, compared to only three of ten states in the
elementary grades. In this sample of states, there were also smaller performance
gaps between all students and students with disabilities when results were at
the extremes. For instance, in Texas, many students met the reading proficiency
requirements. Many students with disabilities also met the proficiency
requirements in this state. Similarly, in Kentucky, where very few students met
proficiency requirements, very few students with disabilities met the
requirements. In contrast, for states in which about half of the students met
proficiency, there were relatively much smaller percentages of students with
disabilities demonstrating proficiency.
Figure 10. Percent of Middle School Students at or Above
State Proficiency Benchmark in Reading
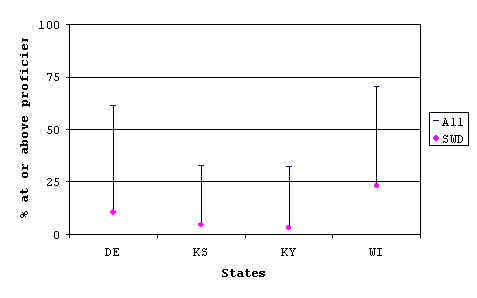
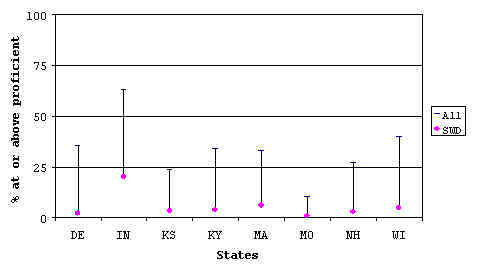
Figure 11 presents results from states that
disaggregated data on criterion-referenced reading tests (not graduation exams)
given to students in grades 10 and 11. There were only a few states with
criterion-referenced tests in high school that were not graduation tests. For
the high school graduation tests, the performance of students with disabilities
was very low. In three of the four states, less than 15% of students with
disabilities met the benchmark. Performance for the total population also was
quite low.
Figure 11. Percent of High School Students at or Above
State Proficiency Benchmark in Reading
Norm-Referenced Math Tests
Figures 12-14 represent student performance on
norm-referenced math tests. These data are the mean national percentile ranks
attained by students with disabilities and all students.
Similar to results for elementary students on
norm-referenced reading tests, students with disabilities received percentile
rank scores approximately 25 percentile points below the average of all students
in that grade in the state (see Figure 12). Average scores for all elementary
students ranged from the 47th to the 68th percentile, whereas average scores for
students with disabilities ranged from the 18th to 38th percentile.
Figure 12. Elementary School Math
Performance on Norm-Referenced Tests
As was the case for norm-referenced reading test
results, norm-referenced math test results demonstrated greater performance
deficits for students with disabilities in higher grade levels (see Figures 13
and 14). Average middle school and high school students with disabilities scored
approximately 35% below the population mean on norm-referenced math tests in
most states. At both of these levels, students with disabilities scored near the
25th percentile.
Figure 13. Middle School Math
Performance on Norm-Referenced Tests
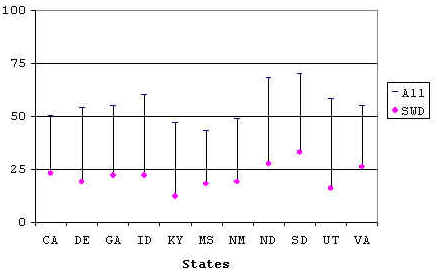
Figure 14. High School Math Performance on
Norm-Referenced Tests
Meeting State Proficiency Benchmarks in Math
Figures 15-17 present the percentages of students
meeting state proficiency benchmarks (i.e., at or above the proficient level
defined by the state). At each level, the percentage of students meeting
proficiency varied greatly from state to state. The performance gaps also
differed greatly among states. In some states, the percentage of all students
meeting proficiency is similar to the percentage of students with disabilities
meeting proficiency. In other states, there appears to be a large difference
between these groups.
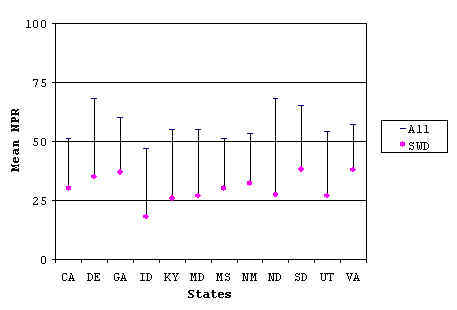
For elementary school results (see Figure 15), the
percentage of all students meeting proficiency ranged from 11% to 87%. The
percentage of students with disabilities meeting proficiency requirements ranged
from 2% to 77%.
Figure 15. Percent of Elementary School Students at or
Above State Proficiency Benchmark in Math
Beyond elementary school, only a small fraction of
students with disabilities met proficiency in any state, with the exception of
middle school students in Texas (see Figures 16 and 17). In seven out of the
eight states displayed in Figure 17, less than 10% of the students with
disabilities met the state proficiency benchmark. Performance for the total
population was not much better, with only one state having more than 50% of the
students meeting the proficiency benchmark. Again, it is important to note that
the difficulty of the content may vary substantially from state to state.
Figure 16. Percent of Middle School Students at or Above
State Proficiency Benchmarks in Math
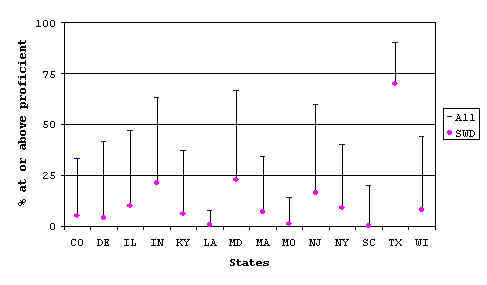
Figure 17. Percent of High School Students at or Above
State Proficiency Benchmark in Math
High School Exit Exam Results
Figures 18 and 19 display the results of high school
reading and math exit exams. States administer exit exams in different grades;
the number in the parentheses next to the state’s name indicates the grade from
which the data come. Only those states that report results for students with
disabilities are represented in the figures.
Figure 18. Percent Passing Minimum Competency/High
School Reading Exit Exam
Figure 19. Percent Passing Minimum Competency/High
School Math Exit Exam
As was the case with other criterion-referenced test
results, there is considerable variability among states in terms of the
percentages of all students (72% to 99%) and students with disabilities (35% to
97%) meeting the proficiency requirements. In general, it appears that when high
percentages of all students are meeting competency requirements, high
percentages of students with disabilities are also meeting these requirements
(especially as is depicted in Maryland). However, there is wide variability
across states in terms of gaps in competency rates between all students and
students with disabilities.
Discussion
Each year since 1997, the number of states reporting
test results either through public reports or via the Web has increased. In
1997, only 11 states reported results, quite a contrast to the 35 states that
reported 1999-2000 results on at least some of their state assessments. Although
this is a promising trend, it is clear that several states still are not publicly reporting disaggregated
results for students with disabilities for all of their tests. Only 16 states
reported disaggregated results on students with disabilities for each test and
each grade level for which test results were reported.
There are many reasons why this public reporting is
important. For example, doing so raises public awareness about the need for
resources directed toward improved achievement. It is evident that for students
with disabilities as a group, the achievement gap exists; being forthright about
that gap and ways to reduce it keeps the discussion about what should be done in
the public consciousness.
Challenges
Identification of all state assessment programs is not
an easy task. The programs listed in Appendix B for the 1999-2000 school year
are all that we could identify through our Web search and follow-up process of
state verification. Some of the difficulty can be attributed to the sheer
variety of assessment programs in the U.S. Many states have more than one
assessment, and several have a handful of different assessments. While variety
in assessments achieves several beneficial purposes, it also complicates
secondary analyses of state data.
Our decision to focus this year’s analyses on data from
a single test year—1999-2000—probably resulted in some states being identified
as not having data simply because the data that they had was for years before
the 1999-2000 year. In our previous studies that examined print reports, most of
the reports were based on results that were more than one year prior to the
report. In the report prior to this one (Thurlow et al., 2000) only five states
had results from the most recent academic year. Timely reporting of results
seems to us to be a minimum reporting requirement.
Web-based reporting is an important technology-based
advance that should make state achievement test data more accessible more
quickly. Attempting to cull test results from publicly available print reports,
as we did in the past, is costly in many ways, for the states that must design,
print, and ship the reports, and to us in terms of staff time simply to obtain
the reports, as well as to search through them. In fact, most states have
replaced expensive paper reporting of test results with Web-based reporting, and
several have expressed a long-range plan to eliminate print reports and to rely
solely on Web-based reporting.
State departments of education often have an easily
identifiable link to their results on the home page of their Web sites. Words
such as “Results,” “Tests/Assessments,” and “Student Data” are some of the
labels that states use to link to their test results. Unfortunately, many states
did not have such easily identifiable links. Sometimes we had to search through
many layers just to determine whether the state had results. In addition, data
sometimes changed or disappeared very rapidly. It seems reasonable to expect all
state departments of education to provide a link from their home page to their
test results, and to provide dates and clear information about changes in data
on their Web sites. In our next analysis of state reports, we will take a closer
look at Web-based reporting of test results; features such as accessibility,
readability, and usability will be described.
The way in which participation is reported needs to be
revisited. Simply reporting the number
of students participating in a test is not enough. This approach misses the main
reason why we believe publicly acknowledging participation is so important.
Knowing how many students took the test is far less informative than knowing the
percentage of students with disabilities enrolled who took the test. The
question on most people’s mind is not how many, but what percent. While there
are many acknowledged challenges in creating comparable participation rates
(Erickson, Thurlow, & Ysseldyke, 1996), people need to know whether a fraction
of students with disabilities enrolled, or most of the students with
disabilities enrolled, took the test. If these data were made available, the
public would be in a better position to evaluate the merits of the results in
terms of their representation of students with disabilities.
Performance data available in the 35 states also
indicate additional challenges that need to be addressed in reporting on the
performance of students with disabilities. For simplification here, we examined
either the average national percentile rank (for norm-referenced tests) or the
percentage of students reaching a state-defined level of proficiency (for
criterion-referenced tests). States actually report data in many more ways than
this. For example, South Carolina and New York report the annual change in the
percent of students passing their tests. Some states report on changes in
performance across grades for the same students. Several other states provide
figures and tables of their results across years, but many of those states do
not disaggregate trend data for students with disabilities.
Recommendations for Reporting
Our analyses and experiences in looking for
disaggregated data on students with disabilities have led us to identify several
characteristics of what we consider to be better reports. Based on these, we
make the following recommendations for reporting on the participation and
performance of students with disabilities in state tests:
- Provide data reports that meet minimum reporting requirements
to the public in a timely manner – no more than 6 months after a test was
administered.
- Establish clear guidelines for reporting practices consistent
with IDEA 97.
- Report participation rates based on the percent of
students enrolled on the day of testing.
- Regardless of how participation is reported, be sure to
include in the data tables a brief description of who is included in the
participation index (e.g., if the state reports the total number of all
students eligible, then tell the readers who was not eligible.
- Report the number and percent of students with disabilities
using accommodations.
- Report disaggregated results for all reporting categories
required by Title I in the same data table.
References
Bielinski, J., & Ysseldyke, J. (2000). Interpreting trends in the performance of
special education students (Technical Report 27). Minneapolis, MN:
University of Minnesota, National Center on Educational Outcomes.
Individuals with Disabilities Education Act Amendments
of 1997, 20 U.S.C. Sec. 1400 et seq.
Thompson, S.J., & Thurlow, M.L. (1999). 1999 State special education outcomes: A
report on state activities at the end of the century. Minneapolis, MN:
University of Minnesota, National Center on Educational Outcomes.
Thurlow, M., House, A., Boys, C., Scott, D., &
Ysseldyke, J. (2000). State participation
and accommodations policies for students with disabilities: 1999 update
(Synthesis Report 33). Minneapolis, MN: University of Minnesota, National Center
on Educational Outcomes.
Thurlow, M.L., Langenfeld, K.L., Nelson, J.R., Shin, H.,
& Coleman, J.E. (1998). State
accountability reports: What are states saying about students with disabilities?
(Technical Report 20). Minneapolis, MN: University of Minnesota, National Center
on Educational Outcomes.
Thurlow, M.L., Nelson, J.R., Teelucksingh, E., &
Ysseldyke, J.E. (2000). Where’s Waldo? A
third search for students with disabilities in state accountability reports
(Technical Report 25). Minneapolis, MN: University of Minnesota, National Center
on Educational Outcomes.
Thurlow, M.L., Ysseldyke, J.E., Erickson, R.N., &
Elliott, J.L. (1997). Increasing the
participation of students with disabilities in state and district assessments
(Policy Directions No. 6). Minneapolis, MN: University of Minnesota, National
Center on Educational Outcomes.
Ysseldyke, J.E., Thurlow, M.L., Langenfeld, K., Nelson,
J.R., Teelucksingh, E., & Seyfarth, A. (1998). Educational results for students with disabilities: What do the data
tell us? (Technical Report 23). Minneapolis, MN: University of Minnesota,
National Center on Educational Outcomes.
Appendix A
Sample Verification Table
Results on Students with Disabilities
The National Center on
Educational Outcomes will be writing a report using this information. The report will describe how states are
reporting test results for students with disabilities.
Our goal is to (a) identify all components of each state’s testing system, and
(b) determine whether each state reports disaggregated test results for students
with disabilities.
PLEASE VERIFY THE ACCURACY OF
THIS TABLE:
- If any information is inaccurate, provide us with
the HARD COPY REPORT containing the data and/or the WEB ADDRESS containing
the data.
- If the department of education produces any other
report on educational results not included in the list below, please send us
the report(s).
- If ALL of the information is accurate, please send
an email verifying that the information is accurate. Email: John Bielinski at bieli001@umn.edu
Alabama
Assessment Component
|
Grades
|
Subject
|
Disaggregated Special Education Data
|
Participation
|
Performance
|
Direct Assessment of Writing |
5,7 |
Writing |
No |
No |
High School Graduation Exam |
10,11 |
Reading, Language, Math (10), Science (10) |
No |
No |
Stanford Achievement Test, 9 |
3-11 |
Reading, Language, Math, Science, Social Studies |
No |
No |
List of Public Reports
Hard Copy
Web Sites
http://www.alsde.edu/standards00/ChartA.jpg (state
chart)
http://www.alsde.edu/standards00/ChartB.jpg (state
chart)
http://www.alsde.edu/standards00/ChartC.jpg (state
chart)
http://www.alsde.edu/ver1/reports.asp?cat=2
(starting point for results for state & district)
http://www.alsde.edu/AllReportCards/syssch_reportcards/0000000.pdf
(state data)
http://www.alsde.edu/AllReportCards/syssch_reportcards/1069999.pdf (sample
district data)
http://www.alsde.edu/ver1/2000HSGrad.asp?systemcode=999&schoolcode=9999
(state data)
http://www.alsde.edu/ver1/2000HSGrad.asp?systemcode=106&schoolcode=0000
(sample district data)
http://www.alsde.edu/ver1/2000SAT.asp?systemcode=000&schoolcode=0000 (state
data)
http://www.alsde.edu/ver1/2000SAT.asp?systemcode=106&schoolcode=0000 (sample
district)
Appendix B
1999-2000 State Assessment Systems and Status of Disaggregated Data
State
|
Assessment Component
|
Grades
|
Subject
|
Disaggregated Special Education
Data
|
Part
|
Perf
|
Alabama |
Direct
Assessment of Writing [CRT] |
5,7 |
Writing |
No |
No |
High School Graduation Exam
[DIPLOMA] |
10,11 |
Reading,
Language, Math (10), Science (10) |
No |
No |
Stanford
Achievement Test, 9th ed. (SAT-9) [NRT] |
3-11 |
Reading,
Language, Math, Science, Social Studies |
No |
No |
Alaska |
California Achievement Test, 5th ed. (CAT-5) [NRT] |
4,7 |
Reading,
Language, Math |
No |
No |
Benchmark Exams [CRT] |
3,6,8 |
Reading,
Writing, Math |
No |
No |
High School Graduation Qualifying
Exam [DIPLOMA]
Class of 2002 must pass portions
of exam to receive an endorsement on diploma |
10 |
Reading,
Writing, Math |
No |
No |
Arizona |
Stanford
Achievement Test, 9th ed. (SAT-9) [NRT] |
2-11 |
Reading,
Language, Math |
No |
No |
AZ
Instrument to Measure Scores (AIMS) [CRT] |
3,5,8 |
Reading,
Writing, Math |
No |
No |
AIMS
[DIPLOMA] |
10 |
Reading,
Writing, Math |
No |
No |
Arkansas |
Stanford
Achievement Test, 9th ed. (SAT-9) [NRT] |
5,7,10 |
Complete
Battery |
No |
No |
Benchmark Exams [CRT] |
4,6,8 |
Literacy
[Reading & Writing] & Math |
No |
No |
California |
Standardized Testing And Reporting Program (STAR) SAT-9 [NRT] |
2-11 |
Reading, Language, Math, Spelling
(2-8),
Science (9-11), Social Science
(9-11) |
Yes |
Yes |
Spanish Assessment of Basic
Education (SABE/2)
Spanish version of STAR [NRT] |
2-11 |
Reading, Language, Math, Spelling
(2-8) |
Yes |
Yes |
Content
Standard [CRT] |
2-11 |
English/Language Arts, Math (2-7,11) [Algebra I, II; Geometry; Integrated
1,2,3 for 8-10] |
Yes |
Yes |
Colorado |
CO
Student Assessment Program (CSAP) [CRT] |
3,4,5,7,8 |
Reading
(3,4,7), Math (5,8), Writing (4,7), Science (8) |
Yes |
Yes |
Connecticut |
CT
Mastery Test (CMT) [DIPLOMA] |
4,6,8 |
Math,
Writing, Reading |
Yes |
Yes |
CT
Academic Performance Test (CAPT) [CRT] |
10 |
Language
Arts, Math, Science, Interdisciplinary |
No |
No |
State
|
Assessment Component
|
Grades
|
Subject
|
Disaggregated Special Education
Data
|
Part
|
Perf
|
Delaware |
DE
Student Testing Program (DSTP) [SAT-9 for R,M with other criterion measures;
[NRT/CRT] |
3-6,8,10,11 |
Reading
(3,5,8,10), Writing (3,5,8,10), Math (3,5,8,10), Science (4,6,8,11), Social
Studies (4,6,8,11) |
Yes |
Yes
|
Florida |
FL Comprehensive Assessment Test
(FCAT) includes SAT-9
[NRT/CRT] |
3-10 |
Reading (NRT 3-10/CRT 4,8,10),
Math (NRT 3-10/CRT 5,8,10),
Writing (CRT 4,8,10) |
No |
No* |
High School Competency Test
(HSCT) [DIPLOMA]
(for those not exempted by their
FCAT performance in 10th grade ) |
11 |
Communications, Math |
No |
No |
Georgia
|
GA High
School Graduation Test (GHSGT) [DIPLOMA] |
11 |
English/Language Arts, Math, Science, Social Studies (Writing) |
Yes† |
Yes† |
Iowa
Test of Basic Skills (ITBS) [NRT] |
3,5,8 |
Reading,
Language Arts, Math, Science, Social Studies |
Yes |
Yes |
Criterion-Referenced Competency Tests (CRCT) [CRT] |
4,6,8 |
Reading,
English/Language Arts, Math |
Yes |
Yes |
Performance Assessments [CRT] |
5,8 |
Writing |
Yes |
Yes |
Hawaii |
Stanford
Achievement Test, 9th ed. (SAT-9) [NRT] |
3,5,7,9 |
[reported Reading, Math only] |
No |
No
|
Idaho
|
ID
Direct Assessments [CRT] |
4,8,11 |
Math
(4,8), Writing (4,8,11) |
Yes† |
Yes |
Iowa Tests of Basic Skills (ITBS)
[NRT]
Tests of Achievement and
Proficiency (TAP) [NRT] |
3-8
9-11 |
Reading, Language, Math, Science
(3,5,7), Social Studies (3,5,7) Sources of Information (3,5,7)
Reading, Writing, Math, Science
Social Studies |
Yes
Yes |
Yes
Yes |
Illinois |
IL
Standards Achievement Test (ISAT) [CRT] |
3,4,5,7,8 |
Reading
(3,5,8), Math (3,5,8), Writing (3,5,8), Science (4,7), Social Studies (4,7) |
Yes |
Yes |
Indiana |
IN
Statewide Testing for Educational Progress (ISTEP+) [NRT/CRT] |
3,6,8 |
Language
Arts, Math |
Yes |
Yes
|
Graduation Qualifying Exam
[DIPLOMA] |
10 |
Language
Arts, Math |
Yes |
Yes |
Iowa |
ITBS/ITED
(VOLUNTARY participation) |
3-11 |
Reading,
Math, Science (9-11) |
---- |
---- |
Kansas |
KS Assessment System [CRT]
|
3,4,5,7,8,10,11 |
Reading
(3,7,10), Math (4,7,10), Writing (5,8,10), Science (5,8,10), Social Studies
(5,8,11) |
Yes |
Yes
|
State
|
Assessment Component
|
Grades
|
Subject
|
Disaggregated Special Education
Data
|
Part
|
Perf
|
Kentucky |
Comprehensive Test of Basic Skills, 5th ed. (CTBS/5) [NRT] |
3,6,9 |
Reading,
Language, Math |
Yes |
Yes |
KY Core
Content Test [CRT] |
4,5,7,8, 10-12 |
Reading
(4,7,10), Math (5,8,11), Writing (4,7,12), Science (4,7,11), Social Studies
(5,8,11), Arts & Humanities (5,8,11), Practical Living & Vocational Studies
(5,8,10) |
Yes |
Yes |
Louisiana |
Developmental Reading Assessment (DRA) [CRT] |
2,3 |
Reading |
No |
No |
Graduation Exit Exam [DIPLOMA] |
10,11 |
Language
Arts (10), Math (10), Writing (10), Science (11), Social Studies (11) |
No |
No |
Iowa
Tests of Basic Skills/Iowa Tests of Educational Development
[NRT] |
3,5-7,9 |
Complete
Battery (reported) |
No* |
No* |
LA
Educational Assessment Program (LEAP 21) [CRT] |
4,8 |
English/Language Arts, Math, Science, Social Studies |
Yes |
Yes |
Maine |
Maine
Educational Assessment (MEA) [CRT] |
4,8,11 |
Reading,
Writing, Health, Science/Technology, Math, Social Studies, Visual &
Performing Arts |
Yes (Reading, Writing, Math only) |
Yes (Reading, Writing, Math only) |
Maryland |
MD
School Performance Assessment Program (MSPAP) [CRT] |
3,5,8 |
Reading,
Writing, Language Usage, Math, Science, Social Studies |
Yes |
Yes |
MD
Functional Tests [DIPLOMA] |
9,11 |
Reading,
Writing, Math, Citizenship |
Yes |
Yes |
Comprehensive Tests of Basic Skills, 5th ed. (CTBS/5) [NRT] |
2,4,6 |
Reading,
Language, Math |
No |
Yes |
Massachusetts |
MA
Comprehensive Assessment System (MCAS) [CRT] |
4,8,10 |
English
& Language Arts, Math, Science & Technology, History & Social Science |
Yes |
Yes |
Michigan |
MI Educational Assessment Program
(MEAP) [CRT]
MI High School Test [CRT] |
4,5,7,8
11 |
Reading (4,7), Math (4,7),
Writing, Science & Social Studies (5,8)
Reading, Math, Writing, Science |
No*
No |
No*
No |
Minnesota |
MN
Comprehensive Assessment (MCA) [CRT] |
3,5 |
Reading,
Math, Writing (5 only) |
No |
No |
Basic
Standards Exam [DIPLOMA] |
8,10 |
Reading
(8), Math (8), Writing (10) |
No |
No |
State
|
Assessment Component
|
Grades
|
Subject
|
Disaggregated Special Education
Data
|
Part
|
Perf
|
Mississippi |
Terra Nova Comprehensive Tests of Basic
Skills, 5th ed. (CTBS/5) [NRT] |
3-8 |
Reading,
Language, Math |
Yes |
Yes |
Functional Literacy Exam (FLE) [DIPLOMA] |
11 |
Reading,
Math, Writing |
Yes |
Yes |
Writing
Assessment [CRT] |
4,7 |
Writing |
Yes |
Yes |
Missouri |
MO
Assessment Program (MAP) (Terra
Nova/CTBS and other measures) [NRT/CRT] |
3,4,7,8,10, 11 |
Science
(3,7,11), Social Studies (4,8,11), Math (4,8,10), Communication
Arts (3,7,11), |
Yes |
Yes |
Montana |
Summary
across different district tests including: CTBS, Terra Nova, CAT; ITBS,
ITED, TAP; TASK, MAT [NRT] |
4,8,11 |
Reading,
Math, Science |
No |
No |
Nebraska |
(allow 6
NRTs for use by districts, will report district info to state 00-01) |
--- |
--- |
--- |
--- |
Nevada |
Terra Nova Comprehensive Tests of Basic
Skills, 5th ed. (CTBS/5) [NRT] |
4,8,10 |
Reading,
Language, Math, Science (all 4, 8, 10); Writing (4, 8) |
No |
No |
Graduation Exam [DIPLOMA] |
9-12 |
Reading,
Math, Writing |
No |
No |
New Hampshire |
NH
Educational Improvement and Assessment Program (NHEIAP) [CRT] |
3,6,10 |
English
Language Arts, Math, Science (6,10), Social Studies (6,10) |
Yes |
Yes |
New Jersey |
High
School Proficiency Test (HSPT 11) [DIPLOMA] |
11 |
Reading,
Math, Writing |
Yes
(1999) |
Yes
(1999) |
Grade Eight Proficiency
Assessment (GEPA) [CRT]
Elementary School Proficiency
Assessment (ESPA) [CRT] |
8
4 |
Language Arts/Literacy, Math,
Science
Language Arts/Literacy, Math,
Science |
Yes
Yes |
Yes
Yes |
New Mexico |
NM
Articulated Assessment Program (NMAAP) (CTBS/5 & other criterion measures)
[NRT/CRT] |
3-9 |
Reading,
Language, Math, Science, Social Studies |
No |
Yes |
NM High
School Competency Exam [DIPLOMA] |
10 |
Reading,
Language Arts, Math, Science, Social Studies, Writing |
No |
Yes |
NM
Writing Assessment Program [CRT] |
4,6 (8 optional) |
Writing |
No |
Yes |
State
|
Assessment Component
|
Grades
|
Subject
|
Disaggregated Special Education
Data
|
Part
|
Perf
|
New York |
Career
Education Proficiency Exams [DIPLOMA] |
9-12 |
Occupational Education |
Yes |
Yes
|
Regents
Comprehensive Exams [DIPLOMA] |
9-12 |
English,
Foreign Languages, Math, History/Social Studies, Science |
Yes |
Yes
|
Regents Competency Test
[DIPLOMA] |
9-12 |
Math,
Science, Reading, Writing, Global Studies, US Hist & Gov’t |
Yes |
Yes
|
NY State
Assessment Program [CRT] |
4,8 |
English/Language Arts, Math, Science (Gr 4 only) |
Yes |
Yes |
North Carolina |
Iowa
Tests of Basic Skills (ITBS) [NRT]:
representative sample |
5,8 |
Reading,
Language, Math |
No |
No |
Testing System Grades 3-8
·
Gr. 3 Pre-test [CRT] |
3 |
Reading, Math |
Yes |
Yes |
·
End of Grade [CRT] |
3-8 |
Reading,
Math |
Yes |
Yes |
·
Writing test [CRT] |
4 & 7 |
Writing |
Yes |
Yes |
·
Open Ended [CRT] |
4 & 8 |
Reading,
Math |
Yes |
Yes |
·
Computer Skills [CRT] |
8 |
Computer |
Yes |
Yes |
Testing System Grade 9 – 12
·
Competency [DIPLOMA] |
9 |
Reading, Math |
No |
No
|
·
High School Comprehensive Test [CRT] |
10
|
Reading,
Math |
Yes |
Yes |
·
End of Course [CRT] |
9-12 |
Biology,
Chemistry, Economics, English I, Physical Science, Physics, U.S. History,
Algebra I, Algebra II, & Geometry |
Yes |
Yes |
North
Dakota
|
Comprehensive Tests of Basic Skills (CTBS/5) [NRT] |
4,6,8,10 |
Reading,
Language, Math, Science, Social Studies, Spelling |
No |
Yes |
Ohio |
OH
Proficiency Tests [CRT] |
4,612 |
Reading,
Writing, Math, Science, Citizenship |
Yes |
Yes |
OH
Proficiency Test [DIPLOMA] |
9 |
Reading,
Writing, Math, Science, Citizenship |
Yes |
Yes |
Oklahoma |
Core
Curriculum Tests [CRT] |
5,8,11 |
Reading,
Math, Writing, Science, History/Constitution/ Government, Geography, OK
History, Art |
Yes |
Yes
(5,8 only)
|
Oregon |
OR State Assessment [CRT]
Certificate of Mastery for 10th
[DIPLOMA] |
3,5,8, 10
|
Reading/Literature, Math, Math Problem Solving (5,8,10), Writing, Science
(8,10) |
Yes
(Math & Reading) |
Yes
(Math & Reading) |
Pennsylvania |
PA
System of School Assessment (PSSA) [CRT] |
5,6,8,9,11 |
Reading
(5,8,11), Math (5,8,11), Writing (6,9) |
No |
No |
State
|
Assessment Component
|
Grades
|
Subject
|
Disaggregated Special Education
Data
|
Part
|
Perf
|
Rhode
Island
|
New Standards Reference
Examinations [CRT]
RI State Writing Assessment [CRT]
RI Health Education Assess [CRT] |
4,8,10
3,7,10
5,9 |
Reading, Math, Writing
Writing
Health |
No
Yes
Yes |
Yes
Yes
Yes |
South Carolina |
Palmetto
Achievement Challenge Tests (PACT) [CRT] |
3-8 |
English/Language Arts, Math |
Yes |
Yes |
High
School Exit Exam [DIPLOMA] |
10 |
Reading,
Math, Writing |
No |
Yes |
Cognitive Skills Assessment Battery (CSAB) [CRT] |
1 |
Readiness (specific skills listed on printouts) |
Yes |
Yes |
South
Dakota
|
Stanford Achievement Test, 9th
ed. (SAT-9) [NRT]
Stanford Writing Assessment [NRT] |
2, 4, 8, 11
5,9 |
Reading, Language Arts, Math,
Environment (2), Science (4,8,11), Social Studies (4,8,11)
Writing |
No
No |
No
No |
Tennessee |
TN
Comprehensive Assessment (TCAP) (Terra
Nova CTBS/5) [NRT] |
3-8, 11 |
Reading,
Language, Math, Science, Social Studies (3-8), Writing (4, 7, 11) |
No |
No |
TN
Competency Test [DIPLOMA] |
9-12 |
Math,
Language Arts |
No |
No |
High
School Subject Tests [CRT] |
9-12 |
Math
(End-of-Course in Algebra I, II, Geometry., Tech I) |
No |
No |
Texas |
TX
Assessment of Academic Skills (TAAS) [CRT] |
3-8
|
Reading,
Math, Writing Science, Social Studies; Spanish version for 3-6 |
Yes |
Yes |
Exit
Level TAAS [DIPLOMA] |
10-12 |
|
Yes |
Yes |
Statewide End-of-Course Tests [CRT] |
9-12 |
Algebra
I, English II, US History, Biology |
Yes |
Yes |
Reading
Proficiency Tests in English [CRT] |
3-12 |
English
Reading Proficiency |
Yes |
Yes |
Utah |
Stanford
Achievement Test, 9th ed. (SAT-9) [NRT] |
5,8,11 |
Reading,
Language, Math, Science, Social Studies |
Yes |
Yes |
Core Curriculum Assessment
Program (includes specific End-of-Course Tests for grades 7-12)
[CRT] |
1-12 |
Elem.
Reading/Language Arts (1-6), Elem. Math (1-6), Elem. Science (4-6),
Secondary Science** (7-12), Secondary Math** (7-12) |
No |
No |
Vermont |
VT
Comprehensive Assessment System [CRT] |
2,4,6,8,10,
11 |
Reading
(2), English/ Language Arts (4,8,10), Math (4,8,10), Science (6,11) |
No |
No |
VT Math
and Writing Portfolio Assessments [CRT] |
4,5, 8,10
|
Math (4, 8, 10)
Writing (5, 8) |
No |
No |
State
|
Assessment Component
|
Grades
|
Subject
|
Disaggregated Special Education
Data
|
Part
|
Perf
|
Virginia |
Standards of Learning (SOL) [CRT] |
3,5,8 |
English,
Math History, Science, Writing (5, 8), Computer Technology (5, 8) |
No |
No |
Standards of Learning [CRT]
Beginning with the 9th
grade class of 2000-01 these tests will be required to obtain a Standard or
Advanced Diploma |
9-12 |
English
(9-11), Math (Algebra I, II, & Geometry), History/Social Science, Science
(Earth, Biology, Chemistry) |
No |
No |
VA State
Assessment Program (VASP) (SAT-9-abbreviated) [NRT] |
4,6,9 |
Reading,
Language, Math [Science, Social Studies are optional] |
Yes |
Yes |
Literacy
Testing Program’s Literacy Passport Test [GRAD/ DIPLOMA] |
6-12 |
Reading,
Writing, Math |
No |
No |
Washington |
WA
Assessment of Student Learning (WASL) [CRT] |
4,7,10 |
Reading,
Writing, Listening, Math |
Yes |
Yes |
Iowa
Tests of Basic Skills/Iowa Tests of Educational Development
(ITBS/ITED) [NRT] |
3,6,9 |
Reading,
Language (6), Expression (9), Math (3,6), Quantitative Thinking (9) |
No |
No |
West Virginia |
Stanford
Achievement Test, 9th ed. (SAT-9) [NRT] |
3-11 |
Basic
Skills (Reading, Math, Language) |
Yes |
Yes |
WV
Writing Assessment [CRT] |
4,7,10 |
Writing |
No |
No |
Wisconsin |
WI
Knowledge and Concepts Exam (WKCE) [CRT] |
4,8,10 |
Reading,
Language Arts, Math, Science, Social Studies |
Yes |
Yes |
WI
Comprehensive Reading Test (WCRT) [CRT] |
3 |
Reading |
No |
No |
Wyoming |
WY
Comprehensive Assessment System (WyCAS) [CRT] |
4,8,10 |
Reading,
Writing, Math |
No |
No |
Terra Nova Comprehensive Tests of Basic
Skills, 5th ed. (CTBS/5) [NRT] |
4,8,10 |
Reading,
Language, Math |
No |
No |
* = data is
available in unbound documents but was not found on-line or in bound reports
† = data was in a press release but not in any formal reports
‡ = district
tests only, there are no statewide exams
V = district
participation in these exams are voluntary
Appendix C
Disaggregated Participation Information
State |
Test |
Count |
Count
Not Tested |
Count
Exempt |
Count
Excluded |
Percent
of students tested |
Percent
of students not tested |
Percent
Exempt |
Percent
Excluded |
Count
and/or
Percent
Absent |
California |
STAR
(SAT-9) |
· |
|
|
|
|
|
|
|
|
|
Content Standard |
· |
|
|
|
|
|
|
|
|
|
SABE/2 |
· |
|
|
|
|
|
|
|
|
Colorado1,2 |
CSAP |
·* |
|
|
|
|
|
|
|
|
Connecticut |
CMT |
|
|
|
|
|
|
· |
|
|
Delaware |
DSTP
(SAT-9) |
· |
|
|
|
|
|
|
|
|
Georgia |
GHSGT |
· |
|
|
|
|
|
|
|
|
|
ITBS |
· |
|
|
|
|
|
|
|
|
|
Criterion-Referenced Competency
Tests |
· |
|
|
|
|
|
|
|
|
|
Performance Assessments |
· |
|
|
|
|
|
|
|
|
Idaho |
IDA |
· |
|
|
|
|
|
|
|
|
|
ITBS
TAP |
· |
|
|
|
|
|
|
|
|
Illinois |
ISAT |
|
|
|
|
· |
|
|
|
|
Indiana2 |
ISTEP |
· |
|
|
|
|
|
|
|
|
|
GQE |
· |
|
|
|
|
|
|
|
|
Kansas |
KAS |
· |
|
|
|
|
|
|
|
|
Kentucky
|
CTBS/5 |
· |
|
|
|
|
|
|
|
|
|
KCCT |
· |
|
|
|
|
|
|
|
|
Louisiana3
|
LEAP 21 |
· |
|
|
|
· |
|
|
|
|
Maine |
MEA |
· |
|
|
|
|
|
|
|
|
Maryland |
MSPAP |
· |
|
· |
|
|
|
|
|
|
|
MFT |
· |
|
|
|
|
|
|
|
|
Massa-chusetts |
MCAS |
|
|
|
|
·
|
|
|
|
|
Mississippi |
CTBS/5 |
· |
|
|
|
|
|
|
|
|
|
FLE |
· |
|
|
|
|
|
|
|
|
|
Writing Assessment |
· |
|
|
|
|
|
|
|
|
Missouri |
MAP |
· |
|
|
|
|
|
|
|
|
New Hampshire |
NHEIAP |
|
|
|
· |
|
|
|
|
|
New Jersey |
GEPA/ESPA
HSPT |
·
· |
|
|
|
|
|
|
|
|
New York |
Career Education Proficiency
Exams |
· |
|
|
|
|
|
|
|
|
|
Regents Comp-rehensive Exams |
· |
|
|
|
|
|
|
|
|
|
Regents Competency Test |
· |
|
|
|
|
|
|
|
|
|
NYSAP |
· |
|
|
|
|
|
|
|
|
State |
Test |
Count |
Count
Not Tested |
Count
Exempt |
Count
Excluded |
Percent
of students tested |
Percent
of students not tested |
Percent
Exempt |
Percent
Excluded |
Count
and/or
Percent
Absent |
North Carolina1 |
End of Grade
|
·2 |
|
|
· |
· |
|
|
· |
· |
|
Grade 3 Pretest |
·2 |
|
|
· |
|
|
|
|
|
|
Writing test |
· |
|
|
|
|
|
|
|
|
|
High School Comp-rehensive Test |
·2 |
|
|
· |
|
|
|
|
|
|
End of Course |
·2 |
|
|
· |
|
|
|
· |
|
|
Computer Test |
·2 |
|
|
|
|
|
|
|
|
|
Open ended assessments |
·2 |
|
|
|
|
|
|
|
|
Ohio |
OPT |
|
|
|
|
· |
|
|
|
|
|
OPT (Grade 9 Proficiency) |
|
|
|
|
· |
|
|
|
|
Oklahoma |
Core Curriculum Tests |
· |
|
|
|
|
|
|
|
|
Oregon |
OSA |
· |
|
|
|
· |
|
|
|
|
Rhode Island2 |
Writing Assessment
Health Education Assessment |
· |
· |
|
|
|
|
|
|
|
South Carolina |
PAT |
· |
|
|
|
|
|
|
|
|
|
CSAB |
· |
|
|
|
|
|
|
|
|
Texas |
TAAS |
· |
· |
· |
|
|
|
|
|
· |
|
RPTE |
· |
· |
· |
|
|
|
|
|
· |
|
EOC |
· |
· |
· |
|
|
|
|
|
· |
|
Exit Level TAAS |
· |
· |
· |
|
|
|
|
|
· |
Utah |
SAT-9 |
· |
|
|
|
|
|
|
|
|
Virginia |
VSAP |
· |
|
|
|
|
|
· |
|
|
Washington |
WASL |
· |
|
|
|
|
· |
· |
|
|
West Virginia4 |
SAT-9 |
|
|
|
|
· |
|
|
|
|
Wisconsin * |
WKCE |
|
|
|
· |
|
· |
|
|
|
Top of page