Prepared by:
John Bielinski and James E. Ysseldyke
October 2000
Any or all portions of this document may be reproduced and distributed without prior permission, provided the source is cited as:
Bielinski, J., & Ysseldyke, J. E. (2000). Interpreting trends in the performance of special education students (Technical Report 27). Minneapolis, MN: University of Minnesota, National Center on Educational Outcomes. Retrieved [today's date], from the World Wide Web: http://cehd.umn.edu/NCEO/OnlinePubs/TechReport27.htm
The 1997 reauthorization of the Individuals with Disabilities Act (IDEA) included provisions specifying that states and districts must include students with disabilities in their assessment systems, with accommodations where appropriate, and that states report on the performance of students with disabilities in the same detail and frequency that they report on the performance of general education students. Using a large longitudinal database, this study examined the effect that transitions between regular education and special education across grades had on performance trends for the special education population. This study also examined the effect that changes in exemption rates across grades for students with disabilities had on performance trends.
We found that the highest achieving special education students left special education to return to general education, and that they were replaced by the lowest performing regular education students who had been referred to and found eligible for special education. The result was a substantial increase in the performance gap over time between regular education and special education students across grades. Furthermore, the reduction in exemption rates from testing that has occurred over time (and that is reflected in this study primarily in the higher grades) added to the size of the gap. When the same group of special education students was tracked over time, however, the gap actually decreased slightly.
Our findings have significant implications for states as they begin to publicly report disaggregated data on students with disabilities, particularly if attempts are made to track performance across time. Failure to document and account for changes in students’ special education status and previous exemption rates from testing could result in misinterpretations about the effectiveness of special education services. By restricting the group of students for longitudinal analysis to those who were in special education during the first year of analysis (and following their performance regardless of whether they remained in special education or they moved to special education), a more accurate indication of progress over time will be obtained. Thus, states should consider ways to both report on the performance of all students with disabilities and the longitudinal performance of clearly defined targeted groups of special education students.
Educators, parents, policymakers, and citizens want and need to know the extent to which all students, including students with disabilities, are profiting from their educational programs. Recent school reforms are resulting in greater attention to the educational results of students with disabilities. The 1997 reauthorization of the Individuals with Disabilities Education Act (IDEA 97) included provisions requiring that states and districts include students with disabilities in their assessment systems with accommodations where appropriate. Also, states are to disaggregate data on the performance of students with disabilities with the same detail and frequency they report on the performance of regular education students, and beginning July 2000 to report on the performance of students with disabilities on alternate assessments. IDEA 97 provisions are producing more publicly available data on the educational results of students with disabilities than have ever been available in the past. A recent report by the National Center on Educational Outcomes (NCEO) found that 17 states publicly reported achievement results for students in special education (Thurlow, Nelson, Teelucksingh, & Ysseldyke, 2000). Each year more states are coming on line with results.
Since the results fill an important void, and because they are readily available in state reports, the public, media, policymakers, and educational researchers will be inclined to use the results to interpret performance levels and performance trends for students with disabilities. Purportedly the main reason for disaggregation is to obtain some indication of how well education is working for students with disabilities and then, over time, to use such data to make improvements in the delivery system. A central concern is whether students with disabilities are benefiting from education to the same degree as their non-disabled peers. To do this requires clear and consistent groups over time. Special education status is one factor that potentially complicates the reporting of performance over time because group membership may change. This report documents several factors that, unless taken into consideration, will lead to misinterpretation of trends in the performance of students with disabilities across grades.
Currently, large-scale performance trend data for students with disabilities are difficult to find. The few results that have been reported, for the most part, paint a grim picture of the performance of students with disabilities (see Thurlow et al., 2000). The achievement gap between students with disabilities and their non-disabled peers has been shown to grow steadily across grades (Trimble, 1998). Additional disappointing findings emerged when NCEO summarized passing rates for students with disabilities and students without disabilities across several states (Ysseldyke, Thurlow, Langenfeld, Nelson, Teelucksingh, Seyfarth, 1998). Although the criteria for passing varied across states, in every state passing rates were found to be lower for students with disabilities. In the most recent analysis (Thurlow et al., 2000) the difference in passing rates between the two groups ranged from 23% to 47%, with an average difference of 37%. Regular education students were 2.5 times more likely to meet minimum state requirements in 8th grade than were the students with disabilities. Similar differences were shown in mathematics.
Performance trends across grades also have been tracked in Kentucky (Trimble, 1998), and the achievement gap reported as effect sizes. The gap between students with and without disabilities on the 1996 reading test was less than .25 in 4th grade, almost .70 in 8th grade, and over .80 in 11th grade. The size of the achievement gap quadrupled from 4th grade to 11th grade! Assuming a normal test score distribution, the average score of 4th graders with disabilities fell at the 40th percentile of the test score distribution of students without disabilities, whereas the average score of 11th graders with disabilities fell at just the 21st percentile.
The question we consider in this report is, "Can disaggregated test results for students with disabilities be used to make valid inferences about whether students with disabilities are benefiting from education to the same degree as their non-disabled peers?" The expectation would be that achievement growth rates for students with disabilities should be similar to those of students without disabilities. Evidence of this would be a steady performance gap across grades. That is, the achievement gap between students with and without disabilities should be the same at 11th grade as it is at 3rd grade. Findings described above suggest that is not the case. If these trends across grades validly reflect the degree to which students are benefiting from education, then the conclusion would be that students with disabilities are not benefiting from education to the same degree as their peers without disabilities.
In this report we examine how certain factors influence performance trends for students with disabilities as a group differently than for the group of students without disabilities, and that disregarding these factors will lead to invalid inferences about achievement growth for students with disabilities. Two factors are examined. One factor is that disability status is dynamic. It is not uncommon for a student to be labeled as having a disability for reporting purposes one year, but not labeled the following year. A classical example is speech/language disability. Prior to 5th grade, this is one of the most commonly used disability categories, but it is a category that is rarely used after 5th grade. Disability classification is often tied to achievement such that low achieving students are more likely to get a disability label. Students are also declassified, but we know relatively little about how declassification is tied to achievement.
The other factor potentially influencing performance trends for students with disabilities is testing rates. Several reports have shown that testing rates among students with disabilities are higher in secondary school than in primary school (Trimble, 1998). It is likely that students with disabilities tested in primary school are a more select group (with respect to achievement) than are the students with disabilities tested in secondary school. This alone could result in a larger achievement gap at higher grade levels.
Any interpretation of performance trends should always consider the manner in which trends were recorded. To talk about trends, there must be longitudinal data. There are two common data collection practices for generating longitudinal performance trends. One practice is to gather data from a cross-section of examinees across several grade levels; we will call this the cross-sectional method. The other practice is to track a cohort over several years; we will call this the cohort-method. The principal advantage of the cross-sectional method is that performance trends can be recorded using a single year’s test results.
Most states report results from tests administered at different grades. Trends in the performance of various groups can be described by comparing the size of the gap at different grades. The results available in most state reports are based on cross-sectional data collection. A disadvantage of this method is that the gap between groups is calculated on different students at each grade. If the characteristics of a particular group (e.g., students with disabilities) change substantially across grades, then one is really comparing apples (e.g., 4th graders) to oranges (e.g., 8th graders); they are different students. Of course, this would necessarily be true also for students without disabilities, but the effect on performance might be less because there are so many more students without disabilities, and changes in status of some students would be less noticeable.
With the cohort method, the gap at a higher grade (e.g., 8th grade) is calculated on the scores of students who were used to calculate the gap in an earlier grade (e.g., 4th grade). Barring high dropout rates or some dramatic shift in the demographics in an entire state, changes in the gap will reflect real differences in achievement growth rates for each group. The principal shortcoming of this method is that states rarely stay with a particular testing program long enough to generate longitudinal data on cohorts.
The cohort method of generating longitudinal data may be further divided into two approaches. One approach was discussed above: the gap at 8th grade is compared to the gap at 7th grade, and so on back to 4th grade, using data collected each time using the initial data collected in that year (e.g., 8th grade data from 1999, 7th grade data from 1998, and so on). We refer to this method as the cohort-dynamic method because group composition often changes from one year to the next. The second approach requires that the same students be tested at each grade. We refer to this method as the cohort-static method.
One challenge to reporting performance trends is that meaningful comparisons across different tests (tests designed for different grades) require that the scores are reported on state-developed criterion referenced tests usually do not allow for direct comparison of scores from one garde to the next. Other methods for reporting trends across grades must be considered. One method is to report group differences within a grade using the effect size. Because effect sizes represent a common scale, one can report trends in the magnitude and direction of the effect size across grades. One group is treated as the reference group, the other group is treated as the focal group. Changes in the effect size from one grade to the next indicate differences between the groups in the rate of achievement growth across those grades. In this report the effect size is reported in each grade (4th—8th) using students with IEPs as the focal group and regular education students as the reference group.
The equation below shows how effect size is calculated.
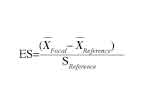
The numerator represents the mean achievement difference between the reference group (regular education) and the focal group (special education). The denominator represents the standard deviation of the test scores for the reference group. Let us assume in our hypothetical example that we obtain an ES=.50. This effect size indicates that the mean score for the focal group was one-half of a standard deviation unit below the mean score of the reference group. Assuming a normal score distribution, and using a Z-score table, we find that the mean score for focal group falls at the 30th percentile of the reference group’s score distribution.
The first objective of this study was to report trends in the performance gap between regular education and special education students using data from a state with a large population of students and a testing program that assessed students at nearly every grade. We used the three methods to define groups and report trends:
Cross-sectional. As is typical for cross-sectional data, the performance gap between special education students and regular education students is reported using data from a single administration of the state’s test. The 1995 scores were chosen because that year falls in the middle of the range of years from which we had data. The gap within each grade, 4th through 8th, was computed. In this analysis, one group represents the students receiving special education services in that grade, and the other group represents students not receiving special education services (i.e., the regular education group).
Cohort static. Group membership (i.e., special education or regular education) was determined by each student’s status in 1993, and remained static across years. Thus, students who were in special education in 1993 were always in this group, even though their actual status might have changed over the years. Test performance for each group was tracked over five years, and the gap in each year computed.
Cohort dynamic. The sample was comprised of all 4th graders tested in 1993, and test performance was tracked for five consecutive years. Group membership (special education vs. regular education), however, was redefined each year. Therefore, in each year, the students receiving special education services in that grade were always compared to the students NOT receiving special education services (i.e., regular education students). Because special education status may vary over time for each student, group membership was dynamic.
Trend-lines were graphed, and visual analyses was used to interpret the findings. It was unnecessary to conduct inferential analysis because the entire population of students was used. Therefore, any differences represent population differences and are not affected by sampling error.
The next phase of analysis was to examine how the trend lines under the various methods are affected by changes in special education status. Four groups of students were defined: (1) students who remained in regular education from one year to the next, (2) students who moved from regular education to special education, (3) students who moved from special education to regular education, and (4) students who remained in special education from one year to the next. Membership in these four groups was determined solely by status in adjacent years. Test performance was based on the first of the two adjacent years.
The last phase of analysis compared test performance for students tested in one year but not the next with those tested in consecutive years. The comparison was made for both special education and regular education students. If exemption from testing is a function of performance wherein lower performing students are more likely to be exempt, then students tested in consecutive years will outperform those tested in one year but not the next.
Table 1 shows the rate at which students transition between regular education and special education. Two groups were defined: students who moved from regular education to special education the following year (labeled Enter); and students who moved from special education to regular education (labeled Left). There were 25,799 students receiving special education services in 4th grade in 1993. Among those, 3,316 or 12.9% did not receive services in 1994, while 4,626 students (17.9%) who were not receiving special education services in 1993, received special education services in 1994. No students who may have entered the state after 1993 were included in our analyses.
Table 1. Percent of Special Education Population Entering and Leaving Special Education Each Grade
Grade 4 |
Grade 5 |
Grade 6 |
Grade 7 |
|||||
Left |
Enter |
Left |
Enter |
Left |
Enter |
Left |
Enter |
|
| Total | 12.9 | 17.0 | 11.1 | 13.0 | 9.3 | 10.6 | 9.6 | 8.0 |
| Male | 12.1 | 16.2 | 10.4 | 12.8 | 8.5 | 10.0 | 8.8 | 7.6 |
| Female | 14.5 | 18.8 | 12.3 | 13.3 | 10.9 | 11.6 | 11.2 | 8.3 |
The rate at which students were added to special education was higher than the rate of students leaving special education after every grade but 7th grade. The rate of leaving special education or entering special education decreased from one grade to the next. The rate of entering special education dropped from 17% after 4th grade to 8.0% after 7th grade. The rate at which students left special education decreased from 12.9% after 4th grade to 9.6% after 7th grade.
In any given year, roughly 80% of the special education population remained unchanged. If one were to assume that a student’s status changed only once, then the transition rates reported here would mean that the special education population would completely turn over in five years! However, as it is, two-thirds of the original special education population remained in special education across all five years. Not only did students leave special education, but some of them returned to special education. For instance, 541 (or 16%) of the students who left special education after 4th grade returned after 5th grade. In total, over 39,000 students changed status at least once over the five years; of these students, over 6,100 changed status at least twice. The transient nature of special education status, at least in the state from which these data were obtained, begs the question, "To whom is the performance of this transient group attributed, special education or general education?"
Figures 1 and 2 show the trends in the achievement gap between a reference group of regular education students and a focal group of special education students across five consecutive years. The precise characteristics of the groups depends upon which reporting method was used (i.e., cross-sectional, cohort-dynamic, or cohort-static). For the cross-sectional and cohort-dynamic comparisons, the reference group is made up entirely of students in regular education, and the focal group is composed entirely of students in special education. For the cohort-static comparison, the reference group is composed of all students who were in regular education in 1993, regardless of their status in subsequent years. Likewise, the focal group is composed of all students who were in special education in 1993 regardless of their status in subsequent years. The x-axis represents the grade in which the test was given, and the y-axis represents the achievement gap between special and regular education students defined by the effect size. Although not explicitly shown, the horizontal line equal to zero represents the achievement of the regular education students. Effect sizes were computed such that negative values indicate that the focal group (i.e., special education) mean was below that of the reference group (regular education) mean. Only students who had a valid test score in all five years were included in this analysis.
Figure 1. The Reading Test Score Effect Size Between Regular Education and Special Education Students
Figure 2. The Math Test Score Effect Size Between Regular Education and Special Education Students
Because of the way in which group membership was defined, the cohort static and the cohort dynamic trend lines consisted of identical groups in 4th grade. Under all three methods of tracking grade trends, the mean achievement score for students in special education fell substantially below the regular education mean achievement score. However, after that grade the trend lines diverge. Under the cohort-static method (where group membership remained the same across grades), the reference group gained some ground. The effect size for the reading test score decreased slightly from -.48 in 4th grade to -.42 in 8th grade. This trend contrasts with the increasing achievement gap under the cohort-dynamic method, in which the effect size increased precipitously from -.48 in 4th grade to -.93 in 8th grade. Translated in terms of percentile ranks, the mean test score for the special education students in 4th grade was at the 31st percentile of the regular education score distribution. By 8th grade, under the cohort-static method the mean for the focal group (most special education students) was at the 28th percentile of the regular education score distribution, while under the cohort-dynamic method, the mean for the focal group (students in special education in 8th grade) dropped to the 18th percentile of the regular education score distribution. The cross-sectional trend line mirrored the cohort-dynamic trend line. Among 4th graders taking the test in 1995, the effect size between regular education and special education students was -.64, and it grew to –1.16 by 8th grade. The gap increased by more than .50 standard deviation units.
The findings in math achievement were similar. The achievement gap from 4th to 8th grade increased .52 standard deviation units under the cross-sectional method, and .56 standard deviation units using the cohort dynamic method, but it decreased .04 standard deviation units under the cohort static method.
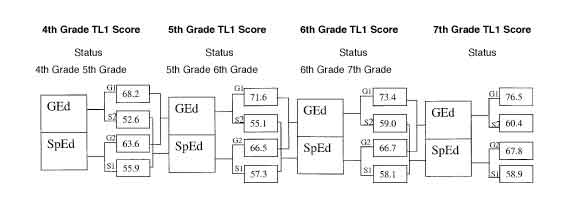
We speculated that the reason the trend lines differed so dramatically is that the characteristics of students in special education changed dramatically across grades, and that this change is tied to student achievement. To demonstrate how transitions between regular education and special education are tied to achievement we examined the relationship between achievement and movement into and out of special education. Each year, the mean score for students representing four groups was determined. The groups were defined by special education and regular education in two consecutive years. Group 1 (labeled G1) represented students who remained in regular education, Group 2 (labeled S2) were those who moved out of regular education and into special education, Group 3 (labeled G2) were those who moved out of special education and into regular education, and Group 4 (labeled S1) were those who remained in special education both years. The mean reading achievement score for each group at each grade is shown in Figure 3. Group membership is based upon each student’s status in the year following the test score. For instance, the mean reading score for 4th grade students who remained in regular education in 5th grade was 74.5, whereas the score for the regular education students who moved into special education was 58.9.
Figure 3. Mean Reading Test Performance for Students Whose Status Changed or Did Not Change
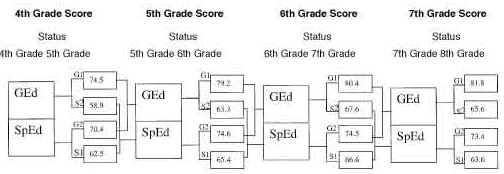
G1 = Students who remained in general education in the following
year.
S2 = Students who moved from regular education into special education the following year.
G2 = Students who moved from special education into regular education the following year.
S1 = Students who remained in special education the following year.
There are two particularly important results. First, in each year, the average test score for the students leaving special education was much higher than it was for those who remained in special education. On the reading test, the mean difference between these two groups ranged from between 6 and 9 points, which translates to between one-third and one-half of a standard deviation unit. On the math test, the students leaving special education outperformed those remaining in special education by roughly 9 points, or about one-half of a standard deviation unit (see Figure 4). The other important result is that the students leaving special education were replaced by a much lower achieving group of regular education students. On the reading test, the mean difference between those leaving special education and those entering special education ranged from 7 points in 6th grade to nearly 12 points in 4th grade. On the math test, the difference ranged from 7 points in 6th and 7th grade to more than 11 points in 5th grade. In standard deviation units, these results indicate that students leaving special education outperformed those entering special education by as much as .75 standard deviation units. The group moving from regular education into special education often had a lower mean achievement level than the group of students who remained in special education in the consecutive four years. Between grades 4 and 5, and grades 5 and 6, those who remained in special education outperformed those who moved from regular education into special education.
Figure 4. Mean Math Test Performance for Students Whose Status Changed or Did Not Change
G1 = Students who remained in general education in the following
year.
S2 = Students who moved from regular education into special education the following year.
G2 = Students who moved from special education into regular education the following year.
S1 = Students who remained in special education the following year.
If decisions about whether a student should receive special education services are tied to achievement, such that the services are provided only to those students whose achievement falls well below their regular education peers, then one may predict that there would be uncertainty about what to do with students whose achievement is not well below their general education peers. To test this assertion, we calculated the mean achievement score for students who moved between special education and regular education more than once, and compared it to scores for students who moved only once, and to those whose status remained unchanged all five years. We speculated that mean achievement levels for students who moved between special education and regular education more than once, would fall between those who moved once from regular education to special education, and those who moved once from special education to regular education. Five groups of students were defined. The two stable groups, expected to define the achievement extremes, were those who remained in regular education all five years and those who remained in special education all five years (i.e., grades 4 through 8). Two groups were defined by students who made exactly one transition; either from special education to regular education or from regular education to special education. The final group was comprised of students whose status changed at least twice.
Figures 5 and 6 show the mean test performance at each grade for the five groups for reading and math respectively. For those who had only one status change, the change could have occurred in any grade 4 through 7. As expected, the achievement of students who remained in regular education was the highest and those who remained in special education was the lowest. The mean achievement of students who transitioned back and forth between special education and general education fell between the achievement of those who moved once from special education to general education and those who moved once from general education to special education. In fact, in both reading and math the "back-and-forth" group’s mean test performance fell almost exactly between the performance of those who remained in special education throughout the five years and those who remained in general education throughout the five years.
Figure 5. Mean Reading Test Scaled Scores for Groups Defined by General Education/Special Education Status
Figure 6. Mean Math Test Score for Groups Defined by General Education/Special Education Status
Table 2 shows the testing rates for students in special education and general education. The percent of the regular education students tested in each grade increased from roughly 93% in 4th grade to nearly 97% by 8th grade. The increase in testing rates was more dramatic among students in special education. In 4th grade, only 41.9% of the special education students took the reading test and 47.2% took the math test. By 8th grade, the testing rate for special education students increased to 61.1% in reading and 60.7% in math. The most notable jump in the testing rate for special education students occurred between 6th and 7th grade where the rate jumped from roughly 45% to nearly 60%.
Table 2. Percent of Students in Each Group Tested Each Grade
Grade |
Percent Tested |
|||
Reading |
Math |
|||
GEd |
SpEd |
GEd |
SpEd |
|
4 |
92.9 |
41.9 |
93.1 |
47.2 |
5 |
93.6 |
42.4 |
93.8 |
45.6 |
6 |
96.2 |
45.0 |
96.1 |
46.6 |
7 |
97.4 |
59.2 |
97.2 |
59.5 |
8 |
96.9 |
61.1 |
96.9 |
60.7 |
To demonstrate the impact of the increased testing rates, we tracked the achievement gap between students receiving special education services in 4th grade and those not receiving services in 4th grade under two scenarios. Under one scenario, the achievement gap was computed using only students who had valid test scores all five years—this trend line is the same as the cohort-static trend line in Figures 1 and 2. Under the other scenario, all students with a valid test score in any given year were used to compute the achievement gap. Although students were assigned to a group based upon their status in 4th grade, many of the 4th graders were not tested. Therefore, the achievement gap includes different students in subsequent grades. The trend lines are shown in Figures 7 and 8 for reading and math, respectively. The solid line in each figure is based on students with a valid test score all five years, making it identical to the cohort-static trend line in Figures 1 and 2. The dashed line represents the trend line when all students tested in a given year are used to compute the achievement gap. The dashed line drops precipitously with increasing testing rates. The achievement gap, represented as an effect size, increased from -.60 in 4th grade to -.94 in 7th grade on the reading test, and from -.65 to -.98 on the math test. These results suggest that the students from the special education group who were exempt from testing in the earlier grades were lower achievers compared to those who were tested every year.
Figure 7. The Effect Size on the Reading Test Across Grades by Two Groups of Special Education Students Reflecting Variations in Testing Rates
Figure 8. The Effect Size on the Math Test Across Grades for Two Groups of Special Education Students Reflecting Variations in Testing Rates
In order to determine whether students who were exempt from testing were a lower achieving group than the special education students tested, we compared the achievement of students tested in two consecutive years with those tested one year, but not the next. These results for the reading test are shown in Table 3, and those for the math test in Table 4. At each grade level, the students who had been tested in one year but not the following year had a substantially lower achievement level than those tested in consecutive years. Among students in special education, this difference was as high as 13.8 points on the 4th grade reading test. The pattern among regular education students was similar. The difference between regular education students tested in 4th and 5th grade, and those tested in 4th grade but exempt from testing in 5th grade was 16.1 points. By 7th grade, the difference dropped to 8.7 points. This finding implies that the results are biased in favor of higher achievement. In order to ascertain the degree of bias added from exemptions, we approximated the mean test score each group would have obtained had none of the students been exempted. This was done by combining the scores for those tested one year but not the next with those tested in consecutive years. Table 3 also shows the impact of the performance of those students not tested both years. Among regular education students, the mean score on the 4th grade reading test was 74.8 for those students tested in consecutive years; the mean was 74.2 (column labeled "combined") when students tested that year but not the next were included. In other words, the students exempt from testing the following year brought down this group’s score only .6 points. The influence on mean test performance of exempt students was greater for the special education group. The mean reading score was 66.5 for the special education students tested in consecutive years, but was 64.5 for the students tested that year but not the next. Across each grade on both the reading and the math tests, the influence on mean performance of students not tested in consecutive years was greater for the special education group than it was for the regular education group.
Table 3. Mean Reading Score for Students Tested in Two Consecutive Years and Those Tested One Year But Not the Next
Mean Reading Test Score |
||||
| Grade Tested |
Tested Two Consecutive Years |
Tested One Year But Not the Next |
Difference |
Combined |
| 4 GEd | 74.8 |
58.7 |
16.1 |
74.2 |
| SpEd | 66.5 |
52.7 |
13.8 |
64.5 |
| 5 GEd | 79.4 |
66.6 |
12.8 |
79.0 |
| SpEd | 69.2 |
57.2 |
12.0 |
67.4 |
| 6 GEd | 80.4 |
70.5 |
9.9 |
80.2 |
| SpEd | 68.7 |
59.2 |
9.5 |
67.8 |
| 7 GEd | 81.9 |
73.2 |
8.7 |
81.6 |
| SpEd | 66.2 |
54.9 |
11.3 |
64.9 |
The reason that the influence of the not tested group on mean test performance was greater in the special education group, even though the mean difference was similar across groups was that the exempt students represented a much larger proportion of the special education group than they did in the regular education group. Table 4 shows the number and percent of students tested in one year and not tested the following year by special education status. Among the special education students, the percent ranged from 9.0% in 6th grade to 14.7% in 4th grade. Among the general education students, the percent ranged from 2.2% in 6th grade to 4.1% in 4th grade. Special education students who were tested one year were three times more likely not to be tested the following year than students in general education.
Table 4. Number and Percent of Students Tested One Year and Not Tested the Next by Special Education Status
Group |
||||
Special Education |
General Education |
|||
Grade Tested |
N |
Percent |
N |
Percent |
4 |
1587 |
14.7 |
7367 |
4.1 |
5 |
1667 |
14.5 |
4280 |
2.4 |
6 |
1123 |
9.0 |
3969 |
2.2 |
7 |
1990 |
11.9 |
5459 |
3.0 |
The purpose of this study was to ascertain how transitions between regular education and special education and increasing testing rates affect the size of the achievement gap between regular education and special education students. Our analysis determined that roughly 20% of the special education population in a given year had experienced a status change the prior year. This finding is not exclusive to the state from which the data for this study were obtained. The Twentieth Annual Report to Congress on the Implementation of the Individuals with Disabilities Education Act (U.S. Department of Education, 2000) reported that, among adolescents 14 years old and older in special education, over 63,000 or roughly 3 to 4% of the population returned to regular education in the 1995-96 school year. The report did not include declassification data on students under the age of 14. At least two studies reported declassification rates for elementary grade students. Walker, Singer, Palfrey, Orza, Wenger, and Butler (1988) reported a two-year follow-up study that tracked 1,184 elementary students who were in special education. Of those remaining in the district at the end of two years, 17% were no longer receiving special education services. In a separate study, Carlson and Parshall (1996) used data collected by the Michigan Department of Education to track special education declassification over a five year period. Results were based on child count data used to satisfy federal reporting requirements. They found that each year 7% of students receiving special education services in Michigan schools returned to full-time general education. They also found that about 4% of students who were declassified returned to special education within three years. Unlike the federal data, which are constrained to students 14 years old and older, these data included children as young as six years old. The rate of declassification was greatest for students between the ages of 8 and 11. Declassification rates in this state dropped steadily after age 10. These data demonstrate that changes in the composition of the students served by special education may be considerable from one grade to the next. Failure to account for these changes could result in misinterpretation of the effectiveness of special education services.
One of the principal questions examined in this study was whether transitions between special education and regular education affect the magnitude of the achievement gap across grades. We compared trend lines under three conditions of reporting longitudinal data: cross-sectional, cohort-dynamic, and cohort-static. The cohort-static method illustrated what happens to the achievement gap across grades when the composition of both the regular education and special education groups are held constant—the gap remains about the same, or even decreases slightly. The cohort-dynamic method illustrated the situation when group composition changes result from transitions between regular education and special education (from changes due to increasing testing rates)—the gap increases. The cross-sectional method illustrates the scenario when group composition changes result from both transitions between regular education and special education and increasing testing rates across grades—again, the gap increases.
In summary, when the same two groups of students were tracked across grades (cohort-static), students in the special education group actually closed the gap slightly! On the other hand, when trend lines were reported that did not control for transitions between regular education and special education (cohort-dynamic), the gap increased dramatically. To understand why this occurred, we examined achievement levels for students leaving special education and compared them to those of students entering special education. In each grade, students leaving special education were the highest performing students, with a performance level fairly close to the regular education group. On the other hand, students entering special education were the lowest achieving regular education students. In many instances, this group’s achievement was actually lower than that of the students who remained in special education. In other words, over time special education becomes a reservoir for the lowest achieving students and this fact is independent of special education’s effectiveness.
The other factor affecting performance trends for students with disabilities examined in this study was exemption rates. First, it was shown that exemption rates were much higher among special education students than among regular education students. However, across grades the exemption rates of regular education students remained nearly constant, whereas the exemption of special education students dropped precipitously. The reason is that students are not exempted at random, therefore the higher exemption rates in the early grades result in a more select group of higher achieving special education students being tested. By excluding more of the low achieving students in the early grades, the gap between regular education students and special education students is artificially minimized.
States are now required by IDEA 97 to report disaggregated data for students with disabilities. If states also decide to examine longitudinal trends in disaggregated data (or someone decides to do it for them), they must consider the factors outlined in this report—specifically, transitions between regular education and special education and exemption rates, otherwise it would be easy to conclude that special education is ineffective. The finding that students receiving special education services fall farther and farther behind their regular education peers actually reflects the changing characteristics of the special education students participating in reporting systems. These changes vary dramatically across grades, and also are tied directly to achievement.
States could mitigate the problem by ensuring that all students with disabilities are included in the testing system at every grade level tested. Also, states could increase their ability to link their test results from one year to the next such that performance for the same group of students could be tracked over time. In so doing, states could ensure that trends across grades and between groups are always comparing "apples" to "apples." At a minimum, a footnote should be added that indicates that any analysis of trends across grades using only the data provided in an accountability report would result in comparisons between different students at different grades, and may not validly reflect achievement growth of either group.
Carlson, E., & Parshall, L. (1996). Academic, social, and behavioral adjustment for students declassified from special education. Exceptional Children, 63, 89-100.
Thurlow, M., Ysseldyke, J., Nelson, J. R., & Teelucksingh, E. (2000). Where’s Waldo? A third search for students with disabilities in state accountability reports (Technical Report 25). Minneapolis: University of Minnesota, National Center on Educational Outcomes.
Trimble, S. (1998). Performance trends and use of accommodations on a statewide assessment: Students with disabilities in the KIRIS on-demand assessments from 1992-93 through 1995-96 (Maryland/Kentucky Report 3). Minneapolis: University of Minnesota, National Center on Educational Outcomes.
U.S. Department of Education (1998). Twentieth annual report to Congress on the implementation of the Individuals with Disabilities Education Act. Washington, D.C.: Author.
Walker, D., Singer, J., Palfrey, J., Orza, M., Wenger, M., & Butler, J. (1988). Who leaves and who stays in special education: A 2-year follow-up study. Exceptional Children, 54, 393-402.
Ysseldyke, J., Thurlow, M., Langenfeld, K., Nelson, J. R., Teelucksingh, E., & Seyfarth, A. (1998). Educational results for students with disabilities: What do the data tell us? (Technical Report 23). Minneapolis, MN: University of Minnesota, National Center on Educational Outcomes.