Technical Report 68
2010-11 Publicly Reported Assessment Results for Students with Disabilities
and ELLs with Disabilities
Deb Albus and Martha Thurlow
September 2013
All rights reserved. Any or all portions of this document may be reproduced and distributed without prior permission, provided the source is cited as:
Albus, D., & Thurlow, M. (2013). 2010-11 publicly reported assessment results for students with disabilities and ELLs with disabilities (Technical Report 68). Minneapolis, MN: University of Minnesota, National Center on Educational Outcomes.
Table of Contents
Executive Summary
This is the fourteenth report by the National Center on Educational Outcomes (NCEO) that analyzes public reporting practices for assessment data for students with disabilities in K-12 schools in the United States. This report includes information about both the 50 regular states and the 11 unique states (American Samoa, Bureau of Indian Education, Commonwealth of Northern Mariana Islands, U.S. Department of Defense Education Activities, District of Columbia, Federated States of Micronesia, Guam, Palau, Puerto Rico, Republic of the Marshall Islands, and U.S. Virgin Islands).
The Individuals with Disabilities Education Act (IDEA) and the Elementary and Secondary Education Act (ESEA) require states to disaggregate performance data at the state and district level. For the 2010-11 school year, 53 of the 61 states reported participation and performance data for students with disabilities for all general assessments within the ESEA accountability system. Fifty-one states reported participation and performance data for alternate assessments based on alternate achievement standards (AA-AAS) that were within the ESEA system. Information about state assessments outside of ESEA is also presented.
Reporting for English Language Learners (ELLs) with disabilities also was examined in this report. Only four states reported both participation and performance for the general assessment for this group. More states (n=20) reported both participation and performance data for ELLs with disabilities on the AA-AAS.
Most states reported participation and performance data by individual grade and test for students with disabilities, though a few only reported data that merged grades or tests. Forty-seven of the regular states reported student performance by achievement level, and 39 reported the percent proficient. Many states reported data on accommodations use.
This report also presents the results of an analysis of the ease of finding publicly reported data for students with disabilities on states' websites. This involved counting the number of mouse clicks that it took to arrive at public reports for the general and AA-AAS assessments on state department of education websites. For 33 of the regular states it took 1-2 clicks to find the general assessment information; 5 or more clicks were required in 11 states.
The public reporting of data is, and will continue to be, an important part of accountability for states, even as most states anticipate transitioning to new assessments in 2014-15.The public reporting of disaggregated data for students with disabilities provides a clearer picture of the participation and performance of students with disabilities in statewide assessments.
Top of Page |
Table of Contents
Overview
States report achievement data in various ways for various purposes and audiences. Under the Individuals with Disabilities Education Act (IDEA) and the Elementary and Secondary Education Act (ESEA), states are required to report assessment data to the federal government about the achievement of students with disabilities. They are also to report these data for the general public. Public reporting includes school "report cards," state assessment reports, and customized reports on state education websites. The purpose of this report is to analyze whether states report data for students with disabilities "to the public with the same frequency and in the same detail as it reports on the assessment of nondisabled children," as required by IDEA (Thurlow, Bremer, & Albus, 2008). It also describes how states report participation and performance to the public, with some analyses focusing on average performance gaps and the ease of accessing public reporting reports. We also summarize the extent of reporting for ELLs with disabilities in this report.
The most recent NCEO update on public reporting was for 2008-09 assessment data (Thurlow, Bremer, & Albus, 2011). The number of states reporting both disaggregated participation and performance data online for students with disabilities on general assessments within accountability systems stayed at 46 of the 50 regular states across the two most recent analyses (2007-08 and 2008-09) (Albus, Thurlow, & Bremer, 2009, 2011; Thurlow et al., 2011). The number increased to 46 states beginning in 2006-07 after being between 35 states to 39 states from 2002-03 to 2006-07 (Albus et al., 2009; Klein, Wiley, & Thurlow, 2006; Thurlow, Bremer, & Albus, 2008; Thurlow & Wiley, 2004; Thurlow, Wiley, & Bielinski, 2003; Wiley, Thurlow, & Klein, 2005; VanGetson & Thurlow, 2007).
The number of states that reported disaggregated participation and performance data for alternate assessments based on alternate achievement standards (AA-AAS) increased to 44 of the 50 regular states in 2008-09 after maintaining at 36 states from 2006-07 to 2007-08. This number of states was as low as 28 states in 2005-06 and as high as 42 states in 2004-05.
Changes in federal policies for reporting to the U.S. Department of Education, as well as our own criteria, which narrowed after 2004-05, may have affected the changes in the number of states reporting on the general or AA-AAS assessments. Annual Performance Report (APR) data (and Section 618, Table 6 data) were not counted as publicly reporting data after 2004-05 because these data were not reported with the same frequency and detail as public reporting for all students (see Thurlow et al., 2008). The public reporting of data is, and will continue to be, an important part of accountability for states, even as most states anticipate transitioning to new assessments in 2014-15.
Top of Page |
Table of Contents
Method
In April 2012, state department of education websites were searched for publicly available reports that disaggregated participation and performance data for students with disabilities for the 2010-11 school year (i.e., state assessment reports, state report cards, and other report formats). APR and Table 6 data were not included in the analysis.
States included in the search were the 50 "regular" states as well as 11 "unique" states (American Samoa, Bureau of Indian Education, Commonwealth of Northern Mariana Islands, U.S. Department of Defense Education Activities, District of Columbia, Federated States of Micronesia, Guam, Palau, Puerto Rico, Republic of the Marshall Islands, and U.S. Virgin Islands). Actual participation and performance data were collected, as well as information about how states reported those data. Data collection included all general and alternate assessments within and outside the ESEA accountability system, including those assessments designed for bilingual or English language learners (ELLs) that fit into any of the following categories: general assessments, alternate assessments, and proficiency assessments used for Title I accountability. Further, disaggregated data for ELLs with disabilities on English language proficiency (ELP) assessments, which are used for Title III accountability, were also collected.
The information gathered about how states reported participation and performance data were then summarized into individual state summary tables for verification. Verification materials were sent to state assessment directors and state directors of special education in July and August, 2012. Twenty-seven regular states and one unique state responded to the verification requests. Following this process, the actual participation and performance data were analyzed as well as data on how states reported those data, and double checks were completed for accuracy. See Appendices A and B for sample letters to the state directors and sample summary tables used in the verification process.
There are many types of assessments that states can give, each serving different purposes. For example, some were given for accountability; others were for diploma or graduation purposes. Some assessments may also serve dual purposes within a state. Although the data collected for this report included all assessments used by states, this report focuses on how states publicly reported participation and performance data for students with disabilities on general assessments and alternate assessments based on alternate achievement standards. For our purposes, the following terms are defined as follows.
General assessments: Any assessment intended for students without disabilities and most students with disabilities that is designed to measure content area performance for ESEA accountability or for exit or diploma purposes. These may include end-of-course assessments for states that have them.
Alternates based on alternate achievement standards (AA-AAS). Any assessment intended for a very small percentage of students with disabilities who have the most significant cognitive disabilities to measure content area performance for ESEA accountability, or for exit or diploma purposes. These may include end of course assessments for states that have them.
This report also provides additional information on alternates based on other standards such as modified achievement standards and grade level achievement standards, but detailed information is not provided about these assessments in the body of the report.
Top of Page |
Table of Contents
Results
The Results section is divided into six sections. The first section presents information about how participation and performance data for students with disabilities were reported by states for general and alternate assessments within and outside of the ESEA accountability system, and how these same data were reported for ELLs with disabilities. The second section describes the approaches states used to communicate participation data. The third section describes the approaches states took to publicly report general assessment performance data for students with disabilities. The fourth section presents general assessment performance data at the elementary, middle school, and high school levels for reading and mathematics. This section also includes information about average achievement gaps at these school levels in reading and mathematics. The fifth section provides information about the ease of finding data on state websites. And, the final section describes how states reported use of accommodations on assessments.
How States Reported Participation and Performance Data
States that Reported Disaggregated General Assessment Data for Students with Disabilities
Figure 1 shows that 53 of the 61 states reported participation and performance for all general assessments within the ESEA accountability system for students with disabilities. Eighty-seven percent of states that reported participation and performance for all general assessments, 8% reported for some general assessments, and 5% had no publicly reported data. The five states with no publicly reported data were all unique states.
Figure 1. Extent of Reporting of General Assessment Data for Students with Disabilities within ESEA [N=61]
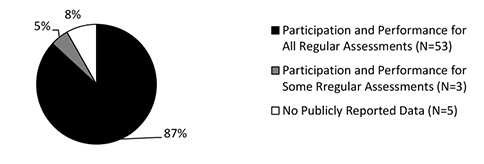
Figure 2 portrays the participation and performance reporting for the general assessment by state. This map shows that nearly all states had full reporting of participation and performance for students with disabilities on general assessments within ESEA accountability systems. For details, see Appendix C.
Figure 2. States Reporting 2010-2011 Disaggregated Participation or Performance Data for Students with Disabilities on General State Assessments in ESEA Accountability System*
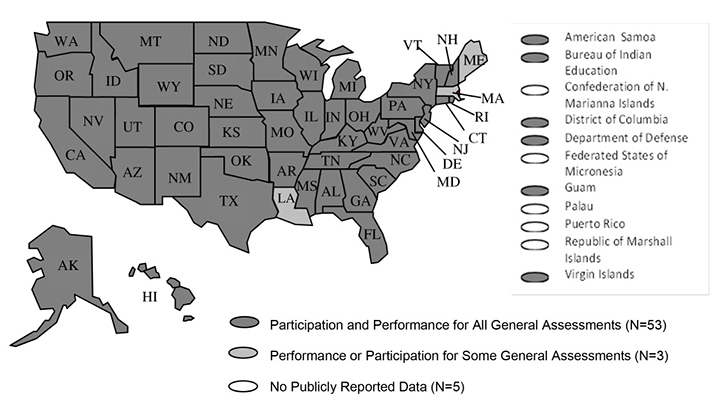
*Note: The figure does not include state APR data. A broad definition was used to determine whether a state had data. States were included if they had any data reported for the assessment (regardless of whether it was only across all grades, by grade range, or for specific grades).
States also reported participation and performance for students with disabilities on general assessments outside the ESEA accountability system. Figure 3 shows that 22 states had general assessments outside ESEA, but only 10 of these states reported either participation or performance data. Thirty-nine states did not have any general assessments outside of the ESEA accountability system.
Figure 3. Extent of Reporting of General Assessment Data for Students with Disabilities outside ESEA [N=61]
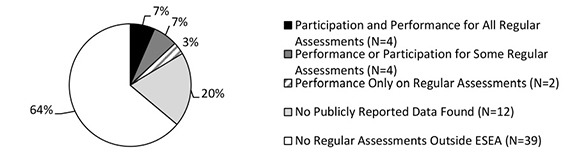
Figure 4 portrays the participation and performance reporting for general assessments outside the ESEA system by state. This map shows that only a few states publicly reported participation and performance for these assessments. For details, see Appendix C.
Figure 4. States Reporting 2010-11 Disaggregated Participation or Performance Data for Students with Disabilities on General Assessments OUTSIDE ESEA System*
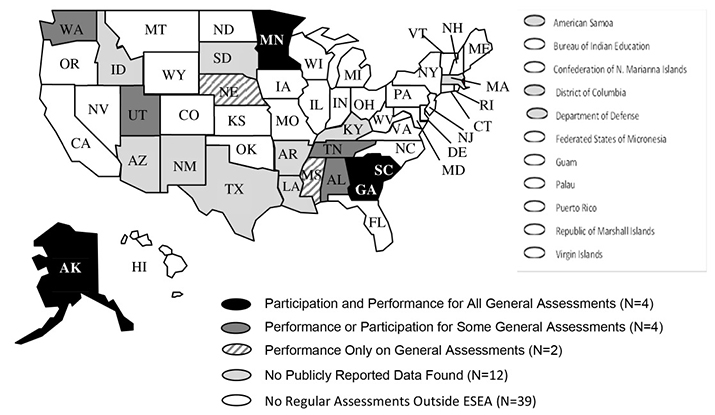
*Note: States were included if they had any data reported for the assessment (regardless of whether it was only across grades, by grade range, or for specific grades).
States that Reported Disaggregated Alternate Assessment Based on Alternate Achievement Standards (AA-AAS) Data for Students with Disabilities
This section shows the extent to which states reported participation and performance for students with the most significant cognitive disabilities on alternate assessments based on alternate achievement standards (AA-AAS) within the ESEA accountability system. Figure 5 shows that 51 states reported data for this assessment. This represents 84% of the states.
Figure 5. Extent of Reporting of AA-AAS Data within ESEA [N=61]
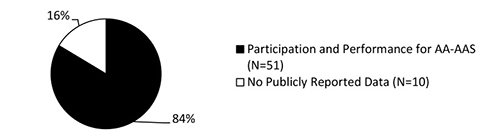
Figure 6 shows the states that reported participation and performance for AA-AAS within the ESEA accountability system. The map shows that most states (N=51) publicly reported participation and performance for students with disabilities for these assessments. For details, see Appendix D.
Figure 6. States Reporting 2010-11 Participation or Performance Data for Students with Disabilities on AA-AAS*
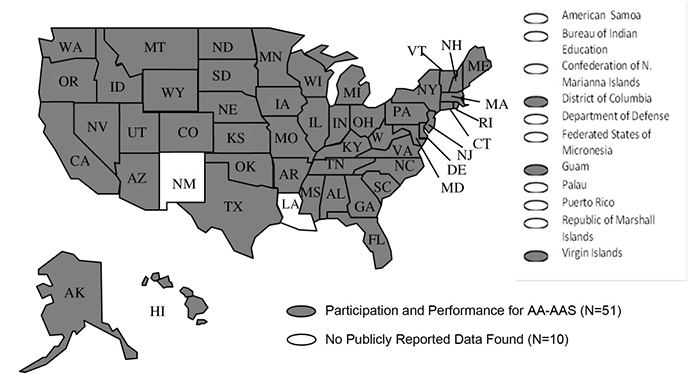
*Note: The figure does not include state APR data. A broad definition was used to determine whether a state had data. States were included if they had any data reported for the assessment (regardless of whether it was only across grades, by grade ranges, or for specific grades).
States that Reported Disaggregated Assessment Data for English Language Learners with Disabilities
This section presents information on how states reported participation and performance data for ELLs with disabilities. Like their peers, most ELLs with disabilities take general assessments; a few take an AA-AAS.
Figure 7 shows that 55 states did not report participation and performance for ELLs with disabilities on assessments within ESEA. Only four states reported both participation and performance data for all general assessments. This represents 7% of the states.
Figure 7. Extent of States Reporting Data for ELLs with Disabilities Within ESEA [N=61]
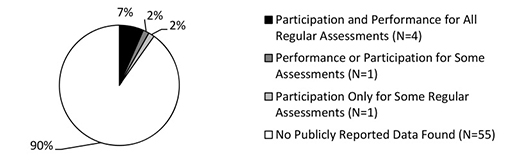
Figure 8 shows the states reporting participation and performance for ELLs with disabilities on general assessments within the ESEA system. This map shows that only a few states publicly reported participation and performance for ELLs with disabilities. For details, see Appendix C.
Figure 8. States Reporting 2010-11 Disaggregated Participation or Performance Data for ELLs with Disabilities on General Assessments in ESEA Accountability System.
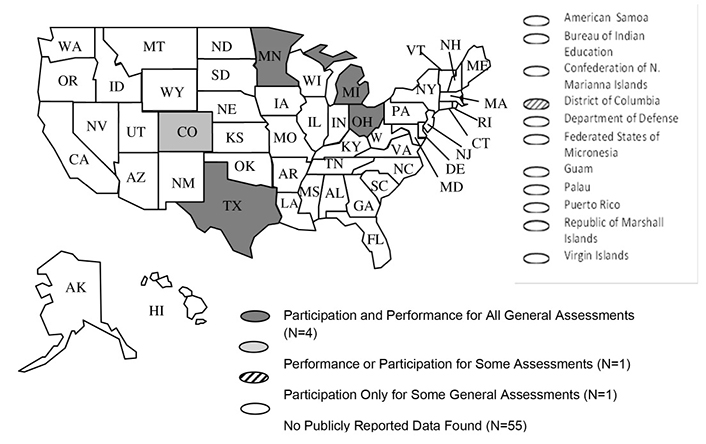
Figure 9 shows that 20 states, or 33% of states, reported data for participation and performance on AA-AAS for ELLs with disabilities. Thirty-eight states did not publicly report data for ELLs with disabilities who may have participated in an AA-AAS; some states may have very few—or no—ELLs with disabilities who participate in this assessment.
Figure 9. Extent of States Reporting AA-AAS Data for ELLs with Disabilities within ESEA [N=61]
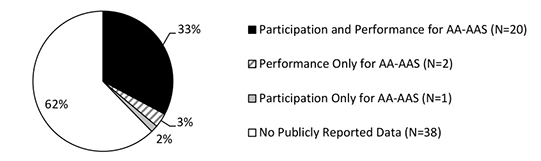
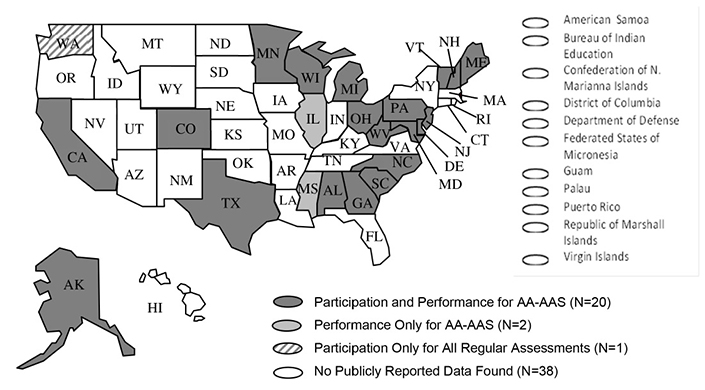
Figure 10 shows the states that reported participation and performance for ELLs with disabilities on the AA-AAS within the ESEA system. This map shows that among those states that reported these data, most reported both participation and performance, with only a few reporting only performance or only participation. For details, see Appendix D.
Figure 10. States Reporting 2010-11 Disaggregated Participation or Performance Data for ELLs with Disabilities on AA-AAS
States that Reported Disaggregated Alternate Assessment Based on Modified Achievement Standards (AA-MAS) Assessment Data for Students with Disabilities and ELLs with Disabilities
Alternate assessments based on modified achievement standards (AA-MAS) are an optional assessment within the ESEA accountability system that only some states offer. Twelve states reported participation and performance data for students with disabilities in 2010-2011. Eight states reported participation and performance data for ELLs with disabilities. For details, see Appendix E.
States that Reported Disaggregated General Assessment Data for English Language Proficiency (ELP) Assessments for ELLs with Disabilities
English language proficiency assessments (ELPAs) are used for Title III accountability. Generally, few states reported participation and performance data for English language learners on these assessments in public online documents. Even fewer states reported these data disaggregated for ELLs with disabilities. For 2010-2011, six states reported both participation and performance for ELLs with disabilities on ELPs, and one state reported performance only. For details, see Appendix F.
Communicating Participation in 2010-11
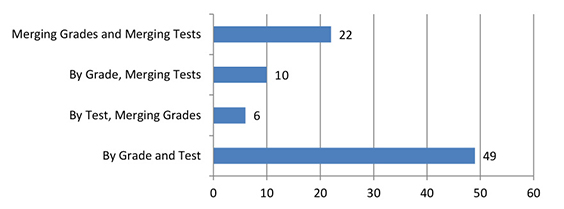
States publicly reported participation data for students with disabilities in a variety of ways. Figure 11 shows that 49 states reported participation data by grade and test. Twenty-two states merged grades and tests when reporting the data, 10 states reported by grade but merged tests, and 6 reported by test but merged grades. Some states publicly reported data only one way, while others reported them in multiple ways. For additional details see Appendix G.
Figure 11. Number of States Using Selected Methods to Report Participation Data
States reported participation data for general assessments in several different ways. Figure 12 shows the approaches taken by states in presenting participation data. Forty-four states publicly reported the number of students tested and 42 states reported the percent of students participating in general assessments within the ESEA accountability system. Only 6 states reported the percent of students with no scores; 6 states also presented the number of students with no scores. This figure includes data from states that used any method of reporting participation data (i.e., by grade and test, by merging grades and tests, by grade with tests merged, and by test with grades merged). For additional details see Appendix H. Similar data for states that reported by individual grade and test are available in Appendix I. For details about AA-AAS participation see Appendix J.
Figure 12. States Reporting Participation by Students with Disabilities for General Assessments in ESEA Accountability Systems in 2010-2011
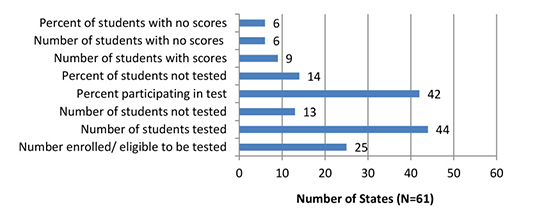
Figure 13 shows the participation rates for 8th grade mathematics for those states where this information was reported. Twenty-two states publicly reported these data out of sixty-one states total. Four of these states (Connecticut, Georgia, North Dakota, and Pennsylvania) had an alternate assessment based on modified achievement standards (AA-MAS). These states reported the data in several ways. Connecticut showed a lower rate for its general mathematics assessment because a percentage of its students with disabilities took an AA-MAS, and because the denominator Connecticut used in calculating the percentage included both students participating in the general assessment and the AA-MAS. Three other states with an AA-MAS are included in the figure: Georgia, North Dakota, and Pennsylvania. These states reported their data differently from Connecticut as noted in the Figure 13 footnote. See Appendix K for a detailed summary of how states reported AA-MAS participation rates.
Figure 13. Percentages of Students with Disabilities Participating in Middle School General Math Assessments in Those States with Reported Participation Rates1 in 2010-2011
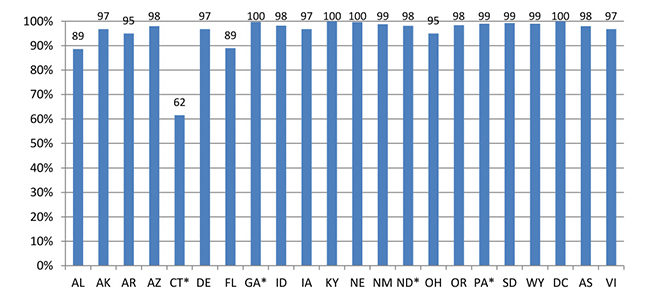
1States graphed here include those with percentages calculated from presented data, so some may not be counted as reporting a rate in Appendix I.
*Four states included in this figure had an AA-MAS: Connecticut, Georgia, North Dakota, and Pennsylvania. Georgia and Pennsylvania reported AA-MAS rates separately. Connecticut's rate here is lower because it was based on a denominator that summed participation for both the general and alternate assessments. North Dakota merged general assessment and AA-MAS participation data in their reported rate in the figure. A key for state abbreviations is provided in Appendix L.
General Assessment Performance Approaches for Students with Disabilities
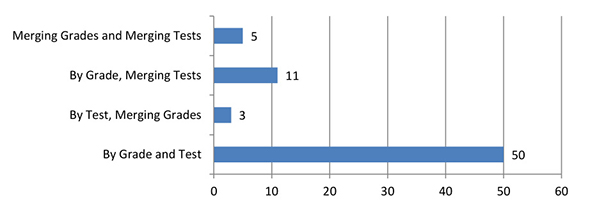
Similar to the reporting practices for participation data, states reported performance in several different ways. Figure 14 shows that 50 states reported some performance data by grade and test. Eleven states reported performance by merging grades and merging tests. Some states publicly reported performance data only one way, while others reported it in multiple ways. For additional details see Appendix M.
Figure 14. Number of States Using Selected Methods to Report Performance Data
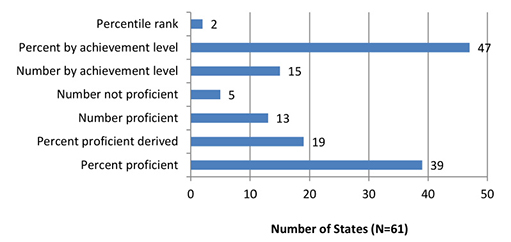
States also report performance data in a variety of ways, such as the number or percent in each achievement level, percent proficient or not proficient, and scaled scores. Figure 15 shows that the most common way that states reported performance data was by percent in each achievement level (n=39). The next most frequent way was by percent proficient. This figure includes data from states that used any method of reporting participation data (i.e., by grade and test, by merging grades and tests, by grade with tests merged, and by test with grades merged). For additional details see Appendix N. Similar data for states that reported by individual grade and test are available in Appendix O. For details about AA-AAS performance see Appendix P.
Figure 15. General Assessments within ESEA: Number of States Reporting Performance Categories for Students with Disabilities in 2010-2011
Selected Results of General Assessment Performance for Students with Disabilities
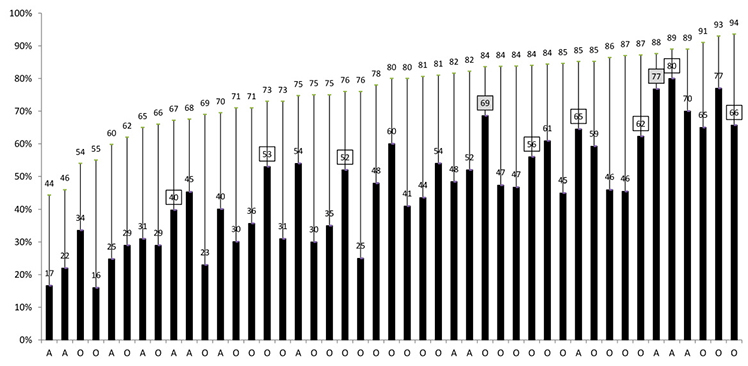
In this section we compare the performance of students with and without disabilities and students for states that reported data for the three representative grades of 4, 8, and 10 in reading and mathematics. Figures 16 to 21 show the gaps between students with disabilities and their comparison peer group. The solid line represents the gap between students with Individualized Educational Programs (IEPs) and a comparison group. The comparison peer group varied by state, with some states reporting the performance of students without IEPs and others reporting the total student population. Because the gaps were affected by whether a state used all students or students without disabilities, we indicate the group used by each state on the horizontal axis with an A for all students and an O for students who do not have IEPs. The students without IEPs group may include students with 504 plans depending on how a state defined its population. Ten of the 12 states with AA-MAS are presented in these figures, and so the gaps reported here could vary based on how those states reported their performance data. States with an AA-MAS are indicated in the figures with a box around the percent proficient number for students with IEPs.
Elementary School
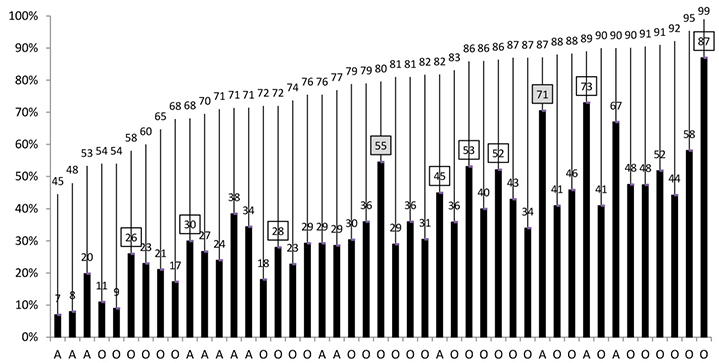
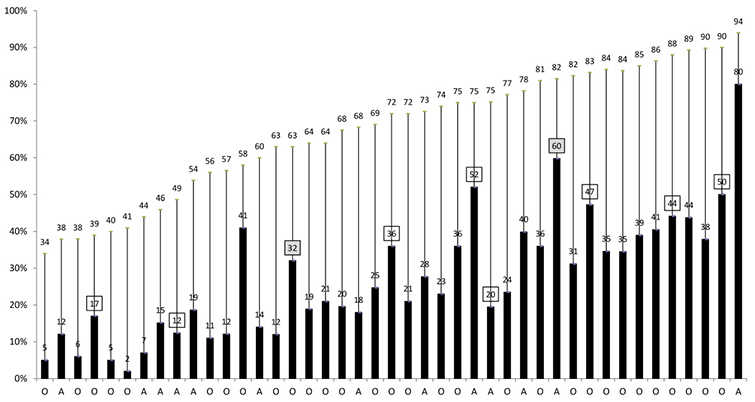
Figures 16 and 17 present the results for Grade 4. Across the states, the smallest gap between students with IEPs and the comparison group for elementary reading was 8%, and the largest gap was 59%. For elementary mathematics, the gap ranged from 9% to 51%.
Figure 16. Percent Proficient for Elementary Reading*
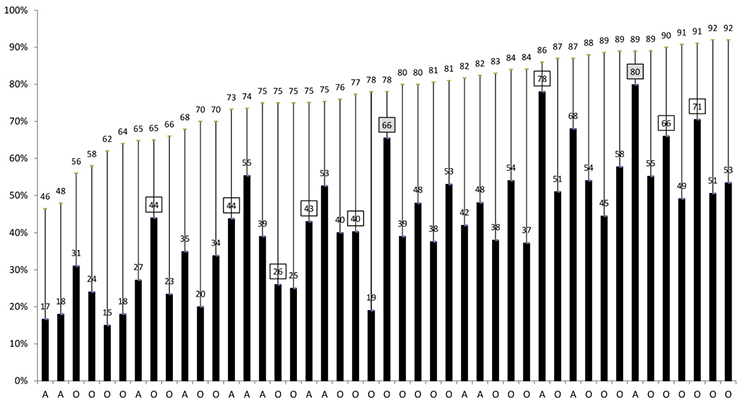
Legend:
Heavy Solid Bar= Students with disabilities percent proficient
Narrow Solid Line = Gap between students with disabilities and the comparison group
Box= State has an AA-MAS
Shaded Box =State reported AA-MAS merged with general assessment
A= All students
O=Students without IEPs
*Note: N=45 of 50 regular states; All students=14 states, Students without Disabilities=31, No data=5 states
Figure 17. Percent Proficient Elementary Mathematics*
Legend:
Heavy Solid Bar= Students with disabilities percent proficient
Narrow Solid Line = Gap between students with disabilities and the comparison group
Box= State has an AA-MAS
Shaded Box = State reported AA-MAS merged with general assessment
A= All students
O=Students without IEPs
*Note: N=45 of 50 regular states; All students=14 states, Students without Disabilities=31 states, No data=5 states
Middle School
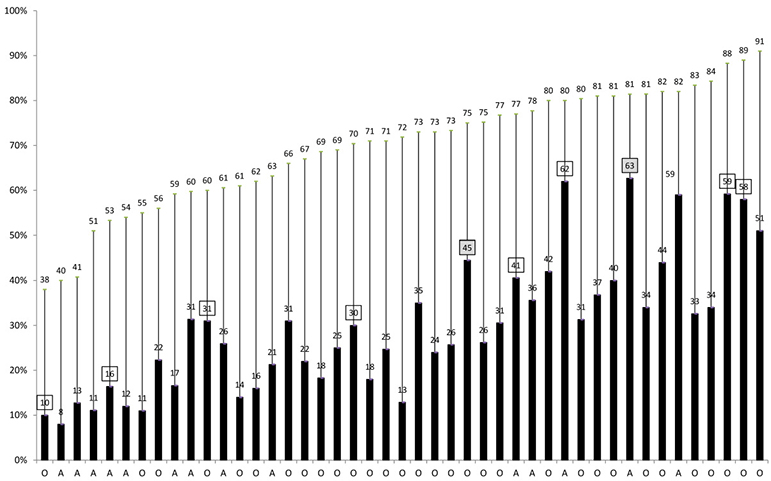
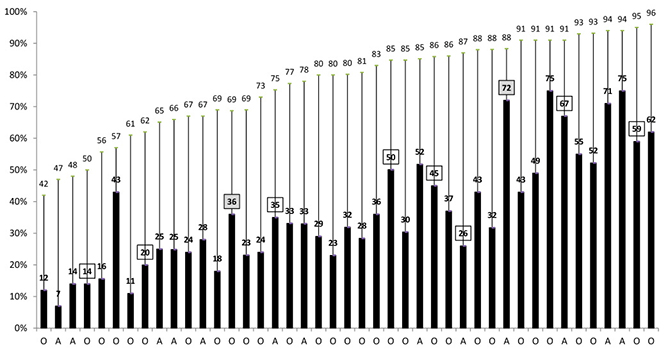
Figures 18 and 19 show the performance gaps for grade 8 reading and mathematics. At the middle school level, for reading, gaps ranged from 12% to 54%. For mathematics, the gaps ranged from 18% to 59%.
Figure 18. Percent Proficient for Middle School Reading*
Legend:
Heavy Solid Bar= Students with disabilities percent proficient
Narrow Solid Line = Gap between students with disabilities and the comparison group
Box= State has an AA-MAS
Shaded Box = State reported AA-MAS merged with general assessment
A= All students
O=Students without IEPs
*Note: N=45 of 50 regular states; All students=14 states, Students without disabilities=31 states, No data=5 states
Figure 19. Percent Proficient Middle School Mathematics*
Legend:
Heavy Solid Bar= Students with disabilities percent proficient
Narrow Solid Line = Gap between students with disabilities and the comparison group
Box= State has an AA-MAS
Shaded Box = State reported AA-MAS merged with general assessment
A= All students
O=Students without IEPs
*Note: N=45 of 50 regular states; All Students=14 states, Students without disabilities=31, No data=5 states
High School
Figures 20 and 21 show gaps for high school reading and mathematics. For reading, the gaps ranged from 14% to 61%; for mathematics the range is from 14% to 55%.
Figure 20. Percent Proficient for High School Reading*
Legend:
Heavy Solid Bar= Students with disabilities percent proficient
Narrow Solid Line = Gap between students with disabilities and the comparison group
Box= State has an AA-MAS
Shaded Box = State reported AA-MAS merged with general assessment
A= All students
O=Students without IEPs
*Note: N=43 of 50 regular states; All students=13 states, Students without disabilities=30 states, No data=7 states
Figure 21. Percent Proficient for High School Mathematics*
Legend:
Heavy Solid Bar= Students with disabilities percent proficient
Narrow Solid Line = Gap between students with disabilities and the comparison group
Box= State has an AA-MAS
Shaded Box = State reported AA-MAS merged with general assessment
A= All students
O=Students without IEPs
*Note: N=43 of 50 states; All students=13 states, Students without disabilities=30 states, No data=7 states
Average Gap Summaries by Content Area and School Level
The following tables summarize the average achievement gaps between students with disabilities and an "All" student group which may or may not include students with disabilities depending on the reporting practices of each state. The tables present these gaps by content and school levels across select years. A limitation of this analysis is that the number of states with data fluctuates from year to year and there are differences in how states report percent proficient for students with disabilities, such as whether states reported AA-MAS performance merged with general assessments.
Table 1 shows the mean gaps for every other year starting in 2006-2007 along with the number of states with data for each year. The gap sizes changed only slightly across grades and content areas across each two year time period. For example, for elementary reading, the mean gap was 31 in 2006-07, 31 in 2008-09, and 34 in 2010-11.
Table 1. Gaps Between Students with Disabilities and General Education Students on General Assessments: 2006-07 to 2010-11
|
Mean Gaps for All States with Data |
2006-07 |
2008-09 |
2010-11 |
Gap |
Number of states |
Gap |
Number of states |
Gap |
Number of states |
Elementary Reading |
31 |
47 |
31 |
45 |
34 |
45 |
Middle School Reading |
40 |
47 |
40 |
46 |
41 |
45 |
High School Reading |
40 |
46 |
40 |
44 |
40 |
45 |
Elementary Math |
29 |
47 |
28 |
46 |
30 |
45 |
Middle School Math |
40 |
47 |
38 |
46 |
40 |
42 |
High School Math
|
38 |
44 |
37 |
44 |
40 |
43 |
Ease of Finding Publicly Reported Data
This section was referred to as a "click" analysis in previous reports, and it describes the number of mouse clicks it takes to arrive at public reports for the general and AA-AAS assessments on state websites for departments of education. The numbers here do not count potential short cuts through search engines that may provide a link to parts of a state's education website. This analysis is similar to analyses in previous reports, presenting the data for general assessments in Figure 22, and data for AA-AAS in Figure 23.
As in previous analyses, we did not count the additional clicks needed to choose specific demographic or assessment characteristics on sites that allowed users to generate customized reports. For those sites, we only counted the number of clicks needed to arrive at the generator site and a final "submit" click.
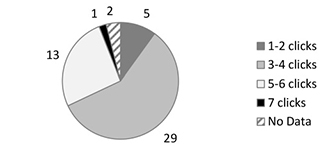
Compared to the most recent year for this analysis (2008-2009), the number of states that required 5-6 clicks (N=12) dropped to 10 states for 2010-11 and the number of states with 1-2 clicks increased from 5 to 6. In 2008-09 no states required 7 clicks, but in 2010-11 there was one state with 7 clicks. For the AA-AAS, there was a general shift in states towards fewer clicks in 2010-11, with 1 more state in the 1-2 click category, 5 additional states in the 3-4 click category, and a decrease from 15 to 13 states in the 5-6 click category. Still, like the general assessment, there was a state with 7 clicks that was not present in the previous analysis.
Figure 22. Number of States in Each "Click" Category for States Reporting General Assessments (N=50)
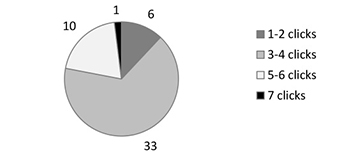
Figure 23. Number of States in Each Click Category for states Reporting AA-AAS (Total N=50)
Publicly Reported Data on Accommodations
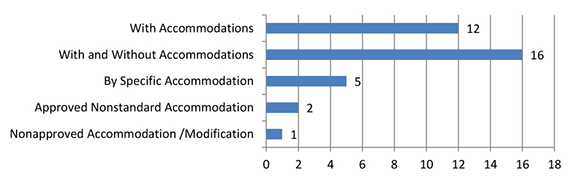
This section describes the extent to which states publicly reported data for students who used accommodations on state assessments for 2010-2011. As shown in Figure 24, 12 states reported data for students who used accommodations. Sixteen states reported data for students who used accommodations and for students who did not use them; 5 states reported data by the particular accommodation used. Two states reported by approved nonstandard accommodation and one state reported by non-approved accommodation/modification. Overall, 32 states reported at least some participation or performance data for students using accommodations. For more detailed information see Appendix Q.
Figure 24. Number of States Reporting Data by Different Accommodation Status Categories
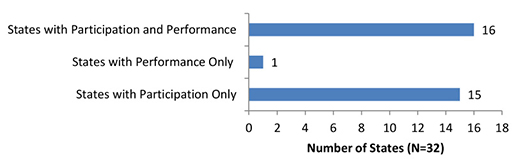
States vary in whether they report on participation and performance, performance only, or participation only. Figure 25 summarizes the number of states reporting these data for each of these three categories. Most states reported participation and performance (N=16), or participation alone (N=15). One state reported only performance data for students using accommodations. See Appendix R for details.
Figure 25. Number of States Reporting Participation or Performance by Accommodated Condition for Any Student Population
States also vary in the population categories they use to report accommodated data. Table 2 shows that eight states reported information for all students who used accommodations. Twenty-five states reported performance or participation data for students with disabilities and 504 plans who used accommodations. Ten states reported data separately for ELLs who used accommodations. One state provided disaggregated data for students with and without the most significant cognitive disabilities who used accommodations. Another state provided information about students without disabilities who used accommodations. See Appendix S for more detail.
Table 2. Populations for Which States Reported Accommodations Data
State |
ALL |
IEP/
Students with Disabilities/ 504 |
Non-special Education |
Non-Significant Cognitive Disability |
Significant Cognitive Disability |
ELLs with Disabil-ities |
ELL |
Non-ELL |
Other1 |
Un-clear2 |
Alabama |
|
|
|
|
|
|
|
|
|
X |
Alaska |
|
X |
|
|
|
|
|
|
|
|
Arizona |
|
X |
|
|
|
|
|
|
|
|
Connecticut |
|
X |
|
|
|
|
|
|
|
|
Colorado |
X |
X |
|
|
|
|
|
|
|
|
Florida |
|
X |
|
|
|
|
|
|
|
|
Indiana |
|
X |
|
|
|
|
X |
X |
|
|
Iowa |
|
X |
|
|
|
|
|
|
|
|
Kansas |
X |
|
|
|
|
|
|
|
|
|
Kentucky |
|
X |
|
|
|
|
|
|
|
|
Maine |
X |
X |
|
|
|
|
X |
|
|
|
Maryland |
X |
X |
|
|
|
|
X |
|
X |
|
Massachusetts |
|
X |
|
|
|
|
|
|
|
|
Missouri |
|
X |
|
|
|
|
|
|
|
|
Mississippi |
X |
X |
|
X |
X |
|
|
|
X |
|
Michigan |
|
X |
X |
|
|
|
X |
X |
|
|
Nebraska |
|
X |
|
|
|
|
X |
|
|
X |
Nevada |
|
X |
|
|
|
|
|
|
|
|
New Hampshire |
X |
X |
|
|
|
|
|
|
|
|
New Mexico |
|
|
|
|
|
|
X |
|
|
|
North Carolina |
|
|
|
|
|
X |
|
|
|
|
North Dakota |
|
X |
|
|
|
|
|
|
|
|
Ohio |
|
X |
|
|
|
|
X |
|
|
|
Oklahoma |
|
X |
|
|
|
|
|
|
|
|
Oregon |
|
X |
|
|
|
|
|
|
|
|
Pennsylvania |
|
X |
|
|
|
|
|
|
|
|
Rhode Island |
X |
|
|
|
|
|
X |
|
|
|
South Dakota |
|
|
|
|
|
|
|
|
|
X |
Tennessee |
|
X |
|
|
|
|
|
|
|
|
Texas |
X |
X |
|
|
|
|
X |
|
X |
|
Vermont |
|
X |
|
|
|
|
|
|
|
|
Virgin Islands |
|
|
|
|
|
|
X |
|
|
|
Total |
8 |
25 |
1 |
1 |
1 |
1 |
10 |
2 |
3 |
3 |
1Other= Migrant, Title I, Economically Disadvantaged, All IDEA, Accelerated student groups
2Unclear= Population identifier not clear
Top of Page |
Table of Contents
Summary and Conclusions
Extent of Public Reporting for Students with Disabilities
All regular states, and most unique states, reported participation and performance for all general assessments and alternate assessments based on alternate achievement standards (AA-AAS) used for ESEA accountability purposes. Fifty-three of the 61 states reported both participation and performance for all general assessments; 51 reported similar data for the AA-AAS. Of the 22 states with general assessments outside ESEA, only 4 states reported participation and performance and 4 additional states reported participation or performance for some general assessments.
Extent of Public Reporting for ELLs with Disabilities
For ELLs with disabilities, the number of states that reported both participation and performance for ELLs with disabilities decreased by one state. In 2008-09 five states reported participation and performance for general assessments within ESEA, but in 2010-11 only four states reported both participation and performance data for ELLs with disabilities. For AA-AAS, a higher number of states (N=20) reported participation and performance. This is the same number of states as in 2008-09. It might be expected that more states would have reported disaggregated data for this assessment, given the requirements of ESEA to report by subgroup for each state assessment.
How Data Are Reported
States' most common approaches for communicating participation and performance on general assessments and AA-AAS remained the same between 2008-09 and 2010-11. For participation, the most common way to report was in terms of the number assessed (42 states for the general assessment). For performance, the most common way was reporting the percent of students in each achievement level (47 states for the general assessments) followed by percent proficient (39 states for general assessments). Because states used different methods to report, whether merging assessments, grades, or both, the numerators and denominators used to report participation and performance data varied significantly across states. This is made more complex by the fact that some states report public data using multiple methods across participation and performance, thus making it more difficult to make interpretations about participation and performance.
As in previous reports, this report presented participation rates for middle school mathematics as an example of how states report participation rates for students with disabilities. Twenty-two states reported participation rates by grade and test clearly without requiring calculations to be conducted. In recent years these data have become less straightforward because states that had alternates based on modified achievement standards (AA-MAS) sometimes opted to merge those data with the general assessment data in public reporting for participation and performance. Most states with AA-MAS did not report participation rates by the AA-MAS separately, though some did.
Achievement Gaps
Achievement gaps between students with disabilities and without disabilities remain a concern. This report presented average achievement gaps across reading and mathematics for elementary, middle school, and high school levels. As in past reports, there were smaller overall gaps in elementary reading and mathematics than at the middle school and high school levels. At the middle school and high school levels, for reading and mathematics, the average gaps across states tended to hover around 40%. There was some variation across states in the methods that states use to publicly report the achievement gap. As would be expected, those states with "all students" as the comparison group tended to show smaller gaps compared to states using "all students without IEPs" as the comparison group. Whether a state has an AA-MAS, the percentage of students taking an AA-MAS in lieu of the general assessment, and how those data are reported, affected the size of the achievement gap. Generally, the achievement gap has stayed relatively stable from 2006-07 through 2010-11.
English Language Proficiency Assessments
For Title III English language proficiency assessments, there were relatively few states that reported data for English language learners with disabilities in online documents available to the general public. Overall, six states reported participation and performance for ELLs with disabilities on ELP assessments, and one state reported performance only.
Ease of Finding Data on State Websites
It was easier to find data about the participation and performance of students with disabilities on some states websites than on others. The analysis we conducted for this update showed a continued trend toward greater ease in finding the data than in the past. In general it took fewer clicks overall to reach the data than in 2008-09, though one state's website required 7 clicks to access both general and AA-AAS data. In the past the maximum number of clicks required for any state was 6 clicks. Most states took 3 to 4 clicks to locate assessment data both for the general assessment (33 states) and AA-AAS (29 states).
Accommodations Reporting
Reported data on accommodations use also varied from year to year. In the current analyses, 32 states reported accommodations participation or performance on assessments for different populations. Most states reported data by students with disabilities/IEPs/504s (N=25). Fewer also reported these data by ELL status (N=10) or for all students using accommodations (N=8). More states reported data for both students using accommodations (N=28) and for students without accommodations (N=16). Five or fewer states reported by specific accommodations used, approved nonstandard accommodations, or non-approved accommodations/modifications.
Recommendations for Reporting
Many states will be transitioning to new assessments developed by consortia of states based on common core standards. It is anticipated that as this occurs states will revise their websites, and publicly report performance and participation data for students with disabilities and ELLs with disabilities somewhat differently than in the past. It is vital that as these changes occur, states continue to publicly report data for students with disabilities with the same frequency and detail as for other students. As in the previous report (Thurlow et al., 2011), the following recommendations are offered concerning public reporting of disaggregated data for students with disabilities:
- Report participation and performance results for each assessment, content area, and grade level.
- Clearly label preliminary and final data with dates posted.
- Report participation with accommodations.
- Report participation percentages, disaggregated by grade.
- Make data accessible by attending carefully to the usability of formats, ease of finding information, and clarity of language.
Top of Page |
Table of Contents
References
Albus, D., Thurlow, M., & Bremer, C. (2009). Achieving transparency in the public reporting of 2006-2007 assessment results (Technical Report 53). Minneapolis, MN: University of Minnesota, National Center on Educational Outcomes.
Klein, J. A., Wiley, H. I., & Thurlow, M. L. (2006). Uneven transparency: NCLB tests take precedence in public assessment reporting for students with disabilities (Technical Report 43). Minneapolis, MN: University of Minnesota, National Center on Educational Outcomes.
Thurlow, M., Bremer, C., & Albus, D. (2008). Good news bad news in disaggregated subgroup reporting to the public on 2005-2006 assessment results (Technical Report 52). Minneapolis, MN: University of Minnesota, National Center on Educational Outcomes.
Thurlow, M. L., Bremer, C., & Albus, D. (2011). 2008-09 publicly reported assessment results for students with disabilities and ELLs with disabilities (Technical Report 59). Minneapolis, MN: University of Minnesota, National Center on Educational Outcomes.
Thurlow, M. L., & Wiley, H. I. (2004). Almost there in public reporting of assessment results for students with disabilities (Technical Report 39). Minneapolis, MN: University of Minnesota, National Center on Educational Outcomes.
Thurlow, M. L., Wiley, H. I., & Bielinski, J. (2003). Going public: What 2000-2001 reports tell us about the performance of students with disabilities (Technical Report 35). Minneapolis, MN: University of Minnesota, National Center on Educational Outcomes.
VanGetson, G. R., & Thurlow, M. L. (2007). Nearing the target in disaggregated subgroup reporting to the public on 2004-2005 assessment results (Technical Report 46). Minneapolis, MN: University of Minnesota, National Center on Educational Outcomes.
Wiley, H. I., Thurlow, M. L., & Klein, J. A. (2005). Steady progress: State public reporting practices for students with disabilities after the first year of NCLB (2002-2003) (Technical Report 40). Minneapolis, MN: University of Minnesota, National Center on Educational Outcomes.
Top of Page |
Table of Contents
Appendices
For the Appendices, please view or download the PDF version of this report.
Top of page |
