Technical Report 58Participation and Performance Reporting for the Alternate Assessment Based on Modified Achievement Standards (AA-MAS)Deb Albus • Martha L. Thurlow • Sheryl S. Lazarus April 2011 All rights reserved. Any or all portions of this document may be reproduced and distributed without prior permission, provided the source is cited as: Albus, D., Thurlow, M. L., & Lazarus, S. S. (2011). Participation and performance reporting for the alternate assessment based on modified achievement standards (AA-MAS) (Technical Report 58). Minneapolis, MN: University of Minnesota, National Center on Educational Outcomes. Table of Contents
Executive SummaryThis report examines publicly reported participation and performance data for the alternate assessment based on modified achievement standards (AA-MAS). Our analysis of these data included all states publicly reporting AA-MAS data, regardless of whether they had received approval to use the results for Title I accountability calculations. Data were examined for school years 2006-07 through 2009-10. Because most states had not yet reported data for 2009-10, we focused most of our analyses on 2006-07 (six states with an AA-MAS), 2007-08 (eight states with an AA-MAS), and 2008-09 (eight states with an AA-MAS). Our analysis of AA-MAS participation and performance reporting indicated that most states implementing these assessments were reporting some data publicly. For participation data across years, seven states reported participation data by grade. Most of these states reported numbers of students tested; a few states reported the percent of students tested on the AA-MAS. For participation, the states with at least two years of data showed variations in the number of students taking the AA-MAS. One state showed a notable increase in the number of students participating. This occurred across all grades and content areas. It will be important for states seeing significant increases in participation to check on whether their participation criteria are clear and being adhered to by schools. In terms of performance data, states are reporting these data generally in terms of the percentage of students at each achievement level. Next most often were states reporting mean scale scores or states not disaggregating the AA-MAS performance data, but instead merging these data with the regular assessment data. Five states had performance data spanning more than two years. Some of these states showed consistent increases in the percent of students who were proficient across years; others showed increases and decreases in these percentages. As for participation data, it will be important for states to continue to monitor changes in the performance levels of students taking the AA-MAS, to determine whether the changes are related to participation changes or to changes in instruction. States are not required to report on the use of accommodations for students participating in alternate assessments. Still there were a few states that reported data on the number of students using accommodations and the performance when accommodations were used. Some states also reported by specific accommodation used. States may find over time that reporting on specific accommodations used in each grade for the AA-MAS will help them better understand the accommodation needs of those students participating in this assessment. Public reporting of data from assessments disaggregated for students with disabilities is helpful in determining how these students are participating and performing on large-scale assessments and for informing policy and practice. Continued attention to transparent reporting of data, and the nature of those data, will be essential for states that have opted to provide an AA-MAS for some of their students with disabilities. Top of Page | Table of Contents OverviewPublicly reported data on the participation of students in state assessments and their performance on those assessments are an important aspect of ensuring accountability for educational results. These data are used to measure the progress of the nation in its push for educational reform (Barton & Coley, 2008, 2010; Center on Education Policy, 2008; Snipes, Horwitz, Soga, & Casserly, 2008; Ushomirsky & Hall, 2010). Data on the participation and performance of students with disabilities on general state assessments and on alternate assessments based on alternate achievement standards (AA-AAS) also have been examined to document the nature of reporting and the results for this group of students (Albus, Thurlow, & Bremer, 2009; Thurlow, Bremer, & Albus, 2008; VanGetson & Thurlow, 2007; Klein, Wiley, & Thurlow, 2006; Wiley, Thurlow, & Klein, 2005; Thurlow, Quenemoen, Altman, & Cuthbert, 2007). In April of 2007, the federal Office of Elementary and Secondary Education Act issued regulations for the Elementary and Secondary Education Act (ESEA) known as the No Child Left Behind (NCLB) Act and the Individuals with Disabilities Education Act (IDEA). Through those regulations, it allowed for an assessment option that states could consider for the inclusion of students with disabilities in state assessment systems. This option is the alternate assessment based on modified achievement standards (AA-MAS), which states could use to count up to 2% of the total student population as proficient. States were not required to develop this assessment, but it afforded states additional flexibility alongside existing options that included taking a state’s regular assessment with or without accommodations, or an alternate assessment based on alternate achievement standards. The AA-MAS may only be taken by students who have an Individualized Education Program (IEP) and who, even with appropriate grade-level content instruction, are not likely to achieve proficient performance in a full academic year covered by an IEP. The AA-MAS is not limited to students from a specific disability category. At the time of this report, numerous states had developed an assessment that they believed met the criteria to be considered an AA-MAS. In 2009, 14 states had participation guidelines posted for an AA-MAS (Lazarus, Hodgson, & Thurlow, 2010). States that intend to use an AA-MAS for accountability purposes must submit the assessment to a peer review process led by the U.S. Department of Education and receive approval for its use for accountability. As of November 2010, Kansas, Louisiana, and Texas had been approved to use an AA-MAS for NCLB accountability purposes. Since 2007, the National Center on Educational Outcomes (NCEO) has produced numerous reports focused on AA-MAS. These looked at eligibility and participation guidelines (Lazarus, Hodgson, & Thurlow, 2010; Lazarus, Rogers, Cormier, & Thurlow, 2008; Lazarus, Thurlow, Christensen, & Cormier, 2007), accommodation policies (Lazarus, Cormier, Crone, & Thurlow, 2009), and test characteristics (Albus, Lazarus, Thurlow, & Cormier, 2009; Hodgson, Lazarus, & Thurlow, 2010). The purpose of this report is to examine publicly reported data for the AA-MAS for all states reporting these data, including those that had not as of November 2010 had their AA-MAS approved through the U.S. Department of Education peer review process. Although students without disabilities do not take the AA-MAS, it is important that data for students with disabilities who do take the AA-MAS are given the same considerations in public reporting as the data for their peers without disabilities. Therefore, we examined state report cards and other state reports as well as customizable report generators designed for public audiences to determine the extent to which this was the case. Data found in Annual Performance Reports (APRs) were not examined for this analysis of publicly reported data. The exception to this is that in describing how states reported students who took assessments with or without accommodations, some mention is given to APR reports that report on AA-MAS data. Guiding questions for the analysis of state public reports, conducted across years, were:
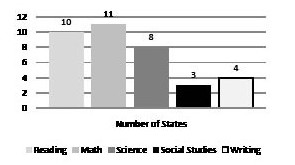
Top of Page | Table of Contents MethodAA-MAS participation and performance data examined in this report were gathered in searches of state Web sites conducted in September 2010. In addition, previous NCEO reports on state public reporting of disaggregated data were used to obtain historical data for 2006-07 and 2007-08 (Albus, Thurlow, & Bremer, 2009; Bremer, Albus, & Thurlow, 2010; Thurlow, Bremer, & Albus, 2008). Historical data (2006-07, 2007-08, 2008-09) included not only data found in public reports, but also data from publicly posted Annual Performance Reports (APRs) or State Performance Plans (SPPs) that state special education offices report to the Office of Special Education Programs for students receiving special education services. The APR data were used primarily for data on participation with accommodations. Data for 2009-10 were only from state report cards and other state reports, as well as customizable report generators designed for public audiences. Top of Page | Table of Contents ResultsThe number of states implementing or piloting an AA-MAS across the years 2006-07 through 2009-10 (n = 11) by content area is presented in Figure 1. Although by 2009-10, an additional two states were developing an AA-MAS (Ohio and Tennessee), Figure 1 includes only the 11 states that had implemented or piloted their AA-MAS (California, Connecticut, Kansas, Louisiana, Maryland, Michigan, North Carolina, North Dakota, Oklahoma, Pennsylvania, and Texas). Figure 1. Number of States with AA-MAS in Different Content Areas for 2006-07 through 2009-10
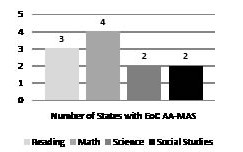
Figure 1 shows that 10 states had an AA-MAS in reading (all except Pennsylvania), 11 states in mathematics, and 8 states in science (all except Connecticut, Maryland, and Michigan). Three states had an AA-MAS in social studies (Kansas, Louisiana, and Texas), and four states had an AA-MAS in writing (California, Kansas, Michigan, and Texas). Details on these states and the first year in which they implemented or piloted their assessments in each content area (and for which grades) are provided in Appendix A, Table A-1. Only a few states administered an End-of-Course AA-MAS (see Figure 2). States administering these during the years 2006-07 through 2008-09 were three in reading (Maryland, North Carolina, and Oklahoma), four each mathematics (California, Maryland, North Carolina, and Oklahoma), and two each in science (Maryland and Oklahoma), and social studies (Kansas and Maryland). Full details on the information presented in Figure 2 is presented in Appendix A, Table A-1. Figure 2. Number of States with AA-MAS that are End of Course (EoC) Assessments for 2006-07 Through 2009-10
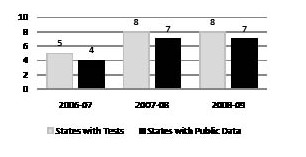
Figure 3 provides a summary of the states with AA-MAS by year, and whether they publicly reported disaggregated AA-MAS data. In 2006-07, there were five states that had what they considered to be an AA-MAS (Kansas, Louisiana, North Carolina, North Dakota, and Oklahoma). Four of these states reported data for that year (all except Kansas). Figure 3. Number of States with Tests and Disaggregated AA-MAS Data Publicly Reported by Year
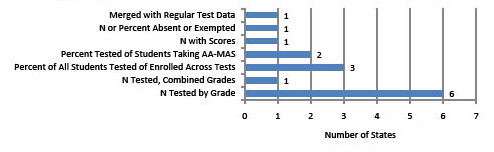
For 2007-08 and 2008-09, eight states had an AA-MAS (the five states from 2007-08 plus California, Maryland, and Texas). In each of these years, seven states reported data disaggregated for students with disabilities (all except Kansas). In these years, Kansas did report its AA-MAS data combined with its regular assessment data, but not disaggregated for the AA-MAS. Details on public reporting of AA-MAS data are presented in Appendix A, Table A-2. The 2009-10 data included in the Appendix are not included in Figure 3 because there is typically a delay in reporting of up to six months or more before final assessment data are posted and available. For several states, the 2009-10 data were not yet posted. Still, states had implemented an AA-MAS during this year, up from 8 the year before. Top of Page | Table of Contents AA-MAS Data Reported in 2007-08 and 2008-09We examined both participation and performance data for 2007-08 and 2008-09, starting with how the data were reported, followed by an analysis of the actual data. Detailed information on how data were reported are provided in Appendix A, Tables A-3 and A-4. Information on the actual participation and performance data is presented in Appendix B. In Appendix B, we also included 2009-10 data that had been reported by November, 2010 (see California and Texas), but do not summarize those data here because many states had not yet reported data publicly for that year. Participation DataThere are a number of ways that states can report on the participation of students with disabilities in state assessments. Figure 4 shows that six of the eight states with an AA-MAS reported the number of students tested for each grade. Three states reported the percent of students tested, using as the denominator those students enrolled in each grade. Two states reported the percent of students tested who were designated to take the AA-MAS. Other categories, such as reporting AA-MAS data merged with regular assessment data and reporting across grade levels rather than by grade, were represented by one state each. Equal numbers of states reported in more than one-way (e.g., both the number tested by grade and the percent of students taking the AA-MAS) as reported in one way only (e.g., only the number tested by grade). Details on how individual states reported are presented in Appendix A, Table A-3. Figure 4. How Participation was Reported on AA-MAS for 2007-08 and 2008-09 (n=8 States)
Table 1 shows the participation data publicly reported by each state across years (from 2006-07 through 2009-10). Where percentages are shown, they reflect reported percentages, not percentages we calculated (which we could have done for one state, North Carolina, because it provided enrollment data as well as participation numbers). For more detailed data for all grades, see Appendix B, Table B-1. Table 1. AA-MAS Participation Data: Number and Percent of Enrolled Students with Disabilities Who were Assessed in 2006-07 through 2009-10 in Grades 4/5 and 8
The numbers in Table 1 provide useful information for within-state comparisons of the numbers of students with disabilities participating in an AA-MAS. Three states that had more than one year of data (California, Louisiana, and Maryland) showed increases in the number of students with disabilities participating in the AA-MAS across grades and content areas. Three other states (North Carolina, Oklahoma, and Texas) showed no consistent pattern of increases or decreases across grades and content areas. Oklahoma’s data for students not receiving accommodations showed a notable increase in 2008-09 from previous years across all grade and content areas.
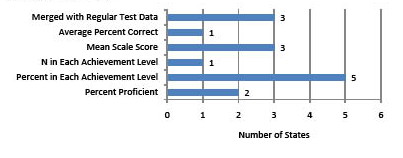
Performance DataFigure 5 shows how states publicly reported AA-MAS performance data for 2007-08 and 2008-09 (see details in Appendix A, Table A-4). The most common way of reporting performance was by percent in achievement level (five states). Three states reported AA-MAS data merged with regular data. Three states reported mean scale scores. Fewer states reported in other ways, such as percent proficient, average percent correct, and the number in each achievement level. It is possible that the state reporting the percent in each achievement level also could derive the percent proficient, but the percent proficient was not explicitly reported. Figure 5. How Performance was Reported for AA-MAS for 2007-08 and 2008-09 (n=8)
Six states (California, Louisiana, Maryland, North Carolina, Oklahoma, and Texas) had at least two years of performance data from 2006-07 through 2009-10. These data are presented in Table 2 for grade 4 or 5 and grade 8. The percent counted as proficient in the six states changed considerably within and across most states over time. In contrast, Texas showed consistent increases in percentages of students counted as proficient across years in all grades and content areas. For more detailed data for all grades, see Appendix B, Table B-2. Table 2. AA-MAS Performance Data: Number and Percent Proficient in 2006-07 to 2009-10
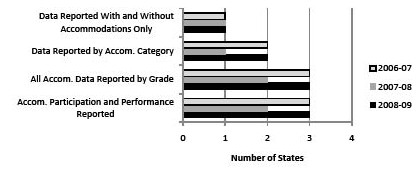
Note: Shaded areas indicate that no tests were administered. Dashes indicate no data reported for a year prior to 2009-10, or in 2009-10 when other data are posted. “Not posted” indicates that for 2009-10 no data were posted at the time we collected information. Table does not include states that were in development (Ohio, Tennessee). 1Kansas had its publicly reported AA-MAS data merged with regular assessment data. 2North Dakota reported AA-MAS by combined grades and merged data. 3Oklahoma reports participation and performance by accommodated and non-accommodated students (in parentheses) on its AA-MAS. Top of Page | Table of Contents Use of Accommodations Data Reported for AA-MASAcross 2006-07, 2007-08, and 2008-09, only three states reported AA-MAS data disaggregated for students using accommodations (Louisiana, North Carolina, and Oklahoma). These data are presented in Figure 6. Detailed data for Figure 6 are provided in Appendix C, Tables C-1 through C-4, for each year. Across these years, one state reported data with and without accommodations (Oklahoma) each year. Three states reported accommodations data across years by specific accommodation such as read aloud or individual administration (Louisiana, Kansas, and North Carolina). The specific accommodations were not necessarily the same across states. For example, Louisiana reported on “communication assistance,” which included specific accommodations that North Carolina separated out into individual accommodations. The percent of students using specific accommodations often was very small (0-2%) for many of the reported accommodations. The more common accommodations, with larger percentages of students with disabilities using them, were read aloud, individual or quiet setting, and timing and scheduling accommodations such as extended time and frequent breaks. Figure 6. How States with Accommodation Data for AA-MAS Reported by Year
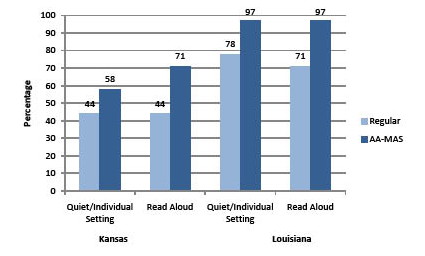
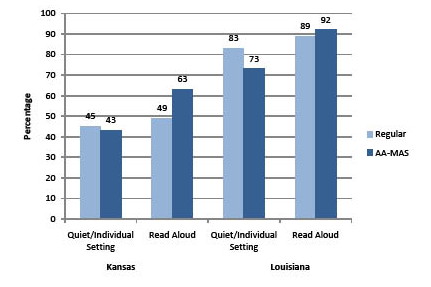
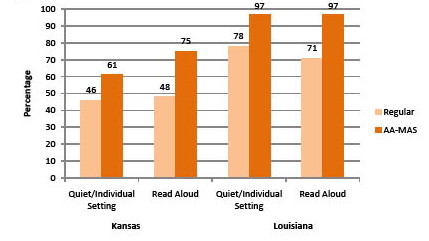
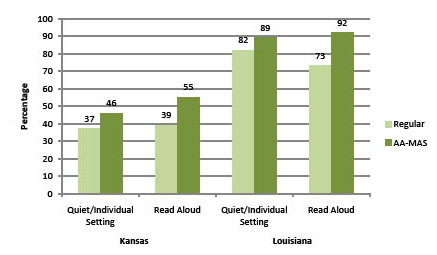
In 2008-09, the two accommodations with the highest reported percentage using them were read aloud and individual or quiet setting. Data on these accommodations for the regular assessment and AA-MAS, for Kansas and Louisiana, are presented in Figures 7-12. These figures show data for two grades (grades 4 and 8) for reading, mathematics, and science. Each figure shows data for the regular assessment and the AA-MAS for each state. North Carolina also reported participation data for its students using accommodations, but the data reported for its regular assessment may include students without disabilities as well as students with disabilities who used an accommodation; thus, we did not include the North Carolina data here. Interpretation of participation with specific accommodations should take into account that states vary in their policies of whether an accommodation is allowed, allowed for certain circumstances, allowed with scoring consequences, or prohibited (Lazarus et al., 2009). For example, Kansas and Louisiana allow read aloud for directions given to the student and allow the reading aloud of questions in certain circumstances. Louisiana does not allow read aloud on the Read and Respond section of its reading assessments, meaning that no part of the questions, answers, or passages may be read. In Kansas, if the read aloud is used for questions there are consequences for scoring. Still, the policies governing the use of these two accommodations are the same for the regular and AA-MAS assessments for each state. Figure 7. Percentage of Students by Specific Accommodation in Grade 4 Reading, Regular and AA-MAS
Figure 8. Percentage of Students by Specific Accommodation in Grade 8 Reading, Regular and AA-MAS
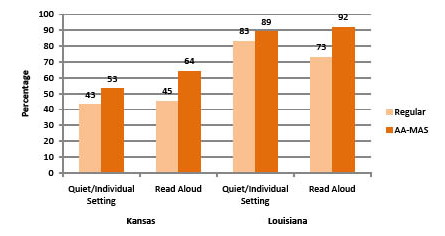
Figure 9. Percentage of Students with Disabilities by Specific Accommodations in Grade 4 Math, Regular and AA-MAS
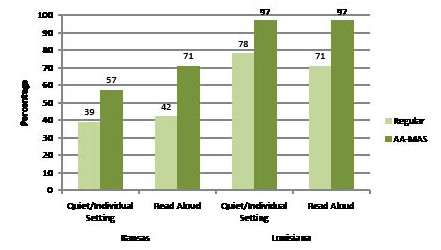
Figure 10. Percentage of Students By Specific Accommodation in Grade 8 Math, Regular and AA-MAS
Figure 11. Percentage of Students with Disabilities by Specific Accommodation in Grade 4 Science, Regular and AA-MAS
Figure 12. Percentage of Students with Disabilities by Specific Accommodation in Grade 7/8 Science, Regular and AA-MAS
Top of Page | Table of Contents DiscussionThe results of our analysis of publicly reported data on the AA-MAS participation and performance of students with disabilities indicated that most states that have implemented the AA-MAS are reporting some data publicly. Of the eight states that had an AA-MAS in place in 2008-09, seven had data for participation or performance within the timeframe of 2006-07 to 2009-10; one of these reported participation data only. In the most recent year (2008-09), seven of eight states had publicly reported data, compared to the same numbers in 2007-2008, and to four of five states in 2006-07. The state with no data on its AA-MAS in 2006-07 continued to not report disaggregated data publicly across all years of our analysis. States have increased the number of AA-MAS being implemented in different content areas, and reporting practices reflect this. In 2009-10, 11 states had an AA-MAS; 10 states administered the AA-MAS in reading, 11 states in mathematics, 8 states in science, 3 states in social studies, and 4 states in writing. States also have AA-MAS End-of-Course assessments, with 2 to 4 states offering these in reading, math, science, or social studies. Across 2006-07 through 2009-10, seven states reported participation data by grade. Most states had not yet posted 2009-10 data. Generally, there were more states that reported numbers tested than reported percent tested on AA-MAS, with only one reporting the latter. It should be noted that data on AA-MAS participation are also reported by states to the U.S. Department of Education in a way that allows for percentages to be calculated. Summaries of calculated percentages from states’ APRs are available on the NCEO Web site at www.nceo.info/OnlinePubs/annualperformancereports.html. For the six states with at least two years of participation data, three states showed increased numbers taking AA-MAS for all grades and subjects across years, and three states showed no consistent pattern of increases or decreases across years. One state showed a notable increase in the number of students participating and not receiving accommodations across all grades and content areas on the assessment, potentially indicating a change in participation or accommodation policies. These types of increases are ones that the public will want to monitor, especially given the restriction on the percentage of students (2% of the total population) who can be considered proficient under ESEA accountability provisions. Six states had performance data spanning more than two years. Just one state showed consistent increases in percent proficient across all grades and content, whereas most states had inconsistent patterns in performance. For the 2007-08 and 2008-09 years, some states also reported data on AA-MAS by accommodated conditions, with two states reporting data for students assessed with and without accommodations, and three states reporting by specific accommodation type. Three states reported data for participation and performance by grade. These data are informative. It would be useful to have more states report these data in relation to participation and performance on all assessments, including the AA-MAS. Public reporting of data from assessments disaggregated for students with disabilities is helpful in determining how these students are participating and performing on large-scale assessments and for informing policy and practice. Having comparable data reported for students with disabilities who participate in the AA-MAS is similarly important for informing policy and practice for this new assessment option. Continued attention to transparent reporting of data, and the nature of those data, will be essential for states that have opted to provide an AA-MAS for some of their students with disabilities. Top of Page | Table of Contents ReferencesAlbus, D., Lazarus, S. S., Thurlow, M. L., & Cormier, D. (2009). Characteristics of states’ alternate assessments based on modified academic achievement standards in 2008 (Synthesis Report 72). Minneapolis, MN: University of Minnesota, National Center on Educational Outcomes. Albus, D., Thurlow, M., & Bremer, C. (2009). Achieving transparency in the public reporting of 2006-2007 assessment results (Technical Report 53). Minneapolis, MN: University of Minnesota, National Center on Educational Outcomes. Barton, P., & Coley, R. (2008). Windows on achievement and inequality (Policy Information Report). Princeton, NJ: Educational Testing Service. Retrieved from http://www.ets.org/Media/Research/pdf/PICWINDOWS.pdf Barton, P., & Coley, R. (2010). The black-white achievement gap: When progress stopped. Princeton, NJ: Educational Testing Service, ETS Policy and Evaluation and Research Center. Retrieved from http://www.ets.org/research/policy_research_reports/pic-bwgapB Bremer, C., Albus, D., & Thurlow, M.L. (2010). Public reporting of 2008-2009 assessment data for students with disabilities: Progress on the Gap Front (Technical Report 57). Minneapolis, MN: University of Minnesota, National Center on Educational Outcomes. Center on Education Policy. (2008). Has student achievement increased since 2002? State test score trends through 2006-07. Washington, DC: Author. Hodgson, J. R., Lazarus, S. S., & Thurlow, M. L. (2010). Characteristics of states’ alternate assessments based on modified academic achievement standards in 2009-2010 (Synthesis Report 90). Minneapolis, MN: University of Minnesota, National Center on Educational Outcomes.Klein, Klein, J. A., Wiley, H. I., & Thurlow, M. L. (2006). Uneven transparency: NCLB tests take precedence in public assessment reporting for students with disabilities (Technical Report 43). Minneapolis, MN: University of Minnesota, National Center on Educational Outcomes.Klein, Lazarus, S. S., Cormier, D. C., Crone, M., & Thurlow, M. L. (2009). States’ accommodations policies for alternate assessments based on modified academic achievement standards (AA-MAS) in 2008–2009 (Synthesis Report 74). Minneapolis, MN: University of Minnesota, National Center on Educational Outcomes. Lazarus, S. S., Hodgson, J., & Thurlow, M. L. (2010). States’ participation guidelines for alternate assessments based on modified academic achievement standards (AA-MAS) in 2009 (Synthesis Report 75). Minneapolis, MN: University of Minnesota, National Center on Educational Outcomes. Lazarus, S. S., Rogers, C., Cormier, D., & Thurlow, M. L. (2008). States’ participation guidelines for alternate assessments based on modified academic achievement standards (AA-MAS) in 2008 (Synthesis Report 71). Minneapolis, MN: University of Minnesota, National Center on Educational Outcomes. Lazarus, S. S., Thurlow, M. L., Christensen, L. L., & Cormier, D. (2007). States’ alternate assessments based on modified achievement standards (AA-MAS) in 2007 (Synthesis Report 67). Minneapolis, MN: University of Minnesota, National Center on Educational Outcomes. Snipes, J., Horwitz, A., Soga, K., & Casserly, M. (2008). Beating the odds: An analysis of student performance and achievement gaps on state assessments: Results from the 2006-2007 school year. Chicago: Council of the Great City Schools. Retrieved from http://www.eric.ed.gov/PDFS/ED505334.pdf Thurlow, M., Bremer, C., & Albus, D. (2008). Good news and bad news in disaggregated subgroup reporting to the public on 2005–2006 assessment results (Technical Report 52). Minneapolis, MN: University of Minnesota, National Center on Educational Outcomes Thurlow, M., Quenemoen, Q., Altman, J., & Cuthbert, M. (2007). Trends in the participation and performance of students with disabilities (Technical Report 50). Minneapolis, MN: University of Minnesota, National Center on Educational Outcomes. Ushomirsky, N., & Hall, D. (2010). Stuck schools: A framework for identifying schools where students need change – now! Washington, DC: The Education Trust. Retrieved from http://www.edtrust.org/sites/edtrust.org/files/publications/files/StuckSchools.pdf VanGetson, G. R., & Thurlow, M. L. (2007). Nearing the target in disaggregated subgroup reporting to the public on 2004-2005 assessment results (Technical Report 46). Minneapolis, MN: University of Minnesota, National Center on Educational Outcomes. Wiley, H. I., Thurlow, M. L., & Klein, J. A. (2005). Steady progress: State public reporting practices for students with disabilities after the first year of NCLB (2002-2003) (Technical Report 40). Minneapolis, MN: University of Minnesota, National Center on Educational Outcomes. Top of Page | Table of Contents Appendix ATable A-1. First Year of AA-MAS Implementation by Content Area1
1 The table shows the first year of implementation of assessments that continue in subsequent years. 2 State added “multiple measure” items, so the assessments are listed again. 3 History-Government Freshman and Juniors in 2010-11 only. *Ohio and Tennessee are not included in this table because they were developing their AA-MAS.
Table A-2. Publicly Reported AA-MAS Data Available by Year
Note: Data do not include Annual Performance Report or State Performance Plan data.
Table A-3. Participation: AA-MAS How States Reported Data for 2007-08 and 2008-09
Note: This table includes only those states implementing an AA-MAS in 2007-08 and 2008-09. 1Kansas does report N tested by accommodation, but these data are not in a regular state report but a special study looking at accommodated participation. 2By accommodated and non-accommodated condition separately. 3By all grades combined.
Table A-4. Performance: AA-MAS How States Reported Data for 2007-08 and 2008-09
Note: This table includes only those states implementing an AA-MAS in 2007-08 and 2008-09. 1 By accommodated and non-accommodated condition separately. 2By grade and all grades combined depending on the report. Top of Page | Table of Contents Appendix BNote: Gray shading indicates no test in year Table B-1. Detailed Publicly Reported Data for AA-MAS Across 2006-07 to 2007-08
Table B-2. Detailed Publicly Reported Data for AA-MAS Across 2008-09 to 2009-10
Top of Page | Table of Contents Appendix CTable C-1. 2006-2007 Summary of States that Reported State-level AA-MAS Accommodations Data
Note: Two states that had an AA-MAS in 2006-07 did not report accommodations data (Kansas, North Dakota).
Table C-2. 2007-2008 Summary of States that Reported State-level AA-MAS Accommodations Data
Note: Six states that had an AA-MAS in 2007-08 did not report accommodations data (California, Kansas, Louisiana, Maryland, North Dakota, Texas).
Table C-3. 2008-2009 Summary of States that Reported State-level AA-MAS Accommodations Participation Data
Note: Five states that had an AA-MAS in 2007-08 did not report accommodations participation data (California, Kansas, Maryland, North Dakota, Texas).
Table C-4. 2008-2009 Summary of States that Reported State-level AA-MAS Accommodations Performance Data
Note: Five states that had an AA-MAS in 2007-08 did not report accommodations performance data (California, Kansas, Maryland, North Dakota, Texas).
Table C-5. Data for Specific Accommodations of States with Publicly Reported Data by Accommodation for Students with Disabilities on Regular and AA-MAS Assessments
|
|||||||||||||||||||||||||||||||||||||||||||||||||||||||||||||||||||||||||||||||||||||||||||||||||||||||||||||||||||||||||||||||||||||||||||||||||||||||||||||||||||||||||||||||||||||||||||||||||||||||||||||||||||||||||||||||||||||||||||||||||||||||||||||||||||||||||||||||||||||||||||||||||||||||||||||||||||||||||||||||||||||||||||||||||||||||||||||||||||||||||||||||||||||||||||||||||||||||||||||||||||||||||||||||||||||||||||||||||||||||||||||||||||||||||||||||||||||||||||||||||||||||||||||||||||||||||||||||||||||||||||||||||||||||||||||||||||||||||||||||||||||||||||||||||||||||||||||||||||||||||||||||||||||||||||||||||||||||||||||||||||||||||||||||||||||||||||||||||||||||||||||||||||||||||||||||||||||||||||||||||||||||||||||||||||||||||||||||||||||||||||||||||||||||||||||||||||||||||||||||||||||||||||||||||||||||||||||||||||||||||||||||||||||||||||||||||||||||||||||||||||||||||||||||||||||||||||||||||||||||||||||||||||||||||||||||||||||||||||||||||||||||||||||||||||||||||||||||||||||||