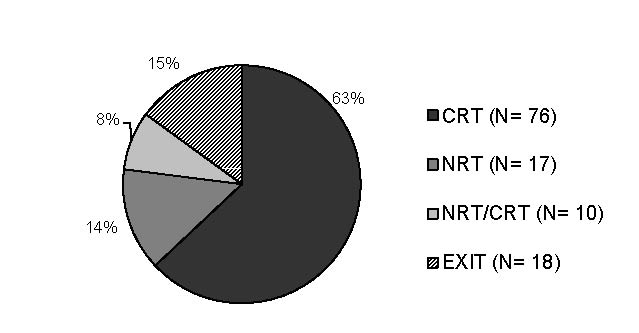
Public Reporting of 2007–2008 Assessment Information on Students with Disabilities: Progress on the Gap FrontChris Bremer • Debra Albus • Martha L. Thurlow March 2011 All rights reserved. Any or all portions of this document may be reproduced and distributed without prior permission, provided the source is cited as: Bremer, C., Albus, D., & Thurlow, M. L. (2011). Public Reporting of 2007–2008 Assessment Information on Students with Disabilities: Progress on the Gap Front (Technical Report 57). Minneapolis, MN: University of Minnesota, National Center on Educational Outcomes. Table of ContentsTo review the appendices, please refer to the PDF version of this report. Executive SummaryThis is the twelfth annual report by the National Center on Educational Outcomes (NCEO) analyzing public reporting of disaggregated assessment data for elementary and secondary students with disabilities in the United States. Reporting disaggregated performance data at the state and district level to the public is required of states by the Individuals with Disabilities Education Act (IDEA); the 2007-2008 school year marks the ninth annual reporting period since this requirement was established, and the sixth reporting period since the 2001 reauthorization of the Elementary and Secondary Education Act (ESEA). For the 2007-2008 school year, the number of regular states publicly reporting disaggregated data for both participation and performance for students with disabilities taking regular assessments fell from 46 to 45. Thirty-six states provided disaggregated participation and performance data for students with disabilities taking alternate assessments based on alternate achievement standards (AA-AAS) for 2007-2008; this number remained the same as in 2006-2007. Reporting of regular assessments in the ESEA accountability system, by type, for regular states showed a pattern similar to 2006-2007, with 100% reporting participation and performance on norm-referenced tests (NRT), combination NRT and criterion-referenced tests (NRT/CRT), and exit exams (EXIT), but lower levels of reporting on the most common test type, CRTs. Although a greater number of CRTs were used, the percentage of those on which states reported fell from 89% to 85%. Reporting on regular assessments was provided by 49 regular states in 2007-2008, the same number as in 2006-2007. Reporting on AA-AAS was provided by 43 regular states in 2007-2008, down from 44 states in 2006-2007. For the unique states, four reported both participation and performance data for regular assessments. One unique state reported both participation and performance data for AA-AAS. The public reporting of participation and performance for 2007-2008 assessments was fairly consistent with the reporting in 2006-2007. There continues to be a need for states to report clearly, to publicly report on accommodations use, and to strive to make the data that are reported accessible to those who seek them via public Web sites. Top of page | Table of Contents OverviewThe 2007-2008 school year marks the ninth annual reporting period since disaggregating the performance of students with disabilities on state and district-wide assessments was required by the Individuals with Disabilities Education Act (IDEA). It is the sixth reporting period since the 2001 reauthorization of the Elementary and Secondary Education Act (ESEA), and the twelfth in a series of National Center on Educational Outcomes (NCEO) reports documenting state public reporting practices. In the past, the number of states publicly reporting disaggregated participation and performance data online for all regular assessments has increased from 28 states before the passage of ESEA (2000-2001), to 46 states for assessments within ESEA accountability systems in 2006-2007 (Albus, Thurlow, & Bremer, 2009). In the intervening years (2002-2003 to 2006-2007), the number has fluctuated from 35 to 39 states (Albus, Thurlow, & Bremer, 2009; Klein, Wiley, & Thurlow, 2006; Thurlow & Wiley, 2004; Thurlow, Wiley, & Bielinski, 2003; Wiley, Thurlow, & Klein, 2005; Thurlow, Bremer, & Albus, 2008; VanGetson & Thurlow, 2007). The number of states reporting disaggregated participation and performance data for alternate assessments based on alternate achievement standards (AA-AAS) decreased from the high of 42 states, in 2004-2005, to 36 states in 2006-2007. The number had dipped to 28 states in 2005-2006. The change in number of states reporting may be related to changes in federal policies for reporting to the U.S. Department of Education and to our criteria, which became narrower after 2004-2005. Annual Performance Report (APR) data were not counted as publicly reported data after 2004-2005 because if this was the only reporting, the state did not report “to the public with the same frequency and in the same detail as it reports on the assessment of nondisabled children,” as required by IDEA (see Thurlow, Bremer, & Albus, 2008). Top of page | Table of Contents MethodIn January 2009, project staff searched the Web sites of state departments of education for posted reports with disaggregated data for students with disabilities for school year 2007-2008. Although states are required to report their data in the fall following the assessment year (e.g., 2007-2008 data are reported in fall, 2008), they often revise data through the end of the year. Thus, January of the year after the school year in which assessments are administered is the month when almost all states have their corrected and verified data on their Web sites. States that were searched included the 50 “regular” states and 11 “unique” states (American Samoa, Bureau of Indian Education, Commonwealth of Northern Mariana Islands, U.S. Department of Defense Education Affairs, District of Columbia, Federated States of Micronesia, Guam, Palau, Puerto Rico, Republic of the Marshall Islands, and U.S. Virgin Islands). Information was collected both on the actual participation and performance data reported for students with disabilities and on how the states reported those data. The data collection included all regular and alternate state assessments within and outside the ESEA accountability systems, with the exception of assessments designed specifically for bilingual or English language learners. After data were collected, individual state summary tables were created for verification. These summaries included only the descriptive information on how the state reported participation and performance. See Appendix A for a sample letter and summary table used in the verification process with state assessment directors. The verification process occurred in two waves between March and May of 2009. In the first wave, letters and summary tables were mailed to state assessment directors. Twenty-three regular states responded to our request for verification in the first wave. In the second wave, after data tables were revised based on feedback, letters were sent to all state directors of Special Education (see Appendix B). Twenty regular states and one unique state responded to the second request for help in verification, with twelve of the same states from the first wave confirming data a second time. Finally, we completed data entry and double checks for accuracy. In the majority of this report, we credited states as reporting participation rates if no calculations were needed to arrive at the rates from reported data. When we do include states for which participation rates were derived, it is noted. State assessments administered to students with disabilities who are also English language learners (ELLs) or bilingual students (e.g., a simplified-English mathematics test for ELLs—such as MTELL, in Minnesota) are counted in this report even though a separate report focuses specifically on these and other data reported for the population of English language learners with disabilities. As noted by Thurlow et al. (2008), the definition of what we count as public reporting has been adjusted in recent years. Starting with the 2005-2006 school year, state Annual Performance Reports (APRs) and State Performance Plans (SPPs) have not been considered to be public reports that a state creates to meet the requirement to report public data on students with disabilities in the same manner and with the same frequency as it reports for all students. The definition of regular students and students with disabilities is the same as in previous reports. “Regular student” refers to a population that might include all students assessed or all students without disabilities, depending on the state. The definition should be considered in interpreting the data, because we compare “regular student” data with data for students with disabilities. Further, the term “students with disabilities” may also vary by state, with some states reporting only students with Individualized Education Plans (IEPs), and others reporting a combination of students with IEPs and 504 Plans. When we examined gaps between all students and students with disabilities, we employed the same procedures as in the past, choosing representative grades to present data for elementary, middle, and high school. For our examination of gaps, we chose grades 4, 8, and 10. If a state did not have data for a grade, we chose one grade below. If that grade was not available, we chose the grade above. Further, we focused on reading and mathematics content areas, consistent with previous analyses. Information on how states reported other content areas is in the appendices. Top of page | Table of Contents ResultsCharacteristics of State Assessment SystemsA list of general state assessments for 2007-2008 is located in Appendix C. It includes all 50 regular states and the 11 unique states, with information on the name of each assessment, grades and content areas assessed, whether the state had publicly available disaggregated participation or performance data for students with disabilities for 2007-2008, and whether the results of each assessment are used for ESEA accountability purposes. We identified 121 statewide assessments for the 50 regular states for 2007-2008. Of the 17 states that indicated they had administered a norm-referenced test (NRT), three states used the ITBS (Iowa, Nevada, and Utah), three states used TerraNova/Cat/6 (Alaska, Arizona, and California), three used the SAT 10 (Alabama, Arkansas, and Florida), two states each used EXPLORE and PLAN (Kentucky and West Virginia), and one state used Direct Writing Assessment (DWA) (Utah). In addition, California was phasing out Aprenda, an NRT specifically for Spanish speaking populations, and Nebraska used a standardized test that was not named. Ten other states used NRTs augmented with criterion referenced items (Arizona, Delaware, Florida, Indiana, Louisiana, Maine, Michigan, Missouri, North Dakota, and South Dakota). All other assessments were exit exams (EXIT) and criterion-referenced tests (CRTs) unique to each state, except for a few that were used commonly across a small group of states such as the NECAP assessment used by three states (New Hampshire, Rhode Island, and Vermont). Three states administered five state assessments each in 2007-2008, which was the highest number across all states (Alabama, Georgia, and North Carolina). In addition to the 50 regular states, we also included the 11 unique states. For these 11, we had specific names for 9 state assessments. The Stanford Achievement Test (SAT-9 or SAT-10) was used by four unique states (American Samoa, Commonwealth of the Northern Mariana Islands, District of Columbia, and Guam). The TerraNova was used by the Department of Defense Education Affairs, and Palau was revising its Palau Achievement Test (PAT), also an NRT. Two entities used augmented NRT/CRTs (Puerto Rico and Virgin Islands). Only one unique state (Commonwealth of the Northern Mariana Islands) used more than one regular assessment, employing both an NRT and a CRT. For the Bureau of Indian Education, students participate in statewide assessments in their state of residence and are reported together as a group based on proficiency data in their respective states. Figure 1a displays the 121 assessments found for the 50 states (both in and outside ESEA accountability system) by type: criterion-referenced tests, norm-referenced tests, augmented NRTs with state-developed CRT items, and exit exams used as a requirement for graduation (EXIT). Figure 1a. Total Percent of Regular Assessments In and Outside ESEA Accountability Systems by Assessment Type (N=121)
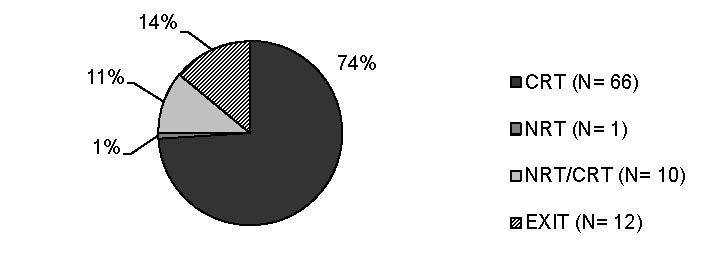
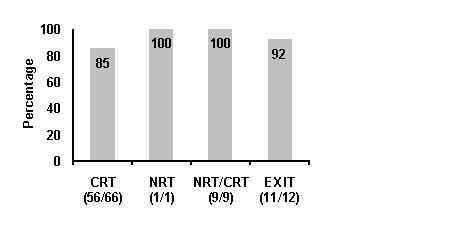
Note: Assessments are counted by assessment name. If a state had different names for CRTs by elementary/middle and high school these are counted separately. Alternative exit assessments were not counted. Overall, the most common assessment type in 2007-2008 was the CRT at 63% (N=76), followed by EXIT assessments at 15% (N=18), NRTs at 14% (N=17), and augmented NRT/CRTs at 8% (N=10). Comparing the percent of each assessment type to that in 2006-2007, CRTs made up 2% more of the total, and EXIT assessments made up 3% less. The other two assessment types were nearly the same. Figure 1b displays the same information as Figure 1a except that it includes only those assessments within ESEA accountability systems. Of the 89 assessments, CRTs (N=66) made up 74%, EXITs (N=12) made up 14%, NRT/CRTs (N=10) made up 11%, and NRTs (N=1) made up only 1%. Figure 1b. Number of Regular Assessments in ESEA Accountability Systems by Assessment Type (N=89)
Note: Assessments are counted by assessment name. If a state had different names for CRTs by elementary/middle and high school these are counted separately. Alternative exit tests were not counted.
|
||||||||||||||||||||||||||||||||||||||||||||||||||||||||||||||||||||||||||||||||||||||||||||||||||||||||||||||||||||||||||||||||||||||||||||||||||||||||||||||||||||||||||||||||||||||||||||||||||||||||||||||||||||||||||||||||||||||||||||||||||||||||||||||||||||||||||||||||||||||||||||||||||||||||||||||||||||||||||||||||||||||||||||||||||||||||||||||||||||||||||||||

|
Unique States |
Participation |
Performance |
|
American Samoa |
No |
No |
|
Bureau of Indian Affairs |
Yes |
Yes |
|
Commonwealth of the Northern Mariana Islands |
No |
No |
|
Department of Defense Education Affairs |
Yes |
Yes |
|
District of Columbia |
Yes1 |
Yes1 |
|
Federated States of Micronesia |
No |
No |
|
Guam |
No |
No |
|
Palau |
No |
No |
|
Puerto Rico |
No |
No |
|
Republic of the Marshall Islands |
No |
No |
|
U.S. Virgin Islands |
Yes |
Yes |
1 The District of Columbia reported data by grade ranges.
States That Reported Disaggregated Data for Students with Disabilities for Alternate Assessments Based on Other Achievement Standards
All 50 regular states indicated using at least one alternate assessment based on alternate achievement standards (See Appendix D). Of these, one state (Arizona) had two tests but this was because the state uses one test for students in elementary and middle school and another one at the high school level. Some states had alternate assessments based on modified achievement standards (California, Kansas, Louisiana, North Carolina, North Dakota, Ohio, Oklahoma, and Texas) (See Appendix E). One alternate assessment (Washington) was classified by us as an unclear alternate exit test because the achievement standards used were not described. All alternate assessments, except the one in Washington, were categorized as used within ESEA accountability systems. The state with the highest number of alternate assessments was North Carolina (N=4), which is consistent with the findings of previous years, 2006-2007 and 2005-2006.
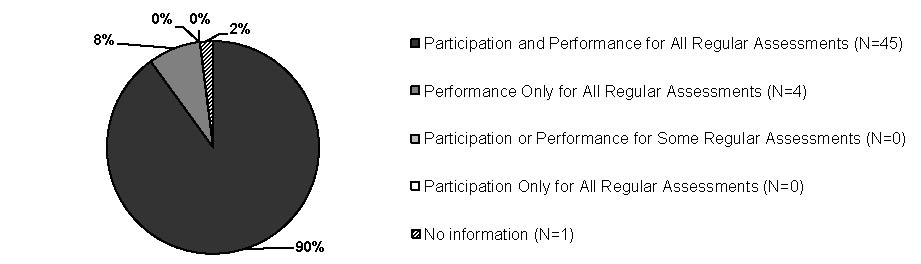
Figure 6 shows the number and percent of states that disaggregated participation and performance data for students with disabilities on alternate assessments based on alternate achievement standards (AA-AAS). There was very little change from 2006-2007 to 2007-2008. The same number reported both participation and performance (N=36) in both years. The number that reported performance only decreased by one state, and the number with no data increased by one state. States reporting participation only remained the same (N=2).
Figure 6. Disaggregated Alternate Assessment Based on Alternate Achievement Standards Results for Students with Disabilities in 2007-2008 for Regular 50 States*
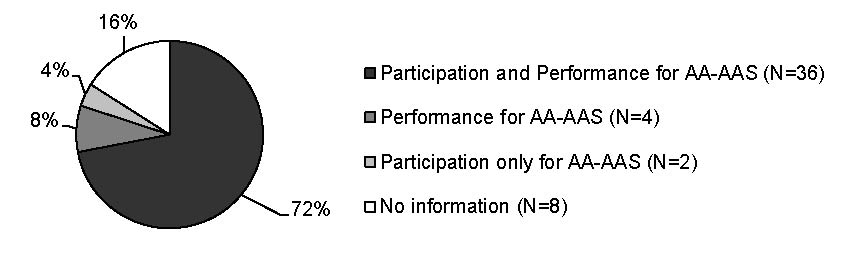
*The figure does not include state APR or SSP data.
The total number of unique states with an alternate assessment based on alternate achievement standards (AA-AAS) in 2007-2008 was unclear due to the lack of information on state Web sites. In previous years, three unique states indicated using an AA-AAS for ESEA accountability purposes. In 2007-2008, one state (Virgin Islands) posted data for participation and performance on an AA-AAS.
Table 2. Unique States Reporting Disaggregated Participation or Performance Data for Students with Disabilities on Alternate Assessments based on Alternate Achievement Standards
|
Unique States |
Participation |
Performance |
|
American Samoa |
No |
No |
|
Bureau of Indian Affairs |
No |
No |
|
Commonwealth of the Northern Mariana Islands |
No |
No |
|
Department of Defense Education Affairs |
No |
No |
|
District of Columbia |
No |
No |
|
Federated States of Micronesia |
No |
No |
|
Guam |
No |
No |
|
Palau |
No |
No |
|
Puerto Rico |
No |
No |
|
Republic of the Marshall Islands |
No |
No |
|
U.S. Virgin Islands |
Yes |
Yes |
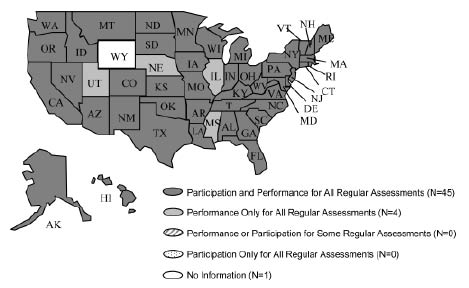
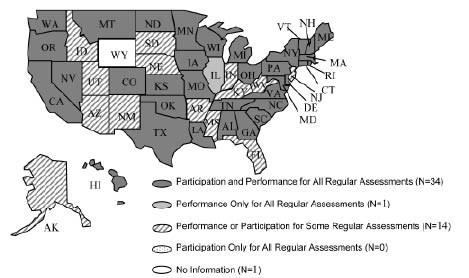
Figure 7 maps the number of regular states that reported disaggregated participation and performance data for AA-AAS. The number of states reporting participation and performance data for all AA-AAS for 2007-2008 was 36, the same as in the previous year. Four reported performance only (Illinois, Montana, Mississippi and Wyoming), two reported participation only (North Dakota and Rhode Island), and eight reported no information.
Figure 7. States Reporting 2007-2008 Disaggregated Participation or Performance Data for Students with Disabilities on Alternate Assessments based on Alternate Achievement Standards*
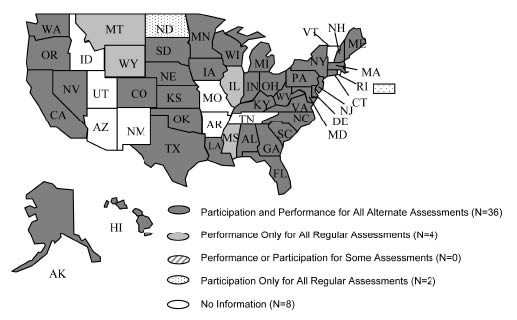
*The figure does not include state APR or SPP data. A broad definition was used to determine whether a state had data—states were included if they had data in any form for each assessment; these data could be presented for the state as a whole, by grade ranges, or by grade.
The small number of alternate assessments based on other types of achievement standards (grade-level or modified) were described earlier in this report; the participation and performance data for these other alternate assessments are noted in Appendices C and E.
Communicating Participation in 2007-2008
Regular Assessment Participation Approaches and Select Results
In this section we show the ways in which states reported participation data for regular assessments. More specifically, we describe the participation information presented to readers of a state’s assessment report, without doing any calculations. Figure 8 focuses on the approaches taken by the 50 regular states in presenting participation data. This information is presented by state in Appendix F.
Figure 8. Number of States Reporting Participation by Various Approaches for Regular Assessments in ESEA Accountability Systems in 2007-2008
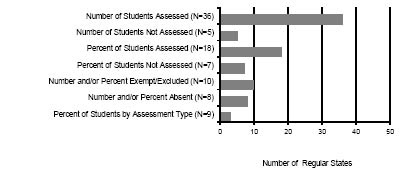
The most common way that states reported participation was number of students assessed (n=36). This was followed by reporting the percent of students assessed (n=18) and information about exempted or excluded students (n=10). Only a small number of states reported the number or percent absent (n=8) or percent of students not assessed (n=7).
Participation data for unique states are not graphed due to the small amount of data. Of the four states that publicly reported participation, three reported the number tested. Two of those reporting number tested did so not by grade but by grade range (i.e., elementary) or the total across grades. Three states reported the percentage tested, again with two states not reporting this by grade. The remaining seven unique states reported no disaggregated participation data publicly (see Appendix F).
Figure 9 shows the participation rates reported for 8th grade math in states where this information was reported, or the data could be derived. The grade and content area (middle school math) were chosen to maintain consistency with previous reports. States that aggregated middle school grades together were not included. For the 2007-2008 academic year, participation rates ranged from 86% to 99% compared to 79% to 100% in 2006-2007. Fewer states are graphed in the current year (N=15) compared to the previous year (N=22), but there is one state more than in 2005-2006 (N=14). In 2007-08, all but two of the fifteen states had participation rates over 90%, with most of these over 95%.
Figure 9. Percentages of Students with Disabilities Participating in Middle School Regular Math Assessments in Those States with Clear Reporting of Participation Rates*
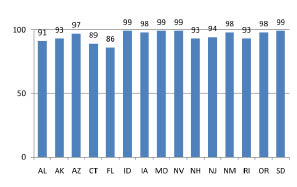
*Note: States graphed here include those with percentages derived from presented data, so some may not be counted as reporting a rate in Appendix E.
AA-AAS Disaggregated Participation Results for Students with Disabilities
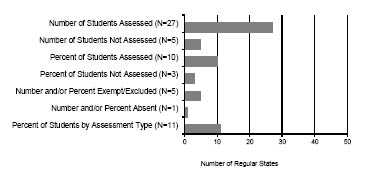
We examined the ways in which states reported participation data for their alternate assessments based on alternate achievement standards (see Appendix G). Figure 10 shows how the 50 regular states approached reporting participation data for AA-AAS. This is a slightly different pattern from the ways in which participation data were reported for regular assessments. The category “percent of students by assessment” appears slightly more common for AA-AAS. Otherwise, the most common category is number tested.
Figure 10. Number of Regular States Reporting Participation by Various Approaches for AA-AAS in the ESEA Accountability System in 2007-2008
Communicating Performance in 2007-2008
Regular Assessment Performance and Select Results
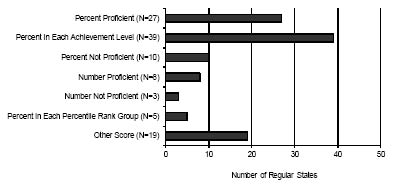
States also report performance data in a variety of ways, such as the number or percent in each achievement level, percent proficient or not proficient, and scaled scores. The details for the figures in this section are presented by state and assessment in Appendix H. Figure 11 shows how the 50 states reported performance on regular assessments.
The most common way states reported performance data was by percent in each achievement level (n=39), followed by percent proficient (n=27) and other score (n=19). The “other score” category includes scaled scores or other types of scores that do not fit into the other categories.
Figure 11. Number of States Reporting Performance by Various Approaches for Regular Assessments in the ESEA Accountability Systems in 2007-2008
Selected Disaggregated Results of Regular Assessment Performance
This section compares the performance of general education students and students with disabilities for those states reporting disaggregated data. It is important to keep in mind that each state determines the specific content of its assessments and establishes its own proficiency levels. Therefore, it is unwise to compare proficiency rates of individual states, or to compare gaps between general education versus special education across states. Regular assessments in this section include predominantly state CRTs, though Exit assessments were used when states had no other assessment for 10th grade for ESEA accountability. One state, Iowa, used an NRT.
As noted in the method, the comparison group of general education students may include all students assessed or all students without disabilities assessed, due to the variability in how states report. This can influence how gap comparisons are interpreted, to a small degree, depending on the percentage of students with disabilities in the assessment.
Reading Performance
For 2007-08, slightly fewer states had data available for gap analyses than in 2006-2007. Figures 12-14 show the reading performance of students by state for those reporting data in 2007-2008. As found in previous years, students with disabilities had a lower percentage scoring proficient in reading and mathematics compared to general education students. However, there appears to be a pattern of smaller average gaps across the years from 2005-2006 and 2007-2008 for both reading and mathematics (Table 3a). The largest percentage change in average gaps was in elementary reading (-5.3), followed by middle school reading (-4.8) and middle school mathematics (-4.1).
Table 3a. Gaps Between Students with Disabilities and General Education Students on Regular Assessments for All States with Data: Comparison of Mean Gaps for SY 2005-2006 to 2007-2008
|
Mean Gaps for All States with Data |
Gap Changes for All States |
||||||||
|
2005-2006 |
2006-2007 |
2007-2008 |
2005-06 and 2006-07 |
2006-07 and 2007-08 |
2005-06 and 2007-08 |
||||
|
Gap |
Number of states |
Gap |
Number of states |
Gap |
Number of states |
||||
|
Elementary Reading |
34.5 |
45 |
31.4 |
47 |
29.2 |
44 |
-3.1 |
-2.2 |
-5.3 |
|
Middle School Reading |
42.5 |
45 |
40.5 |
47 |
37.7 |
44 |
-2.1 |
-2.8 |
-4.8 |
|
High School Reading |
42.5 |
41 |
39.8 |
46 |
38.9 |
42 |
-2.7 |
-1.00 |
-3.7 |
|
Elementary Math |
29.3 |
45 |
28.9 |
47 |
26.7 |
44 |
-0.4 |
-2.6 |
-3.0 |
|
Middle School Math |
40.9 |
45 |
39.7 |
47 |
36.8 |
44 |
-1.2 |
-2.9 |
-4.1 |
|
High School Math |
38.5 |
42 |
38.2 |
44 |
35.27 |
43 |
-.3 |
-2.93 |
-3.23 |
In Table 3b, we present the same information as in Table 3a, except that the states included in the averages are only those that were common across all three years of data. In these data, we see the same trend toward lower average gaps across years. Also, the percentage difference in average gaps for reading and math across grade levels is similar, though with as slightly higher percentage of change reflected. Elementary reading was highest (-5.7), followed by middle school reading (-5.1) and middle school mathematics (-4.5).
Table 3b. Gaps Between Students with Disabilities and General Education Students on Regular Assessments for Common States with Data: Comparison of Mean Gaps for SY 2005-2006 to 2007-2008
|
Number of |
Mean Gaps for Common States with Data |
Gap Changes for Common States |
|||||
|
2005-2006 |
2006-2007 |
2007-2008 |
Gap 2005-06 and 2006-07 |
Gap 2006-07 and 2007-08 |
Gap 2005-06 and 2007-08 |
||
|
Elementary Reading |
43 |
34.7 |
31.7 |
29.0 |
-3.0 |
-2.7 |
-5.7 |
|
Middle School Reading |
43 |
42.6 |
40.5 |
37.5 |
-2.1 |
-3.0 |
-5.1 |
|
High School Reading |
38 |
42.9 |
41.1 |
39.1 |
-1.8 |
-2.1 |
-3.8 |
|
Elementary Math |
42 |
29.6 |
29.3 |
26.3 |
-0.3 |
-3.0 |
-3.3 |
|
Middle School Math |
43 |
41.1 |
39.9 |
36.6 |
-1.1 |
-3.4 |
-4.5 |
|
High School Math |
38 |
39.2 |
39.1 |
36.0 |
-0.2 |
-3.1 |
-3.3 |
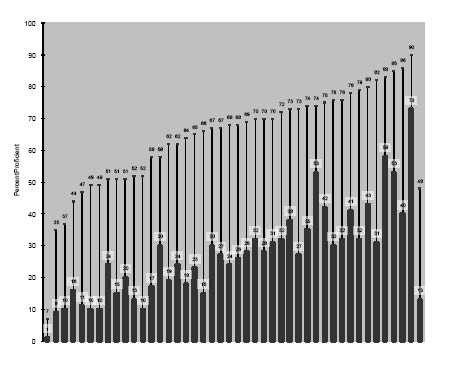
The reading performance of students, in states with publicly reported data, is graphed in Figures 12-14. Across most states, the reading performance of students with disabilities was considerably lower than the performance of general education students. The average percent proficient for elementary was generally higher than at the middle and high school levels. Figures 12-14 show data in order of increasing performance of regular education students. States names are not shown because comparisons between states are inappropriate.
At the elementary level (see Figure 12) for those states with publicly reported data for both students with disabilities and general education students, gaps ranged from 3 to 49 percent. At the middle school level (see Figure 13), gaps ranged from 14 to 50 percent. At the high school level (see Figure 14), gaps ranged from 1 to 55 percent. We caution against comparing gaps across states, but are encouraged by what might be a trend toward smaller gaps across all levels in reading.
Mathematics Performance
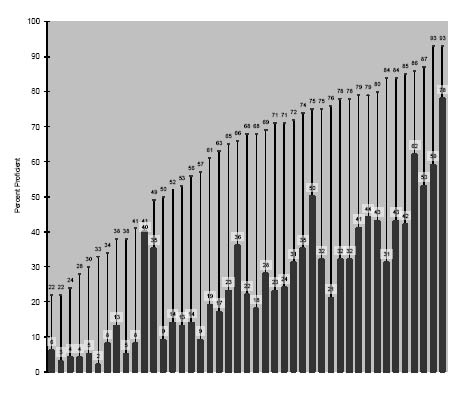
Figures 15-17 show the performance of general education students and students with disabilities on states’ 2007-2008 regular math assessments. As with reading, there are smaller gaps in math performance at the elementary grades than in middle and high school levels.
At the elementary school level, gaps in math achievement on regular assessments were smaller than for either middle school or high school. The gaps (see Figure 15) ranged from a low of 6 to a high of 41. At the middle school level (see Figure 16), gaps in achievement on regular math assessments ranged from a low of 6 to a high of 51. Gaps in math achievement on regular high school math assessments (see Figure 17) ranged from a low of 1 percentage point to a high of 55 percentage points.
Figure 12. Elementary School Reading Performance on the Regular Assessment
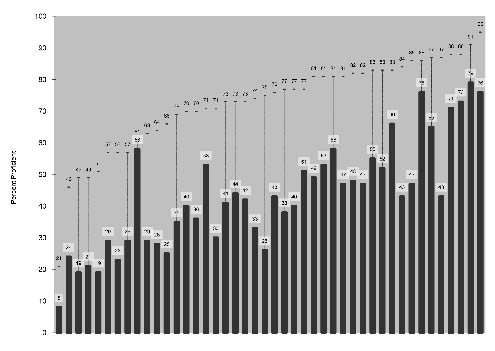
Legend:
Heavy Solid Bar = Students with disabilities percent proficient.
Dashed Line = Gap between students with disabilities and regular students. For some states our “regular students” comparison group may include students with disabilities, because states report data differently.
Figure 13. Middle School Reading Performance on the Regular Assessment
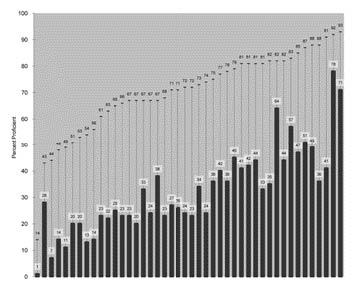
Legend:
Heavy Solid Bar = Students with disabilities percent proficient.
Dashed Line = Gap between students with disabilities and regular students. For some states our “regular students” comparison group may include students with disabilities, because states report data differently.
Figure 14. High School Reading Performance on the Regular Assessment
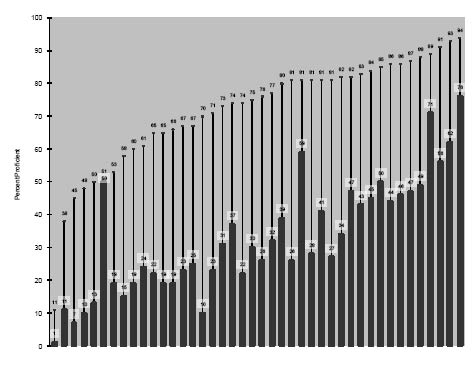
Legend:
Heavy Solid Bar = Students with disabilities percent proficient.
Dashed Line = Gap between students with disabilities and regular students. For some states our “regular students” comparison group may include students with disabilities, because states report data differently.
Figure 15. Elementary Mathematics Performance on the Regular Assessment
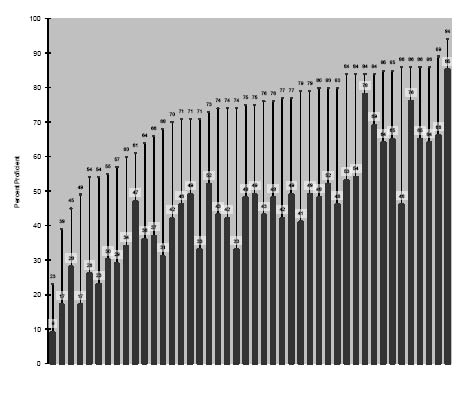
Legend:
Heavy Solid Bar = Students with disabilities percent proficient.
Dashed Line = Gap between students with disabilities and regular students. For some states our “regular students” comparison group may include students with disabilities, because states report data differently.
Figure 16. Middle School Mathematics Performance on the Regular Assessment
Legend:
Heavy Solid Bar = Students with disabilities percent proficient.
Dashed Line = Gap between students with disabilities and regular students. For some states our “regular students” comparison group may include students with disabilities, because states report data differently.
Figure 17. High School Mathematics Performance on the Regular Assessment
Legend:
Heavy Solid Bar = Students with disabilities percent proficient.
Dashed Line = Gap between students with disabilities and regular students. For some states our “regular students” comparison group may include students with disabilities, because states report data differently.
AA-AAS Performance Results
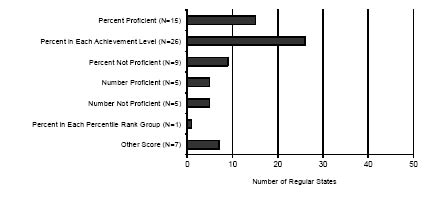
Figure 18 displays the approaches that the 50 states used to report performance data for alternate assessments based on alternate achievement standards (AA-AAS). This figure shows the same basic pattern as the reporting for regular assessments, with the most common performance reporting categories being percent in each achievement level (n=26), followed by percent proficient (n=15), and percent not proficient (n=9). In comparison, percent not proficient was the fourth most common category for regular assessment reporting because more states reported “other scores” on regular assessments than they did for AA-AAS. Only seven states reported “other scores” for AA-AAS. For more detailed information by state and assessment see Appendix I.
Figure 18. Number of States Reporting AA-AAS Performance by Various Approaches in the ESEA Accountability System in 2007-2008*
Other Information Collected for 2007-2008
Reporting for Alternate Assessments Based on Modified Achievement Standards
Of the four states with data reported for alternate assessments based on modified achievement standards (see Appendix E), all four reported the number of students tested. This is not surprising because this was the most commonly reported participation category for other assessments. Oklahoma reported number tested split by accommodated and non-accommodated status and North Dakota reported these data combining all grades. Other categories reported by California included the percent of students enrolled taking the test and the number with scores. North Carolina and Texas additionally reported the percent of students tested. Texas further reported the number or percent of students exempted and the number absent. For performance on these tests, three states reported percent in each achievement level (Louisiana, North Carolina, and Oklahoma). Two states reported percent proficient (North Carolina and Texas). One state reported number in each achievement level, and three states reported in the “other” score category (e.g., average percent correct or average scale score). Compared to other types of assessments in Figure 4, there were proportionally fewer states reporting disaggregated participation or performance for AA-MAS, at five out of seven states (71%). One state (Oklahoma) was not counted because its assessment was still in development.
Reporting on Accommodations
Nineteen states reported participation or performance data for students taking state assessments with or without accommodations. This number was up from 16 in 2006-2007. Of these 19 states, 16 reported accommodated students’ participation, performance, or both, disaggregating by grade. Four states reported participation and performance by specific type of accommodation used by students (Colorado, Georgia, North Carolina, and Texas). Three states reported participation and performance for accommodations based on levels of approval for their use: non-approved/modification (Colorado), standard and conditional accommodation (Georgia), and standard and non-standard accommodation (Michigan). One state reported accommodation use disaggregated by its assessment based on modified achievement standards (Oklahoma). Another state (Texas) reported linguistically accommodated testing (LAT) administration for students with disabilities, as well as a “bundled” set of accommodations for students with dyslexia.
Of all 19 states reporting data on accommodated administrations of a state assessment, 7 states reported participation only (either the number or percent participating) with accommodations (Connecticut, Maine, Massachusetts, Mississippi, Nebraska, North Dakota, and Tennessee). Eleven states reported both participation and performance data for accommodated students. For actual reported data for accommodated administration of assessments, see Appendix J and the summary in Table 4.
Table 4. 2007-2008 Summary of States that Reported State-Level Information about Accommodations
|
Statea |
Assessments |
Terminology used |
By content/ |
Participation |
Performance |
Population |
|
Arizona |
AIMS High School Mathematics |
Braille and Non-Braille |
Yes/Yes |
No |
Yes |
Students using Braille or not. |
|
Colorado |
CSAP, CSAPA |
With accommodations and by specific accommodation, approved and nonapproved |
Yes/ Yes |
Yes |
Yes |
All students with a documented need. |
|
Connecticut |
CMT |
With and without accommodations |
Yes/Yes |
Yes |
No |
Students with disabilities. |
|
Florida |
FCAT |
With and without accommodations |
Yes/Yes |
Yes |
No |
Students with disabilities.. |
|
Georgia |
Does not specify |
Without, standard, and conditional accommodations (and specific) |
Yes/Aggregated grades 1-8 and 11 |
Yes |
No |
Students with disabilities. |
|
Indiana |
ISTEP+ |
With and without accommodations |
Yes/Yes |
Yes |
Yes |
Students with disabilities, non-ESL, and ESL/LEP. |
|
Iowa |
ITBS/ ITED |
With and without accommodations |
Yes/Yes |
Yes |
Yes |
Students with disabilities. |
|
Kentucky |
KCCT |
With and without accommodations |
Yes/Yes |
Yes |
Yes |
Students with disabilities. |
|
Maine |
MEA |
With and without accommodations |
Yes/Yes |
Yes |
No |
Identified disability. |
|
Massachusetts |
MCAS |
Accommodated and regular test administration |
Yes/Yes |
Yes |
No |
Students with disabilities. |
|
Michigan |
MEAP and Access-Functional Independence Test |
Standard all, nonstandard all, standard ELL only and nonstandard ELL only |
Yes/Yes |
Yes |
Yes |
Access test has students with disabilities, MEAP unclear group. |
|
Mississippi |
MCT |
With and without accommodations |
Yes, Grades 3-8 together and high school level |
Yes |
No |
Students with disabilities. |
|
Nebraska |
Writing |
Students receiving accommodation |
Yes/Yes |
Yes |
No |
Students with disabilities. |
|
Statea |
Assessments |
Terminology used |
By content/ grade? |
Participation |
Performance |
Population Comments |
|
North Carolina |
EOG and EOC |
By specific accommodation |
Yes/Yes |
Yes |
Yes |
N/A |
|
North Dakota |
NDSA |
With and without accommodations |
Yes/Total in state |
Yes |
No |
Students with disabilities. |
|
Oklahoma |
OCCT and OMAAP |
With and without accommodations |
Yes/Yes |
Yes |
Yes |
Students with disabilities Note: The OAAP Portfolio facilitates all appropriate accommodations. |
|
South Dakota |
Dakota STEP |
With and without accommodations |
Yes/Yes |
Yes |
Yes |
General population (not students with disabilities only). |
|
Tennessee |
TCAP Standard |
With and without accommodations |
Yes/Yes |
Yes |
No |
Students in special education. |
|
Texas |
TAKS |
Students tested with bundled dyslexia accommodations and LAT (Linguistically Accommodated Testing). |
Yes/Yes |
Yes |
Yes |
Bundled and LAT: Total using, African American, Hispanic and white students, economically disadvantaged, limited English proficient, and special education students. |
aWisconsin noted that schools and districts have access to data in their download files on whether the WKCE was taken with test accommodations. The scores are not flagged or reported separately for students with disabilities with or without accommodations.
“Click” Analysis of Web-based Reporting
Publicly reported data are not functionally public unless provided in an easily accessible manner. To examine ease of access, we analyzed the number of clicks it takes to locate disaggregated data on students with disabilities on the Web sites of states’ departments of education (see Figures 19 and 20). This analysis is similar to previous analyses we have conducted, and presents click summary figures for all regular states with data on regular assessments and AA-AAS.
Figure 19 presents the number of clicks between Web pages required to arrive at the disaggregated data for states’ regular assessments. Figure 20 presents the same information for states’ AA-AAS. For states with a Web page that generates reports, we did not count the additional clicks needed to choose specific demographic or assessment characteristics. For those sites, we only counted the number of clicks needed to arrive at the generator site and a final “submit” click. Web page search engines were not used and “false starts” were not counted.
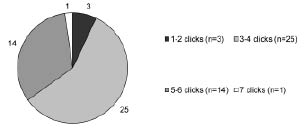
For 2007-2008, most state Web sites in the analysis required three or four clicks to access data, with 34 states for regular assessments and 25 states for AA-AAS data. Only one state required seven or more clicks for regular and AA-AAS assessments. This is similar to the results of the previous year’s analysis (2006-2007), which found 34 states with 3-4 clicks and 2 states with 7 clicks or more for regular assessments and 28 states with 3-4 clicks and 2 states with 7 clicks or more on AA-AAS. However, because Web sites change frequently, and because the number of states reporting data from year to year changes, one should not assume a clear year-to-year comparison is possible. For example, in the past two years, all but one state has reported regular assessment data. For 2007-2008, 42 states reported AA-AAS data, compared to 44 in 2006-2007.
Figure 19. Number of States in Each “Click” Category for States Reporting Regular Assessments (Total N=49)
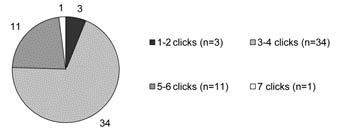
Figure 20. Number of States in Each Click Category for states Reporting AA-AAS (Total N=42)
Top of page | Table of Contents
Summary and Discussion
This report is the twelfth annual report by NCEO. From the beginning the purpose of the NCEO analysis has been to examine the availability and nature of public data reporting on students with disabilities. Although there were quite dramatic shifts over the first decade of reports, the amount of change in the nature of public reporting has slowed. To a large extent this reflects the fact that most states are reporting both participation and performance data.
For 2007-2008, 49 out of 50 regular states were counted as having publicly reported disaggregated data for students with disabilities in a manner comparable to that of general education or all students. This represented no change from 2006-2007. Overall the completeness of reporting also remained about the same for alternates based on alternate achievement standards (AA-AAS), with 36 states reporting participation and performance for AA-AAS, the same as in the previous year. Also similar to the previous year, the number of states in 2007-2008 reporting these data for tests outside ESEA accountability systems was lower than for tests within the ESEA system.
Those states reporting both participation and performance for all regular assessments inside ESEA accountability systems decreased one state from 46 in 2006-2007 to 45 in 2007-2008. States reported disaggregated participation and performance data online for 90% of all regular assessments within ESEA systems. Four states reported only performance. No state reported participation and performance for only some assessments. One state did not publicly report disaggregated data on its regular report for students with disabilities. In a positive change from the previous year, the number of unique states, including special territories, publicly reporting disaggregated participation and performance data for regular assessments increased from one state to four states.
The number of regular states publicly reporting participation and performance for AA-AAS remained the same from 2006-2007 to 2007-2008, with 36 states reporting. Although the number of states that did not publicly report AA-AAS data declined from 13 states to 7 in 2006-2007, in 2007-2008 this number increased slightly to 8 states. Other states reported partial information for either participation or performance, with four states reporting only performance and two states reporting only participation. For unique states, there was one state that reported data for AA-AAS in 2007-2008 compared to no states reporting these data in 2006-2007 and one state reporting in 2005-2006.
The most common approaches used by states to communicate participation and performance on regular assessments and AA-AAS remained the same as for the two previous years, with some variability within the less-frequently used “other” categories. Across assessments, the most common way to report participation was by number assessed (36 states for regular and 27 states for AA-AAS). The most common way of reporting performance was by the percent of students in each achievement level (39 states for regular and 26 states for AA-AAS).
For performance, the general pattern continued as in previous years: Data for reading and mathematics for students with disabilities showed lower average rates of proficiency compared to general education students. Looking at the average gaps across three years of data at each representative grade level showed that the average gap in performance has gotten smaller for both reading and mathematics from 2005-2006 to 2007-2008 for those states with data. Considering only those states that reported data in all three years, the largest differences in average gaps were found for elementary reading, middle school reading, and middle school mathematics. Although we always caution against comparing gaps across states, we are encouraged by what might be a trend toward smaller average gaps in these areas.
Accommodations reporting increased over the previous year with the number of states reporting disaggregated data for students who used accommodations on state assessments up to 19 states from 16 states in 2006-2007. This information on accommodations spanned across different state assessments including AA-AAS (n=1), norm and criterion referenced regular assessments (n=18), and alternate assessment based on modified achievement standards (AA-MAS). One state did not identify the assessments included in the data.
Recommendations for Reporting
Previous reports on public reporting of disaggregated data for students with disabilities have made several recommendations, most of which continue to hold given the results from the analysis of 2007-2008 assessment reports.
- Report participation and performance results for each assessment, content area, and grade level.
- Clearly label preliminary and final data with dates posted.
- Report participation with accommodations.
- Report participation percentages, disaggregated by grade.
- Make data accessible.
In the 2007-2008 school year, most states reported data by assessment, content area, grade level, and whether the data were preliminary data or final data. In contrast, a few states that reported assessments separately in the past now merge their regular and AA-AAS assessment performance data together. Although this merging of data makes sense for accountability purposes, it does not allow one to look at performance by test, and is inconsistent with federal requirements to report data for alternate assessments.
The number of states reporting participation percentages in general has not changed substantially, though the populations included in participation rates and what type of rate is reported (whether percent of students tested in the system or percent of students tested based on numbers enrolled in grade level) still varies across states. Over the years states have fluctuated slightly in reporting data for accommodated performance, but reporting these data remains a useful practice. Finally, the accessibility of reports remains about the same regarding the number of clicks from a state’s homepage, but ensuring that data are presented in accessible formats for a broad population of users still remains an area for improvement.
Top of page | Table of Contents
Conclusion
Although several measures of 2007-2008 reporting remain essentially unchanged from 2006-2007, a highlight for 2007-2008 is that we are seeing narrower gaps in reading performance between students with and without disabilities, across all levels. Another high point is that the increased number of unique states publicly reporting disaggregated participation and performance data for regular assessments increased from one state to four states.
Overall, the usefulness of assessment data would be greatly enhanced if all states reported by grade level. We look forward to further improvements as states continue to enhance their data acquisition, analysis, and reporting systems.
Top of page | Table of Contents
References
Albus, D., Thurlow, M., & Bremer, C. (2009). Achieving transparency in the public reporting of 2006-2007 assessment results (Technical Report 53). Minneapolis, MN: University of Minnesota, National Center on Educational Outcomes.
Klein, J. A., Wiley, H. I., & Thurlow, M. L. (2006). Uneven transparency: NCLB tests take precedence in public assessment reporting for students with disabilities (Technical Report 43). Minneapolis, MN: University of Minnesota, National Center on Educational Outcomes.
Thurlow, M. L., & Bremer, C., & Albus, D. (2008). Good news and bad news in disaggregated subgroup reporting to the public on 2005-2006 assessment results (Technical Report 52). Minneapolis, MN: University of Minnesota, National Center on Educational Outcomes.
Thurlow, M. L., & Wiley, H. I. (2004). Almost there in public reporting of assessment results for students with disabilities (Technical Report 39). Minneapolis, MN: University of Minnesota, National Center on Educational Outcomes.
Thurlow, M. L., Wiley, H. I., & Bielinski, J. (2003). Going public: What 2000-2001 reports tell us about the performance of students with disabilities (Technical Report 35). Minneapolis, MN: University of Minnesota, National Center on Educational Outcomes.
VanGetson, G. R., & Thurlow, M. L. (2007). Nearing the target in disaggregated subgroup reporting to the public on 2004-2005 assessment results (Technical Report 46). Minneapolis, MN: University of Minnesota, National Center on Educational Outcomes.
Wiley, H. I., Thurlow, M. L., & Klein, J. A. (2005). Steady progress: State public reporting practices for students with disabilities after the first year of NCLB (2002-2003) (Technical Report 40). Minneapolis, MN: University of Minnesota, National Center on Educational Outcomes.
To review the appendices, please refer to the PDF version of this report.