Federal legislation has spurred states to include all students in statewide assessment, and there has been much improvement during the past decade. For increased numbers of students with disabilities, access to the test relies on the provision of assessment accommodations. As the use of accommodations has increased, there has been a concomitant need to attend to the implementation of accommodations and the validity of results when accommodations are used. In these, states look to educational research for answers about which accommodations have proven successful in increasing the validity of results for students with disabilities. Often this means looking for increased scores for students with disabilities, along with evidence that the constructs measured or the validity of inferences that can be drawn from results are not changed.
To synthesize research efforts, NCEO has provided reports on accommodations research completed over time. The time periods included 1999-2001 (Thompson, Blount, & Thurlow, 2002), 2002-2004 (Johnstone, Altman, Thurlow, & Thompson, 2006), and 2005-2006 (Zenisky & Sireci, 2007).
The purpose of this document is to provide a synthesis of the research on test accommodations published in 2007 and 2008. The research described here encompasses empirical studies of score comparability and validity studies as well as investigations into accommodations use and perceptions of their effectiveness. Taken together, the current research casts a wide net in exploring a variety of the issues surrounding test accommodations practices, with a number of efforts made on key accommodations. Insofar as reporting on the findings of current research studies is a primary goal of this analysis, a second goal is to also identify areas requiring continued investigation in the future.
Review Process
Similar to the process used in the past accommodations research syntheses (Johnstone et al., 2006; Thompson, Blount, & Thurlow, 2002; Zenisky et al., 2007), a number of sources were used to complete the review of the accommodations research published in 2007 and 2008. Specifically, seven research databases were consulted, including Educational Resources Information Center (ERIC), PsychInfo, Academic Search Premier, Digital Dissertations, Education Complete, and Educational Abstracts. In addition, two Web search engines also were used—Google and Google Scholar).
Several other resources for research articles that were also searched for relevant publications were the archives of Behavioral Research and Teaching (BRT) at the University of Oregon (http://brt.uoregon.edu/), the Educational Policy Analysis Archives (EPAA; http://epaa.asu.edu), the National Center for Research on Evaluation, Standards, and Student Testing (CRESST; http://www.cse.ucla.edu/), the Wisconsin Center for Educational Research (WCER; http://www.wcer .wisc.edu/testacc), and the Center for the Study of Assessment Validity and Evaluation (C-SAVE; http://www.c-save.umd.edu/index.html).
The initial search was completed in November, 2008. A second search was completed in April, 2009 to ensure that all articles published in 2008 were found and included in this review. Within each of these research databases and publications archives, a sequence of search terms was used. Terms searched for this review were:
- accommodation(s)
- test and assess (also tests, testing, assessing, assessment) accommodation(s)
- test and assess (also tests, testing, assessing, assessment) changes
- test and assess (also tests, testing, assessing, assessment) modification(s)
- test and assess (also tests, testing, assessing, assessment) adaptation (adapt, adapting)
- student(s) with disability (disabilities) test and assess (also tests, testing, assessing,
assessment)
- standards-based testing accommodations
- large-scale testing accommodations
The research documents from these searches were then considered for inclusion in this review with respect to several criteria. First, the decision was made to focus only on research published or defended in doctoral dissertations in 2007 and 2008. Second, the scope of the research was limited to investigations of accommodations for regular assessment (hence, articles specific to alternate assessments, accommodations for instruction or learning, and universal design in general were not part of this review). Third, research involving English language learners (ELLs) only was included if the target population was ELLs with disabilities. Finally, it should also be noted that presentations from professional conferences were not searched or included in this review, based on the researchers’ criteria to only include research that would be accessible to readers and that had gone through the level of peer review typically required for publication in professional journals or through a doctoral committee review.
Top of page | Table of Contents
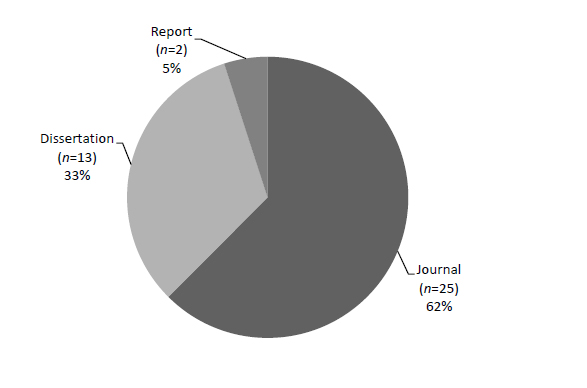
The results of the review process showed a total of 40 studies were published from January 2007 through December 2008. As shown in Figure 1, of these 40 studies, 25 were journal articles, 13 were dissertations, and 2 were published professional reports released by research organizations (e.g., CRESST, Behavior Research and Training).
Accommodations research takes a variety of approaches. They range from a large-scale approach that might examine aggregated accommodations data to an approach that involves testing an individual accommodation for a specific disability category. This range of approaches is reflected in research questions that focus on areas such as: the use or implementation of accommodations; the perception of accommodations by educational professionals, students, and parents; and the effects of accommodations on test scores.
Figure 1. Percentage of Accommodations Studies by Publication Type
To reflect the wide range of accommodations research that was conducted in 2007 and 2008, the studies are summarized and compared in the following ways: (a) purposes of research; (b) research type and data collection source; (c) assessment or data collection focus; (d) characteristics of the independent and dependent variables under study; (e) comparability of findings between studies in similar domains; and (f) limitations and directions of future research. The information provided in each of these categories should provide insight into the current state of accommodations research in education and highlight trends in current accommodations research.
Purposes of the Research
A number of purposes were identified in the accommodations research published in 2007 and 2008 (see Table 1). The most common purpose during this period was to demonstrate the effect of accommodations on test scores. This included studies that attempted to demonstrate that accommodations provided students with disabilities with a differential boost (Fuchs, & Fuchs, 2001; Zenisky, et al. 2007) to their scores not by making the test easier, but by facilitating their access to the content through the use of accommodations. Differential boost theory suggests that students needing accommodations will gain more from their use than students who do not need them. There was a wide range in the educational level included in the research, accommodation type, and content areas for studies of similar purposes.
Table 1. Purposes of Reviewed Research
|
Purpose
|
Number of Studies
|
|
Study effect of accommodations on scores
|
13
|
|
Compare scores between standard/non-standard groups
|
11
|
|
Report on implementation
|
8
|
|
Study/compare perceptions of accommodation use
|
5
|
|
Meta-analysis on test accommodations
|
1
|
|
Identify predictors of the need for test accommodations
|
1
|
|
Investigate test validity
|
1
|
|
Total
|
40
|
A full listing of the studies with statements of purposes, organized by purpose category, is provided in Appendix A. As shown in Table 1, the most commonly identified purpose in recent accommodations research is determining the effect of accommodations on scores or comparing scores between students with and without accommodations, or between students with and without disabilities. These types of studies account for 60% of the research conducted in this area. Research on the implementation of accommodations and perceptions of accommodations use from teachers and students is also fairly common.
Research Type and Data Collection Source
Just over half of the accommodations research reviewed here used a descriptive quantitative research design to gather data on the research purposes. As seen in Table 2, quasi-experimental and descriptive qualitative research increased in 2008 compared to 2007, while descriptive quantitative methods decreased slightly. Furthermore, there appeared to be balance between data collection methods, with about the same number of studies using primary and secondary sources each year. Primary data sources included actual data collection procedures that researchers undertook to obtain their data. Secondary data collection included the use of archival or extant data.
Table 2. Research Type and Data Collection Source by Year
|
Research Design
|
Data Collection Sourcea
|
Research Type Totals
|
|
Primary
|
Secondary
|
|
2007
|
2008
|
2007
|
2008
|
|
Quasi-experimental
|
2
|
5
|
1
|
2
|
10
|
|
Descriptive quantitative
|
6
|
4
|
7
|
5
|
22
|
|
Descriptive qualitative
|
1
|
4
|
0
|
1
|
6
|
|
Correlation/prediction
|
0
|
0
|
0
|
2
|
2
|
|
Year Totals
|
9
|
13
|
8
|
10
|
40
|
|
Source Totals Across Years
|
22
|
18
|
40
|
a Primary data source involved data collection by researcher. Secondary data source included the use of archival or extant data.
Assessment/Data Collection Focus
The data obtained through either primary or secondary data collection procedures came from a number of sources, as seen in Figure 2. The majority of the research on accommodations included in this synthesis for 2007-2009 focused on data acquired through testing. There were also a number of studies that used surveys to gather data; interviews and focus groups were used minimally.
Figure 2. Data Collection Methods Used in 2007-2008 Research
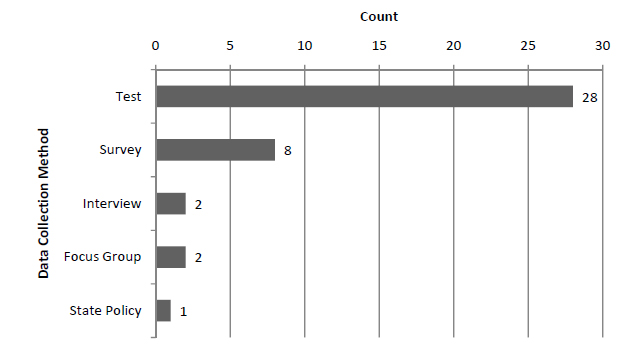
Note: One of the 40 studies contained more than one category of data collection method.
When data collection or assessment instruments were used in research, a number of approaches were used. As shown in Table 3, researchers: (a) developed their own non-test protocols, (b) used norm-referenced academic achievement measures, (c) used researcher or professionally developed tests; (d) used state criterion-referenced assessments, or (e) used norm-referenced cognitive ability measures. In general, researchers tended to use either researcher-developed non-test protocols or norm-referenced academic achievement measures. A complete listing of the instruments used in each of the studies is provided in Appendix C.
Table 3. Assessment/Data Collection Instruments
|
Instrument Type
|
Counta
|
|
Researcher-developed non-test protocols
|
18
|
|
Norm-referenced academic achievement measures
|
13
|
|
Researcher or professionally developed tests
|
9
|
|
State criterion-referenced assessment
|
9
|
|
Norm-referenced cognitive ability measures
|
3
|
|
Total
|
52
|
a Eight of the studies used more than one data collection tool, with the number ranging from 2 to 4.
Content Area Assessed
A number of studies conducted during 2007-2008 focused on accommodations used in certain academic content areas. As shown in Table 4, math and reading were the two most commonly assessed content areas. Table 4 also provides a comparison to content areas in NCEO’s previous report on accommodations (Zenisky & Sireci, 2007). In general, the emphasis on reading and math is consistent across reviews. A change in the emphasis on “other language arts” and an increase in reading studies is apparent across years. Only one study did not specify its content area for 2007-2008, whereas seven did not do so in 2005-2006.
Number of Research Participants
Table 5 shows information on the size and composition of the samples used in the research on accommodations during 2007 and 2008; this information is provided in more detail in Appendix D. A good portion of the research studies included sample sizes with more than 300 participants (n = 18). Samples included both students with and without disabilities (students with disabilities = 0%-24%) or focused specifically on students with disabilities (75%-100%). Research with small sample sizes (N < 100) tended to have a high percentage of students with disabilities included (75%-100% students with disabilities). Four studies not investigating differences between students with disabilities and students without disabilities did not report disability information; these all consisted of large sample sizes (N > 300).
Table 4. Academic Content Areas Involved
|
Content Areas Assessed
|
2005-2006a
|
2007-2008b
|
|
Mathematics
|
17
|
15
|
|
Reading
|
14
|
18
|
|
Writing
|
4
|
4
|
|
Other Language Artsc
|
9
|
4
|
|
Science
|
1
|
3
|
|
Social Studies
|
1
|
1
|
|
Civics/US History
|
1
|
0
|
|
Psychology
|
1
|
1
|
|
Not Specific
|
7
|
1
|
a 14 studies in 2005-2006 included examinations of more than one content area, with the number ranging from 2 to 6.
b 10 studies in 2007-2008 included examinations of more than one content area, with the number ranging from 2 to 4.
c Other Language Arts assessment areas include English Language Proficiency, Literature, Writing, and General Language Skills.
Table 5. Sample Sizes in Studies of Varying Numbers of Research Participants
|
Total Number of Research Participants
|
Percent of Sample Consisting of Individuals with Disabilities
|
|
0-24%
|
25-49%
|
50-74%
|
75-100%
|
Not reported
|
Not applicablea
|
Total
|
|
1-10
|
-
|
-
|
-
|
2
|
-
|
-
|
2
|
|
11-100
|
-
|
-
|
2
|
4
|
-
|
3
|
9
|
|
101-300
|
2
|
1
|
1
|
2
|
-
|
3
|
9
|
|
More than 300
|
6
|
1
|
2
|
3
|
4
|
2
|
18
|
|
Not applicable*
|
-
|
-
|
-
|
-
|
-
|
2
|
2
|
|
Total
|
8
|
2
|
5
|
11
|
4
|
10
|
40
|
*These studies included either (a) literature reviews of multiple studies where samples varied widely across the multiple studies, or (b) research studies that did not include students directly as the unit of analysis (e.g., they reported data from parents or teachers or aggregated results at the school or state level). School Level
Research on accommodations during 2007 and 2008 involved participants who were K-12 students. Specifically, as seen in Table 6, five studies involved only elementary school students, five involved only middle school students, and three involved only high school students. A large proportion of K-12 studies involved samples across multiple educational levels; most of these included large sample sizes and secondary data sources. Although not more common than K-12 studies, there were a noteworthy number of studies that examined accommodations use and implementation at the post-secondary level. Ten studies did not use students in the research sample.
Table 6. Grade Level of Research Participants
|
Education Level of Participants in Studies
|
Number of Studies
|
|
Elementary school (K-5)
|
5
|
|
Middle school (6-8)
|
5
|
|
High school (9-12)
|
3
|
|
Postsecondary
|
6
|
|
Multiple grade levels
|
11
|
|
Not applicable
|
10
|
Disability Categories
A broad range of disability categories were included in samples in the 2007-2008 research (see Appendix E for details). As shown in Table 7, nine studies did not specify disability categories included, and 10 studies did not include students in the sample. Of the remaining 21 studies, the most commonly studied disability category was learning disabilities (n = 15). Students with hearing or visual impairments, or multiple disabilities were included in five of the 30 pieces of research that included a student sample and specified information about specific disabilities. Students with speech/language disabilities, emotional behavior disabilities, and attention problems were included in the sample of at least three studies.
Table 7. Disabilities Reported in Research Participants
|
Disabilities Observed in Research Participants
|
Number of Studiesa
|
|
Learning disabilities
|
15
|
|
Hearing or visual impairment
|
5
|
|
Multiple disabilitiesb
|
5
|
|
Speech/Language
|
4
|
|
Emotional behavioral disability
|
4
|
|
Attention problem
|
3
|
|
Mental retardation
|
2
|
|
Not reported/unspecified
|
9
|
|
Not applicable
|
10
|
a Some studies were included in multiple categories, if applicable. Specifically, 7 studies had multiple disability categories listed, with a range from 3 to 13 categories in a study.
b
The category “Multiple Disabilities” indicates that the students were in the category of multiple disabilities, not that multiple individual disabilities were in the study.
Types of Accommodations
The number of times specific categories of accommodations were included in 2007-2008 research is summarized in Table 8. Presentation accommodations were the most commonly studied (n = 25), and within this category the most common accommodations were read aloud (n = 9) and computer administration (n = 6). Within the next most frequent category studied in 2007-2008, timing/scheduling, extended time (n = 10) was the most frequent. A complete listing of the accommodations research is in Appendix E.
Table 8. Accommodations in Reviewed Research
|
Accommodation Category
|
Number of Studies
|
|
Presentation
|
25
|
|
Equipment/Materials
|
7
|
|
Response
|
3
|
|
Timing/Scheduling
|
14
|
|
Setting
|
3
|
|
Othera
|
8
|
a
The “Other” category includes research on accommodations not included in typical policies or research that did not specify the accommodations studied.
Research Findings
The findings of the accommodations research from 2007-2008 are summarized in Tables 9-11. They also are presented in greater detail in Appendix F. Research on the most commonly studied accommodations is presented in Table 9. The read aloud accommodation exemplifies the mixed results evident in many of the accommodations studies. Two studies found that scores on tests were higher with the use of this accommodation. Three studies indicated that the accommodation provided a differential boost to students with disabilities. One study found that differential boost applied to students without disabilities rather than those with disabilities. An additional study found that the read aloud accommodation made the test easier (i.e., changed the difficulty level). Another study found that the read aloud accommodation did not increase test scores as there was no significant difference in student performance between scores of students who used the read aloud accommodation and those who participated in the assessment without the accommodation.
Computer-based testing studies were the most consistent in their results in the 2007-2008 research. Six studies during the two year period investigated the comparability of scores from computer-based and paper-pencil formats. Five of them found that scores were comparable. One found that scores were not comparable, with the computer-based format more difficult.
Extended time is another accommodation for which there is a body of work during 2007 and 2008. In the past, this accommodation generally has shown a differential boost to students with disabilities compared to students without disabilities (Johnstone et al., 2006; Zenisky et al., 2007). Studies during 2007-2008 did not necessarily support this finding, with two studies not supporting the differential boost hypothesis. Other studies found that item completion takes more time for students using magnification and for students with disabilities writing expository essays. One study found that scores were comparable for extended time and no extended time tests. Another study found that test anxiety had a negative effect on scores for tests that were timed.
Aggregated accommodations were examined in five studies. Two of these studies found that accommodations had mixed effects on the performance of students with disabilities. Others found that accommodated and non-accommodated test forms were not comparable, and that accommodations did not level the playing field on college entrance exams. Finally one study found that accommodations had a positive effect on scores and provided a differential boost to scores of student with disabilities.
Table 9. Summary of Research Findings for Most Commonly Studied Accommodations
|
Accommodation Studied
|
Finding
|
Number of Studies
|
|
Read aloud
|
Read aloud provides differential boost
|
3
|
|
Read aloud increases test performance
|
2
|
|
Read aloud makes items easier, or provides boost to those without disabilities
|
2
|
|
Read aloud does not increase test performance
|
1
|
|
Computer
|
Scores comparable
|
5
|
|
Scores not comparable
|
1
|
|
Extended Time
|
Results did not support differential boost hypothesis
|
2
|
|
Magnification increases time needed to finish items
|
1
|
|
Students with disabilities use extra time writing expository essays
|
1
|
|
Scores comparable
|
1
|
|
Scores predicted by test anxiety in timed conditions
|
1
|
|
Aggregated
|
Accommodations had mixed effects on performance of students with disabilities
|
2
|
|
Accommodations had a positive effect on scores for students with disabilities only
|
1
|
|
Performance not comparable between students with disabilities and without disabilities
|
1
|
|
Accommodations not serving to level the playing field on college entrance exam
|
1
|
|
Segmented Text
|
Segmented text did not positively affect test scores
|
1
|
|
Scores on computer-based tests taken without segmented text were lower than those with segmented text
|
1
|
Studies on the implementation of accommodations are shown in Table 10. These studies also show mixed results. These studies show that, in general, accommodations are used frequently in assessment, though their frequency and reasons for use are variable. One study identified the need for a decision-making model to aid practitioners in standardizing their practices.
Table 11 shows the results of research on perceptions about accommodations. In some studies, teachers and other professionals reported confidence in their knowledge and ability to appropriately use and implement accommodations. In other studies, researchers indicated a need for improvement in training to strengthen knowledge in this area.
Table 10. Summary of Research Findings on the Implementation of Accommodations
|
Study Findings
|
Number of Studies
|
|
States are beginning to form written accommodations policy for students with disabilities taking ELP exams
|
1
|
|
The provision of accommodations varies depending on context
|
1
|
|
Accommodations use increased over time, as did match with those used during instruction
|
1
|
|
Variability in student and teacher recollection of accommodations provided
|
1
|
|
Students use accommodations in combination in an effort to level playing field
|
1
|
|
Inconsistency between accommodations prescribed by IEPs and teacher’s recommendations
|
1
|
|
Students in medical school do not typically request or receive accommodations for assessment
|
1
|
|
A decision-making model would be appropriate
|
1
|
Table 11. Summary of Research Findings on Perceptions about Accommodations
|
Study Findings
|
Number of Studies
|
|
Perceptions related to assistive technology vary
|
1
|
|
Educators confident in accommodations knowledge
|
1
|
|
Interpretation of accommodations definitions vary
|
1
|
|
Accommodations perceived as valid and easy to use
|
1
|
|
Accommodations perceived as underused
|
1
|
Limitations and Future Research
As is often the case in research, many of the studies reviewed discussed limitations in order to provide context for the results that were observed (n = 38). As seen in Table 12, limitations were summarized under four broad categories. A study was counted for a given category as long as it provided at least one limitation under that category. A more comprehensive description of limitations for each individual study is available in Appendix G.
In general, more studies recognized sample characteristics as a limitation to the research. Specifically, common limitations were sample size and the representativeness of the samples obtained on variables such as age, grade level, and race. Another common limitation was methodology where frequently the use of non-experimental research designs and non-random sampling of participants were referenced. More detailed information regarding specific limitations of each study is also available in Appendix G-1.
Table 12. Categorized Limitations Identified by Authors
|
Limitation category
|
Number of Studiesa
|
|
Sample characteristics
|
19
|
|
Methodology
|
14
|
|
Test/testing context
|
12
|
|
Results
|
8
|
|
No limitations listed
|
2
|
aTen studies included more than one
category of limitations, represented in 2 or 3 limitations
categories.
As would be expected, sample characteristics and methodology context were also often highlighted as areas that needed to be addressed in future research—as seen in Table 13. However, we found that researchers recognized more instances where the results of the study led to implications for future research than was the case when identifying limitations (Table 12). More detailed information regarding suggestions for future research is also available in Appendix G-2.
Table 13. Categorized Areas of Future Research Identified by Authors
|
Future Research
|
Number of Studiesa
|
|
Methodology
|
16
|
|
Results
|
13
|
|
Sample characteristics
|
12
|
|
Test/Test context
|
9
|
|
No future directions Llisted
|
1
|
aNine studies listed directions for future research that fit into multiple categories.
Top of page | Table of Contents
The present synthesis of accommodations research produced several findings that were not entirely unexpected. First, given the national focus on the large-scale assessment of core content areas—mathematics and reading—in recent years, it is not surprising to see that these content areas were by far the most studied. It also appeared that research studies are becoming more specific in the content areas that are being covered. This is consistent with the trend in state efforts to differentiate between content areas in state assessment participation and accommodations guidelines (Christensen, Lazarus, Crone, & Thurlow, 2008). Also, students with learning disabilities (LD) were most likely to be included in research samples, which is likely as LD is the most prevalent disability category. In addition, most of these students use accommodations to access the regular assessment.
When looking at the findings for a specific accommodation, results were often mixed. This is consistent with findings from previous syntheses of accommodations research that used the same methodology (Johnstone et al., 2006; Thompson, Blount, & Thurlow, 2002; Zenisky et al., 2007). One accommodation that began to show consistent findings across studies was computer based assessments. These were found to be equivalent to paper-and-pencil formats of tests by five studies. Still, this test change is quickly losing its status as an accommodation and becoming a primary or secondary testing platform for all students regardless of disability status. Another finding was a decrease in studies investigating the extended time accommodation. Although this accommodation was studied frequently in the past, it has lost its place as an accommodation in many states because of a move to untimed tests.
The testing of educational achievement in the United States will likely continue in the years to come. It also is likely that there will be a continued need for accommodations research to inform the use of accommodations for the assessment of students with disabilities.
This report can be used as a snapshot of current purposes of research, research type and data collection source, assessment or data collection focus, characteristics of the independent and dependent variables under study, comparability of findings between studies in similar domains, and limitations and directions of future research. It becomes evident that although there are certain accommodations that will continue to be explored, there also will be the opportunity for the development of new avenues to providing equal access to all students, such as Universal Design for Assessment (Dolan, Hall, Banerjee, Chun, & Strangman, 2005; Johnstone, Altman, & Thurlow, 2006; Ketterlin-Geller, 2008) adaptive testing (Frey & Seitz, 2009; Lee, Ip, & Fuh, 2008), and the use of technology in assessment.
As many states initiate computer-based assessments, individual tracking of scores across years, and adaptive testing, new issues related to access and the validity of inferences will emerge. This continued evolution will likely occur on many levels in response to changes in educational policy, educational needs, and population characteristics—which will in turn bring about new challenges to those conducting research on accommodations.
Top of page | Table of Contents
References
Report References
Dolan, R. P., Hall, T. E., Banerjee, M., Chun, E., & Strangman, N. (2005). Applying principles of universal design to test delivery: The effect of computer-based read-aloud on test performance of high school students with learning disabilities.
Journal of Technology, Learning, and Assessment, 3(7).
Frey, A., & Seitz, N. N. (2009). Multidimensional adaptive testing in educational and psychological measurement: current state and future challenges.
Studies in Educational Evaluation, 35(2, 3), 89-94.
Fuchs, L. S., & Fuchs, D. (2001). Helping teachers formulate sound test accommodation decisions for students with learning disabilities.
Learning Disabilities Research & Practice, 16, 174-181.
Johnstone, C. J., Altman, J., & Thurlow, M. (2006).
A state guide to the development of universally designed assessments. Minneapolis, MN: University of Minnesota, National Center on Educational Outcomes.
Johnstone, C. J., Altman, J., Thurlow, M. L., & Thompson, S. J. (2006).
A summary of research on the effects of test accommodations: 2002 through 2004 (Technical Report 45). Minneapolis, MN: University of Minnesota, National Center on Educational Outcomes.
Ketterlin-Geller, L. R. (2008).Testing students with special needs: A model for understanding the interaction between assessment and student characteristics in a universally designed environment.
Educational Measurement: Issues and Practice, 27(3), 3-16.
Lazarus, S. S., Cormier, D. C., & Thurlow, M. L. (in press). States’ accommodations policies and development of alternate assessments based on modified achievement standards (AA-MAS): A discriminant analysis.
Remedial and Special Education.
Lee, Y. H., Ip, E. H., & Fuh, C. D. (2008). A strategy for controlling item exposure in multidimensional computerized adaptive testing,
Educational and Psychological Measurement, 68, 215–232.
Thompson, S., Blount, A., & Thurlow, M. (2002).
A summary of research on the effects of test accommodations: 1999 through 2001 (Technical Report 34). Minneapolis, MN: University of Minnesota, National Center on Educational Outcomes.
U.S. Department of Education (2002, January 8). The No Child Left Behind Act of 2001. Elementary and Secondary Education Act of 1965. 20 U.S.C. 6301 et seq. Retrieved from http://www.ed.gov/policy/elsec/leg/esea02/107-110.pdf
Zenisky, A. L., & Sireci, S. G. (2007). A summary of the research on the effects of test accommodations: 2005-2006 (Technical Report 47). Minneapolis, MN: University of Minnesota, National Center on Educational Outcomes.
2007 and 2008 Accommodation References
Abedi, J., Kao, J. C., Leon, S., Sullivan, L., Herman, J. L., Pope, R., Nambiar, V., & Mastergeorge, A.M. (2008). Exploring factors that affect the accessibility of reading comprehension assessments for students with disabilities: A study of segmented text (CRESST Report 746). Los Angeles, CA: University of California, National Center for Research on Evaluation, Standards, and Student Testing.
Albus, D., & Thurlow, M. L. (2008). Accommodating students with disabilities on state English language proficiency assessments.
Assessment for Effective Intervention, 33, 156.
Atchison, B. T. (2008). Assistive technology as an accommodation on accountability assessments: An analysis of attitudes and knowledge of special education professionals.
Dissertation Abstracts International.
Bennett, R. E., Braswell, J., Oranje, A., Sandene, B., Kaplan, B., & Yan, F. (2008). Does it matter if I take my mathematics test on computer? A second empirical study of mode effects in NAEP.
The Journal of Technology, Learning, and Assessment, 6, 4-35.
Bolt, S. E., & Thurlow, M. L. (2007). Item-level effects of the read-aloud accommodation for students with reading disabilities.
Assessment for Effective Intervention, 33, 15-28.
Bolt, S. E., & Ysseldyke, J. (2008). Accommodating students with disabilities in large-scale testing: A comparison of differential item functioning (DIF) identified across disability types.
Journal of Psychoeducational Assessment, 26, 121-138.
Bottsford-Miller, N. A. (2008). A cross-sectional study of reported inconsistency in accommodation use in the classroom and standardized test setting for elementary and middle school students with disabilities.
Dissertations Abstracts International, University of Minnesota.
Brown, D. W. (2007). The role of reading in science: Validating graphics in large-scale science assessment. Unpublished Dissertation.
Brown, W. M. (2007). Virginia teachers’ perceptions and knowledge of test accommodations for students with disabilities. Dissertations
International, The College of William and Mary.
Byrnes, M. (2008). Educators’ Interpretations of Ambiguous Accommodations.
Remedial and Special Education. doi:10.1177/0741932507313017
Cawthon, S. W. (2008). Accommodations use for statewide standardized assessments: Prevalence and recommendations for students who are deaf or hard of hearing.
Journal of Deaf Studies and Deaf Education Advance Access, 13, 55-96.
DiRosa, F. (2007). The impact of testing accommodations on individual postsecondary student test outcomes.
Dissertations International, Temple University.
Elbaum, B. (2007). Effects of an oral testing accommodation on the mathematics performance of secondary students with and without learning disabilities.
The Journal of Special Education, 40, 218-229.
Enriquez, M. (2008). Examining the effects of linguistic accommodations on the Colorado student assessment program—mathematics.
Dissertation Abstracts International.
Finizio, II, N. J. (2008). The relationship between instructional and assessment accommodations on student IEPs in a single urban school district.
Dissertations International, University of Massachusetts-Boston.
Gregg, N., Coleman, C., Davis, M., & Chalk, J. C. (2007). Timed essay writing: Implications for high-stakes tests.
Journal of Learning Disabilities, 40, 306 -318.
Hadjikakou, K., & Hartas, D. (2008). Higher education provision for students with disabilities in Cyprus.
Higher Education, 55, 103-119.
Harris, L. W. (2008). Comparison of student performance between teacher read and CD-ROM devilered modes of test administration of English language arts tests.
Dissertation Abstracts International.
Jerome, M. K. (2007). The state of accommodations for 5th grade students with disabilities on the Virginia SOL reading, writing, and math tests.
Dissertation Abstracts International.
Kamei-Hannan, C. (2008). Examining the accessibility of a computerized adapted test using assistive technology.
Journal of Visual Impairment & Blindness, 102, 261-271.
Keng L., McClarty K. L., & Davis L. L. (2008). Item-level comparative analysis of online and paper administrations of the Texas Assessment of Knowledge and Skills.
Applied Measurement in Education, 21(3), 207-226.
Ketterlin-Geller, L. R., Alonzo, J., Braun-Monegan, J., & Tindal, G. (2007). Recommendations for Accommodations Implications of (In)consistency.
Remedial and Special Education, 28, 194-206.
Ketterlin-Geller, L. R., Yovanoff, P., & Tindal, G. (2007). Developing a new paradigm for conducting research on accommodations in mathematics testing.
Exceptional Children, 73, 331-347.
Kim, D. H., & Huynh, H. (2008). Computer-based and paper-and-pencil administration mode effects on a statewide end-of-course English test.
Educational and Psychological Measurement, 68, 554 -570.
Lang, S. C., Elliott, S. N., Bolt, D. M., & Kratchowill, T. R. (2008). The effects of testing accommodations on student’s performances and reactions to testing.
School Psychology Quarterly, 23, 107-124.
Lee, K. S., Osborne, R. E., Hayes, K. A., & Simoes, R. A. (2008). The effects of pacing on the academic testing performance of college students with ADHD: A mixed methods study.
Journal of Educational Computing Research, 39, 123-141.
Lewandowski, L. J., Lovett, B. J., & Rogers, C. L. (2008). Extended time as a testing accommodation for students with reading disabilities: Does a rising tide lift all ships?
Journal of Psychoeducational Assessment, 26, 315-324.
Lewandowski, L. J., Lovett, B. J., Parolin, R., Gordon, M., & Codding, R. S. (2007). Extended time accommodations and the mathematics performance of students with and without ADHD.
Journal of Psychoeducational Assessment, 25, 17-28.
Lindstrom, J. H., & Gregg, N. (2007). The role of extended time on the SAT for students with learning disabilities and/or attention-deficit/hyperactivity disorder.
Learning Disabilities Research and Practice, 22, 85-95.
Lovett, B. J. (2008). Determinants of postsecondary students’ performance on timed examinations: Implications for extended time testing accommodations.
Dissertations International, Syracuse University.
Middleton, K. V. (2007). The effect of a read-aloud accommodation on items on a reading comprehension test for students with reading-based learning disabilities.
Dissertations International, University of Iowa.
Puhan, G., Boughton, K., & Kim, S. (2007). Examining Differences in Examinee Performance in Paper and Pencil and Computerized Testing. The Journal of Technology,
Learning, and Assessment, 6(3), 1-21.
Sack, W., Gale, J., Gulati, S., Gunther, M., Nesheim, R., Stoddard, F., & St. John, R. (2008). Twenty-one students enrolled in a mid-sized public university in the southwestern United States who were registered with the Office of Disabilities with a diagnosis of ADHD participated in the study.
Journal of Postsecondary Education and Disability, 20, 92-99.
Sharoni, V., & Vogel, G. (2007). Entrance test accommodations, admission and enrollment of students with learning disabilities in teacher training colleges in Israel.
Assessment & Evaluation in Higher Education, 32, 255-270.
Temple, C. (2007). The effects of interactive read-alouds on the reading achievement of middle grade reading students in a core remedial program.
Dissertations International, Florida Atlantic University.
Tindal, G., Lee, D., & Ketterlin-Geller, L. (2008). The reliability of teacher decision-making in recommending accommodations for large-scale tests.
Behavior Research and Training Technical Report #08-01.
Wang, S., Jiao, H., Young, M. J., Brooks, T., & Olson, J. (2007). A meta-analysis of testing mode effects in grade K-12 mathematics tests.
Educational and Psychological Measurement, 67, 219-238.
Wolf, J. (2007). The effects of testing accommodations usage on students’ standardized test scores for deaf and hard-of-hearing students in Arizona public schools.
Dissertations International, University of Arizona.
Woods, K. (2007). Access to general certificate of secondary education (GCSE) examinations for students with special education needs: What is “best practice”?
British Journal of Special Education, 34, 89-95.
Top of page | Table of Contents
Research Purposes
Table A-1. Purpose Category: Compare Scores from Standard/Nonstandard Administration Condition
|
Author(s)
|
Stated Research Purpose
|
|
Bennett et al. (2008)
|
Investigate the comparability of scores from paper- and computer-based tests.
|
|
Bolt & Thurlow (2007)
|
Examine data on accommodated and non-accommodated performances of students using the read aloud accommodation.
|
|
Bolt & Ysseldyke (2008)
|
Evaluate measurement comparability for two groups of accommodated students with disabilities (i.e., accommodated students with physical disabilities and accommodated students with mental disabilities) using differential item functioning (DIF) analysis and systematically compare a reference group of non-accommodated students without disabilities.
|
|
Elbaum (2007)
|
Compare the performance of students with and without learning disabilities (LD) on a mathematics test using a standard administration procedure and a read aloud accommodation.
|
|
Harris (2008)
|
Evaluate two administration modes were compared in terms of test factorial structure and student performance: 1) read-aloud administration delivered by a teacher following an oral script, 2) computer deliver of the oral script by CD-ROM.
|
|
Keng et al. (2008)
|
Describe a comparative study conducted at the item level for paper and online administrations of a statewide high stakes assessment.
|
|
Ketterlin-Geller, Yovanoff et al. (2007)
|
Investigate the effects of item characteristics on lower and higher readers’ differential benefit for two reading-based accommodations, read aloud and simplified language.
|
|
Kim & Huynh (2008)
|
Compare student performance between paper-and-pencil testing (PPT) and computer-based testing (CBT).
|
|
Kim & Huynh (2007)
|
Examine the comparability of student scores obtained from computerized and paper-and-pencil formats.
|
|
Lee et al. (2008)
|
Explore the relationship between computer-paced and student-paced item presentation on the academic test performance in college students diagnosed with ADHD.
|
|
Puhan et al. (2007)
|
Evaluate the comparability of two versions of a certification test: a paper-and-pencil test (PPT) and computer-based test (CBT).
|
Table A-2. Purpose Category: Investigate the Effect on Scores from Accommodated Administration Conditions
|
Author(s)
|
Stated Research Purpose
|
|
Abedi et al. (2008)
|
Explore accessibility by using reading comprehension passages that were broken down into shorter “segments” or “chunks”.
|
|
Brown, W.M. (2007)
|
Examine the read aloud accommodation, and an accommodation in which the text response options (distracters and key) were replaced with graphics or pictures (graphically interpreted response options, or GIRO).
|
|
DiRosa (2007)
|
Provide empirically based insight into the effects of testing accommodations on individual student performance.
|
|
Enriquez (2008)
|
Examine the extent to which linguistic accommodation led to improvement in test performance of ELLs using ELP scores from the Colorado English Language Acquisition Assessment (CELApro) and Mathematics scores from the Colorado Student Assessment Program (CSAP) along with student background variables.
|
|
Gregg et al. (2007)
|
(a) Investigate the influence of timed essay writing on the handwritten, typed, and typed/edited formats of an expository essay on the quality scores received by students; (b) Examine the contribution of spelling, handwriting, fluency, and vocabulary complexity to the quality scores that students with and without dyslexia received on the same writing task.
|
|
Jerome (2007)
|
Examine the use of test accommodations and their impact on the statewide performance of students with disabilities.
|
|
Kamei-Hannan (2008)
|
Examine the accessibility barriers of a computerized adapted test called the Measure of Academic Performance.
|
|
Lang et al. (2008)
|
Examine the effects of up to 67 testing accommodations on students’ test performances and reactions to the use of testing accommodations.
|
|
Lewandowski et al. (2007)
|
Examine the effects of an extended time (time and one-half) accommodation.
|
|
Lewandowski et al. (2008)
|
Examine the effect of extended time.
|
|
Lovett (2008)
|
Examine factors that may influence students’ timed exam performance.
|
|
Middleton (2007)
|
Examine the effects of a read-aloud accommodation provided to students. It also examined the appropriateness of the read-aloud accommodation.
|
|
Temple (2007)
|
Examine an effect of read-alouds on reading achievement.
|
Table A-3. Purpose Category: Investigate Test Validity Under Accommodated Conditions
|
Author(s)
|
Stated Research Purpose
|
|
Lindstrom & Gregg (2007)
|
Generate information about the validity of inferences that can be made from scores obtained from extended time test administrations for students with disabilities.
|
Table A-4. Purpose Category: Report on Implementation Practices and Test Accommodations Use
|
Author(s)
|
Stated Research Purpose
|
|
Albus & Thurlow (2008)
|
Highlight the policy differences across states in the accommodations offered and also provides information on state-specific policies.
|
|
Atchison (2008)
|
Gather and analyze data on the subject of using assistive technology as an accommodation on Colorado State Assessment Project (CSAP) testing.
|
|
Bottsford-Miller (2008)
|
Examine the relationship between accommodations and modifications specified on student IEPs, and 504 plans to those provided.
|
|
Cawthon (2008)
|
Investigate the types of testing accommodations used on 2004–2005 statewide standardized assessments as well as recommendations for best practices.
|
|
Finizio (2008)
|
Examine the match between instructional and assessment accommodations on the IEPs of 39 students
|
|
Ketterlin-Geller, Alonzo et al. (2007)
|
Investigate the consistency of accommodation assignments for students with IEPs.
|
|
Sack, et al. (2008)
|
Determine the number of students requesting accommodation for a disability, the time at which the request was made, the type of disability, and the type of accommodation offered.
|
|
Wolf (2007)
|
(a) Document the use of testing accommodations by students who are deaf or hard of hearing (D/HH); (b) Identify the types and frequency of testing accommodations required by D/HH students attending general education classes in Arizona public schools; and (c) Analyze the relationships between type and degree of hearing loss and SAT-9 achievement for students who are D/HH in Arizona public schools.
|
Table A-5. Purpose Category: Review Literature on Test Accommodations for Effects on Scores and Assessment Practices
|
Author(s)
|
Stated Research Purpose
|
|
Wang et al. (2007)
|
Conduct a meta-analysis of computer-based and paper-and-pencil administration mode effects on K-12 student mathematics tests.
|
Table A-6. Purpose Category: Identify Predictors of the Need for Test Accommodation(s)
|
Author(s)
|
Stated Research Purpose
|
|
Tindal et al. (2008)
|
Investigate the reliability and utility of the Accommodation Station (AS), an online decision-making model that helps IEP teams determine which testing accommodations are appropriate for individual students with disabilities.
|
Table A-7. Purpose Category: Study or Compare Perceptions of Accommodation Use
|
Author(s)
|
Stated Research Purpose
|
|
Brown, D.W. (2007)
|
Examine teachers’ perceptions and knowledge of test accommodations for students with disabilities.
|
|
Byrnes (2008)
|
Examine interpretations of three frequently used accommodations.
|
|
Hadjikakou & Hartas (2008)
|
Explore the experiences of students with disabilities and the views of their tutors and Heads of private tertiary education institutions in Cyprus.
|
|
Sharoni & Vogel (2007)
|
Examine the percentage of students with testing accommodations among Israeli entrance exam participants.
|
|
Woods (2007)
|
Investigate special education specialist opinions regarding the manageability of a variety of accommodations on a nationwide large-scale assessment.
|
Top of page | Table of Contents
Research Characteristics
Table B-1. Reference Types, Research Types, Research Designs, Data Collection Sources, and Collection Instruments
|
Authors
|
Reference Type
|
Research Type
|
Research Design
|
Data Collection Source
|
Collection Instrument
|
|
Abedi et al. (2008)
|
Report
|
Mixed
|
Quasi-experimental
|
Primary
|
Focus group, Test, Survey
|
|
Albus &
Thurlow (2008)
|
Journal
|
Qualitative
|
Descriptive Qualitative
|
Primary
|
State Policy Documents
|
|
Atchison (2008)
|
Dissertation
|
Mixed
|
Descriptive Quantitative
|
Primary
|
Survey
|
|
Bennett et al. (2008)
|
Journal
|
Quantitative
|
Quasi-experimental
|
Secondary
|
Test
|
|
Bolt &
Thurlow (2007)
|
Journal
|
Quantitative
|
Descriptive Quantitative
|
Secondary
|
Test
|
|
Bolt &
Ysseldyke (2008)
|
Journal
|
Quantitative
|
Quasi-experimental
|
Secondary
|
Test
|
|
Bottsford-Miller (2008)
|
Dissertation
|
Mixed
|
Descriptive Quantitative
|
Secondary
|
Test
|
|
Brown, D.W. (2007)
|
Dissertation
|
Quantitative
|
Quasi-Experimental
|
Primary
|
Test
|
|
Brown, W.M. (2007)
|
Dissertation
|
Quantitative
|
Descriptive Quantitative
|
Primary
|
Survey
|
|
Byrnes (2008)
|
Journal
|
Qualitative
|
Descriptive Qualitative
|
Primary
|
Survey
|
|
Cawthon (2008)
|
Journal
|
Quantitative
|
Descriptive Qualitative
|
Secondary
|
Survey
|
|
DiRosa (2007)
|
Dissertation
|
Quantitative
|
Descriptive Quantitative
|
Primary
|
Test
|
|
Elbaum (2007)
|
Journal
|
Quantitative
|
Descriptive Quantitative
|
Primary
|
Test
|
|
Enriquez (2008)
|
Dissertation
|
Quantitative
|
Correlation/Prediction
|
Secondary
|
Test
|
|
Finizio (2008)
|
Dissertation
|
Quantitative
|
Descriptive Quantitative
|
Secondary
|
Test
|
|
Gregg et al. (2007)
|
Journal
|
Quantitative
|
Descriptive Quantitative
|
Primary
|
Test
|
|
Authors
|
Reference Type
|
Research Type
|
Research Design
|
Data Collection Source
|
Collection Instrument
|
|
Hadjikakou & Hartas (2008)
|
Journal
|
Qualitative
|
Descriptive Qualitative
|
Primary
|
Focus group
|
|
Harris (2008)
|
Dissertation
|
Quantitative
|
Correlation/Prediction
|
Secondary
|
Test
|
|
Jerome (2008)
|
Dissertation
|
Quantitative
|
Descriptive Quantitative
|
Secondary
|
Test
|
|
Kamei-
Hannan (2008)
|
Journal
|
Quantitative
|
Descriptive Quantitative
|
Primary
|
Test
|
|
Keng et al. (2008)
|
Journal
|
Quantitative
|
Descriptive Quantitative
|
Secondary
|
Test
|
|
Ketterlin-
Geller, Alonzo et al. (2007)
|
Journal
|
Qualitative
|
Descriptive Qualitative
|
Primary
|
Survey
|
|
Ketterlin-Geller, Yovanoff et al. (2007)
|
Journal
|
Quantitative
|
Descriptive Quantitative
|
Primary
|
Test
|
|
Kim & Huynh (2007)
|
Journal
|
Quantitative
|
Descriptive Quantitative
|
Secondary
|
Test
|
|
Kim & Huynh (2008)
|
Journal
|
Quantitative
|
Descriptive Quantitative
|
Secondary
|
Test
|
|
Lang et al. (2008)
|
Journal
|
Mixed
|
Quasi-experimental
|
Primary
|
Test
|
|
Lee et al. (2008)
|
Journal
|
Mixed
|
Quasi-Experimental
|
Primary
|
Interview Protocol
|
|
Lewandowski et al. (2008)
|
Journal
|
Quantitative
|
Quasi-experimental
|
Primary
|
Test
|
|
Lewandowski et al. (2007)
|
Journal
|
Quantitative
|
Quasi-Experimental
|
Primary
|
Test
|
|
Lindstrom & Gregg (2007)
|
Journal
|
Quantitative
|
Quasi-Experimental
|
Secondary
|
Test
|
|
Lovett (2008)
|
Dissertation
|
Quantitative
|
Quasi-experimental
|
Primary
|
Test
|
|
Middleton (2007)
|
Dissertation
|
Quantitative
|
Descriptive Quantitative
|
Primary
|
Test
|
|
Puhan et al. (2007)
|
Journal
|
Quantitative
|
Descriptive Quantitative
|
Secondary
|
Test
|
|
Sack et al. (2008)
|
Journal
|
Qualitative
|
descriptive qualitative
|
Primary
|
Interview Protocol
|
|
Authors
|
Reference Type
|
Research Type
|
Research Design
|
Data Collection Source
|
Collection Instrument
|
|
Sharoni & Vogel (2007)
|
Journal
|
Quantitative
|
Descriptive Quantitative
|
Secondary
|
Test
|
|
Temple (2007)
|
Dissertation
|
Quantitative
|
Descriptive Quantitative
|
Secondary
|
Tests
|
|
Tindal et al. (2008)
|
Report
|
Quantitative
|
Descriptive Quantitative
|
Primary
|
Survey
|
|
Wang et al. (2007)
|
Journal
|
Quantitative
|
Descriptive Quantitative
|
Secondary
|
Test
|
|
Wolf (2007)
|
Dissertation
|
Quantitative
|
Descriptive Quantitative
|
Secondary
|
Test
|
|
Woods (2007)
|
Journal
|
Mixed
|
Descriptive Quantitative
|
Primary
|
Survey
|
Top of page | Table of Contents
Assessment/Instrument Characteristics
Table C-1. Assessment/Instrument Types and Specific Assessments/Instruments Used
|
Authors
|
Researcher-Developed Non-Test Protocols
|
Norm-Referenced Cognitive Ability Measures
|
Norm-referenced Academic Achievement Measures
|
State Criterion-referenced Assessment
|
Researcher or Professionally Developed Tests
|
|
Abedi et al. (2008)
|
Student background questions, student motivation scale, student background questionnaire for teachers
|
|
|
|
Researcher developed test
|
|
Albus &
Thurlow (2008)
|
Researcher developed evaluation protocol
|
|
|
|
|
|
Atchison (2008)
|
Survey to measure the attitudes and knowledge of educators and special service providers
|
|
|
|
|
|
Bennett et al. (2008)
|
|
|
Twenty questions from NAEP 2000 assessment in paper and pencil and computer based formats
|
|
Tutorial with embedded tasks measuring computer skill
|
|
Bolt & Thurlow (2007)
|
|
|
|
Statewide assessment
|
|
|
Bolt &
Ysseldyke (2008)
|
|
|
|
Statewide assessment
|
|
|
Bottsford-Miller (2008)
|
Teacher survey, student survey
|
Woodcock-Johnson III
|
|
|
|
|
Brown, D.W. (2007)
|
|
|
|
|
Researcher developed test
|
|
Brown, W.M. (2007)
|
Survey
|
|
|
|
|
|
Byrnes (2008)
|
A single-sheet survey
|
|
|
|
|
|
Cawthon (2008)
|
Researcher developed survey
|
|
|
|
|
|
DiRosa (2007)
|
|
|
Assessment of Skills for Successful Entry and Transfer designed by ACT
|
|
|
|
Elbaum (2007)
|
|
|
|
|
Two equivalent 30-item multiple choice researcher developed tests
|
|
Enriquez (2008)
|
|
|
|
Colorado English Language Acquisition Assessment (CELApro) and the Colorado Student Assessment Program (CSAP)
|
|
|
Finizio (2008)
|
The students’ IEPs were collected and analyzed
|
|
|
|
|
|
Gregg et al. (2007)
|
|
|
|
|
Each participant completed an essay
|
|
Hadjikakou & Hartas (2008)
|
Semi-structured interviews and focus groups
|
|
|
|
|
|
Harris (2008)
|
|
|
|
English Language Arts large-scale tests
|
|
|
Jerome (2008)
|
|
|
|
Virginia Standards of Learning Programs (SOLs) 2004 tests
|
|
|
Kamei-Hannan (2008)
|
|
|
MAP software computerized adapted test
|
|
|
|
Keng et al. (2008)
|
|
|
|
Texas Assessment of Knowledge and Skills (TAKS)
|
|
|
Ketterlin-
Geller, Alonzo et al. (2007)
|
Survey of Teacher Recommendations for Accommodation, IEPs, and Reading Competency Measures
|
|
|
|
|
|
Ketterlin-Geller,
Yovanoff et al. (2007)
|
|
|
|
|
Researcher developed test
|
|
Kim & Huynh (2007)
|
|
|
|
Large-scale statewide end-of-course Algebra and Biology examination
|
|
|
Kim & Huynh (2008)
|
|
|
|
Large-scale statewide end-of-course English examination
|
|
|
Lang et al. (2008)
|
|
|
TerraNova Multiple Assessment Battery
|
|
|
|
Lee et al. (2008)
|
Interviews were conducted after the test administration
|
|
|
|
A passage and 11-item multiple-choice test were taken from a textbook
|
|
Lewandowski et al. (2008)
|
|
|
Reading Fluency subtest of the Woodcock-Johnson Tests of Achievement, Third Edition; Standard form of the Raven Progressive Matrices test; Nelson-Denny Reading Test
|
|
|
|
Lewandowski et al. (2007)
|
Background questionnaire, ADHD rating scale, behavior rating inventory of executive function
|
Processing speed index of the Wechsler intelligence scale for children, fourth edition
|
Mathematics Fluency subtest of Form A of the Woodcock-Johnson Tests of Achievement, Third Edition
|
|
Mathematics calculation test developed for the study
|
|
Lindstrom & Gregg (2007)
|
|
|
The SAT test
|
|
|
|
Lovett (2008)
|
Self-Evaluation of Performance on Timed Academic Reading, Revised Version, Test Anxiety Inventory
|
Wechsler Adult Intelligence Scale
|
Woodcock-Johnson III, Nelson-Denny reading test
|
|
|
|
Middleton (2007)
|
|
|
Reading comprehension test
|
|
|
|
Puhan et al. (2007)
|
|
|
Large scale certification test from the Praxis™ program
|
|
|
|
Sack et al. (2008)
|
Interview
|
|
|
|
|
|
Sharoni & Vogel (2007)
|
Questionnaire regarding level of satisfaction
|
|
The “saf” college entrance exam of 2003
|
|
|
|
Temple (2007)
|
Researchers conducted literature studies through read-alouds
|
|
The Scholastic Reading Inventory Lexile Levels (SRI); the Florida Comprehensive Norm Reference Test Scale Scores (FCAT/NRT)
|
Florida State Fluency Probes (FORF), the Florida Comprehensive Achievement Test in Reading (FCAT)
|
The teacher created tests on the literature during the period 2006-2007
|
|
Tindal et al. (2008)
|
Survey
|
|
|
|
|
|
Wang et al. (2007)
|
|
|
|
|
|
|
Wolf (2007)
|
|
|
SAT-9 test
|
|
|
|
Woods (2007)
|
Open-ended questionnaire
|
|
|
|
|
|
Total
|
18
|
3
|
13
|
9
|
9
|
Table C-2. Content Areas Assessed
|
Author(s)
|
Math
|
Reading
|
Writing
|
Other LAa
|
Science
|
Social Studies
|
Civics/ US
History
|
Psychology
|
Not
Specific
|
N
|
|
Abedi et al. (2008)
|
|
●
|
|
|
|
|
|
|
|
1
|
|
Albus &
Thurlow (2008)
|
|
|
|
●
|
|
|
|
|
|
1
|
|
Atchisonb (2008)
|
|
|
|
|
|
|
|
|
|
0
|
|
Bennett et al. (2008)
|
●
|
|
|
|
|
|
|
|
|
1
|
|
Bolt & Thurlow (2007)
|
●
|
|
|
|
|
|
|
|
|
1
|
|
Bolt &
Ysseldyke (2008)
|
●
|
|
|
|
|
|
|
|
|
1
|
|
Bottsford-Miller (2008)
|
●
|
●
|
|
|
|
|
|
|
|
2
|
|
Brown, D.W. (2007)
|
|
|
|
|
●
|
|
|
|
|
1
|
|
Brown, W.M.b (2007)
|
|
|
|
|
|
|
|
|
|
0
|
|
Byrnesb (2008)
|
|
|
|
|
|
|
|
|
|
0
|
|
Cawthon (2008)
|
●
|
●
|
|
|
|
|
|
|
|
2
|
|
DiRosa (2007)
|
|
●
|
|
|
|
|
|
|
|
1
|
|
Elbaum (2007)
|
●
|
|
|
|
|
|
|
|
|
1
|
|
Enriquez (2008)
|
●
|
|
|
●
|
|
|
|
|
|
2
|
|
Finiziob (2008)
|
|
|
|
|
|
|
|
|
|
0
|
|
Gregg et al. (2007)
|
|
|
●
|
|
|
|
|
|
|
1
|
|
Hadjikakou & Hartasb (2008)
|
|
|
|
|
|
|
|
|
|
0
|
|
Harris (2008)
|
|
●
|
|
|
|
|
|
|
|
1
|
|
Jerome (2008)
|
●
|
●
|
●
|
●
|
|
|
|
|
|
4
|
|
Kamei-Hannan (2008)
|
|
●
|
|
|
|
|
|
|
|
1
|
|
Keng et al. (2008)
|
●
|
●
|
|
|
●
|
●
|
|
|
|
4
|
|
Ketterlin-Geller, Alonzo et al. (2007)
|
|
●
|
|
|
|
|
|
|
|
1
|
|
Ketterlin-Geller, Yovanoff et al. (2007)
|
●
|
|
|
|
|
|
|
|
|
1
|
|
Kim & Huynh (2007)
|
●
|
|
|
|
●
|
|
|
|
|
2
|
|
Kim & Huynh (2008)
|
|
●
|
|
|
|
|
|
|
|
1
|
|
Lang et al. (2008)
|
●
|
●
|
|
|
|
|
|
|
|
2
|
|
Lee et al. (2008)
|
|
|
|
|
|
|
|
●
|
|
1
|
|
Lewandowski et al. (2007)
|
●
|
|
|
|
|
|
|
|
|
1
|
|
Lewandowski et al. (2008)
|
|
●
|
|
|
|
|
|
|
|
1
|
|
Lindstrom & Gregg (2007)
|
●
|
●
|
●
|
|
|
|
|
|
|
3
|
|
Lovett (2008)
|
|
●
|
|
|
|
|
|
|
|
1
|
|
Middleton (2007)
|
|
●
|
|
|
|
|
|
|
|
1
|
|
Puhan et al. (2007)
|
●
|
●
|
●
|
|
|
|
|
|
|
3
|
|
Sack, et alb (2008)
|
|
|
|
|
|
|
|
|
|
0
|
|
Sharoni & Vogel (2007)
|
|
|
|
|
|
|
|
|
●
|
1
|
|
Temple (2007)
|
|
●
|
|
|
|
|
|
|
|
1
|
|
Tindal et al.b (2008)
|
|
|
|
|
|
|
|
|
|
0
|
|
Wang et al. b (2007)
|
|
|
|
|
|
|
|
|
|
0
|
|
Wolf (2007)
|
|
●
|
|
●
|
|
|
|
|
|
2
|
|
Woodsb (2007)
|
|
|
|
|
|
|
|
|
|
0
|
|
Total
|
15
|
18
|
4
|
4
|
3
|
1
|
0
|
1
|
1
|
|
a Other Language Arts assessment areas include English Language Proficiency, Literature, Writing, and General Language Skills.
b Study was not applicable to choosing a content area assessed (for example, a survey of teacher perceptions).
Top of page | Table of Contents
Participant and Sample Characteristics
Table D-1. Unit of Analysis, Total Sample Sizes (Students, Parents, Schools, Articles, and Teachers), Grade/Education Level, and Types of Disabilities
|
Authors
|
Unit of Analysis
|
Sample Size
|
Percent of Sample with Disabilities
|
Grade/
Education Level
|
Disability Categories Included in Sample *
|
|
Abedi et al. (2008)
|
Students
|
738
|
15.9%
|
Middle School
|
LD, hearing impairment, autism, SL, other health impairment
|
|
Albus & Thurlow (2008)
|
N/A
|
N/A
|
N/A
|
N/A
|
N/A
|
|
Atchison (2008)
|
Teachers
|
31
|
N/A
|
N/A
|
N/A
|
|
Bennett et al. (2008)
|
Students
|
1,970
|
Not reported
|
Middle School
|
Not reported
|
|
Bolt & Thurlow (2007)
|
Students
|
4,435
|
100.0%
|
Elementary & Middle School
|
LD
|
|
Bolt &
Ysseldyke (2008)
|
Students
|
37,350
|
5.4%
|
Elementary & Middle School
|
LD, mental retardation, EBD, deaf, blind, deaf-blind, hard of hearing, and PD
|
|
Bottsford-Miller (2008)
|
Students
|
5,794
|
100.0%
|
Elementary & Middle School
|
LD, speech impairment, mental retardation, EBD, visual impairment, other health impairment, hearing impairment, MD, autism, orthopedic impairment, traumatic brain injury, developmental delay, deaf/blindness
|
|
Brown, D.W. (2007)
|
Students
|
868
|
8.5%
|
Elementary
|
LD
|
|
Brown, W.M. (2007)
|
Teachers
|
262
|
N/A
|
N/A
|
N/A
|
|
Byrnes (2008)
|
Teachers
|
45
|
N/A
|
N/A
|
N/A
|
|
Cawthon (2008)
|
Teachers
|
444
|
N/A
|
N/A
|
N/A
|
|
DiRosa (2007)
|
Students
|
10
|
100.0%
|
College
|
LD
|
|
Elbaum (2007)
|
Students
|
625
|
62.0%
|
Middle School & High School
|
LD
|
|
Enriquez (2008)
|
Students
|
72,573
|
12.0%
|
Multiple Levels
|
Unspecified disabilities
|
|
Finizio (2008)
|
Students
|
38
|
100.0%
|
Elementary & Middle School
|
Unspecified disabilities
|
|
Gregg et al. (2007)
|
Students
|
130
|
50.0%
|
College
|
LD
|
|
Hadjikakou & Hartas (2008)
|
Students
|
10
|
100.0%
|
College
|
Hearing impaired, PD, LD, visual impairment, MD
|
|
Harris (2008)
|
Students
|
5,835
|
100.0%
|
Middle School
|
MD
|
|
Jerome (2008)
|
Students
|
314,766
|
14.5%
|
Elementary
|
MD
|
|
Kamei-Hannan (2008)
|
Students
|
49
|
100.0%
|
Multiple Levels
|
Unspecified disabilities
|
|
Keng et al. (2008)
|
Students
|
15,593
|
Not reported
|
Middle School & High School
|
Not reported
|
|
Ketterlin-Geller, Alonzo et al. (2007)
|
Students and Teachers
|
38 Students/
14 Teachers
|
100.0%
|
Elementary
|
EBD, LD, MD, S/L
|
|
Ketterlin-Geller, Yovanoff et al. (2007)
|
Students
|
160
|
17.5%
|
Elementary
|
EBD, LD, S/L
|
|
Kim & Huynh (2007)
|
Students
|
1,194
|
Not reported
|
High School
|
Not reported
|
|
Kim & Huynh (2008)
|
Students
|
439
|
Not reported
|
Middle School & High School
|
Not reported
|
|
Lang et al. (2008)
|
Students
|
170
|
44.0%
|
Elementary
|
Unspecified disabilities
|
|
Lee et al. (2008)
|
Students
|
21
|
100.0%
|
College
|
AP
|
|
Lewandowski et al. (2008)
|
Students
|
64
|
50.0%
|
High School
|
LD
|
|
Lewandowski et al. (2007)
|
Students
|
54
|
50.0%
|
Middle School
|
AP
|
|
Lindstrom & Gregg (2007)
|
Students
|
4,952
|
50.0%
|
High School
|
AP, LD, MD
|
|
Lovett (2008)
|
Students
|
225
|
0.0%
|
College
|
No disability
|
|
Middleton (2007)
|
Students
|
2,028
|
44.5%
|
Elementary & Middle School
|
LD (RD)
|
|
Puhan et al. (2007)
|
Adults
|
5,308
|
N/A
|
N/A
|
N/A
|
|
Sack et al. (2008)
|
Medical Schools
|
126
|
N/A
|
N/A
|
N/A
|
|
Sharoni & Vogel (2007)
|
Students
|
4,851
|
8.5%
|
College
|
LD
|
|
Temple (2007)
|
Students
|
175
|
100.0%
|
Middle School
|
Unspecified disabilities
|
|
Tindal et al. (2008)
|
Teachers
|
140
|
N/A
|
N/A
|
N/A
|
|
Wang et al. (2007)
|
Meta-Analysis
|
N/A
|
N/A
|
N/A
|
N/A
|
|
Wolf (2007)
|
Students
|
115
|
100.0%
|
Elementary & Middle School
|
Hearing impaired
|
|
Woods (2007)
|
Teachers
|
205
|
N/A
|
N/A
|
N/A
|
* Key:
AP (Attention Problem)
LD (Learning Disabilities)
S/L (Speech/Language)
MD (Multiple Disability)
PD (Physical Disability)
RD (Reading Deficit)
EBD (Emotional or Behavioral Disability)
Top of page | Table of Contents
Accommodations Studied
Table E-1. Presentation Accommodations Researched by Study
|
Authors
|
Braille
|
Computer
Administration
|
Large Print
|
Clarify Directions
|
Read Directions
|
Simplified Language
|
Read Aloud
|
Format
|
|
Bolt & Thurlow (2007)
|
|
|
|
|
|
|
●
|
|
|
Brown D. W. (2007)
|
|
|
|
|
|
|
●
|
●
|
|
Brown W. M. (2007)
|
|
|
●
|
|
●
|
|
●
|
|
|
Elbaum (2007)
|
|
|
|
|
|
|
●
|
|
|
Enriquez (2008)
|
|
|
|
|
|
|
●
|
|
|
Harris (2008)
|
|
●
|
|
|
●
|
|
|
|
|
Kamei-Hannan (2008)
|
●
|
●
|
●
|
|
|
|
|
|
|
Keng et al. (2008)
|
|
●
|
|
|
|
|
|
|
|
Ketterlin-Geller, Alonzo et al. (2007)
|
|
|
|
|
|
|
●
|
|
|
Ketterlin-Geller, Yovanoff et al. (2007)
|
|
|
|
|
|
|
●
|
|
|
Kim & Huynh (2007)
|
|
●
|
|
|
|
|
|
|
|
Kim & Huynh (2008)
|
|
●
|
|
|
|
|
|
|
|
Lee et al. (2008)
|
|
●
|
|
|
|
|
|
|
|
Middleton (2007)
|
|
|
|
|
|
|
●
|
|
|
Sharoni & Vogel (2007)
|
|
|
●
|
|
|
|
|
|
|
Temple (2007)
|
|
|
|
|
|
|
●
|
|
|
Wolf (2007)
|
|
|
|
●
|
●
|
●
|
|
|
|
Total
|
1
|
6
|
3
|
1
|
3
|
1
|
9
|
1
|
Table E-2a. Equipment/Materials, Response, and Timing Accommodations Researched by Study
|
Authors
|
Technological Aid
|
Audio Cassette
|
Calculator
|
Mark Answer in Test
|
|
Abedi et al. (2008)
|
|
|
|
|
|
Atchison (2008)
|
●
|
|
|
|
|
Brown W. M. (2007)
|
|
|
|
●
|
|
Byrnes (2008)
|
|
|
|
●
|
|
Cawthon (2008)
|
|
●
|
|
|
|
DiRosa (2007)
|
|
●
|
|
|
|
Enriquez (2008)
|
|
|
|
|
|
Kamei-Hannan (2008)
|
●
|
|
|
|
|
Ketterlin-Geller, Alonzo, et al. (2007)
|
|
|
|
|
|
Lee et al. (2008)
|
|
|
|
|
|
Lewandowski et al. (2007)
|
|
|
|
|
|
Lewandowski et al. (2008)
|
|
|
|
|
|
Lindstrom & Gregg (2007)
|
|
|
|
|
|
Sack, et al. (2008)
|
|
|
|
|
|
Sharoni & Vogel (2007)
|
|
|
●
|
|
|
Wolf (2007)
|
|
●
|
|
●
|
|
Total
|
2
|
3
|
1
|
3
|
Table E-2b. Equipment/Materials, Response, and Timing Accommodations Researched by Study
|
Authors
|
Spell Checker
|
Test Breaks
|
Extended Time
|
Multiple Day
|
|
Abedi et al. (2008)
|
|
●
|
|
|
|
Atchison (2008)
|
|
|
|
|
|
Brown W. M. (2007)
|
●
|
●
|
|
|
|
Byrnes (2008)
|
|
|
●
|
|
|
Cawthon (2008)
|
|
|
|
|
|
DiRosa (2007)
|
|
|
|
|
|
Enriquez (2008)
|
|
|
●
|
|
|
Kamei-Hannan (2008)
|
|
|
|
|
|
Ketterlin-Geller, Alonzo, et al. (2007)
|
|
|
●
|
●
|
|
Lee et al. (2008)
|
|
|
●
|
|
|
Lewandowski et al. (2007)
|
|
|
●
|
|
|
Authors
|
Spell Checker
|
Test Breaks
|
Extended Time
|
Multiple Day
|
|
Lewandowski et al. (2008)
|
|
|
●
|
|
|
Lindstrom & Gregg (2007)
|
|
|
●
|
|
|
Sack, et al. (2008)
|
|
|
●
|
|
|
Sharoni & Vogel (2007)
|
|
|
●
|
|
|
Wolf (2007)
|
|
●
|
●
|
|
|
Total
|
1
|
3
|
10
|
1
|
Table E-3. Setting and Other Accommodations Researched by Study
|
Authors
|
Small Group
|
Individual
|
Specialized Setting
|
Preferential Seating
|
Isolated Test Setting
|
Other
|
|
Abedi et al. (2008)
|
|
|
|
|
|
Segmented passages
|
|
Brown (2007)
|
|
|
|
●
|
|
|
|
Byrnes (2008)
|
|
|
|
●
|
|
|
|
Enriquez (2007)
|
|
|
|
|
|
Dictionary, translation
|
|
Ketterlin-Geller, Alonzo, et al (2007)
|
|
|
|
|
●
|
|
|
Jerome (2008)a
|
|
|
|
|
|
Multiple
|
|
Lang et al. (2008)
|
|
|
|
|
|
Not specified
|
|
Lovett (2007)
|
|
|
|
|
|
Not specified
|
|
Sack, et al (2008)
|
|
|
|
|
|
Quiet room
|
|
Tindal et al. (2007)
|
|
|
|
|
|
Not specified
|
|
Wang et al. (2007)
|
|
|
|
|
|
Not specified
|
|
Total
|
0
|
0
|
0
|
2
|
1
|
8
|
a Study did not isolate by accommodations but included all students tested on a statewide large scale assessment and all accommodations allowed by that state policy.
Top of page | Table of Contents
Research Findings
Table F-1. Findings for Studies where Accommodations were Aggregated
|
The use of testing accommodations resulted in mixed effects on student scores
|
|
DiRosa (2007)
|
The accommodations were found to benefit some students with learning disabilities some of the time, but neither of the accommodations singularly or packaged benefited all of the students all of the time.
|
|
Wolf (2007)
|
Type of hearing loss was found to significantly affect reading achievement even when controlling for testing accommodations. The use of testing accommodations resulted in mixed effects on student reading and language achievement performance.
|
|
Accommodated and non-accommodated test forms were not comparable
|
|
Bolt & Ysseldyke (2008)
|
It appeared that measurement was not highly comparable across accommodated students with physical disabilities and non-accommodated students without disabilities.
|
|
Accommodations had a positive effect on scores and provided a differential boost to scores of students with disabilities
|
|
Lang et al. (2008)
|
The findings indicated testing accommodations overall had a positive impact on students’ individual reading and math scores. Furthermore, testing accommodations had a differential positive effect on reading scores for students with disabilities compared to students without disabilities.
|
|
Accommodations did not level the playing field on college entrance exams and alternate admission criteria is advised
|
|
Sharoni & Vogel (2007)
|
Consideration of alternative admission criteria is recommended, given the fact that students with learning disabilities using accommodations in Israel did not achieve test scores comparable to those achieved by students without disabilities.
|
Table F-2. Findings for Computer-based versus Paper-and-pencil assessment formats
|
The scores obtained via computer-based assessment are comparable to those obtained via paper-and-pencil format
|
|
Kim & Huynh (2007)
|
Overall, the results supported the comparability of computerized and paper-based tests at the item level, subtest-level, and whole test-level in both subject areas. No evidence was found to suggest that the administration mode changed the construct being measured.
|
|
Kim & Huynh (2008)
|
The overall results suggested that scores obtained from PPT and CBT were comparable.
|
|
Lee et al. (2008)
|
No significant differences were found in performance scores between the students tested under the two conditions.
|
|
Wang et al. (2007)
|
The results based on the final selected studies with homogeneous effect sizes show that the administration mode had no statistically significant effect on K-12 student mathematics tests.
|
|
Puhan et al. (2007)
|
Results indicated that the effect sizes were small (d < 0.20) and not statistically significant (p > 0.05).
|
|
The scores obtained via computer-based assessment are NOT comparable to those obtained via paper-and-pencil format
|
|
Bennett et al. (2008)
|
Results showed that the computer-based mathematics test was significantly more difficult statistically than the paper-based test.
|
Table F-3. Findings for extended time versus standard time assessment formats
|
Findings did not support the differential boost theory for students with disabilities (ADHD)
|
|
Lewandowski et al. (2007)
|
The results did not support the differential boost hypothesis in that the ADHD group did not make more gains than the control group with extended time.
|
|
Lewandowski et al. (2008)
|
Nondisabled students benefited more from the extended time than students with LDs did. However, extended time did allow students with LDs to attempt as many questions as their nondisabled peers did under standard time conditions.
|
|
The scores obtained via extra time are comparable to those obtained via standard time assessment format
|
|
Lindstrom & Gregg (2007)
|
Invariance across the two groups was supported for all parameters of interest, suggesting that the scores on the Critical Reading, Math, and Writing sections of the SAT Reasoning Test can be interpreted in the same way when students have an extended-time administration as opposed to the standard-time administration.
|
|
Scores predicted by reading fluency, self-perception, and test anxiety when tests are administered under timed conditions
|
|
Lovett (2008)
|
In the best effort group, reading fluency and self-perceptions emerged as predictors of performance on the reading comprehension test, whereas test anxiety and processing speed did not add unique predictive value. Perceptions of performance on timed tests were predicted by test anxiety, even when reading fluency was controlled.
|
|
As magnification level increases so does time needed to finish assessment
|
|
Kamei-
Hannan (2008)
|
The results showed that as magnification increased, time on the test increased and students required visual efficiency skills. Students who used refreshable braille displays were faced with several obstacles.
|
|
Issues of vocabulary complexity, verbosity, spelling, and handwriting account for higher variance in scores for students with disabilities (learning disabilities) than students without disabilities
|
|
Gregg et al. (2007)
|
Analyses indicated that vocabulary complexity, verbosity, spelling, and handwriting accounted for more variance in essay quality scores for writers with dyslexia than for their typically achieving peers.
|
Table F-4. Findings for perceptions related to accommodations used for assessment
|
Educator perceptions are varying related to assistive technology use
|
|
Atchison (2008)
|
Survey results indicated that the knowledge and attitudes scores between the two groups were similar, however regression analysis identified a significant increase the attitude scores of employees of the special education cooperative as they gained work experience. Scores of district employees did not increase on either scale as participants gained work experience.
|
|
Educators are confident in their knowledge of accommodations but perceive preparation programs and training as lacking
|
|
Brown, W.M. (2007)
|
Teachers reported that they were generally confident in their knowledge, but that they perceived their college teacher preparation programs and, to a lesser extent, their staff development programs, were lacking. In regards to the fairness of test accommodations both special and general education teachers also felt that it is fair that only students with disabilities and English as a Second Language students receive test accommodations.
|
|
Educator perceptions are varying related to what specific accommodations look like and entail when carried out on test day
|
|
Byrnes (2008)
|
Although a majority of both groups agreed on interpretations of extended time, there was little agreement, considerable variation, and some contradiction in their understanding of the changes intended by scribing and preferential seating.
|
|
Educators perceive accommodations as valid and easy to use
|
|
Cawthon (2008)
|
Participants perceived all listed accommodations as both valid and easy to use. Participants recommended that student academic level, communication mode, and additional disabilities be taken into account when choosing accommodations for students who are deaf or hard of hearing.
|
|
Educators perceive accommodations as appropriate and would like to expand use
|
|
Woods (2007)
|
The findings were that the system for allocating access arrangements is considered ‘manageable’ by 20% of teachers and ‘fair’ by only 25% of teachers; 70% of teachers considered extension of access arrangements to be appropriate, notwithstanding resource constraints. Qualitative data from the questionnaires highlighted the reasons for this pattern of results and a call by teachers for wider access in examinations to readers, scribes, extra time, and a word processing facility.
|
Table F-5. Findings for practices related to accommodations used for assessment
|
States are beginning to form written accommodations policy for students with disabilities taking ELP exams
|
|
Albus &
Thurlow (2008)
|
Although further investigation and empirical research is needed on accommodations for students with disabilities taking ELP assessments, especially as the number of these students continues to grow, this analysis of states showed some promising practices. One of these states is using charts to address accommodations by domain of the assessment (e.g., reading, writing, listening, and speaking), being specific about those allowed or not allowed for each. Other practices included policies that take into account individual student needs rather than global decisions and states acknowledging that decision making is an ongoing practice that can change over time (e.g., with the possibility of braille versions of assessments among future options).
|
|
The provision of accommodations is variable depending upon the accommodations, educational context, and student demographic characteristics
|
|
Bottsford-Miller (2008)
|
Results suggested that the provision of accommodations and modifications may vary depending upon the accommodation and the educational context. The probability of obtaining a specified accommodations or modification may change somewhat based on student demographic characteristics.
|
|
Accommodations used in assessment increased over time, as did the match with accommodations used for instruction
|
|
Finizio (2008)
|
Results indicated that accommodations use increased over time, accommodation match increased over time, accommodation assignment was not disability-specific, accommodation match was not disability-specific, and some accommodations may be instruction or assessment specific.
|
|
Student recollection of accommodations provided does not match the recollection of educators
|
|
Hadjikakou & Hartas (2008)
|
Six students stated that they were not allowed any extra time for assignments, two students said that occasionally extra time was given to them, with one student being allowed extra time frequently. All participants responded that brailled tests or tests with enlarged font were not available for students with visual impairment; furthermore, students with severe hearing impairment were not provided with sign interpretation or lip-reading of the questions nor were they allowed to use loop systems. Likewise, students with visual impairments were not allowed to use magnifiers during the exams. Regarding students with dyslexia, the Heads in seven higher education institutions stated that extra time for assignment was provided on a regular basis, and alternative ways of presentation, for example, oral rather than written, were allowed in accordance with the Pancyprian Association of Dyslexia.
|
|
Students used accommodations in combination in an effort to level playing field
|
|
Jerome (2008)
|
Results from this study indicated that 77.9% of students with disabilities utilized accommodation during assessment, while 70% of students used more than one accommodation. The pass rate of all students with disabilities was consistently lower than the state reported pass rate for all fifth grade students on the Spring 2004 administration, with students using accommodations having the lowest performance rate.
|
|
There is inconsistency between accommodations prescribed by IEPs and teacher’s recommendations
|
|
Ketterlin-Geller, Alonzo et al. (2007)
|
Iinconsistencies were observed between the accommodations listed on the IEP and the teachers’ recommendations. Similar results were observed when comparing either IEP or teacher recommendations with students’ performance.
|
|
Medical school students do not typically request or receive accommodations for assessment
|
|
Sack et al. (2008)
|
The three major findings from the survey were: (a) 2.3% of medical students request accommodations for some form of disability; (b) vast majority of the requests for accommodation come from students with cognitive, rather than physical disabilities; and (c) many students with disabilities delay requesting accommodation until they experience the rigors of the medical school curriculum. Accommodations offered usually consist of extra time and/or a quiet room for examinations.
|
|
There is a need for a decision making tool or model to be put into practice
|
|
Tindal et al. (2008)
|
The outcomes from the judgments supported the need for a more explicit model. Four general categories are presented: student proficiency, ease of completing various (test relevant) activities, benefit from the use of various accommodations, and provision of accommodations in the classroom. Both mean level of ratings and stability of ratings argue against continued use of informal systems.
|
Table F-6. Findings related to the read-aloud or oral administration accommodation for assessment
|
The read aloud accommodation provided a differential boost to students with disabilities as compared to students without disabilities
|
|
Bolt & Thurlow (2007)
|
Within the elementary data set, we identified a significant Accommodation Group × Reading Difficulty interaction effect, such that the accommodation appeared to more positively impact student performance on items that were classified as difficult to read.
|
|
Brown, D.W. (2007)
|
The read-aloud accommodation helped students with reading difficulties more than students whose reading skills were at or above teacher expectations.
|
|
Ketterlin-Geller, Yovanoff, & Tindal (2007)
|
Students with lower reading skills differentially benefited from the read-aloud accommodation on items with high mathematics difficulty and high linguistic complexity but did not benefit from a simplified language accommodation. This study illustrates the need to consider the interaction between item features and student characteristics in accommodations research.
|
|
The read aloud accommodation improved the assessment performance of students
|
|
Enriquez (2008)
|
The results of this study suggested that Translated Oral Scripts seemed to make the biggest difference for all grade levels in terms of association with higher CSAP performance. Students with lower levels of English proficiency tended to benefit more from receiving accommodations than students with higher proficiency.
|
|
Temple (2007)
|
Results indicated a greater increase in fluency, as measured by the Florida State Fluency Probes, from 2006 to 2007, for students in the read-aloud group (test) as compared with students in the sustained silent reading group (control group), and for students in grades 6 and 7 as compared with students in grade 8. The results of this study also found that read-alouds promoted increased performance of female students on the teacher-created tests. This suggests that read-alouds may play a role in increasing the performance of middle school at-risk female readers on similar instruments.
|
|
The read aloud accommodations alters the construct being tested by making the item easier
|
|
Elbaum (2007)
|
Whereas mean scores for students both with and without LD were higher in the accommodated condition, students without disabilities benefited significant more from the accommodations (ES=0.44) than students with LD (ES = 0.20).
|
|
Middleton (2007)
|
In most cases, it was found that these item groups were relatively easier for RLD students when administered under accommodated than under non-accommodated conditions. Results were clearer for fourth than for eighth-grade students. These results also suggest that the construct for RLD students is more similar to the construct for NRLD students when both groups are assessed without the read-aloud accommodation than when the RLD students are assessed with the accommodation.
|
|
The read aloud accommodation did not improve the assessment performance of students
|
|
Harris (2008)
|
The results suggested factorial invariance between test administration modes. In addition, no significant difference in student performance across the two modes was found.
|
Table F-7. Findings related to segmenting text or passages in assessment
|
The presentation of text or passages in segments did not positively affect the reading performance of students with disabilities or students without disabilities
|
|
Abedi et al. (2008)
|
The results of the segmenting study indicated that: (a) segmenting did not affect reading performance of students without disabilities; suggesting that it does not compromise the validity of reading assessment; (b) segmenting did not affect reading performance of students with disabilities.
|
|
The presentation of text or passages in computer based assessment without segmenting had a negative effect on performance
|
|
Keng et al. (2008)
|
No evidence of item position effects emerged, but significant differences were found for several items and objectives in all subjects at grade 8 and in mathematics and English language arts (ELA) at grade 11. Differences generally favored the paper group. ELA items that were longer in passage length and math items that required graphing and geometric manipulations or involved scrolling in the online administration tended to be the items showing differences.
|
Top of page | Table of Contents
Limitations and Future Research
Table G-1. Authors’ Limitations by Study and Limitation Category
|
Authors
|
Sample Characteristics
|
Test/Test Context
|
Methodology
|
Results
|
|
Abedi et al. (2008)
|
Students without disabilities may have struggled to show target skills affecting DIF.
|
|
|
|
|
Albus &
Thurlow (2008)
|
|
Effects of sequence and test form exposure posed the greatest validity concerns.
|
|
|
|
Atchison (2008)
|
Lack of representativeness of the sample for purposes of generalization.
|
|
Methodology does not address current questions related to validity in the literature.
|
|
|
Bennett et al. (2008)
|
Small sample size.
|
Administration of the test was non-standard.
|
Non-random sampling.
|
|
|
Bolt &
Thurlow (2007)
|
Sample was non-representative as most were white and the average score was higher than the statewide average.
|
|
|
|
|
Bolt &
Ysseldyke (2008)
|
|
|
No control group of students without ADHD to compare to.
|
|
|
Bottsford-Miller (2008)
|
Sample may not have been representative.
|
Lack of congruence between items on both forms and ambiguous terminology on both surveys.
|
Experimental control of the variables was not possible.
|
|
|
Brown, D.W.* (2007)
|
|
|
|
|
|
Brown, W.M. (2007)
|
Schools in which technology was more accessible to students might have been more likely to participate.
|
|
|
|
|
Byrnes (2008)
|
|
|
|
Data were collected in 2001, and students have become more comfortable with technology since then.
|
|
Cawthon (2008)
|
Sample was weighted toward teachers in schools for the deaf over those in mainstreamed settings.
|
|
Accommodations use data are, in most cases, for groups of students and not for individual student and participants could remain anonymous in their results and thus could not be reached to confirm the intent of open-ended responses.
|
|
|
DiRosa (2007)
|
Sample of participants was relatively small.
|
|
|
|
|
Elbaum (2007)
|
|
Provision of extended time didn’t alter constructs, however other accommodations did.
|
|
|
|
Enriquez (2008)
|
|
Modifications were made to several of the performance measures used in the study.
|
|
|
|
Finizio (2008)
|
|
|
|
Data presented here can only attempt to be generalized to the technical configuration described in this research.
|
|
Gregg et al. (2007)
|
Groups of schools and participants were not adequately representative.
|
|
|
|
|
Hadjikakou & Hartas (2008)
|
|
Participants may not have responded honestly to all questions contained in the survey or may have consulted reference materials or obtained assistance from other individuals.
|
|
|
|
Harris (2008)
|
|
|
Low participation rate.
|
|
|
Jerome (2008)
|
(1) Sample is weighted toward teachers in schools for the deaf over those in mainstreamed settings. (2) Participants in this sample are more likely to serve students who have more profound hearing loss, use ASL or sign language in instruction, and have additional disabilities.
|
|
Accommodations use data are, in most cases, for groups of students and not for individual students.
|
Teachers who serve students with moderate hearing loss or who use only oral language in instruction are underrepresented in this sample and may, for example, make different recommendations for best practices in accommodations use.
|
|
Kamei-
Hannan (2008)
|
|
Amount of time spent taking the test was influenced by many factors. For example, the amount of exposure to braille prior to the test affected fluency.
|
|
|
|
Keng et al. (2008)
|
Sample consisted of only those taking retakes at 11th grade and was not representative.
|
|
|
|
|
Ketterlin-
Geller, Alonzo et al. (2007)
|
Sample is composed of students who fall within a narrowly defined subset of the population.
|
|
|
|
|
Ketterlin-Geller, Yovanoff et al. (2007)
|
Relatively small sample size.
|
|
|
|
|
Kim & Huynh (2007)
|
Schools in which technology was more accessible to students may have been more likely to participate.
|
Alternate test forms were used for PPT and CBT.
|
|
|
|
Kim & Huynh (2008)
|
Inclusion of a non-representative and relatively small sample.
|
Alternate test forms were used for PPT and CBT.
|
|
|
|
Lang et al. (2008)
|
|
|
|
Survey is a preliminary exploration and the numbers reported must be considered estimates.
|
|
Lee et al. (2008)
|
|
|
Single cohort of students.
|
|
|
Lewandowski et al. (2007)
|
|
|
Limited to only one middle school.
|
|
|
Lewandowski et al. (2008)
|
Sample was small and homogenous.
|
Measures were adapted for group administration and the administration was not “high stakes”.
|
Students were classified by the school and not researchers.
|
|
|
Lindstrom & Gregg (2007)
|
Two groups may have differed in their need for the accommodations.
|
|
|
|
|
Lovett (2008)
|
|
|
|
No clear reason or common element for items exhibiting DIF.
|
|
Middleton (2007)
|
|
|
|
Confounding of the accommodation meant to remove reading ability as a factor in performance with concomitant factors that are unrelated to reading ability.
|
|
Puhan et al. (2007)
|
|
|
Some analyses were limited to variables collected on the student data grid which eliminated some accommodations and native language abilities, etc.
|
|
|
Sack, et al. (2008)
|
|
|
Study was not experimental, but a retrospective study based on archival data files.
|
|
|
Sharoni & Vogel (2007)
|
|
|
|
Findings should be interpreted in light of the population studied and the measures used.
|
|
Temple* (2007)
|
|
|
|
|
|
Tindal et al. (2008)
|
(1) ELL students are disproportionately represented in the students with disabilities, specifically learning disabilities. (2) Students were aware of the low stakes associated with the test.
|
|
|
|
|
Wang et al. (2007)
|
Student motivation is questioned as the test was a field test.
|
Item quality is questioned as the test was a field test.
|
Analyses were only performed at two grade levels.
|
|
|
Wolf* (2007)
|
|
Non-standardized administration of the assessment across testing proctors, sign language interpreters, and schools.
|
(1) Statistical limitations, primarily resulting from the size of the sample and the population. (2) Non random sampling was used.
|
|
|
Woods (2007)
|
|
|
|
Students with dyslexia obtained lower quality scores that their peers even when other factors were taken into account.
|
* Those studies marked with an asterisk did not identify specific limitations.
Table G-2. Authors’ Future Research Directions by Study and Future Research Category
|
Authors
|
Sample Characteristics
|
Test/Test Context
|
Methodology
|
Results
|
|
Abedi et al. (2008)
|
|
|
|
Focus less on whether accommodations are differentially effective for various groups of students and instead involve analysis of how target skills can best be measured across all students.
|
|
Albus & Thurlow (2008)
|
|
|
A single subject approach to conduct studies into student performance under conditions with and without recommended accommodations, in a variety of contests, and with varied subject matter is essential.
|
|
|
Atchison (2008)
|
|
|
|
A better understanding of the influence of high stakes on student and consumer reactions to tests and testing accommodations is needed.
|
|
Bennett et al. (2008)
|
Random and larger sample, perhaps a multi-state investigation.
|
Standard test administration.
|
|
|
|
Bolt &
Thurlow (2007)
|
|
|
Experimental approaches and carefully thought-out analyses of the growing number of extant large-scale assessment databases.
|
Determine optimal testing conditions for students with various educational difficulties.
|
|
Bolt &
Ysseldyke (2008)
|
|
Investigate computerized testing and how it improved the performance of students with ADHD even without further accommodation.
|
|
|
|
Bottsford-Miller (2008)
|
|
|
|
Studies should report the mean and standard deviation on both modes, and also study design.
|
|
Brown, D.W. (2007)
|
|
|
|
The role of many underlying constructs in large-scale testing, such as vocabulary, need to be examined further.
|
|
Brown, W.M. (2007)
|
Include a more representative sample with diverse backgrounds.
|
|
|
|
|
Byrnes (2008)
|
|
|
Investigate the possibility of differences between groups (such as race/ethnicity).
|
|
|
Cawthon (2008)
|
|
|
Move to a field-based platform that both allows teachers to make decisions and systematically investigates the effects using randomized designs.
|
|
|
DiRosa (2007)*
|
|
Explore variations or similarities in individual student outcomes.
|
Single subject designs may provide a better understanding of the impact and functionality of accommodations.
|
|
|
Elbaum (2007)
|
|
Focus on the altering of constructs and validity.
|
|
|
|
Enriquez (2008)
|
|
Experimenting with individual and group administrations of the same measure will help methodologies.
|
|
|
|
Finizio (2008)
|
Increase sample size.
|
|
Increase longitudinal parameters.
|
IEP team decision making and its effects on results.
|
|
Gregg et al. (2007)
|
More representative sample.
|
|
Data regarding the attitudes and knowledge of educators on the subject of using assistive technology as an accommodation on accountability assessments would be of value to district, state and federal organizations in terms of evaluating and designing policy.
|
|
|
Hadjikakou & Hartas (2008)
|
Research in other states especially around issues of teacher perceptions of necessary training.
|
|
|
|
|
Harris (2008)
|
Include more than one school district and could probe respondents for further information.
|
|
|
|
|
Jerome (2008)
|
|
|
Qualitative studies of accommodations decision making and accommodations validity.
|
|
|
Kamei-
Hannan (2008)
|
|
Development of MAP tests should apply principles of universal design and follow guidelines set forth by CAST and NCEO.
|
|
Establish research programs in the UK as they have been in the US.
|
|
Keng et al. (2008)
|
|
Identify items with characteristics that show the potential to display mode DIF a-priori and then see if those items display significant mode differences.
|
|
|
|
Ketterlin-
Geller, Alonzo et al. (2007)
|
|
|
Replicate the study design on a larger scale encompassing a number of school districts.
|
|
|
Ketterlin-Geller, Yovanoff et al. (2007)
|
|
|
Use experimental designs that capture student performance with and without accommodations and the targeted construct must be articulated at the item level to allow for accurate interpretation of student ability.
|
|
|
Kim & Huynh (2007)
|
Include a sample with diverse backgrounds. Another important research directing includes understanding the role of school characteristics.
|
|
|
|
|
Kim & Huynh (2008)
|
More participants.
|
|
Qualitative and survey research is needed to examine why teachers are selecting the accommodations that they are.
|
|
|
Lang et al. (2008)
|
|
|
More detailed survey on students in medical school using methodology that includes systematic reviews of actual records at each school.
|
|
|
Lee et al. (2008)
|
|
|
Follow-up using other cohorts needs to be undertaken as well as studying those students who take a psychometric exam for admissions purposes.
|
|
|
Lewandowski et al. (2007)
|
More studies examining the impact of read-alouds with older students in a variety of academic settings.
|
|
|
|
|
Lewandowski et al. (2008)
|
|
|
Examine the conditions under which the differential boost effects are found.
|
|
|
Lindstrom & Gregg (2007)
|
|
|
|
Consider (1) The extent to which instructional accommodations promote the learning of students with disabilities and (2) Vehicles for promoting students’ understanding, selection, and use of appropriate accommodations.
|
|
Lovett (2008)
|
|
|
|
Examine the use of DIF to validate score gains and explaining the source of the DIF.
|
|
Middleton (2007)
|
|
The effects of different components of an accommodation should be independently assessed.
|
|
|
|
Puhan et al. (2007)
|
|
|
|
Accommodations that are offered in the state for which data is not collected.
|
|
Sack, et al. (2008)
|
|
|
Further breaking down the learning disability category would allow more specific comparisons to be made.
|
|
|
Sharoni & Vogel (2007)
|
Replication with a diverse sample to verify the findings.
|
|
|
|
|
Temple (2007)
|
Examine fluency and standardized test connections at the secondary level.
|
|
Examine the use of read-alouds in specific content areas. Also, qualitative studies that include observations, case studies, surveys, interviews, and analysis of documents are needed.
|
See if the read-aloud strategy is an effective practice in specialized and inclusive classrooms.
|
|
Tindal et al. (2008)
|
Consideration of a focus on students with specific and varied disabilities is necessary.
|
The relationship between student motivation and non-cognitive factors is work exploration.
|
|
|
|
Wang et al.* (2007)
|
|
|
|
|
|
Wolf (2007)
|
|
|
|
Accommodations for students with disabilities taking ELP assessments
|
|
Woods (2007)
|
|
|
|
A better understanding of the duplicative effect of cognitive and linguistic processes is critical.
|
* Those studies marked with an asterisk did not identify specific future directions.
