Nearing the Target in Disaggregated Subgroup Reporting to the Public on 2004-2005 Assessment Results
Technical Report 46
Gretchen R. VanGetson • Martha L. Thurlow
April 2007
All rights reserved. Any or all portions of this document may be reproduced and distributed without prior permission, provided the source is cited as:
VanGetson, G. R., & Thurlow, M. L. (2007). Nearing the target in disaggregated subgroup reporting to the public on 2004-2005 assessment results (Technical Report 46). Minneapolis, MN: University of Minnesota, National Center on Educational Outcomes. Retrieved [today's date], from the World Wide Web: http://education.umn.edu/NCEO/OnlinePubs/Tech46/
Table of Contents
Executive Summary
Overview
Method
Results
Assessment
Participation in 2004-2005
Assessment
Performance in 2004-2005
Assessment
Performance: Trends
Other Information
Collected for 2004-2005
Discussion
References
Appendices
This report marks the ninth analysis conducted by the National Center on Educational Outcomes (NCEO) of the public reporting of state assessment results for students with disabilities. This is the fourth analysis that NCEO has conducted since the passage of the federal No Child Left Behind Act of 2001 (NCLB). Overall, all 50 states and 5 unique states reported some disaggregated assessment results for students with disabilities for the 2004-2005 school year. Thirty-six states reported participation and performance data for all their general assessments, 12 reported participation and performance data for some of their general assessments, and 2 reported only performance data. When considering only assessments that were part of states’ NCLB accountability systems, more states reported all assessment data publicly: 44 states reported participation and performance data for all these assessments, 4 reported participation and performance data for some of these assessments, and 2 reported only performance data for all of these assessments. For alternate assessments, 47 states reported some disaggregated assessment results for students with disabilities. Forty-one states reported both participation and performance data for their alternate assessments, 2 states reported these data for some of their alternate assessments, 3 states reported only participation data, and 1 state reported only performance data for their alternate assessments. Three states did not report participation or performance data about their alternate assessment.
When reporting general assessment participation data for students with disabilities, 43 states reported the number of students tested, the most common way of reporting participation information, while 35 states reported either the percent of students tested or not tested for at least one of their assessments. For states’ alternate assessments, the most common way of reporting participation information was to give the number of students tested; this was the approach of 41 states. Thirty-eight states gave a percentage (either a percent tested or percent not tested).
In terms of reporting general assessment performance data, all 50 states reported on the percent of students with disabilities who were proficient, and 40 states reported the number of students with disabilities in each achievement level. For states’ alternate assessments, 42 states reported on the percent of students with disabilities who were proficient, while 27 states reported the number of students with disabilities in each achievement level. When we examined student performance on general assessments, we found that sizeable and variable gaps existed between students with disabilities and general education students. Gaps in the percentage of participating students reported as proficient tended to be larger at higher grades; however, meaningful comparison of these gaps across grade levels is limited by differences across grade levels in both the composition of the compared subgroups (Bielinski & Ysseldyke, 2000) and by differences in the assessments themselves at different grades. This difference by grade level in the gap in rate of proficiency was not present in the alternate assessment performance data. Percentages of students with disabilities achieving proficiency on the alternate assessment were typically higher than on the general assessment. In examining seven years of data from states that had publicly reported information using the same assessment (11 states), we found that, in general, there was a trend in both reading and math toward higher rates of proficiency among participating students with disabilities.
Overall, this report reinforces what was found in 2003-2004. States continue to improve their public reporting practices, especially for alternate assessments, but it is gradual, and there are still improvements to be made. This report discusses the results of the study and provides recommendations for how states can continue to improve their public reporting practices.
The end of the twentieth century saw education shift toward holding all students to high standards, and holding all schools and school districts accountable for students’ progress toward those standards (Goertz & Duffy, 2003). For example, Title I of the Improving America’s Schools Act (IASA) of 1994 required states to create assessment systems aligned with high standards to measure student progress at least once in elementary, middle, and high school in both reading and mathematics (Goertz & Duffy, 2003). Also in 1994, the Elementary and Secondary Education Act (ESEA) required that students with disabilities be included in standards-based assessment systems, answering a call from researchers that stressed the importance of including all students (McGrew, Thurlow, Shriner, & Spiegel, 1992; Zlatos, 1994).
It was not until 2001, when ESEA was reauthorized as the No Child Left Behind Act (NCLB), that standards-based assessment and accountability solidified its presence in the educational landscape. Under NCLB, by the 2005-2006 school year, any school accepting federal dollars must demonstrate adequate yearly progress in the number of students meeting proficiency standards in the areas of reading and mathematics in grades 3 through 8 and once between grades 10 and 12 (Peterson & Young, 2004). The ultimate goal is to have all students achieve proficiency by 2013-2014 (Goertz & Duffy, 2003). Further, these results must be disaggregated by student group (i.e., gender, disability, limited English proficient, ethnicity, economic status, migrant status); included in the state’s accountability system; and publicly reported in a clear, timely, and useful manner (Peterson & Young, 2004). “Public reporting is the most basic form of accountability” (Goertz & Duffy, 2003, p.6) in that it allows for public knowledge of and school responsibility for student achievement. Public reporting of state assessment participation and performance information for students with disabilities has been tracked by the National Center on Educational Outcomes (NCEO) since 1997.
Not surprisingly, since the passage of NCLB, there has been an increase in the number of states that publicly reported participation and performance data for all of their assessments; there was a jump following implementation from 28 in 2000-2001 to 35 in 2001-2002. This reporting hit a plateau in 2002-2003 and 2003-2004 (36 and 35 states reporting, respectively) (Klein, Wiley, & Thurlow, 2006; Thurlow & Wiley, 2004; Thurlow, Wiley, & Bielinski, 2003; Wiley, Thurlow, & Klein, 2005). The number of states that reported these data for all of their alternate assessments has also shown considerable improvement. For example, while 22 states reported this information in 2001-2002, 33 states reported it in 2003-2004 (Klein et al., 2006; Thurlow & Wiley, 2004).
The 2004-2005 school year was the third year that states were required to report on the performance of students with disabilities on standards-based assessments, and the last year before states were required to test in all grades 3 through 8, and once between grades 10 and 12. This report marks the ninth in a line of NCEO reports that document state public reporting practices, and pays particular attention to present and upcoming federal requirements in public reporting. Additional analyses were conducted as well, including an examination of accommodations reporting, a look at disaggregated student group reporting, and a Web site analysis to determine the accessibility of states’ public reporting of participation and performance data.
We began our search for information by reviewing every state’s Department of Education Web site as well as the Web sites for the 11 unique states (i.e., American Samoa, Bureau of Indian Affairs, Commonwealth of Northern Marianna Islands, Department of Defense Education Activity, District of Columbia, Federated States of Micronesia, Guam, Palau, Puerto Rico, Republic of the Marshall Islands, Virgin Islands). We began collecting data in October 2005 and collected information for the 2004-2005 school year. We recorded the names and other information about the assessments that were administered, documented whether participation and performance information were reported for students with disabilities, and noted any other subgroups that were included in disaggregated reporting. We also examined the way in which participation and performance were reported, whether participation and performance information were reported for students who took the test with accommodations, and how many “clicks” it took to arrive at disaggregated assessment results from the Department of Education Web site homepage. In our initial review, a little over half of the states had already posted their 2004-2005 assessment data online in a way that made the data easy to locate and understand.
On February 10, 2006 we mailed a letter to each state director of assessment (see Appendix A) outlining our findings from the state’s Web site. We asked directors to review our findings, correct any misinformation, and provide the public document or Web page in which the correct information was available. We asked that they send us these changes by March 3, 2006. We received replies via fax, e-mail, letters, or phone calls. Many states directed us to a Web page that we had not found in our search. While a few sent paper copies of information, we were able to find this information on state Web sites as well. A few states gave us dates by which they expected their disaggregated assessment results to be posted. Overall, we received responses from 22 directors of assessment.
To ensure that our findings were as accurate as possible, we followed up these efforts with a letter to each state’s director of special education (see Appendix B). These letters were mailed on March 24, 2006. The letters asked the directors to review our findings and make any changes by April 14, 2006. For the 17 states from which we had already received a response from the director of assessment, we noted that in the letter by stating that “these tables have been verified by your state’s Assessment Director; please notify me if you have anything to add.” For states from which we did not hear from the director of assessment, we sent the same letter to the director of special education as we had sent to the director of assessment. Of the 50 states and 11 unique states to which we sent letters, 32 responded with either corrections or to verify that the information was correct.
Finally, there were still 10 states and 7 unique states for which we had heard back from neither the director of assessment nor the director of special education. For 9 of these states we found information on students with disabilities for all of their general and alternate assessments. For the remaining state, we reported all of the information we could find on its Web site. The unique states were not included in the full analysis. Also, a few states directed us to their Part B State Performance Plan (SPP) for information. The 2004 reauthorization of the Individuals with Disabilities Education Act (IDEA; PL 108-446) required states to create a long-term special education performance plan and:
Make the State’s performance plan available through public means, including by posting on the website of the State educational agency, distribution to the media, and distribution through public agencies. [Section 616©(ii)(I)]
Indicator number three of Part B includes the participation and performance of children with disabilities on statewide assessments, providing a form of reporting of these data. In this report, data from SPPs are provided only for states that specifically asked us to review their SPP.
Characteristics of State Assessment Systems
Appendix C lists all the 2004-2005 state mandated general assessments that we identified for the 50 states and the 11 unique states. This list includes the state, the name of the test, the grades and content areas tested, whether the state had publicly available disaggregated participation and performance data for students with disabilities, and whether the assessment results were used for state accountability purposes. For the 50 states, we identified 97 different statewide assessments and 107 assessments total. (Ten are repeat assessments – three Terra Novas and seven ITBSs.) Thirty-three states had more than one general assessment. For the 11 unique states, six different assessments and eight total assessment systems were found; only one of these unique states gave more than one general assessment.
Because few unique states publicly reported complete assessment data, the following results include only information from the 50 regular states. Figure 1 breaks down the 107 testing systems by type: norm-referenced tests (NRT), criterion-referenced tests (CRT), exit tests used as a gate for graduation or earning a particular type of diploma (EXIT), and hybrid tests that combined standardized NRTs with additional state-developed test items (NRT/CRT). Exit exams were included in a separate category only if the state had a distinct test designed specifically for high school completion requirements. However, it should be noted that some states’ CRTs or NRTs also include an EXIT component.
Figure 1. Types of General Assessments
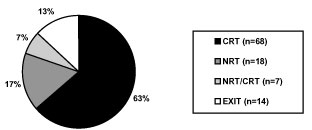
Criterion-referenced tests (CRTs) comprised 63% of all the assessments that states administered in 2004-2005. In fact, only seven states (Arizona, Delaware, Florida, Iowa, Missouri, North Dakota, and South Dakota) did not administer a separate CRT, though six of those states administered a NRT/CRT hybrid test (only Iowa administered solely an NRT). Norm-referenced tests comprised 17% of the assessments, exit exams comprised 13%, and 7% were a NRT/CRT hybrid. These numbers are similar to the 2003-2004 assessment pattern in which 61% of the assessments were CRTs, 16% were NRTs, 16% were exit exams, and 7% were hybrids (Klein et al., 2006).
States That Reported Disaggregated Regular Assessment Data for Students with Disabilities
Figure 2 summarizes the different ways in which regular assessment data were reported in all 50 states. Overall, 72% percent of states reported disaggregated participation and performance data for students with disabilities for all their assessments, 4% percent reported performance data for all assessments (but not participation data), and 24% percent reported participation and performance data for some, but not all, of their assessments. Figure 3 indicates how each of the 50 states reported their disaggregated participation and performance data for students with disabilities.
Figure 2. States that Disaggregated Assessment Results for Students with Disabilities
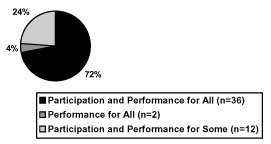
Figure 3. States that Reported 2004-2005 Disaggregated Regular Assessment Results for Students with Disabilities
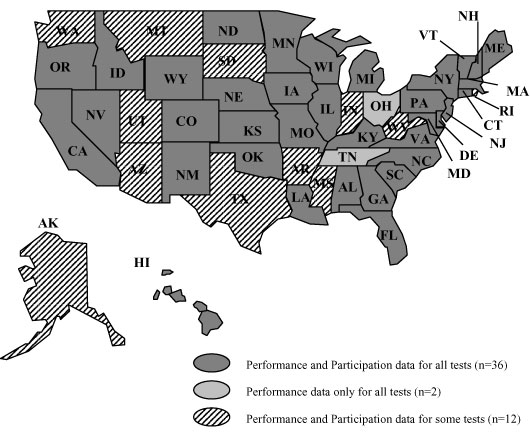
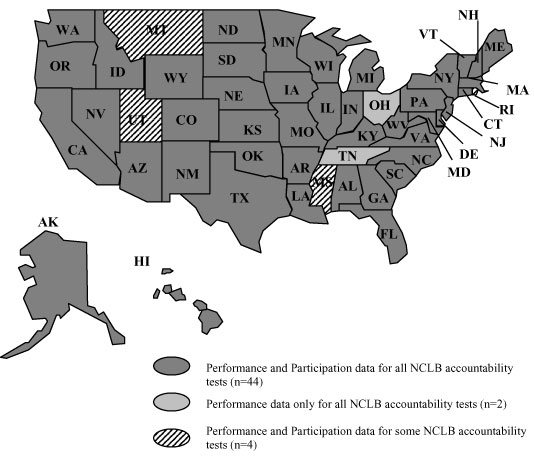
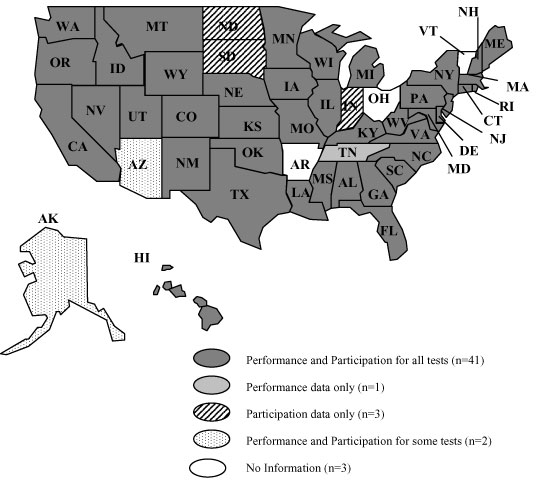
Figure 4 shows the number of states that reported participation and performance data for the assessments that were included in their statewide accountability systems. In many states, only a subset of assessments was part of their NCLB accountability system. When we examined just the NCLB assessments, we found that 44 states reported participation and performance data for students with disabilities on all of these assessments. The states that reported disaggregated data for their regular accountability assessments did so regardless of whether they had just one assessment or multiple assessments (i.e., 21 of the 44 had more than one assessment included in their accountability system), and regardless of whether they tested in just a few grades or in as many as 10 grades. Of the four states that reported participation and performance information for some of their accountability assessments, Mississippi, Montana, and Utah were missing participation data for at least one test.
Figure 4. States that
Reported 2004-2005 Disaggregated Results
for Students with Disabilities in their
NCLB Accountability Systems
Unique States That Reported Disaggregated Assessment Data for Students with Disabilities
This report is only the second to include unique states in the analysis of publicly reported data for students with disabilities. Because many of the unique states did not have information that was found to be publicly reported, we will only briefly mention them here. Table 1 contains a summary of the unique states and whether they reported participation or performance data for students with disabilities. More detailed information is included in Appendix C for general assessments and Appendix D for alternate assessments. Of the 11 unique states, 5 states publicly reported disaggregated data on the participation and performance of students with disabilities on statewide assessments: American Samoa, Bureau of Indian Affairs, Commonwealth of the Northern Mariana Islands, District of Columbia, and Guam. For all of these unique states, with the exception of Guam, these data were gleaned from the SPPs.
Almost all of the unique states administered an NRT, such as the Stanford Achievement Test, 9th Edition (District of Columbia) or 10th Edition (American Samoa, the Commonwealth of the Northern Mariana Islands, Guam). The only unique state to administer a CRT was the Commonwealth of Northern Mariana Islands. In looking at the reporting practices of the five unique states that reported participation and performance data for students with disabilities, all reported the number and percent of students with disabilities who participated in statewide assessments. American Samoa, the Commonwealth of Northern Mariana Islands, and Guam all reported both the number and percentage of students with disabilities who were proficient, while the Bureau of Indian Affairs and the District of Columbia reported only a percent. Further, American Samoa, the Commonwealth of Northern Mariana Islands, the District of Columbia, and Guam all administered an alternate assessment for students with disabilities covering the same content areas and grade levels as the regular assessment.
Table 1. Unique States that Reported
Disaggregated Participation and
Performance Data for Students with
Disabilities
|
State |
Regular Assessment |
Alternate Assessment |
||
|
Participation |
Performance |
Participation |
Performance |
|
|
American Samoa |
Yes |
Yes |
Yes |
Yes |
|
Bureau of Indian Affairs |
Yes |
Yes |
||
|
Commonwealth of the Northern Mariana Islands |
Yes |
Yes |
Yes |
Yes |
|
Department of Defense Education Activity |
No |
No |
|
|
|
District of Columbia |
Yes |
Yes |
No |
No |
|
Federated States of Micronesia |
No |
No |
|
|
|
Guam |
Yes |
Yes |
Yes |
Yes |
|
Palau |
No |
No |
|
|
|
Puerto Rico |
No |
No |
|
|
|
Republic of the Marshall Islands |
No |
No |
|
|
|
Virgin Islands |
No |
No |
|
|
States That Reported Disaggregated Alternate Assessment Data for Students with Disabilities
Appendix D lists all the 2004-2005 state mandated alternate assessments that we identified. A total of 47 states reported some data for students with disabilities’ participation or performance on an alternate assessment. There were a total of 59 different alternate assessments administered in 2004-2005; six states administered more than one alternate assessment. As shown in Figure 5, results from our Web searches and mailings revealed that 41 regular states publicly reported both participation and performance data at the state-level for their alternate assessment. An additional three states reported participation only, one state reported only performance data, and two states reported some participation or performance data. Three states (i.e., 6% of all states) did not report any type of information about their alternate assessment. However, 80% of states did report both participation and performance for their alternate assessment, which is an increase over 66% in the 2003-2004 school year. Figure 6 illustrates how each state reported alternate assessment participation and performance data.
Figure 5. States That Disaggregated Alternate Assessment Results for Students with Disabilities
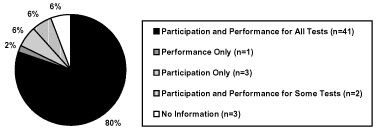
Figure 6. States That Reported 2004-2005 Disaggregated Alternate Assessment Results for Students with Disabilities
Assessment Participation in 2004-2005
General Assessment Disaggregated Participation Results for Students with Disabilities
Among the states identified as providing participation data for students with disabilities, the way in which this information was reported varied (see Appendix E). Figure 7 illustrates the number of assessments with disaggregated participation data and how those participation data were reported. Information is presented in terms of the number of assessments for which participation data were available, not in terms of the number of states. For example, in Alabama there are four assessments and each is counted separately. We used this approach because not all states report participation in the same way across assessments. For instance, one state might report only a count of students tested for one assessment, but for another assessment it might report a count tested, a percent tested, and a percent not tested.
Figure 7. Participation Reporting Approaches for General Assessments
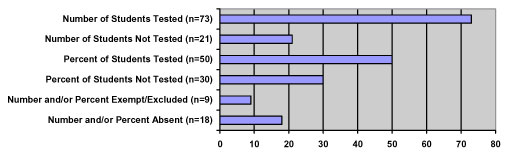
Thirty-seven states (59 assessments total) reported either the percent of students tested or the percent not tested for at least one of their assessments, which is a slight increase from the thirty-four that reported rates in 2003-2004. For 50 of those assessments, the percent of students tested was given, and for 30 assessments the percent of students not tested was given. For 21 assessments, both percent tested and percent not tested were provided. Forty-three states (73 assessments) provided the number of students tested, making this the most frequent way of reporting participation data. Sixteen states (21 assessments) provided the number of students not tested. The number or percent of students who were exempt or excluded from assessments was given in seven states (9 assessments) and the number or percent of students absent was given in 12 states (18 assessments).
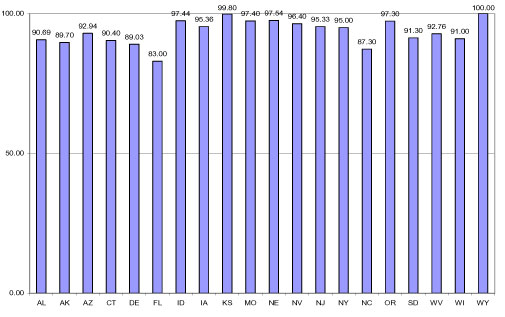
Figure 8 illustrates the participation rates reported in those states for which this information was clearly reported. It is important that states report the percentage of students tested, in addition to just a count, because this presents a more accurate picture of how many students are participating. To summarize participation rate information, we selected one grade, 8th grade, and one subject, math, to portray in Figure 8. This grade and subject area were chosen to remain consistent with past years’ reports. In one state (Kansas) the math assessment was administered in 7th grade; that participation rate was used here. However, not all states provided data broken down in this way. Some states provided math assessment participation data but multiple grade levels were aggregated; or a rate was provided but it was a percent of all students tested who were students with disabilities, rather than a percent of all students with disabilities who were tested. Some states that otherwise reported clear participation rates for students with disabilities did not administer a middle school level math test. States which for any of these reasons did not report clear participation rates for the 8th grade math test are not included in Figure 8. During the 2004-2005 academic year, participation rates ranged from 83% to 100%; 10 of the 20 states had participation rates of 95% or higher.
Figure 8. Percentages of Students with Disabilities Participating in Middle School Regular Math Assessments in Those States with Clear Reporting of Participation Rates
Alternate Assessment Disaggregated
Participation Results for Students with
Disabilities
Figure 9 illustrates how states reported participation for their alternate assessments. Many more states provided participation information this year compared to the previous testing year, 2003-2004, in which only 35 states provided participation data. In 2004-2005, 46 states provided participation information for some or all of their alternate assessments, for a total of 53 assessments. Appendix F outlines in more detail the methods used in reporting this information.
Figure 9. Participation Reporting Approaches for Alternate Assessments
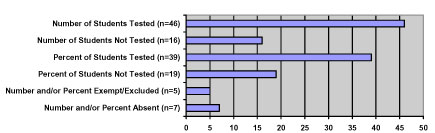
Similar to reporting for the regular assessment, the most common way of reporting participation information for the alternate assessment was to give the number of students tested. This was done by 41 states on their 46 alternate assessments and the number of students not tested was reported by 15 states on their 16 alternate assessments. Thirty-eight states gave a percentage, which was either the percent of students tested (reported for 39 alternate assessments), not tested (reported for 19 alternate assessments), or both. Five states provided the number or percent of students who were exempt or excluded on their five alternate assessments, and seven states provided either the number or percent of students who were absent for their seven alternate assessments.
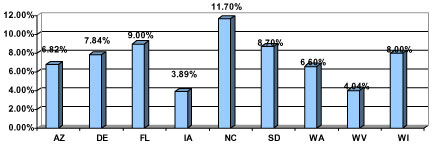
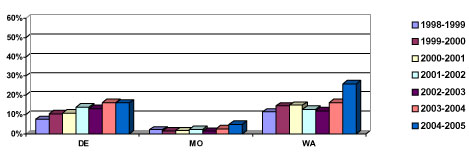
Thirty-eight states provided a percentage of either students tested or not tested. However, not all of these states reported the data clearly for each grade and content area, either aggregating across grade or content, or presenting the percent of all students tested who were students taking the alternate assessment. Figure 10 displays the participation rates for students with disabilities for the 8th grade math test in those states that provided clear participation rates The nine states shown provided information on the percent of students with disabilities who participated in the alternate assessment out of all students with disabilities. (Note: Washington’s data were from a 7th grade assessment).
Figure 10. Percentages of Students with
Disabilities Assessed with the Alternate
Assessment out of the Total Number of
Students with Disabilities
Assessment Performance in 2004-2005
Regular Assessment Performance Results
As with participation data, the way in which states provided performance data for students with disabilities varied (see Appendix G). Figure 11 illustrates the number of assessments with disaggregated performance data and how those performance data were reported. Information is again presented in terms of the number of assessments for which performance data were available, not in terms of the number of states.
Figure 11. Performance Reporting Approaches for Regular Assessments
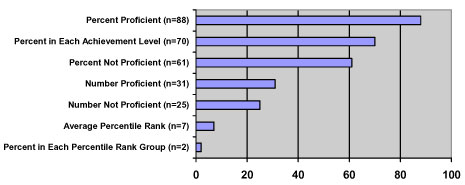
All 50 states (88 assessments total)
reported a rate of proficiency, such as
percent of students with disabilities
who are proficient, which was also the
most common performance reporting
method. Reporting the percent of
students with disabilities in each
achievement level was the next most
common method, used by 40 states (70
assessments). The number proficient,
used by 20 states (31 assessments), and
number not proficient, used by 18 states
(25 assessments),were much less widely
used as a reporting method. The NRT
reporting methods, representing
percentile ranks rather than proficiency
status, were the least frequently used,
probably because only 7% of the state
assessments were NRTs.
For all states that clearly disaggregated performance data for students with disabilities, we examined both the performance of general education students and students with disabilities. When examining performance across states, it is important to remember that state assessments are different, in terms of both content and proficiency levels. The assessments may emphasize different standards and are likely to differ in difficulty. In addition, there is variability across states in the percentage of students with disabilities whose scores are reported. Thus, it is not appropriate to compare performance across states. It is possible, however, to examine the differences in percent of students with and without disabilities achieving proficiency within each state, although it should be noted that this gap is also affected by variability between the participation rates of the two groups. Clearly, comparisons of the gaps across states are also inappropriate.
Performance results are reported for both reading and math assessments because these content domains are the ones assessed by most states and are the first content areas required by NCLB to be assessed, reported, and included in accountability. We included English language arts assessments as reading if the state did not have a specific reading assessment. All of the assessments were CRTs except in Iowa, which used an NRT. For 2004-2005, we do not report performance on exit exams because the distinct exit exams do not include all of the exams used to hold students accountable for graduation requirements. Many of the other graduation requirement exams are also used for NCLB accountability requirements, and we have reported results along with the regular statewide exams used for accountability.
We separated grade levels into three categories: elementary (3-5), middle (6-8), and high school (9-12). For our summary, we chose to present only one grade for each level. When available, 4th grade was used to represent the elementary level, 8th grade to represent the middle school level, and 10th grade to represent the high school level. These grades were chosen because they are the grades at which the most states test students. If data from those grades were not available, the next grades used were 5, 7, and 11. The 3rd grade assessment was used for Missouri’s elementary level reading performance data. Additionally, some of the high school assessments did not specify grade level; these results were included as 10th grade. (See Appendix K for the actual grade used.)
Reading Performance. Figures 12-14 present the reading performance of students. The performance of students with disabilities in reading is generally much lower than the performance of general education students. At the elementary level, New York had the largest difference in percent proficient (49 percentage points) between general education students and students with disabilities. At the middle school level, Alabama had the largest difference in rates of proficiency (58 percentage points). At the high school level, the largest difference in rate (45 percentage points) was shown by Alabama. The states with the smallest difference in percent of students with and without disabilities achieving proficiency were Texas at the elementary level (11 percentage points), Nebraska and Texas at the middle school level (23 percentage points), and Pennsylvania at the high school level (16 percentage points). In general, the reported gaps in student proficiency rates are variable with few evident patterns. One evident pattern is that the gaps increase with grade level. Such a trend must be interpreted with caution, given differences in composition of the two compared groups across increasing grade level (Bielinski & Ysseldyke, 2000). Additionally, there are observably lower proficiency rates in reading at the middle school level than at elementary; however, the assessments at different grade levels may differ in terms of both content and proficiency levels, making comparisons of proficiency rate across grades inappropriate.
Figure 12. Elementary School Reading Performance on the Regular Assessment
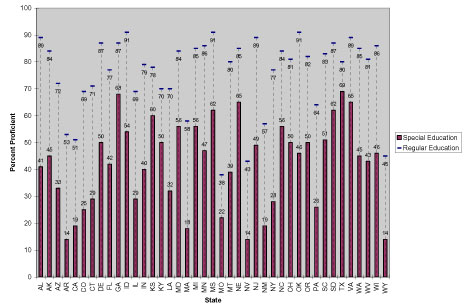
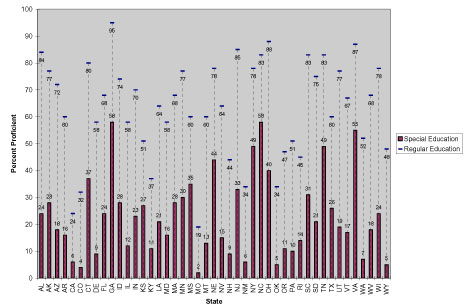
Figure 13. Middle School Reading Performance on the Regular Assessment
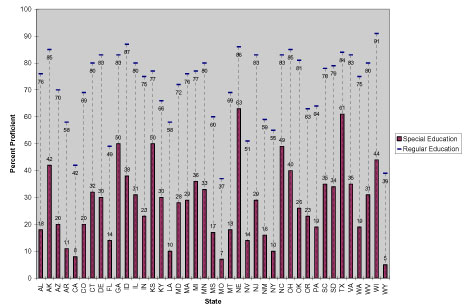
Figure 14. High School Reading Performance on the Regular Assessment
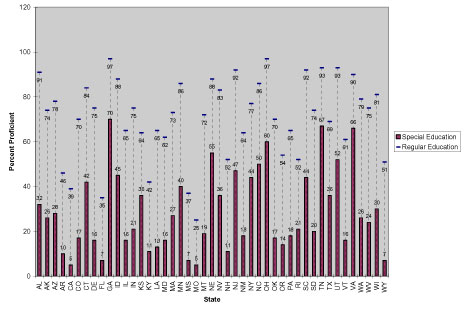
Mathematics Performance. Performance of general education students and students with disabilities on states’ 2004-2005 mathematics assessments is shown in Figures 15-17. In general, the gaps in proficiency rates between students with disabilities and general education students on math assessments were quite similar to the gaps found for reading assessments; they vary considerably from state to state. In elementary grades, the largest difference in the reported percent of students achieving proficiency was 45 percentage points in Alabama. In middle school, the largest difference was 51 percentage points, shared by Alabama and Wisconsin; in high school it was 60 percentage points in Alabama. The states with the smallest differences in percentage of students with and without disabilities reported as proficient were Texas at the elementary level (10 percentage points), Missouri at the middle school level (12 percentage points), and Missouri at the high school level (17 percentage points). As on the reading assessments, the percent of students both with and without disabilities who achieve proficiency is observably lower at middle school than an elementary; interpretation of this trend is again limited by differences in the assessment used at different grade levels.
Figure 15. Elementary School Mathematics Performance on the Regular Assessment
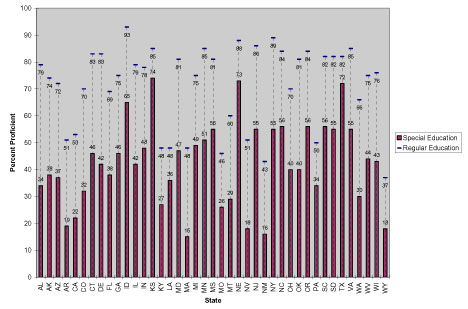
Figure 16. Middle School Mathematics Performance on the Regular Assessment
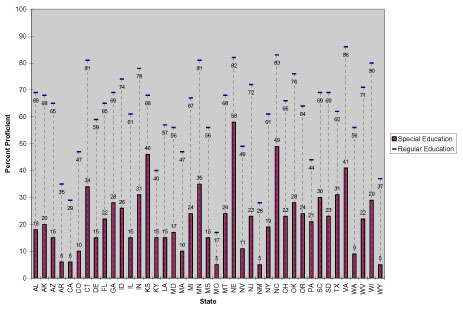
Figure 17: High School Mathematics Performance on the Regular Assessment
Alternate Assessment Performance Results
Figure 18 illustrates the number of alternate assessments with disaggregated performance data and how those performance data were reported. Information is again presented in terms of the number of assessments for which performance data were available, not in terms of the number of states. Appendix H provides details about the assessments and reporting for each of the alternate assessments.
Figure 18. Performance Reporting Approaches for Alternate Assessments (Number of Tests = 59)
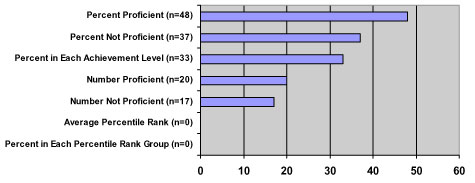
Forty-two states (48 assessments) reported a rate of proficiency—such as percent of students with disabilities who are proficient—which was also the most common performance reporting method. Reporting the percent of students with disabilities in each achievement level was the next most common method for 27 states (33 assessments). The number proficient (20 assessments) and number not proficient (17 assessments) were much less widely used as a reporting method. There were no NRT alternate assessments.
We examined alternate assessment performance data for all states that clearly disaggregated (i.e., by grade level and content area) these data for students with disabilities. Figures representing reading and math performance on the alternate assessment are included in Appendix I. On average, students with disabilities achieved higher rates of proficiency on the alternate assessment than on the general assessment. On the alternate assessment, there were no observable general differences in rates of proficiency across grade levels.
Assessment Performance: Trends
In an earlier analysis (Thurlow et al., 2003), the performance of students with disabilities for states that had at least three years of publicly reported data was examined. In 2000-2001, 13 states had publicly reported information on their statewide assessments for the past three years (California, Delaware, Indiana, Kentucky, Louisiana, Maryland, Minnesota, Missouri, New Jersey, New York, Texas, Utah, and Washington) for both math and reading. Colorado reported three years of information only for the reading assessment and Kansas reported information only for the math assessment. For the current period ending with 2004-2005, 11 states have seven years of publicly reported information on their statewide assessments (California, Colorado, Delaware, Indiana, Kansas, Kentucky, Louisiana, Missouri, New Jersey, New York, and Washington). For Colorado, full data for this period is available for the reading assessment only, and for Kansas for the math assessment only. States included in the trend analysis for 2000-2001 but excluded from the current analysis were the following: Texas and Maryland, which have since changed their assessments and cannot be included in the analysis; Minnesota, which did not report performance information in 2002-2003 (Wiley et al., 2005); and Utah, which aggregated its performance information across all grades in 2003-2004 (Klein et al., 2006).
Reading Tests. Figures 19-21 show the percentage of participating students with disabilities who achieved proficiency on statewide reading assessments at the elementary, middle, and high school levels over the past seven years. In general, the rate of proficiency for participating elementary school students with disabilities continues to increase in reading; 80% of the states included in this analysis have shown such an increase compared to the 2003-2004 school year and most of the states show an overall trend toward greater rates of proficiency for participating students. A few states have spikes or drops in the data across time (California, Louisiana), which may reflect altering assessments for NCLB. At the middle school level, all of the states reported a higher percentage of participating students achieving proficiency than in 2003-2004. While there are evident spikes in 2001-2002 for most states, and other years in California and Louisiana, several states show a trend across these years of increasing rates of proficiency among participating middle school students with disabilities. At the high school level, each of the three states with complete data demonstrate a trend across years toward higher rates of proficiency among those participating.
Figure 19. Seven-Year Trends of the Percentage of Elementary Students with Disabilities who Achieved Proficiency on Statewide Reading Exams
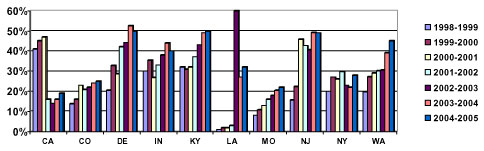
Figure 20. Seven-Year Trends of the Percentage of Middle School Students with Disabilities who Achieved Proficiency on Statewide Reading Exams
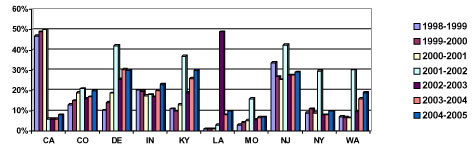
Figure 21. Seven-Year Trends of the Percentage of High School Students with Disabilities who Achieved Proficiency on Statewide Reading Exams
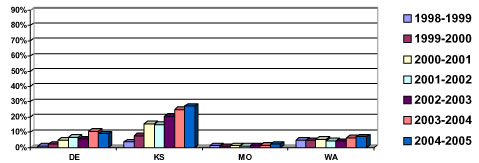
Math Tests. Figures 22-24 show
the percentage of participating students
with disabilities who achieved
proficiency on statewide assessments at
the elementary, middle, and high school
levels for math over the past seven
years. The math trends are similar to
the trends noticed in reading
performance. In general, it appears that
rates of proficiency for participating
elementary school students with
disabilities continue to increase in
reading: 90% of the states included in
this analysis report higher rates of
proficiency than in 2003-2004, and most
of the states show a trend across these
years of higher rates of proficiency for
participating students. Again, data from
some states show spikes or drops
(California, Delaware, and Louisiana)
that do not support a trend. At the
middle school level, 70% of the states
had a higher percentage of participating
students achieving proficiency than in
2003-2004, and most states show an
overall trend across these years of
increasing rates of proficiency among
participating students with
disabilities. At the high school level,
all four states with complete data show
an overall trend across years of
increasing rates of proficiency among
participants.
Figure 22. Seven-Year Trends of the
Percentage of Elementary Students with
Disabilities who Achieved Proficiency on
Statewide Mathematics Exams
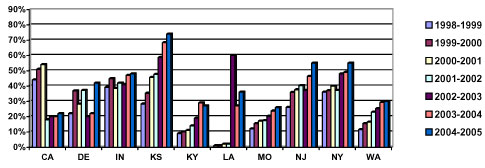
Figure 23. Seven-Year Trends of the Percentage of Middle School Students with Disabilities who Achieved Proficiency on Statewide Mathematics Exams
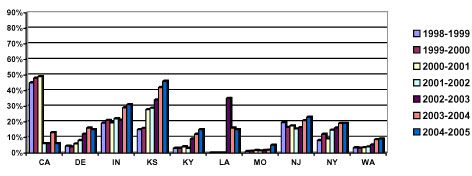
Figure 24. Seven-Year Trends of the Percentage of High School Students with Disabilities who Achieved Proficiency on Statewide Mathematics Exams
Other Information Collected for 2004-2005
In our analysis of state reporting for 2004-2005, we looked at additional characteristics of states’ publicly reported information. Specifically, we looked at information available on accommodations used and how states publicly reported disaggregated student group assessment data. We also conducted a “click” analysis to determine the ease of access to Web-based reporting.
Accommodations
Sixteen states provided state-level information about students who took the general assessment with an accommodation. The same number of states provided accommodations information in 2003-2004. In some cases, states reported on standard accommodations (those considered appropriate and not ones that change the constructs measured by the assessment). In other cases they reported on nonstandard accommodations (which generally were considered to change the constructs measured—and might be referred to as “non-allowed” accommodations or “modifications”—although IEP teams could select them). Last, some states reported on both or did not specify which.
Table 2 summarizes the information the 16 states provided. Appendix J contains additional information about the data provided by these states, with details about the participation and performance of students. Five states reported student participation and performance by specific accommodation (e.g., directions read orally, braille, extended time), and three states indicated that this information was available in their SPP.
Table 2. States that Reported State-Level Information about Accommodations
|
State |
Terminology Used |
By Content/ |
Participation |
Performance |
Comments |
|
Colorado |
Specific Accommodations1 |
Yes/Yes |
Yes |
Yes |
|
Non-Approved Accomm/Mod |
Yes/Yes |
Yes |
No |
|
|
|
Idaho |
Accommodation |
Yes/Yes |
Yes |
Yes |
Reading only; Provides information for Fall 2004 and Winter 2005SWD |
Adaptation |
Yes/Yes |
Yes |
|
||
|
Indiana |
Accommodations |
Yes/Yes |
Yes |
Yes |
Includes only “special ed” |
|
Kansas2 |
Accommodations |
Yes/No |
No |
Yes |
Includes on IEP students |
|
Kentucky |
Accommodations |
Yes/Yes |
Yes |
Yes |
End of Primary and Gr 6 only |
|
Louisiana |
”Calculator Used” |
Yes/Yes |
Yes |
Yes |
Only on ITBS |
|
Michigan |
Standard Accommodations |
Yes/Yes |
Yes |
Yes |
Data broken down by All students, Non sp ed students, and spec ed students & ALL |
Non-Standard Accomm |
Yes/Yes |
Yes |
Yes |
|
|
|
Mississippi |
Specific Accommodations1 |
No/No |
Yes |
No |
|
|
Missouri |
Accommodations |
Yes/Yes |
Yes |
No |
|
|
Nebraska |
Accommodations |
Yes/Yes |
Yes |
No |
ALL |
|
Nevada |
Not-Tested: Modified |
Yes/Yes |
Yes |
No |
ALL |
|
New Mexico |
Specific Accommodations1 |
Yes/No |
No3 |
Yes |
Provides data for both SPED and Non-SPED |
|
North Carolina |
Specific Accommodations1 |
Yes/Yes |
Yes |
Yes |
ALL |
|
Oklahoma2 |
Accommodations |
Yes/No |
Yes |
Yes |
|
|
Utah2 |
Accommodations |
Yes/No |
Yes |
Yes |
|
|
West Virginia |
Accommodations |
Yes/Yes |
Yes |
No |
SWD |
1
Report by specific accommodation (e.g.,
Braille version, Scribe, Assistive
communication device, etc.).
2
From State Performance Plan.
3
Numbers are provided, but without a
denominator.
Assessment Data Disaggregated By Student Group
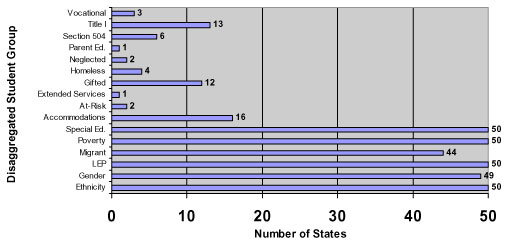
In addition to the six required reporting categories under NCLB—ethnicity, gender, limited English proficiency (LEP), migrant, poverty/low-income, and special education—some states provided assessment data about other disaggregated student groups. Figure 25 displays the number of states that provided participation or performance data for each disaggregated student group. All 50 states reported on four of the NCLB categories: ethnicity, LEP, poverty, and special education. One state did not report by gender, and six states did not report by migrant status. The most common other disaggregated student groups on which states reported assessment results were accommodations (16 states), Title I (13 states), and gifted and talented (12 states).
Figure 25. Number of States that
Provided Disaggregated Assessment Data
for Each Student Group
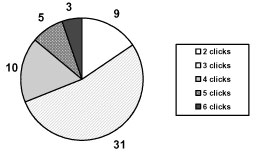
“Click” Analysis of Web-based Reporting
As we analyzed the participation and performance reporting on states’ Department of Education Web sites, it became evident that some states’ data were easier to find than others. Because the Web is used to provide publicly accessible assessment data in most states, it is crucial that these data be clear and easy to access; we therefore examined the ease-of-access to these data. It is important to note, however, that because Web sites are frequently updated, it is possible that some of our findings no longer hold true. It took an average of 3.4 mouse clicks to navigate from the states’ Department of Education homepage to actual data on students with disabilities’ participation and performance on state assessments. Overall, we arrived at disaggregated assessment data in three clicks or less for 41 states. Figure 26 shows the numbers of states in each “click” category.
Figure 26. Number of States in Each
“Click” Category
Overall, all 50 states reported some disaggregated assessment results for students with disabilities, which was an increase from 48 in 2003-2004. Thirty-six states reported participation and performance data for all their general assessments, 12 reported participation and performance data for some of their general assessments, and 2 reported only performance data. When considering only assessments that were part of states’ NCLB accountability systems, more states reported all assessment data publicly: 44 states reported participation and performance data for all these assessments, 4 reported participation and performance data for some of these assessments, and 2 reported only performance data for all of these assessments. There were no states that failed to report some form of disaggregated assessment data for students with disabilities, which was an improvement over two states that did not report these data in 2003-2004. For alternate assessments, 47 states reported some disaggregated assessment results for students with disabilities, a large jump from 36 states in 2003-2004. Forty-one states reported both participation and performance data for their alternate assessments, 2 states reported these data for some of their alternate assessments, 3 states reported only participation data, and 1 state reported only performance data for their alternate assessments. Three states did not report participation or performance data about their alternate assessment, much fewer than the 14 states that did not do so in 2003-2004.
When reporting general assessment participation data for students with disabilities, 43 states reported the number of students tested, the most common way of reporting participation information, while 35 states reported either the percent of students tested or not tested for at least one of their assessments. These numbers did not differ significantly from 2003-2004. However, there was increase in alternate assessment participation data reporting in 2004-2005. The most common way of reporting participation information was to give the number of students tested; this was the approach of 41 states compared to 32 states in 2003-2004. Thirty-eight states gave a percentage (either a percent tested or percent not tested) compared to 20 in 2003-2004.
In terms of reporting regular assessment performance data, all 50 states reported on the percent of students with disabilities who were proficient, and 40 states reported the number of students with disabilities in each achievement level. For states’ alternate assessments, 42 states reported on the percent of students with disabilities who were proficient, while 27 states reported the number of students with disabilities in each achievement level. When we examined student performance on regular assessments, we found that sizeable and variable gaps existed between students with disabilities and general education students. Gaps in percentage of participating students reported as proficient tended to be larger at higher grades; however, meaningful comparison of these gaps across grade levels is limited by differences across grade levels in both the composition of the compared subgroups (Bielinski & Ysseldyke, 2000) and by differences in the assessments themselves at different grades. This difference by grade level in the gap in rate of proficiency was not present in the alternate assessment performance data. Percentages of students with disabilities achieving proficiency on the alternate assessment were typically higher than on the general assessment. In examining seven years of data from states that had publicly reported information using the same assessment (11 states), we found that, in general, there was a trend in both reading and math towards higher rates of proficiency among participating students with disabilities.
Recommendations for Reporting
With the push to provide assessment results in a clear, accessible, and timely manner, Web-based reporting has clearly become the primary vehicle for sharing data with the public. Based on our analyses of publicly reported assessment data, especially disaggregated results for students with disabilities, we make the following recommendations:
-
Report results clearly for each test, subject area, and grade level. One of the most common issues we encountered was locating disaggregated assessment data which was not disaggregated to a level where it was useful. This was especially true for states’ alternate assessments. For example, one state provided disaggregated assessment results for students with disabilities for reading and math, but the results were collapsed across all grade levels. We could not use these data in our analyses, and we assume that these data were of little use to educators, parents, and other stakeholders as well. For this report, we categorized the assessment data as disaggregated if the results for students with disabilities were separated out in any manner, but in future years the results must be clearly disaggregated not only by the student group “students with disabilities” but also by test, subject, and grade level to be considered fully disaggregated.
-
Report the percentage of students tested in each student group. Reporting a percentage provides a more accurate picture of participation in the state assessment system than simply reporting on the number of students tested. However, for a group such as students with disabilities with a relatively small number of students, using total grade level enrollment as the denominator provides a very small and less useful percentage. States improve the utility of their data when they provide a percentage with the total subgroup grade level enrollment as the denominator: the percent of 3rd grade students with disabilities tested out of the total number of 3rd grade students with disabilities, for example. Reporting that 95% of students with disabilities participated in the state assessment system is more useful than reporting that 6% of students who participated in the state assessment system were students with disabilities.
-
Clearly report proficiency levels. States vary in their terminology for levels of proficiency. Some states are very clear as to which levels indicate proficiency and which levels indicate non-proficiency, while some states use terminology that makes it difficult to determine this distinction. We recommend clearly labeling each level as “proficient” or “not proficient.” States could add additional levels to this dichotomous system (e.g., highly proficient, well below proficient) as long as the “proficient” and “not proficient” distinctions are obvious.
-
Report the number and percent of students with disabilities using accommodations. This recommendation remains from the 2003-2004 report as no progress was noted in this area. Many students with disabilities are not able to take the general assessment in the standard format, and thus are provided with accommodations. Many states consider the scores of some of these accommodated assessments either to not count or to count as “not-proficient” because they are non-standard accommodations. In some states, the number of students participating using non-standard accommodations is quite high. If these numbers are not reported, then the picture painted of how all students are doing will be inaccurate. It is important to know the extent to which students are using accommodations, and specifically those accommodations that result in the removal of their scores.
-
Clearly label state assessment results on the states’ Department of Education home-page. To ensure easily accessible Web-reported state assessment data, states should have a clearly labeled link to these data from the states’ Department of Education homepage. For example, the link on the homepage could read “2004-2005 State Assessment Results” and lead to the assessment results page, which in turn could have a clear link to disaggregated assessment results for students with disabilities (e.g., “Assessment Results for Students with Disabilities”).
-
Report on all statewide assessments. Some states purposefully asked us not to include certain non-accountability assessments in our analysis. Though this request may have been made for a number of reasons, the most obvious reason was that there was little or no publicly reported data for these assessments. We recommend that states publicly report all statewide assessment data, whether or not the assessment is part of the accountability system. These data may be very useful for educators, administrators, parents, and researchers, and should be readily available.
Bielinski, J., & Ysseldyke, J. (2000). Interpreting trends in the performance of special education students (Technical Report 27). Minneapolis, MN: University of Minnesota, National Center on Educational Outcomes.
Goertz, M., & Duffy, M. (2003). Mapping the landscape of high-stakes testing and accountability programs. Theory Into Practice, 42(1), 4-11.
Klein, J.A., Wiley, H.I., & Thurlow, M.L. (2006). Uneven transparency: NCLB tests take precedence in public assessment reporting for students with disabilities (Technical Report 43). Minneapolis, MN: University of Minnesota, National Center on Educational Outcomes.
McGrew, K.S., Thurlow, M.L., Shriner, J.G., & Spiegel, A.N. (1992). Inclusion of students with disabilities in national and state data collection programs (Technical Report 2). Minneapolis, MN: University of Minnesota, National Center on Educational Outcomes.
Petersen, G.J., & Young, M.D. (2004). The No Child Left Behind Act and its influence on current and future district leaders. Journal of Law and Education, 33(3), 343-363.
Thurlow, M. L., & Wiley, H. I. (2004). Almost there in public reporting of assessment results for students with disabilities (Technical Report 39). Minneapolis, MN: University of Minnesota, National Center on Educational Outcomes.
Thurlow, M. L., Wiley, H. I., & Bielinski, J. (2003). Going public: What 2000-2001 reports tell us about the performance of students with disabilities (Technical Report 35). Minneapolis, MN: University of Minnesota, National Center on Educational Outcomes.
Wiley, H. I., Thurlow, M. L., & Klein, J. A. (2005). Steady progress: State public reporting practices for students with disabilities after the first year of NCLB (2002-2003). (Technical Report 40). Minneapolis, MN: University of Minnesota, National Center on Educational Outcomes.
Zlatos, B (1994). Don’t test, don’t tell: Is "academic red-shirting" skewing the way we rank our schools? The American School Board Journal (181), 24-28.
Verification Letter to State Assessment Director
The National Center on Educational Outcomes is examining states’ public reports on 2004-2005 school year assessment results. Our goal is to (a) identify all components of each state’s testing system, (b) determine whether each state reports disaggregated test results for students with disabilities, (c) describe the way participation and performance information is presented, and (d) describe how states report results for students who took the test with accommodations or modifications.
We have reviewed your Web site for test information, including both participation and performance data on your statewide assessments. Enclose are tables highlighting our findings from that review. A blank field indicates that we did not find information in that area. Please verify all included information and provide us with information that we could not find on your Web site. Also, if there is publicly reported information available for your state, please provide us with the public document and/or website that contains the accurate information. Address your responses to Gretchen VanGetson at the above address or via fax at (612) 624-0879.
If you have any questions about our request, please call Gretchen VanGetson at (612) 626-0658 or email: vang0603@umn.edu. If we do not hear from you by March 3, 2006, we will assume there is no additional publicly available information.
Thank you for taking the time to provide this information.
Sincerely,
Gretchen VanGetson
Graduate Research
Assistant
Martha Thurlow
Director
Table 1: Tests Administered and Results Found
Please review this table for its accuracy, make any changes (if necessary), and fill in any blank fields.
|
State |
Test |
Grades Tested |
Subject Areas |
Is Disaggregated Info for Students with Disabilities Reported (Yes/No) |
Is this test part of the state accountability system? (Yes/No) |
|
|
AL |
|
Participation |
Performance |
|
||
|
Direct Assessment of Writing (DAW) [CRT] |
5,7,10 |
Holistic Composition, Writing Mechanics, Sentence Formation, Grammar and Usage |
Yes |
Yes |
Yes |
|
|
Alabama High School Graduation Exam (AHSGE) [EXIT] |
11,12 |
Reading, Language, Math, Science, Social Studies |
Yes |
Yes |
Yes |
|
|
Stanford Achievement Test, 10th ed. (SAT-10) [NRT] |
3-8 |
Reading, Language, Math, Science (5,7), Social Science (6) |
Yes |
Yes |
No |
|
|
Alabama Reading and Mathematics Test (ARMT) [CRT] |
3-8 |
Reading, Math |
Yes |
Yes |
Yes |
|
|
Alabama Alternate Assessment (AAA) *AAS |
1-8, 10,11 |
Reading, Math |
Yes |
Yes |
Yes |
|
*AAS=based on alternate achievement
standards
*GLAS=based on grade level achievement
standards
*Other
Table 2: Participation Information for Students with Disabilities
Please review this table, which describes the way in which participation data are publicly reported in your state. A “Y” indicates information is reported in this way. Please add a “Y” if you know of any other method of participation reporting, and please provide us with the information that is reported in that way (either a hard copy or a Web-link).
|
State |
Test |
Number Tested |
Number Not Tested |
Number Exempt |
Number Excluded |
% of students tested |
% of students not tested |
% Exempt |
% Excluded |
Number and/or Percent Absent |
|
AL |
DAW |
Y |
|
|
|
Y |
|
|
|
|
|
AHSGE |
Y |
|
|
|
Y |
|
|
|
|
|
|
SAT-10 |
Y |
|
|
|
Y |
|
|
|
|
|
|
ARMT |
Y |
|
|
|
Y |
|
|
|
|
|
|
AAA |
Y |
|
|
|
Y |
|
|
|
|
Table 3: Performance Information for Students with Disabilities
Please review this table, which describes the way in which performance data are publicly reported in your state. A “Y” indicates information is reported in this way. Please add a “Y” if you know of any other method of performance reporting, and please provide us with the information that is reported in that way (either a hard copy or a Web-link).
|
State |
Test |
% in each achievement level |
% in each PR* group |
% proficient |
% not proficient |
Number proficient |
Number not proficient |
Avg. PR* |
|
AL |
DAW |
Y |
|
Y |
Y |
|
|
|
|
AHSGE |
Y |
|
Y |
Y |
|
|
|
|
|
SAT-10 |
|
|
|
|
|
|
Y |
|
|
ARMT |
Y |
|
Y |
Y |
|
|
|
|
|
AAA |
Y |
|
Y |
Y |
|
|
|
*=Percentile Rank
Table 4: Accommodations
We are interested in examining if and how states report information about students who take assessments using accommodations. Please change our responses (if necessary) to reflect information that is reported for your state. If you do make changes, please provide us with the information (either a hard-copy or a Web-link).
|
Test |
Standard Administration |
Nonstandard Administration |
||
|
|
Participation |
Performance |
Participation |
Performance |
|
DAW |
No |
No |
No |
No |
|
AHSGE |
No |
No |
No |
No |
|
SAT-10 |
No |
No |
No |
No |
|
ARMT |
No |
No |
No |
No |
|
AAA |
No |
No |
No |
No |
If yes, complete Table 5
Table 5: Participation and Performance for Students Tested with Accommodations
If there are any “Yes” responses in Table 4, please review this table for its accuracy and make any changes (if necessary).
|
Grade |
Subject |
Accommodation |
Participation |
Percent Proficient |
|
|
|
|
|
|
|
|
|
|
Figure 1: Disaggregated Reporting Groups by State
This figure includes the different student groups for which your state publicly reports disaggregated data. Please change our responses (if necessary) to reflect information that is reported for your state. If you do make changes, please provide us with the information (either a hard-copy or a Web-link).
YES
Special
Education or Disability
YES
Gender
YES
Ethnicity
YES
Migrant/Enrollment Mobility/Less than
One Year
YES
Limited
English Proficiency
YES
Poverty,
Low-Income, Economically Disadvantaged,
Free/Reduced Lunch
NO
Gifted
and Talented
NO
Accommodations
NO
Title I
NO
Neglected
or Delinquent
NO
Homeless
NO
Extended
School Services
NO
Parent
Education
NO
Section
504 Plan
NO
At-Risk/Targeted Assistance
NO
High
School Vocational/Career/Technology
Appendix B
Letters to State Directors of Special Education
(Two forms depending on input from Assessment Director. Example here is if letter was verified by the Assessment Director. If no verification, letter was the same as in Appendix A. Also, the table format is the same as in Appendix A.)
The National Center on Educational Outcomes is examining states’ public reports on 2004-2005 school year assessment results. Our goal is to (a) identify all components of each state’s testing system, (b) determine whether each state reports disaggregated test results for students with disabilities, (c) describe the way participation and performance information is presented, and (d) describe how states report results for students who took the test with accommodations or modifications. We have reviewed your state’s Web site for test information, including both participation and performance data on your statewide assessments. Enclosed are tables highlighting our findings from that review. A blank field indicates that we did not find information in that area. These tables have been verified by your state’s Assessment Director; please notify me if you have anything to add.
Please verify all included information and provide us with information that we could not find on your Web site. Also, if there is additional publicly reported information available for your state, please provide us with the public document and/or Web site that contains the accurate information. Address your responses to Gretchen VanGetson at the above address or via fax at (612) 624-0879.
If you have any questions about our request, please call Gretchen VanGetson at (612) 626-0658 or email: vang0603@umn.edu. If we do not hear from you by April 14, 2006, we will assume there is no additional publicly available information. Thank you for taking the time to provide this information.
Sincerely,
Gretchen VanGetson
Graduate Research Assistant
Martha Thurlow
Director
Appendix C
2004-2005 State
Assessment Systems and Status of
Disaggregated Data
|
State |
Assessment Component |
Grades |
Subject |
Disaggregated Special Education Data |
Test Used for State Accountability Purposes |
|
|
Part |
Perf |
|||||
|
Alabama |
Direct Assessment of Writing (DAW) [CRT] |
5,7,10 |
Holistic Composition, Writing Mechanics, Sentence Formation, Grammar and Usage |
Yes |
Yes |
Yes |
|
Alabama High School Graduation Exam (AHSGE) [EXIT] |
11,12
|
Reading, Language, Math, Science, Social Studies |
Yes |
Yes |
Yes |
|
|
Stanford Achievement Test, 10th ed. (SAT-10) [NRT] |
3-8 |
Reading, Language, Math, Science (5,7), Social Studies (6) |
Yes |
Yes |
No |
|
|
Alabama Reading and Mathematics Test (ARMT) [CRT] |
3-8 |
Reading, Math |
Yes |
Yes |
Yes |
|
|
Alaska |
Standards Based Assessment (SBA) [CRT] |
3-9 |
Reading, Math, Writing |
Yes |
Yes |
Yes |
|
High School Graduation Qualifying Exam (HSGQE) [EXIT] |
10 |
Reading, Math, Writing |
Yes |
Yes |
Yes |
|
|
TerraNova/CAT-6 [NRT] |
5,7 |
Reading, Language Arts, Math, Science, Social Studies |
No |
No |
No |
|
|
Arizona |
TerraNova [NRT] |
2,9 |
Reading/Language Arts, Math |
No |
No |
No |
|
Arizona Instrument to Measure Standards (AIMS) [CRT/NRT] |
3-8 |
Reading, Math, Writing |
Yes |
Yes |
Yes |
|
|
AIMS High School (AIMS HS) [EXIT] |
10 (11,12) |
Reading, Math, Writing |
Yes |
Yes |
Yes |
|
|
Arkansas |
Iowa Tests of Basic Skills (ITBS) [NRT] |
K-9 |
Reading Comprehension, Math, Problem Solving |
No |
No |
No |
|
Arkansas Benchmark Exams (including End-of-Course; ABE) [CRT] |
3-8,9,11 |
Literacy (3-8,11), Math (3-8), EOC–Algebra I (9), EOC-Geometry (9) |
Yes |
Yes |
Yes |
|
|
California |
California Standards Tests (CSTs) [CRT] |
2-11 |
English Language Arts, Math (2-9), Science (5,8), Math End-of-Course (8-11), History-Social Science (8,10,11), Science End-of-Course (9-11) |
Yes |
Yes |
Yes |
|
Spanish Assessment of Basic Education (SABE/2) [NRT] |
2-11 |
Spanish Reading, Language, Math, Spelling |
Yes |
Yes |
No |
|
|
California Achievement Test, 6th ed. (CAT-6) [NRT] |
3,7 |
Reading, Language, Math, Spelling |
Yes |
Yes |
Yes |
|
|
Colorado |
Colorado Student Assessment Program (CSAP) [CRT] |
3-10 |
Reading, Spanish Reading (3,4), Math, Writing, Spanish Writing (3,4), Science (8) |
Yes |
Yes |
Yes |
|
Connecticut |
Connecticut Mastery Test (CMT) [CRT] |
4,6,8 |
Reading, Math, Writing |
Yes |
Yes |
Yes |
|
Connecticut Academic Performance Test (CAPT) [CRT] |
10 |
Reading, Math, Writing, Science |
Yes |
Yes |
Yes |
|
|
Delaware |
Delaware Student Testing Program (DSTP) [NRT/CRT] |
2-11 |
Reading (2-10), Math (2-10), Writing (2-10), Science (4,6,8,11), Social Studies (4,6,8,11) |
Yes |
Yes |
Yes (for Reading, Writing, and Math in grades 3-8 & 10) |
|
Florida |
Florida Comprehensive Assessment Test (FCAT), includes SAT-9 [NRT/CRT] |
3-11 |
Reading (3-10), Math (3-10), Writing (4,8,10), Science (5,8,11) |
Yes |
Yes |
Yes |
|
Georgia |
End of Course Tests (EOCT) [CRT] |
9-12 |
English Literature and Composition (9), American Literature and Composition, Algebra, Geometry, Biology, Physical Science, US History, Economics/Business/Free Enterprise |
Yes |
Yes |
No |
|
Georgia High School Graduation Test (GHSGT) [EXIT] |
11 |
English/Language Arts, Math, Science, Social Studies, Writing |
Yes |
Yes |
Yes (ELA and Math only) |
|
|
Criterion-Referenced Competency Tests (CRCT) [CRT] |
1-8 |
Reading, English/Language Arts, Math, Science (3-8), Social Studies (3-8) |
Yes |
Yes |
Yes (Reading, ELA, and Math only) |
|
|
Writing Assessment (WA) [CRT] |
3,5,8,11 |
Writing |
Yes |
Yes |
Yes |
|
|
Hawaii |
Hawaii State Assessment (HSA) [CRT] |
3-8,10 |
Reading, Math |
Yes |
Yes |
Yes |
|
Idaho |
Idaho Direct Assessments (DMA/DWA) [CRT] |
4-9 |
Math (4,6,8), Writing (5,7,9) |
Yes |
Yes |
No |
|
Idaho Standards Achievement Tests (ISAT) [CRT] |
3-8, 10 |
Reading, Language Usage, Math, Science (5,7,10) |
Yes |
Yes |
Yes |
|
|
Idaho Reading Indicator (IRI) [CRT] |
K-3 |
Reading |
Yes |
Yes |
No |
|
|
Illinois |
Illinois Standards Achievement Test (ISAT) [CRT] |
3,4,5,7,8 |
Reading (3,5,8), Math (3,5,8), Science (4,7) |
Yes |
Yes |
Yes |
|
Prairie State Achievement Exam (PSAE) [CRT] |
11 |
Reading, Math, Science |
Yes |
Yes |
Yes |
|
|
Illinois Measure of Annual Growth in English (IMAGE) [CRT] |
3,5,8,11 |
Reading, Math |
Yes |
Yes |
Yes |
|
|
Indiana |
Indiana Statewide Testing for Educational Progress (ISTEP+) [NRT/CRT] |
3-9 |
English Language Arts, Math, Science (5) |
Yes |
Yes |
Yes |
|
Graduation Qualifying Exam (GQE) [EXIT] |
10 |
English Language Arts, Math |
Yes |
Yes |
Yes |
|
|
Core 40 End-of-Course Assessments (ECAs) [CRT] |
Various |
English 11, Algebra 1 |
No |
No |
No |
|
|
Iowa |
Iowa Tests of Basic Skills/Iowa Tests of Educational Development (ITBS/ITED) [NRT] |
3-12 (only report on grades 4,8,11) |
Reading, Math, Science (8,11) |
Yes
|
Yesa |
Yes (Reading and Math only) |
|
Kansas |
Kansas Assessment System (KAS) [CRT]
|
4-8, 10, 11 |
Reading (5,8,11), Math (4,7,10), Science (4,7,10), Social Studies (6,8,11) |
Yes |
Yes |
Yes |
|
Kentucky |
Comprehensive Test of Basic Skills, 5th ed. (CTBS/5) [NRT] |
End of Primary, 6 |
Reading, Language, Math |
Yes |
Yes |
Yes |
|
Kentucky Core Content Test (KCCT) [CRT] |
4,5,7,8,10, 11 |
Reading (4,7,10), Math (5,8,11), Writing Portfolio and On-Demand (4,7), Science (4,7,11), Social Studies (5,8,11), Arts & Humanities (5,8), Practical Living & Vocational Studies (5,8) |
Yes |
Yes |
Yes |
|
|
Louisiana |
Louisiana Educational Assessment Program (LEAP 21) [CRT] |
4,8 |
English, Math, Science, Social Studies |
Yes |
Yes |
Yes |
|
Graduation Exit Exam (GEE 21) [EXIT] |
10, 11 |
English, Math, Science, Social Studies |
Yes |
Yes |
Yes |
|
|
Iowa Tests of Basic Skills/Iowa Tests of Educational Development (ITBS/ITED) [NRT] |
3,5,6,7,8,9 |
Reading, Language, Math, Science, Social Studies |
Yes |
Yes |
Yes |
|
|
Maine |
Maine Educational Assessment (MEA) [CRT] |
4,8,11 |
Reading, Math, Writing, Science & Technology |
Yes |
Yes |
Yes |
|
Maryland |
Maryland School Assessment (MSA) [CRT] |
3-8 |
Reading, Math |
Yes |
Yes |
Yes |
|
High School Assessment (HSA) [CRT] |
9-12 |
English 2, Geometry, Biology, Government, Algebra |
Yes |
Yes |
Yes |
|
|
Massachusetts |
Massachusetts Comprehensive Assessment System (MCAS) [CRT] |
3-8,10 |
Reading (3), English Language Arts (4,7,10), Math (4,6,8,10), Science/Technology (5,8) |
Yes |
Yes |
Yes |
|
Michigan |
Michigan Educational Assessment Program (MEAP) [CRT] |
4,5,7,8
|
Reading (4,7), Math (4,8), Writing (4,7), Science (5,8), Social Studies (5,8), Listening (4,7) |
Yes
|
Yes |
Yes |
|
Minnesota |
Minnesota Comprehensive Assessment (MCA) [CRT] |
3,5,7,10,11 |
Reading (3,5,7,10), Math (3,5,7,11), Writing (5,10) |
Yes |
Yes |
Yes |
|
Mississippi |
Mississippi Curriculum Test (MCT) [CRT] |
2-8 |
Reading, Language, Math |
Yes |
Yes |
Yes |
|
TerraNova [NRT] |
6 |
Reading, Language, Math |
No |
Yes |
No |
|
|
Writing Assessment (WA) [CRT] |
4,7 |
Writing |
No |
Yes |
No |
|
|
Subject Area Testing Program (SATP) [CRT] |
9-12 |
Algebra I, US History, Biology, English II |
No |
Yes |
Yes |
|
|
Missouri |
Missouri Assessment Program (MAP) (TerraNova survey) [NRT/CRT] |
3,4,7,8,10, 11 |
Communication Arts (3,7,11), Math (4,8,10), Science (3,7,10), Social Studies (4,8,11) |
Yes |
Yes |
Yes (not science or social studies) |
|
Montana |
Iowa Tests of Basic Skills/ Iowa Tests of Educational Development (ITBS/ITED) [NRT] |
4,8,11 |
Reading, Math, Language Arts, Science, Social Studies |
Yes |
Yes |
Yes |
|
Measured Progress (MP) [CRT] |
4,8,10 |
Reading, Math |
No |
Yes |
Yes |
|
|
Nebraska |
Nebraska Statewide Writing Assessment (NSWA) [CRT] |
4,8,11 |
Writing |
Yes |
Yes |
Yes |
|
School-based Teacher-led Assessment and Reporting System (STARS) [CRT] |
4,8,11 |
Math, Reading |
Yes |
Yes |
Yes |
|
|
Nevada |
Iowa Tests of Basic Skills/ Iowa Tests of Educational Development (ITBS/ITED) [NRT] |
4,7,10 |
Reading, Math, Science, Language |
Yes |
Yes |
Yes |
|
Nevada Criterion Referenced Test (NCRT) [CRT] |
3,5,8 |
Reading, Math, Science (5,8) |
Yes |
Yes |
Yes |
|
|
High School Proficiency Exam (HSPE) [EXIT] |
10-11 |
Reading, Math, Writing (11) |
Yes |
Yes |
Yes |
|
|
Nevada Analytic Writing Exanimation (NAWE) [CRT] |
4,8 |
Writing |
Yes |
Yes |
Yes |
|
|
New Hampshire |
New Hampshire Educational Improvement and Assessment Program (NHEIAP) [CRT] |
3,6,10 |
Reading, Math |
Yes |
Yes |
Yes |
|
New Jersey |
New Jersey Assessment of Skills and Knowledge (NJ-ASK) [CRT] |
3,4 |
Language Arts Literacy, Math, Science (4) |
Yes |
Yes |
Yes |
|
Grade Eight Proficiency Assessment (GEPA) [CRT] |
8 |
Language Arts Literacy, Math, Science |
Yes |
Yes |
Yes |
|
|
High School Proficiency Assessment (HSPA) [EXIT] |
11 |
Language Arts Literacy, Math, Writing |
Yes |
Yes |
Yes |
|
|
New Mexico |
New Mexico Standards Based Assessment (NMSBA) [CRT] |
3-9 |
Reading/Writing, Math, Science |
Yes |
Yes |
Yes |
|
New Mexico High School Standards Assessment (NMHSSA) [EXIT] |
11 |
Reading/Writing, Math, Science |
Yes |
Yes |
Yes |
|
|
New York |
Regents Comprehensive Exams (RCE) [EXIT] |
9-12 |
English, Foreign Languages, Math, Global History & Geography, US History & Government, Living Environment, Earth Science, Chemistry, Physics |
Yes |
Yes |
Yes (English and Math only) |
|
Regents Competency Test (RCT) [EXIT] |
9-12 |
Reading, Math, Science, Writing, Global Studies, US Hist & Gov’t |
Yes |
Yes |
Yes (Reading, Math, and Writing only) |
|
|
New York State Assessment Program (NYSAP) [CRT] |
3-8 |
English Language Arts, Math, Science, Social Studies
|
Yes |
Yes |
Yes |
|
|
North Carolina |
End-of-Grade (EOG) [CRT] |
3-8 |
Reading, Math |
Yes |
Yes |
Yes |
|
End-of-Course (EOC) [CRT] |
9-12 |
Biology, Chemistry, Physics, English I, Physical Science, Algebra I & II, Geometry |
Yes |
Yes |
Yes |
|
|
Grade 3 Pretest [CRT] |
3 |
Reading, Math |
Yes |
Yes |
Yes |
|
|
North Dakota
|
North Dakota State Assessment (NDSA) [NRT/CRT] |
3-8,11 |
Reading/Language, Math |
Yes |
Yes |
Yes |
|
Ohio |
Achievement Tests (AT) [CRT] |
3-5,7,8 |
Reading (3,4,5,8), Math (3,7,8), Writing (4) |
No |
Yes |
Yes |
|
Ohio Proficiency Tests (OPT) [CRT] |
4,6 |
Reading (6), Math (4,6), Writing (6), Science (4,6), Citizenship (4,6) |
No |
Yes |
Yes |
|
|
Ohio Graduation Tests (OGT) [EXIT] |
10 |
Reading, Writing, Math, Science, Social Studies |
No |
Yes |
Yes |
|
|
Oklahoma |
Oklahoma Core Curriculum Tests (OCCT) [CRT] |
3,4,5,7,8 |
Reading (3,4,5,8), Math (3,4,5,8), Science (5,8,), Social Studies (5), History/Government (8), Geography (7) |
Yes |
Yes |
Yes |
|
End-of-Instruction Tests (EOI) [CRT] |
9-12 |
English II, U.S. History, Algebra I, Biology I |
Yes |
Yes |
Yes |
|
|
Oregon |
Oregon Statewide Assessment (OSA) [CRT]
|
3,4,5,7,8,10
|
Reading/Literature (3,5,8,10), Math (3,5,8,10), Writing (4,7,10), Science (5,8,10) |
Yes |
Yes |
Yes |
|
Pennsylvania |
Pennsylvania System of School Assessment (PSSA) [CRT] |
3,5,8,11 |
Reading, Math, Writing (11) |
Yes |
Yes |
Yes (Reading and Math only) |
|
Rhode Island |
New Standards Reference Examinations (NSRE) [CRT] |
11 |
English/Language Arts, Math |
Yes |
Yes |
Yes |
|
Developmental Reading Assessment (DRA) [CRT] |
K,1 |
Reading |
No |
No |
Yes |
|
|
South Carolina |
Palmetto Achievement Challenge Tests (PACT) [CRT] |
3-8 |
English/Language Arts, Math, Science, Social Studies |
Yes |
Yes |
Yes |
|
High School Assessment Program (HSAP) [EXIT] |
10 |
English/Language Arts, Math |
Yes |
Yes |
Yes |
|
|
South Dakota
|
Dakota STEP Test (STEP) [NRT/CRT] |
3-8, 11 |
Reading, Math |
Yes |
Yes |
Yes |
|
Stanford Writing Assessment (SWA) [NRT] |
5,9 |
Writing |
No |
No |
No |
|
|
Tennessee |
Tennessee Comprehensive Assessment Program Achievement Test (TCAP-AT) [CRT] |
3-8 |
Reading/Language Arts, Math, Science, Social Studies |
No |
Yes |
Yes |
|
Writing Test (WT) [CRT] |
5,8,11 |
Writing |
No |
No |
No |
|
|
TCAP Secondary Assessments (TCAP-SA) [CRT] |
9-12 |
Algebra I, Biology, English I & II, Math Foundations, Physical Science, US HIstory |
No |
Yes |
Yes |
|
|
Texas |
Texas Assessment of Knowledge and Skills (TAKS) [CRT] |
3-11 (Grade 11 Exit Exam)
|
Reading (3-9), Math, English Language Arts (10,11), Writing (4,7), Science (5,10,11), Social Studies (8,10,11); Spanish version administered in grades 3-6. |
Yes |
Yes |
Yes |
|
Reading Proficiency Tests in English (RPTE) [CRT] |
3-12 |
English Reading Proficiency |
No |
No |
No |
|
|
Utah |
Iowa Tests of Basic Skills/ Iowa Tests of Educational Development (ITBS/ITED) [NRT] |
3,5,8,11 |
Reading, Language, Math, Science, Social Studies |
No |
Yes |
Yes |
|
Core Criterion-Referenced Tests (CCRT) [CRT] |
1-11 |
Language Arts, Math, Science (4-11) |
Yes |
Yes |
Yes |
|
|
Direct Writing Assessment (DWA) [NRT] |
6,9 |
Writing |
No |
No |
No |
|
|
Utah Basic Skills Competency Test (UBSCT) [EXIT] |
10 (11 and 12) |
Reading, Writing, Math |
Yes |
Yes |
Yes |
|
|
Vermont |
New Standards Reference Exam (NSRE) [CRT] |
10 |
English/ Language Arts, Math |
Yes |
Yes |
Yes |
|
Vermont Developmental Reading Assessment (DRA) [CRT] |
2 |
Reading |
Yes |
Yes |
Yes |
|
|
Virginia |
Standards of Learning (SOL) [CRT] |
3,5,8, High School |
English Language Arts, Math, History/Social Science, Science, Content Specific History (high school) |
Yes |
Yes |
Yes |
|
Washington |
Washington Assessment of Student Learning (WASL) [CRT] |
4,5,7,8,10 |
Reading (4,7,10), Math (4,7,10), Writing (4,7,10), Science (5,8,10) |
Yes |
Yes |
Yes |
|
Iowa Tests of Basic Skills/Iowa Tests of Educational Development (ITBS/ITED) [NRT] |
3,6,9 |
Reading, Math, Language (6), Expression (9) |
No |
No |
No |
|
|
West Virginia |
West Virginia Educational Standards Test (WESTEST) [CRT] |
3-8 and 10 |
Reading/Language, Math, Science, Social Studies |
Yes |
Yes |
Yes |
|
West Virginia Writing Assessment (WVWA) [CRT] |
4,7,10 |
Writing |
No |
No |
No |
|
|
ACT EXPLORE [NRT] |
8 |
English, Math, Reading, Science |
No |
No |
No |
|
|
ACT PLAN [NRT] |
10 |
English, Math, Reading, Science |
No |
No |
No |
|
|
Wisconsin |
Wisconsin Knowledge and Concepts Exam (WKCE) [CRT] |
4,8,10 |
Reading, Language Arts, Math, Science, Social Studies |
Yes |
Yes |
Yes |
|
Wisconsin Reading Comprehension Test (WRCT) [CRT] |
3 |
Reading |
Yes |
Yes |
Yes |
|
|
Wyoming |
Wyoming Comprehensive Assessment System (WyCAS) [CRT] |
4,8,11 |
Reading, Writing, Math |
Yes |
Yes |
Yes |
a Data are presented for 2003-04 and 2004-05 combined,
and not disaggregated in a way that they
can be reported for 2004-05 only.
Unique States
|
State |
Assessment Component |
Grades |
Subject |
Disaggregated Special Education Data |
Test Used for State Accountability Purposes |
|
|
Part |
Perf |
|||||
|
American Samoa |
Stanford Achievement Test – 10th Edition (SAT-10) [NRT] |
3-8,10,12 |
Complete battery |
Yes
|
Yes |
Yes |
|
Bureau of Indian Affairs |
Students take the assessment of the state in which they live |
|
|
Yes |
Yes |
Unknown |
|
Commonwealth of the Northern Mariana Islands |
Stanford Achievement Test- 10th Edition (SAT-10) [NRT] |
3,5,6,8,9,11 |
Reading, Math, Social Science, Science |
Yes (Reading and Math) |
Yes (Reading and Math) |
Yes |
|
Standards Based Assessment (SBA) [CRT] |
3,4,7,8,10, 11 |
Reading OR Math |
Yes |
Yes |
Yes |
|
|
Department of Defense Education Activity |
TerraNova [NRT] |
3-11 |
Reading, Language Arts, Math, Science, Social Studies |
No |
No |
Unknown |
|
District of Columbia |
Stanford Achievement Test- 9th Edition (SAT-9) [NRT] |
1-12 |
Reading, Math |
Yes |
Yes |
Yes |
|
Federated States of Micronesia |
Unknown |
Unknown |
Unknown |
No |
No |
Unknown |
|
Guam |
Stanford Achievement Test- 10th Edition (SAT-10) [NRT] |
1-12 |
Reading, Math, Language |
Yes |
Yes |
Yes |
|
Palau |
Palau Achievement Test [NRT] |
4,6,8,10 |
Reading, Math |
No |
No |
Unknown |
|
Puerto Rico |
PPAA |
Unknown |
Unknown |
No |
No |
Unknown |
|
Republic of the Marshall Islands |
Unknown |
Unknown |
Unknown |
No |
No |
Unknown |
|
Virgin Islands |
Unknown |
Unknown |
Unknown |
No |
No |
Unknown |
Appendix D
2004-2005 Alternate Assessments
|
State |
Assessment Component |
Standards-Based* |
Grades |
Subject |
Disaggregated Special Education Data |
Test Used for State Accountability Purposes |
|
|
Part. |
Perf. | ||||||
|
Alabama |
Alabama Alternate Assessment (AAA) |
AAS |
1-8,10,11 |
Reading, Math |
Yes |
Yes |
Yes |
|
Alaska |
Alternate Assessment |
AAS |
3-10 |
English/Language Arts, Math, Skills for a Healthy Life |
Yes |
Yes |
Yes |
|
HSGQE Alternative Assessment Program (AAP) |
AAS & GLAS |
10 |
Reading, Math, Writing |
No |
No |
No |
|
|
Arizona |
AIMS-Alternate (AIMS-A) |
AAS |
3-8 |
Reading, Math, Writing, Listening, Speaking |
Yes |
Yes |
Yes |
|
AIMS-A HS |
AAS |
10 (11,12) |
Reading, Math, Writing, Listening (Level 1), Speaking (Level 1) |
Yes |
Yes |
Yes |
|
|
Alternate State Achievement Test (ASAT) |
AAS |
2-9 |
Reading, Math, Writing, Listening, Speaking |
No |
No |
No |
|
|
Arkansas |
Alternate Portfolio Assessment System (APAS) |
AAS |
3-8,9,11 |
Literacy (3-8,11), Math (3-8), EOC-Algebra 1 (9), EOC-Geometry (9) |
No |
No |
Yes |
|
California |
California Alternate Performance Assessment (CAPA) |
AAS |
2-11 |
English Language Arts, Math, Science |
Yes |
Yes |
Yes |
|
Colorado |
Colorado Student Assessment Program Alternate (CSAPA) |
AAS |
3-10 |
Reading, Math (5-10), Writing, Science (8) |
Yes |
Yes |
Yes |
|
Connecticut |
Alternate Assessment |
AAS |
3-8,10 |
Reading, Math, Writing |
Yes |
Yes |
Yes |
|
Delaware |
Delaware Alternate Portfolio Assessment (DAPA) |
AAS |
2-11 |
Reading (2-10), Math (2-10), Writing (2-10), Science (4,6,8,11), Social Studies (4,6,8,11) |
Yes |
Yes |
Yes (for Reading, Writing, and Math in grades 3-8 & 10) |
|
Florida |
Florida Alternate Assessment Report (FAAR) |
AAS |
3-10 |
Reading, Math |
Yes |
Yes |
Yes |
|
Georgia
|
Georgia Alternate Assessment (GAA) |
AAS |
K-12 |
Communication, Daily Living, Motor, Cog./Functional Academics, Social/ Emotional, Community, Vocational, Rec/Leisure |
Yes |
Yes |
Yes |
|
Hawaii |
Alternate Assessment |
GLAS |
3-8,10 |
Reading, Math |
Yes |
Yes |
Yes |
|
Idaho
|
Alternate Assessment |
AAS |
K-10 |
Reading, Language (2-10), Math (2-10) |
Yes |
Yes |
Yes |
|
Illinois |
Illinois Alternate Assessment (IAA) |
AAS |
3,4,5,7,8,11 |
Reading (3,5,8,11), Math (3,5,8,11), Science (4,7,11) |
Yes |
Yes |
Yes |
|
Indiana |
Indiana Standards Tool for Alternate Reporting (ISTAR) |
AAS |
3-10 |
English Language Arts, Math, Functional Achievement |
Yes |
No |
Yes |
|
Iowa |
Alternate Assessment |
AAS |
4,8,11 |
Reading, Math |
Yes |
Yes |
Yes |
|
Kansas |
Alternate Assessment |
AAS |
3-8,10,11 |
Reading (3-8,11) Math (3-8,10) |
Yes |
Yes |
Yes |
|
Kentucky |
Alternate Portfolio Assessment |
GLAS |
4,5,7,8, 10,11 |
Reading (4,7,10), Math (5,8,11), Writing Portfolio and On-Demand (4,7), Science (4,7,11), Soc. St (5,8,11), Arts & Humanities (5,8), Practical Living & Voc Studies (5,8,) |
Yes |
Yes |
Yes |
|
Louisiana |
Alternate Assessment Levels 1&2 |
AAS |
3-11 |
English, Math, Science, Social Studies |
Yes |
Yes |
Yes |
|
Maine |
Personalized Alternate Assessment Portfolios (PAAP) |
AAS |
4,8,11 |
English Language Arts (Reading & Writing), Math, Science & Technology |
Yes |
Yes |
Yes |
|
Maryland |
Alternate Maryland School Assessment (ALT-MSA) |
AAS |
3-8, 10 |
Reading, Math |
Yes |
Yes |
Yes |
|
Massachusetts |
MCAS Alternate Assessment (MCAS-Alt) |
Other |
3-8, 10 |
Reading (3), English/Language Arts (4,7,10), Math (4,6,8,10), Science (5,8) |
Yes |
Yes |
Yes |
|
Michigan |
Alternate Assessment (MI-Access) |
AAS & GLAS |
4,7,8,11 |
5 Performance Expectations |
Yes |
Yes |
Yes |
|
Minnesota |
Alternate Assessment |
AAS & GLAS |
3,5,7,10,11 |
Reading, Math |
Yes |
Yes |
Yes |
|
Mississippi |
Alternate Assessment |
Other |
3-8 |
Math, Reading/ Language Arts |
Yes |
Yes |
Yes |
|
Missouri |
MAP-Alternate |
AAS |
4,8,11 |
Communication Arts (11), Math (4,8), |
Yes |
Yes |
Yes |
|
Montana |
Alternate Assessment |
AAS |
4,8,11 (NRT) & 4,8,10 (CRT) |
NRT: Reading, Language Arts, Math, Science, Social Studies CRT: Reading, Math |
Yes |
Yes |
Yes |
|
Nebraska |
Alternate Assessment |
AAS |
4,8,12 |
Math, Reading/Writing |
Yes |
Yes |
Yes |
|
Nevada |
Skills and Competencies Alternate Assessment of Nevada (SCAAN) |
AAS |
3-12 |
Language, Math |
Yes |
Yes |
Yes |
|
New Hampshire |
Alternate Assessment (NH-Alt) |
AAS |
2-7,10 |
Reading, Writing, Math |
Yes |
Yes |
Yes |
|
New Jersey |
Alternate Proficiency Assessment (APA) |
AAS |
3,4,8,11 |
Language Arts Literacy, Math |
Yes |
Yes |
Yes |
|
New Mexico |
Alternate Assessment |
AAS |
3-9,11 |
Reading/Writing, Math |
Yes |
Yes |
Yes |
|
New York |
New York State Alternate Assessment (NYSSA) |
AAS |
4, 8, High School |
English Language Arts, Math, Science, Social Studies |
Yes |
Yes |
Yes |
|
North Carolina |
North Carolina Alternate Assessment Academic Inventory (NCAAAI) for End-of-Grade |
AAS & GLAS |
3-8 |
Reading, Math |
Yes |
Yes |
Yes |
|
North Carolina Alternate Assessment Academic Inventory (NCAAAI) for End-of-Course |
GLAS |
9-12 |
Biology, Chemistry, Physics, English I, Physical Science, Algebra I & II, Geometry |
Yes |
Yes |
Yes |
|
|
North Carolina Alternate Assessment Portfolio (NCAAP) |
AAS |
3-8 |
Reading, Math |
Yes |
Yes |
Yes |
|
|
North Dakota |
North Dakota Alternate Assessment (NDALT) |
AAS |
3-8,11 |
Reading/Language, Math |
Yes |
No |
Yes |
|
Ohio |
Alternate Assessment |
AAS |
3-8, 10 |
Reading (3-6,8,10), Math (3,4,6-8,10), Writing (4,10), Science (10), Social Studies (10 |
No |
No |
Yes |
|
Oklahoma |
Alternate Assessment |
AAS |
All |
Portfolio of required subjects |
Yes |
Yes |
Yes |
|
Oregon |
Extended Assessments (EA) |
GLAS |
3,4,5,7,8,10 |
Reading/Literature (3,5,8,10), Writing (4,7,10), Math (3,5,8,10), Science (5,8,10) |
Yes |
Yes |
Yes |
|
Pennsylvania |
Pennsylvania Alternate System of Assessment (PASA) |
GLAS |
3,5,8,11 |
Reading, Math |
Yes |
Yes |
Yes |
|
Rhode Island |
Alternate Assessment |
AAS |
3-5,8,11 |
English/Language Arts, Math |
Yes |
Yes |
Yes |
|
South Carolina |
PACT Alternate Assessment (PACT-Alt) |
AAS |
3-8 |
English/Language Arts, Math, Science, Social Studies |
Yes |
Yes |
Yes |
|
High School Assessment Program Alternate Assessment (HSAP-Alt) |
AAS |
10 |
English/Language Arts, Math |
Yes |
Yes |
Yes |
|
|
South Dakota |
Statewide Team-Led Alternate Assessment & Reporting System (STAARS) |
AAS & GLAS |
3-8, 11 |
Reading, Math |
Yes |
No |
Yes |
|
STAARS Writing |
AAS & GLAS |
5,9 |
Writing |
No |
No |
No |
|
|
Tennessee |
TCAP-Alt |
AAS |
3-12 |
Reading/Language Arts, Math, Science, Social Studies |
No |
Yes |
Yes |
|
Texas |
State-Developed Alternate Assessment-II (SDAA-II) |
AAS & Other |
3-10 |
Reading, Math, Writing, English Language Arts |
Yes |
Yes |
Yes |
|
Utah |
Alternate Assessment |
AAS |
1-12 |
Language Arts, Math |
Yes |
Yes |
Yes |
|
Vermont |
Alternate Assessment |
AAS & GLAS |
2,4,5, 8-11 |
Varies by type of assessment |
No |
No |
Yes |
|
Virginia |
Virginia Alternate Assessment Program (VAAP) |
AAS |
3,5,8,11 |
English Language Arts, Math, Science, History/Social Science, Content Specific History (High School) |
Yes |
Yes |
Yes |
|
Virginia Grade Level Alternative Assessment (VGLAA) |
GLAS |
3-8 |
Collection of Evidence |
Yes |
Yes |
Yes |
|
|
Virginia Substitute Evaluation Program (VSEP) |
AAS & GLAS |
High School |
Collection of Evidence |
Yes |
Yes |
Yes |
|
|
Washington |
Washington Alternate Assessment System (WAAS) |
AAS |
4,5,7,8, 10 |
Reading, Math, Writing, Science |
Yes |
Yes |
Yes |
|
West Virginia |
Alternate Assessment |
AAS |
3-8, 10 |
Reading/Language, Math, Science, Social Studies |
Yes |
Yes |
Yes |
|
Wisconsin |
Wisconsin Alternate Assessment (WAA) |
AAS |
4,8,10 |
Reading, Language Arts, Math, Science, Social Studies |
Yes |
Yes |
Yes |
|
Wyoming |
WyCAS Alternate |
AAS |
4,8,11 |
Receptive Language, Expressive Language, Math |
Yes |
Yes |
Yes |
*AAS
= based on alternate achievement
standards; GLAS = based on grade level
achievement standards; Other = may
include a combination of AAS and GLAS or
different form, such as an adaptive
assessment.
Unique States
|
State |
Assessment Component |
Standards-Based* |
Grades |
Subject |
Disaggregated Special Education Data |
Test Used for State Accountability Purposes |
|
|
Part. |
Perf. |
||||||
|
American Samoa |
Alternate Assessment |
AAS |
3-8,10,12 |
Unknown |
Yes |
Yes |
Yes |
|
Commonwealth of the Northern Mariana Islands |
Alternate Assessment |
GLAS |
3-8,10,11 |
Reading OR Math |
Yes |
Yes |
Yes |
|
District of Columbia |
Alternate Assessment |
AAS |
1-12 |
Reading, Math |
No |
No |
Yes |
|
Guam |
Alternate Assessment |
GLAS |
1-12 |
Reading, Math, Language |
Yes |
Yes |
Yes |
*AAS = based on alternate achievement standards; GLAS = based on grade level achievement standards; Other
Appendix E
Disaggregated Participation Information (Given for State-Level Data)*
|
State |
Test |
Number of Students Tested |
Number of Students Not Tested |
Percent of Students Tested |
Percent of Students Not Tested |
Number and/or Percent Exempt or Excluded |
Number and/or Percent Absent |
|
AL |
DAW |
Y |
|
Y |
|
|
|
|
AHSGE |
Y |
|
Y |
|
|
|
|
|
SAT-10 |
Y |
|
Y |
|
|
|
|
|
ARMT |
Y |
|
Y |
|
|
|
|
|
AK |
SBA |
|
|
Y |
|
|
|
|
HSGQE |
|
|
Y |
|
|
|
|
|
TerraNova |
|
|
|
|
|
|
|
|
AZ |
TerraNova |
|
|
|
|
|
|
|
AIMS |
Y |
|
Y |
|
|
|
|
|
AIMS HS |
Y |
|
Y |
|
|
|
|
|
AR |
ITBS |
|
|
|
|
|
|
|
ABE |
|
|
Y |
|
|
|
|
|
CA |
CSTs |
Y |
|
Y |
|
|
|
|
SABE/2 |
Y |
|
|
|
|
|
|
|
CAT-6 |
Y |
|
|
|
|
|
|
|
CO |
CSAP |
Y |
Y |
Y |
Y |
|
Y |
|
CT |
CMT |
Y |
|
Y |
Y |
|
Y |
|
CAPT |
Y |
|
Y |
Y |
|
Y |
|
|
DE |
DSTP |
Y |
Y |
Y |
Y |
Y |
|
|
FL |
FCAT |
Y |
|
Y |
|
|
|
|
GA |
EOCT |
Y |
|
|
|
|
|
|
GHSGT |
Y |
|
|
|
|
|
|
|
CRCT |
Y |
|
|
|
|
|
|
|
WA |
Y |
|
|
|
|
|
|
|
HI |
HSA |
Y |
|
Y |
|
|
|
|
ID |
DMA/DWA |
|
|
Y |
|
|
|
|
ISAT |
Y |
|
Y |
|
|
|
|
|
IRI |
Y |
|
Y |
|
|
Y |
|
|
IL |
ISAT |
|
|
Y |
Y |
|
|
|
PSAE |
|
|
Y |
Y |
|
|
|
|
IMAGE |
|
|
Y |
Y |
|
|
|
|
IN |
ISTEP+ |
Y |
|
|
|
|
|
|
GQE |
Y |
|
|
|
|
|
|
|
ECAs |
|
|
|
|
|
|
|
|
IA |
ITBS/ITED |
Y |
|
Y |
|
|
|
|
KS |
KAS |
Y |
|
|
Y |
|
|
|
KY |
CTBS/5 |
Y |
|
Y |
|
|
|
|
KCCT |
Y |
|
Y |
|
|
|
|
|
LA |
LEAP 21 |
Y |
|
|
|
|
|
|
GEE 21 |
Y |
|
|
|
|
|
|
|
ITBS/ITED |
Y |
|
|
|
|
|
|
|
ME |
MEA |
Y |
|
Y |
|
|
|
|
MD |
MSA |
Y |
|
|
|
|
|
|
HSA |
Y |
|
|
|
|
|
|
|
MA |
MCAS |
Y |
Y |
Y |
|
|
|
|
MI |
MEAP |
Y |
|
|
|
|
|
|
MN |
MCA |
Y |
Y |
Y |
Y |
|
Y |
|
MS |
MCT |
Y |
Y |
Y |
Y |
|
|
|
TerraNova |
|
|
|
|
|
|
|
|
WA |
|
|
|
|
|
|
|
|
SATP |
|
|
|
|
|
|
|
|
MO |
MAP |
Y |
Y |
|
Y |
Y |
Y |
|
MT |
ITBS/ITED |
Y |
|
|
|
|
|
|
MP |
|
|
|
|
|
|
|
|
NE |
NSWA |
Y |
Y |
Y |
Y |
|
|
|
STARS |
|
|
Y |
Y |
|
|
|
|
NV |
ITBS/ITED |
Y |
|
|
Y |
|
Y |
|
NCRT |
Y |
|
|
Y |
|
Y |
|
|
HSPE |
|
|
|
Y |
|
|
|
|
NAWE |
Y |
|
|
Y |
|
Y |
|
|
NH |
NHEIAP |
Y |
Y |
Y |
Y |
|
|
|
NJ |
NJ-ASK |
Y |
Y |
|
|
|
Y |
|
GEPA |
Y |
Y |
|
Y |
|
Y |
|
|
HSPA |
Y |
Y |
|
Y |
|
|
|
|
NM |
NMSBA |
Y |
|
|
|
|
|
|
NMHSSA |
Y |
|
|
|
|
|
|
|
NY |
RCE |
Y |
|
Y |
|
|
|
|
RCT |
Y |
|
Y |
|
|
|
|
|
NYSAP |
Y |
|
Y |
|
|
|
|
|
NC |
EOG |
Y |
Y |
Y |
Y |
Y |
Y |
|
EOC |
Y |
Y |
Y |
Y |
Y |
Y |
|
|
Grade 3 |
Y |
Y |
Y |
Y |
Y |
Y |
|
|
ND |
NDSA |
Y |
Y |
Y |
|
|
|
|
OH |
AT |
|
|
|
|
|
|
|
OPT |
|
|
|
|
|
|
|
|
OGT |
|
|
|
|
|
|
|
|
OK |
OCCT |
Y |
|
Y |
|
|
|
|
EOI |
Y |
|
Y |
|
Y |
Y |
|
|
OR |
OSA |
Y |
|
Y |
|
|
|
|
PA |
PSSA |
Y |
|
|
|
|
|
|
RI |
NSRE |
Y |
Y |
Y |
Y |
Y |
|
|
DRA |
|
|
|
|
|
|
|
|
SC |
PACT |
Y |
|
|
|
|
|
|
HSAP |
Y |
|
|
|
|
|
|
|
SD |
STEP |
Y |
|
Y |
Y |
|
|
|
SWA |
|
|
|
|
|
|
|
|
TN |
TCAP-AT |
|
|
|
|
|
|
|
WT |
|
|
|
|
|
|
|
|
TCAP-SA |
|
|
|
|
|
|
|
|
TX |
TAKS |
Y |
Y |
Y |
Y |
|
Y |
|
RPTE |
|
|
|
|
|
|
|
|
UT |
ITBS/ITED |
|
|
|
|
|
|
|
CCRT |
Y |
|
Y |
|
|
|
|
|
DWA |
|
|
|
|
|
|
|
|
UBSCT |
Y |
|
|
|
|
|
|
|
VT |
NSRE |
Y |
|
|
|
|
|
|
DRA |
Y |
|
|
|
|
|
|
|
VA |
SOL |
|
|
|
Y |
|
|
|
WA |
WASL |
Y |
Y |
|
|
|
Y |
|
ITBS/ITED |
|
|
|
|
|
|
|
|
WV |
WESTEST |
Y |
Y |
Y |
Y |
Y |
Y |
|
WVWA |
|
|
|
|
|
|
|
|
ACT E |
|
|
|
|
|
|
|
|
ACT P |
|
|
|
|
|
|
|
|
WI |
WKCE |
Y |
Y |
Y |
Y |
|
|
|
WRCT |
Y |
Y |
Y |
Y |
Y |
|
|
|
WY |
WyCAS |
|
|
Y |
|
|
|
*Shaded cells indicate unclear (e.g., aggregated grade level or subject level) reporting.
Appendix F
Disaggregated Alternate Assessment Participation Information (Given for State-Level Data)*
|
State |
Test |
Number of Students Tested |
Number of Students Not Tested |
Percent of Students Tested |
Percent of Students Not Tested |
Number and/or Percent Exempt or Excluded |
Number and/or Percent Absent |
|
AL |
AAA |
Y |
|
Y |
|
|
|
|
AK |
Alternate |
|
|
Y |
|
|
|
|
AAP |
|
|
|
|
|
|
|
|
AZ |
AIMS-A |
Y |
|
Y |
|
|
|
|
AIMS-A HS |
Y |
|
Y |
|
|
|
|
|
ASAT |
|
|
|
|
|
|
|
|
AR |
APAS |
|
|
|
|
|
|
|
CA |
CAPA |
Y |
|
Y |
|
|
|
|
CO |
CSAPA |
Y |
Y |
Y |
Y |
|
Y |
|
CT |
Alternate |
Y |
|
Y |
Y |
|
Y |
|
DE |
DAPA |
Y |
Y |
Y |
Y |
Y |
|
|
FL |
FAAR |
Y |
|
Y |
|
|
|
|
GA |
GAA |
Y |
|
Y |
|
|
|
|
HI |
Alternate |
Y |
|
Y |
|
|
|
|
ID |
Alternate |
Y |
|
Y |
|
|
|
|
IL |
IAA |
|
|
Y |
Y |
|
|
|
IN |
ISTAR |
Y |
|
Y |
|
|
|
|
IA |
Alternate |
Y |
|
Y |
|
|
|
|
KS |
Alternate |
Y |
Y |
Y |
|
|
|
|
KY |
Alternate |
Y |
|
Y |
|
|
|
|
LA |
Alternate |
Y |
|
|
|
|
|
|
ME |
PAAP |
Y |
|
Y |
|
|
|
|
MD |
ALT-MSA |
Y |
|
|
|
|
|
|
MA |
MCAS-Alt |
Y |
Y |
Y |
|
|
|
|
MI |
MI-Access |
Y |
|
|
|
|
|
|
MN |
Alternate |
Y |
Y |
Y |
Y |
|
Y |
|
MS |
Alternate |
Y |
Y |
Y |
Y |
|
|
|
MO |
Alternate |
Y |
Y |
|
Y |
Y |
Y |
|
MT |
Alternate |
Y |
|
|
|
|
|
|
NE |
Alternate |
|
|
Y |
Y |
|
|
|
NV |
SCAAN |
|
|
|
Y |
|
Y |
|
NH |
NH-Alt |
Y |
Y |
Y |
Y |
|
|
|
NJ |
APA |
Y |
|
|
|
|
|
|
NM |
Alternate |
Y |
|
Y |
|
|
|
|
NY |
NYSAA |
Y |
Y |
Y |
|
|
|
|
NC |
NCAAI-EOG |
Y |
|
Y |
Y |
|
|
|
NCAAI-EOC |
Y |
|
Y |
Y |
|
|
|
|
NCAAP |
Y |
|
Y |
Y |
|
|
|
|
ND |
NDALT |
Y |
|
|
|
|
|
|
OH |
Alternate |
|
|
|
|
|
|
|
OK |
Alternate |
Y |
|
Y |
|
|
|
|
OR |
EA |
Y |
|
Y |
|
|
|
|
PA |
PASA |
Y |
|
|
|
|
|
|
RI |
Alternate |
Y |
Y |
Y |
Y |
Y |
|
|
SC |
PACT-Alt |
Y |
Y |
|
|
|
|
|
HSAP-Alt |
Y |
Y |
|
|
|
|
|
|
SD |
STAARS |
Y |
|
Y |
|
|
|
|
STAARS Writing |
|
|
|
|
|
|
|
|
TN |
TCAP-Alt |
|
|
|
|
|
|
|
TX |
SDAA-II |
Y |
Y |
Y |
Y |
Y |
Y |
|
UT |
Alternate |
Y |
|
Y |
|
|
|
|
VT |
Alternate |
|
|
|
|
|
|
|
VA |
VAAP |
Y |
|
Y |
|
|
|
|
VGLASS |
Y |
|
Y |
|
|
|
|
|
VSEP |
|
|
Y |
|
|
|
|
|
WA |
WAAS |
Y |
|
|
Y |
|
|
|
WV |
Alternate |
Y |
Y |
Y |
Y |
Y |
Y |
|
WI |
WAA |
Y |
Y |
Y |
Y |
|
|
|
WY |
WyCAS-Alt |
|
Y |
|
Y |
|
|
*Shaded cells indicate unclear (e.g., aggregated grade level or subject level) reporting.
Appendix G
Disaggregated Performance Information (Given for State-Level Data)*
|
State |
Test |
Percent in Each Achievement Level |
Percent in Each PR* Group |
Percent Proficient |
Percent Not Proficient |
Number Proficient |
Number Not Proficient |
Average Percentile Rank |
|
AL |
DAW |
Y |
|
Y |
Y |
|
|
|
|
AHSGE |
Y |
|
Y |
Y |
|
|
|
|
|
SAT-10 |
|
|
|
|
|
|
Y |
|
|
ARMT |
Y |
|
Y |
Y |
|
|
|
|
|
AK |
SBA |
|
|
Y |
Y |
Y |
Y |
|
|
HSGQE |
|
|
Y |
Y |
Y |
Y |
|
|
|
TerraNova |
|
|
|
|
|
|
|
|
|
AZ |
TerraNova |
|
|
|
|
|
|
|
|
AIMS |
Y |
|
Y |
Y |
|
|
|
|
|
AIMS HS |
Y |
|
Y |
Y |
|
|
|
|
|
AR |
ITBS |
|
|
|
|
|
|
|
|
ABE |
Y |
|
Y |
Y |
|
|
|
|
|
CA |
CSTs |
Y |
|
Y |
|
Y |
|
|
|
SABE/2 |
Y |
|
Y |
|
Y |
|
|
|
|
CAT-6 |
|
Y |
|
|
|
|
Y |
|
|
CO |
CSAP |
Y |
|
Y |
Y |
Y |
Y |
|
|
CT |
CMT |
Y |
|
Y |
|
|
|
|
|
CAPT |
Y |
|
Y |
|
|
|
|
|
|
DE |
DSTP |
Y |
|
Y |
Y |
|
|
|
|
FL |
FCAT |
Y |
|
Y |
Y |
|
|
Y |
|
GA |
EOCT |
|
|
Y |
Y |
|
|
|
|
GHSGT |
|
|
Y |
Y |
|
|
|
|
|
CRCT |
|
|
Y |
Y |
|
|
|
|
|
WA |
|
|
Y |
Y |
|
|
|
|
|
HI |
HSA |
|
|
Y |
|
|
|
|
|
ID |
DMA/DWA |
|
|
Y |
|
|
|
|
|
ISAT |
Y |
|
Y |
|
|
|
|
|
|
IRI |
Y |
|
Y |
|
|
|
|
|
|
IL |
ISAT |
Y |
|
Y |
|
|
|
|
|
PSAE |
Y |
|
Y |
|
|
|
|
|
|
IMAGE |
Y |
|
Y |
|
|
|
|
|
|
IN |
ISTEP+ |
Y |
|
Y |
Y |
Y |
Y |
|
|
GQE |
Y |
|
Y |
Y |
Y |
Y |
|
|
|
ECAs |
|
|
|
|
|
|
|
|
|
IA |
ITBS/ITED |
Y |
|
Y |
Y |
|
|
|
|
KS |
KAS |
|
|
Y |
Y |
Y |
Y |
|
|
KY |
CTBS/5 |
Y |
|
|
|
|
|
Y |
|
KCCT |
Y |
|
Y |
Y |
|
|
|
|
|
LA |
LEAP 21 |
Y |
|
Y |
|
|
|
|
|
GEE 21 |
Y |
|
Y |
|
|
|
|
|
|
ITBS/ITED |
|
|
|
|
|
|
Y |
|
|
ME |
MEA |
|
|
Y |
Y |
Y |
Y |
|
|
MD |
MSA |
Y |
|
Y |
|
Y |
Y |
|
|
HSA |
Y |
|
Y |
|
Y |
Y |
|
|
|
MA |
MCAS |
Y |
|
Y |
Y |
Y |
Y |
|
|
MI |
MEAP |
Y |
|
Y |
Y |
|
|
|
|
MN |
MCA |
Y |
|
Y |
Y |
Y |
Y |
|
|
MS |
MCT |
Y |
|
Y |
|
|
|
|
|
TerraNova |
|
|
|
|
|
|
Y |
|
|
WA |
Y |
|
Y |
|
|
|
|
|
|
SATP |
Y |
|
Y |
|
|
|
|
|
|
MO |
MAP |
Y |
|
Y |
Y |
Y |
Y |
|
|
MT |
ITBS/ITED |
Y |
|
Y |
Y |
|
|
|
|
MP |
Y |
|
Y |
Y |
|
|
|
|
|
NE |
NSWA |
|
|
Y |
Y |
|
|
|
|
STARS |
|
|
Y |
Y |
|
|
|
|
|
NV |
ITBS/ITED |
Y |
Y |
Y |
Y |
|
|
|
|
NCRT |
Y |
|
Y |
Y |
|
|
|
|
|
HSPE |
Y |
|
Y |
Y |
|
|
|
|
|
NAWE |
Y |
|
Y |
Y |
|
|
|
|
|
NH |
NHEIAP |
Y |
|
Y |
Y |
Y |
Y |
|
|
NJ |
NJ-ASK |
Y |
|
Y |
Y |
Y |
Y |
|
|
GEPA |
Y |
|
Y |
Y |
|
|
|
|
|
HSPA |
Y |
|
Y |
Y |
|
|
|
|
|
NM |
NMSBA |
Y |
|
Y |
Y |
|
|
|
|
NMHSSA |
Y |
|
Y |
Y |
|
|
|
|
|
NY |
RCE |
Y |
|
Y |
|
Y |
|
|
|
RCT |
Y |
|
Y |
|
Y |
|
|
|
|
NYSAP |
Y |
|
Y |
|
Y |
|
|
|
|
NC |
EOG |
Y |
|
Y |
Y |
Y |
Y |
|
|
EOC |
Y |
|
Y |
Y |
Y |
Y |
|
|
|
Grade 3 |
Y |
|
Y |
Y |
Y |
Y |
|
|
|
ND |
NDSA |
Y |
|
Y |
Y |
Y |
Y |
|
|
OH |
AT |
|
|
Y |
|
|
|
|
|
OPT |
|
|
Y |
|
|
|
|
|
|
OGT |
|
|
Y |
|
|
|
|
|
|
OK |
OCCT |
Y |
|
Y |
Y |
Y |
Y |
|
|
EOI |
Y |
|
Y |
Y |
Y |
Y |
|
|
|
OR |
OSA |
Y |
|
Y |
Y |
Y |
Y |
|
|
PA |
PSSA |
Y |
|
Y |
Y |
|
|
|
|
RI |
NSRE |
|
|
Y |
|
|
|
|
|
DRA |
|
|
|
|
|
|
|
|
|
SC |
PACT |
Y |
|
Y |
Y |
|
|
|
|
HSAP |
Y |
|
Y |
Y |
|
|
|
|
|
SD |
STEP |
Y |
|
Y |
Y |
|
|
|
|
SWA |
|
|
|
|
|
|
|
|
|
TN |
TCAP-AT |
Y |
|
Y |
Y |
|
|
|
|
WT |
|
|
|
|
|
|
|
|
|
TCAP-SA |
Y |
|
Y |
Y |
|
|
|
|
|
TX |
TAKS |
|
|
Y |
|
|
|
|
|
RPTE |
|
|
|
|
|
|
|
|
|
UT |
ITBS/ITED |
|
|
|
|
|
|
Y |
|
CCRT |
|
|
Y |
|
Y |
|
|
|
|
DWA |
|
|
|
|
|
|
|
|
|
UBSCT |
|
|
Y |
Y |
Y |
Y |
|
|
|
VT |
NSRE |
Y |
|
Y |
Y |
|
|
|
|
DRA |
Y |
|
Y |
Y |
|
|
|
|
|
VA |
SOL |
Y |
|
Y |
Y |
|
|
|
|
WA |
WASL |
Y |
|
Y |
Y |
|
|
|
|
ITBS/ITED |
|
|
|
|
|
|
|
|
|
WV |
WESTEST |
Y |
|
Y |
Y |
Y |
Y |
|
|
WVWA |
|
|
|
|
|
|
|
|
|
ACT E |
|
|
|
|
|
|
|
|
|
ACT P |
|
|
|
|
|
|
|
|
|
WI |
WKCE |
Y |
|
Y |
Y |
Y |
Y |
|
|
WRCT |
Y |
|
Y |
Y |
Y |
Y |
|
|
|
WY |
WyCAS |
Y |
|
Y |
Y |
|
|
|
*Shaded cells indicate unclear (e.g., aggregated grade level or subject level) reporting.
Appendix H
Disaggregated Alternate Assessment Performance Information (Given for State-Level Data)*
|
State |
Test |
Percent in Each Achievement Level |
Percent in Each PR* Group |
Percent Proficient |
Percent Not Proficient |
Number Proficient |
Number Not Proficient |
Average Percentile Rank |
|
AL |
AAA |
Y |
|
Y |
Y |
|
|
|
|
AK |
Alternate |
|
|
Y |
Y |
Y |
Y |
|
|
AAP |
|
|
|
|
|
|
|
|
|
AZ |
AIMS-A |
Y |
|
Y |
Y |
|
|
|
|
AIMS-A HS |
Y |
|
Y |
Y |
|
|
|
|
|
ASAT |
|
|
|
|
|
|
|
|
|
AR |
APAS |
|
|
|
|
|
|
|
|
CA |
CAPA |
Y |
|
Y |
|
Y |
|
|
|
CO |
CSAPA |
Y |
|
Y |
Y |
Y |
Y |
|
|
CT |
Alternate |
|
|
Y |
Y |
Y |
Y |
|
|
DE |
DAPA |
Y |
|
Y |
Y |
|
|
|
|
FL |
FAAR |
|
|
Y |
|
|
|
|
|
GA |
GAA |
|
|
Y |
Y |
Y |
Y |
|
|
HI |
Alternate |
Y |
|
Y |
Y |
|
|
|
|
ID |
Alternate |
|
|
Y |
|
|
|
|
|
IL |
IAA |
Y |
|
Y |
|
|
|
|
|
IN |
ISTAR |
|
|
|
|
|
|
|
|
IA |
Alternate |
|
|
Y |
|
|
|
|
|
KS |
Alternate |
|
|
Y |
Y |
Y |
Y |
|
|
KY |
Alternate |
Y |
|
Y |
Y |
|
|
|
|
LA |
Alternate |
Y |
|
|
|
|
|
|
|
ME |
PAAP |
Y |
|
Y |
Y |
Y |
Y |
|
|
MD |
ALT-MSA |
Y |
|
Y |
|
Y |
Y |
|
|
MA |
MCAS-Alt |
|
|
Y |
Y |
Y |
Y |
|
|
MI |
MI-Access |
Y |
|
Y |
Y |
|
|
|
|
MN |
Alternate |
|
|
Y |
Y |
Y |
Y |
|
|
MS |
Alternate |
Y |
|
Y |
|
|
|
|
|
MO |
Alternate |
Y |
|
Y |
Y |
Y |
Y |
|
|
MT |
Alternate |
Y |
|
Y |
Y |
|
|
|
|
NE |
Alternate |
|
|
Y |
Y |
|
|
|
|
NV |
SCAAN |
|
|
Y |
Y |
|
|
|
|
NH |
NH-Alt |
Y |
|
Y |
Y |
Y |
Y |
|
|
NJ |
APA |
|
|
Y |
Y |
Y |
Y |
|
|
NM |
Alternate |
|
|
Y |
Y |
|
|
|
|
NY |
NYSAA |
Y |
|
Y |
|
Y |
|
|
|
NC |
NCAAI-EOG |
Y |
|
Y |
Y |
|
|
|
|
NCAAI-EOC |
Y |
|
Y |
Y |
|
|
|
|
|
NCAAP |
Y |
|
Y |
Y |
|
|
|
|
|
ND |
NDALT |
|
|
|
|
|
|
|
|
OH |
Alternate |
|
|
|
|
|
|
|
|
OK |
Alternate |
|
|
Y |
Y |
Y |
Y |
|
|
OR |
EA |
Y |
|
Y |
Y |
Y |
Y |
|
|
PA |
PASA |
Y |
|
Y |
Y |
Y |
Y |
|
|
RI |
Alternate |
|
|
Y |
|
|
|
|
|
SC |
PACT-Alt |
Y |
|
Y |
Y |
|
|
|
|
HSAP-Alt |
Y |
|
Y |
Y |
|
|
|
|
|
SD |
STAARS |
|
|
|
|
|
|
|
|
STAARS Writing |
|
|
|
|
|
|
|
|
|
TN |
TCAP-Alt |
Y |
|
Y |
Y |
|
|
|
|
TX |
SDAA-II |
|
|
Y |
|
|
|
|
|
UT |
Alternate |
|
|
Y |
|
Y |
|
|
|
VT |
Alternate |
|
|
|
|
|
|
|
|
VA |
VAAP |
Y |
|
Y |
Y |
|
|
|
|
VGLASS |
Y |
|
Y |
Y |
|
|
|
|
|
VSEP |
Y |
|
Y |
Y |
|
|
|
|
|
WA |
WAAS |
Y |
|
Y |
Y |
|
|
|
|
WV |
Alternate |
Y |
|
Y |
Y |
Y |
Y |
|
|
WI |
WAA |
Y |
|
Y |
Y |
Y |
Y |
|
|
WY |
WyCAS-Alt |
Y |
|
|
|
|
|
|
*Shaded cells indicate unclear (e.g., aggregated grade level or subject level) reporting.
Appendix I
Alternate Assessment Performance
Elementary School Reading Performance on the Alternate Assessment
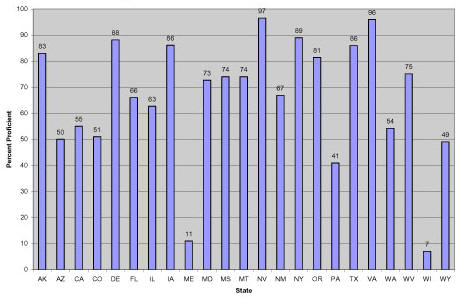
Middle School Reading Performance on the Alternate Assessment
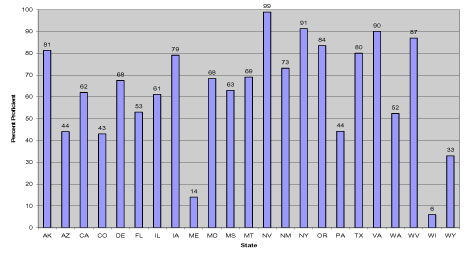
High School Reading Performance on the Alternate Assessment
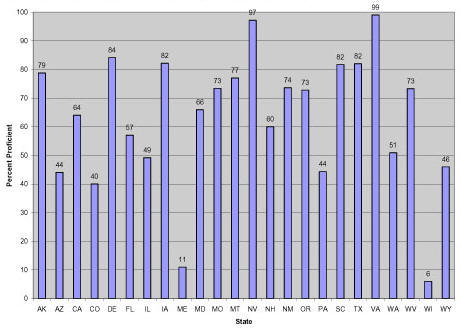
Elementary School Mathematics Performance on the Alternate Assessment
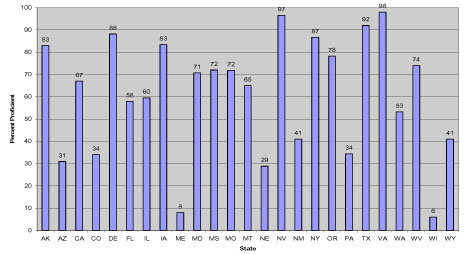
Middle School Mathematics Performance on the Alternate Assessment
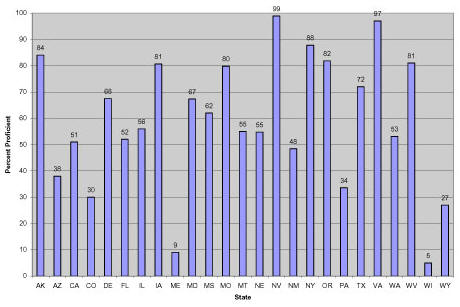
High School Mathematics Performance on the Alternate Assessment
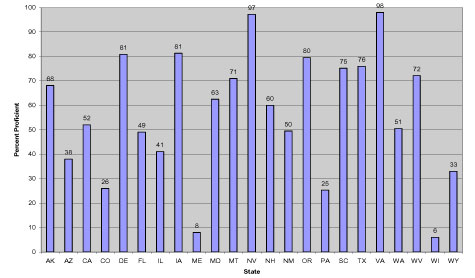
Appendix J
Participation and Performance for Students Tested with Accommodations
|
Grade |
Subject |
Accommodation |
Participation |
Proficiency |
|
Colorado: CSAP “Accommodations” |
|||||
|
3 |
Reading |
Braille version |
8 |
- |
|
|
Large-print version |
37 |
41% |
|||
|
Teacher-read directions only |
1825 |
22% |
|||
|
Scribe |
759 |
33% |
|||
|
Signing |
14 |
- |
|||
|
Assistive communication device |
7 |
58% |
|||
|
Extended timing |
6516 |
53% |
|||
|
4 |
Reading |
Braille version |
1 |
- |
|
|
Large-print version |
35 |
29% |
|||
|
Teacher-read directions only |
2045 |
13% |
|||
|
Scribe |
884 |
34% |
|||
|
Signing |
19 |
11% |
|||
|
Assistive communication device |
33 |
45% |
|||
|
Extended/modified timing |
6270 |
40% |
|||
|
5 |
Reading |
Braille version |
5 |
- |
|
|
Large-print version |
35 |
46% |
|||
|
Teacher-read directions only |
1900 |
16% |
|||
|
Scribe |
660 |
42% |
|||
|
Signing |
11 |
- |
|||
|
Assistive communication device |
45 |
58% |
|||
|
Extended/modified timing |
6178 |
45% |
|||
|
6 |
Reading |
Braille version |
4 |
- |
|
|
Large-print version |
21 |
24% |
|||
|
Teacher-read directions only |
1625 |
14% |
|||
|
Scribe |
440 |
37% |
|||
|
Signing |
23 |
13% |
|||
|
Assistive communication device |
69 |
57% |
|||
|
Extended/modified timing |
4474 |
42% |
|||
|
7 |
Reading |
Braille version |
3 |
- |
|
|
Large-print version |
25 |
44% |
|||
|
Teacher-read directions only |
1468 |
6% |
|||
|
Scribe |
349 |
31% |
|||
|
Signing |
33 |
15% |
|||
|
Assistive communication device |
71 |
42% |
|||
|
Extended/modified timing |
2476 |
30% |
|||
|
8 |
Reading |
Braille version |
6 |
- |
|
|
Large-print version |
11 |
- |
|||
|
Teacher-read directions only |
1262 |
10% |
|||
|
Scribe |
252 |
29% |
|||
|
Signing |
29 |
17% |
|||
|
Assistive communication device |
57 |
40% |
|||
|
Extended/modified timing |
2333 |
28% |
|||
|
9 |
Reading |
Braille version |
8 |
- |
|
Large-print version |
12 |
- |
||
|
Teacher-read directions only |
523 |
8% |
||
|
Scribe |
119 |
32% |
||
|
Signing |
21 |
0 |
||
|
Assistive communication device |
14 |
- |
||
|
Extended/modified timing |
1796 |
22% |
||
|
10 |
Reading |
Braille version |
8 |
- |
|
Large-print version |
10 |
- |
||
|
Teacher-read directions only |
373 |
8% |
||
|
Scribe |
97 |
26% |
||
|
Signing |
21 |
5% |
||
|
Assistive communication device |
7 |
- |
||
|
Extended/modified timing |
1351 |
22% |
||
|
3 |
Math |
Braille version |
6 |
- |
|
Large-print version |
27 |
48% |
||
|
Teacher-read directions only |
781 |
36% |
||
|
Use of manipulative |
29 |
17% |
||
|
Scribe |
414 |
45% |
||
|
Signing |
18 |
22% |
||
|
Assistive communication device |
0 |
- |
||
|
Extended timing |
2053 |
47% |
||
|
Oral presentation of entire test |
3824 |
33% |
||
|
4 |
Math |
Braille version |
2 |
- |
|
Large-print version |
28 |
43% |
||
|
Teacher-read directions only |
692 |
24% |
||
|
Use of manipulative |
21 |
14% |
||
|
Scribe |
502 |
43% |
||
|
Signing |
16 |
19% |
||
|
Assistive communication device |
8 |
- |
||
|
Extended timing |
2859 |
38% |
||
|
Oral presentation of entire test |
3089 |
25% |
||
|
5 |
Math |
Braille version |
3 |
- |
|
Large-print version |
27 |
37% |
||
|
Teacher-read directions only |
688 |
19% |
||
|
Use of manipulative |
8 |
- |
||
|
Scribe |
417 |
35% |
||
|
Signing |
12 |
- |
||
|
Assistive communication device |
10 |
- |
||
|
Extended timing |
3515 |
40% |
||
|
Oral presentation of entire test |
2629 |
20% |
||
|
6 |
Math |
Braille version |
2 |
- |
|
Large-print version |
21 |
24% |
||
|
Teacher-read directions only |
808 |
12% |
||
|
Use of manipulative |
7 |
- |
||
|
Scribe |
258 |
28% |
||
|
Signing |
27 |
22% |
||
|
Assistive communication device |
35 |
23% |
||
|
Extended timing |
1996 |
30% |
||
|
Oral presentation of entire test |
1930 |
11% |
||
|
7 |
Math |
Braille version |
2 |
- |
|
Large-print version |
20 |
15% |
||
|
Teacher-read directions only |
715 |
5% |
||
|
Use of manipulative |
5 |
- |
||
|
Scribe |
201 |
17% |
||
|
Signing |
25 |
8% |
||
|
Assistive communication device |
27 |
22% |
||
|
Extended timing |
1852 |
20% |
||
|
Oral presentation of entire test |
1306 |
4% |
||
|
8 |
Math |
Braille version |
5 |
- |
|
Large-print version |
9 |
- |
||
|
Teacher-read directions only |
560 |
6% |
||
|
Use of manipulative |
5 |
- |
||
|
Scribe |
157 |
17% |
||
|
Signing |
23 |
13% |
||
|
Assistive communication device |
22 |
27% |
||
|
Extended timing |
2023 |
24% |
||
|
Oral presentation of entire test |
1272 |
4% |
||
|
9 |
Math |
Braille version |
9 |
- |
|
Large-print version |
12 |
- |
||
|
Teacher-read directions only |
377 |
2% |
||
|
Use of manipulative |
12 |
- |
||
|
Scribe |
80 |
10% |
||
|
Signing |
20 |
0 |
||
|
Assistive communication device |
6 |
- |
||
|
Extended timing |
1827 |
14% |
||
|
Oral presentation of entire test |
461 |
2% |
||
|
10 |
Math |
Braille version |
7 |
- |
|
Large-print version |
10 |
- |
||
|
Teacher-read directions only |
230 |
3% |
||
|
Use of manipulative |
11 |
- |
||
|
Scribe |
69 |
6% |
||
|
Signing |
23 |
0 |
||
|
Assistive communication device |
4 |
- |
||
|
Extended timing |
1229 |
10% |
||
|
Oral presentation of entire test |
367 |
1% |
||
|
8 |
Science |
Braille version |
7 |
- |
|
Large-print version |
8 |
- |
||
|
Teacher-read directions only |
585 |
11% |
||
|
Scribe |
185 |
30% |
||
|
Signing |
23 |
9% |
||
|
Assistive communication device |
25 |
44% |
||
|
Extended timing |
1183 |
17% |
||
|
Oral presentation of entire test |
1310 |
6% |
||
|
3 |
Writing |
Braille version |
11 |
- |
|
Large-print version |
32 |
22% |
||
|
Teacher-read directions only |
985 |
15% |
||
|
Scribe |
895 |
30% |
||
|
Signing |
24 |
8% |
||
|
Assistive communication device |
19 |
37% |
||
|
Extended timing |
3013 |
35% |
||
|
Oral presentation of entire test |
3017 |
11% |
||
|
4 |
Writing |
Braille version |
1 |
- |
|
Large-print version |
31 |
19% |
||
|
Teacher-read directions only |
946 |
9% |
||
|
Scribe |
872 |
26% |
||
|
Signing |
12 |
- |
||
|
Assistive communication device |
47 |
36% |
||
|
Extended timing |
5231 |
34% |
||
|
Oral presentation of entire test |
2743 |
9% |
||
|
5 |
Writing |
Braille version |
4 |
- |
|
Large-print version |
30 |
33% |
||
|
Teacher-read directions only |
838 |
12% |
||
|
Scribe |
694 |
28% |
||
|
Signing |
7 |
- |
||
|
Assistive communication device |
71 |
32% |
||
|
Extended timing |
5079 |
38% |
||
|
Oral presentation of entire test |
2556 |
11% |
||
|
6 |
Writing |
Braille version |
4 |
- |
|
Large-print version |
20 |
10% |
||
|
Teacher-read directions only |
963 |
9% |
||
|
Scribe |
443 |
26% |
||
|
Signing |
25 |
8% |
||
|
Assistive communication device |
97 |
41% |
||
|
Extended timing |
2730 |
32% |
||
|
Oral presentation of entire test |
1999 |
9% |
||
|
7 |
Writing |
Braille version |
4 |
- |
|
Large-print version |
25 |
32% |
||
|
Teacher-read directions only |
920 |
5% |
||
|
Scribe |
356 |
21% |
||
|
Signing |
28 |
11% |
||
|
Assistive communication device |
92 |
32% |
||
|
Extended timing |
2006 |
26% |
||
|
Oral presentation of entire test |
1426 |
5% |
||
|
8 |
Writing |
Braille version |
7 |
- |
|
Large-print version |
7 |
- |
||
|
Teacher-read directions only |
828 |
5% |
||
|
Scribe |
254 |
17% |
||
|
Signing |
32 |
9% |
||
|
Assistive communication device |
73 |
30% |
||
|
Extended timing |
1882 |
23% |
||
|
Oral presentation of entire test |
1300 |
4% |
||
|
9 |
Writing |
Braille version |
7 |
- |
|
Large-print version |
11 |
- |
||
|
Teacher-read directions only |
460 |
4% |
||
|
Scribe |
136 |
18% |
||
|
Signing |
18 |
0 |
||
|
Assistive communication device |
18 |
39% |
||
|
Extended timing |
1653 |
13% |
||
|
Oral presentation of entire test |
414 |
4% |
|
10 |
Writing |
Braille version |
8 |
- |
||
|
Large-print version |
9 |
- |
||||
|
Teacher-read directions only |
278 |
4% |
||||
|
Scribe |
111 |
13% |
||||
|
Signing |
20 |
0 |
||||
|
Assistive communication device |
13 |
- |
||||
|
Extended timing |
1198 |
11% |
||||
|
Oral presentation of entire test |
337 |
3% |
||||
|
Colorado: CSAP “Nonapproved Accommodation/Modification” |
||||||
|
3 |
Reading |
Nonapproved Accommodation/Modification |
3 |
- |
||
|
4 |
Reading |
Nonapproved Accommodation/Modification |
12 |
- |
||
|
5 |
Reading |
Nonapproved Accommodation/Modification |
14 |
- |
||
|
6 |
Reading |
Nonapproved Accommodation/Modification |
4 |
- |
||
|
7 |
Reading |
Nonapproved Accommodation/Modification |
5 |
- |
||
|
8 |
Reading |
Nonapproved Accommodation/Modification |
4 |
- |
||
|
9 |
Reading |
Nonapproved Accommodation/Modification |
3 |
- |
||
|
10 |
Reading |
Nonapproved Accommodation/Modification |
4 |
- |
||
|
3 |
Math |
Nonapproved Accommodation/Modification |
0 |
- |
||
|
4 |
Math |
Nonapproved Accommodation/Modification |
4 |
- |
||
|
5 |
Math |
Nonapproved Accommodation/Modification |
2 |
- |
||
|
6 |
Math |
Nonapproved Accommodation/Modification |
0 |
- |
||
|
7 |
Math |
Nonapproved Accommodation/Modification |
1 |
- |
||
|
8 |
Math |
Nonapproved Accommodation/Modification |
1 |
- |
||
|
9 |
Math |
Nonapproved Accommodation/Modification |
12 |
- |
||
|
10 |
Math |
Nonapproved Accommodation/Modification |
1 |
- |
||
|
8 |
Science |
Nonapproved Accommodation/Modification |
7 |
- |
||
|
3 |
Writing |
Nonapproved Accommodation/Modification |
3 |
- |
||
|
4 |
Writing |
Nonapproved Accommodation/Modification |
13 |
- |
||
|
5 |
Writing |
Nonapproved Accommodation/Modification |
14 |
- |
||
|
6 |
Writing |
Nonapproved Accommodation/Modification |
5 |
- |
||
|
7 |
Writing |
Nonapproved Accommodation/Modification |
3 |
- |
||
|
8 |
Writing |
Nonapproved Accommodation/Modification |
3 |
- |
||
|
9 |
Writing |
Nonapproved Accommodation/Modification |
6 |
- |
||
|
10 |
Writing |
Nonapproved Accommodation/Modification |
5 |
- |
||
|
Idaho: Accommodation for Reading Assessment (IRI)1 |
||||||
|
Kindergarten |
Reading |
Accommodation: Fall 2004 |
111 |
23/44/32 |
||
|
Kindergarten |
Reading |
Adaptation: Fall 2004 |
20 |
0/25/75 |
||
|
First |
Reading |
Accommodation: Fall 2004 |
132 |
48/28/24 |
||
|
First |
Reading |
Adaptation: Fall 2004 |
7 |
29/0/71 |
||
|
Second |
Reading |
Accommodation: Fall 2004 |
195 |
26/33/42 |
||
|
Second |
Reading |
Adaptation: Fall 2004 |
14 |
14/36/50 |
||
|
Kindergarten |
Reading |
Accommodation: Winter 2005 |
167 |
22/43/36 |
||
|
Kindergarten |
Reading |
Adaptation: Winter 2005 |
10 |
20/20/60 |
||
|
First |
Reading |
Accommodation: Winter 2005 |
172 |
45/33/22 |
||
|
First |
Reading |
Adaptation: Winter 2005 |
7 |
14/29/57 |
||
|
Second |
Reading |
Accommodation: Winter 2005 |
265 |
17/28/54 |
||
|
Second |
Reading |
Adaptation: Winter 2005 |
28 |
25/25/50 |
||
|
Kindergarten |
Reading |
Accommodation: Spring 2005 |
170 |
44/28/28 |
||
|
Kindergarten |
Reading |
Adaptation: Spring 2005 |
9 |
44/22/33 |
||
|
First |
Reading |
Accommodation: Spring 2005 |
182 |
27/45/28 |
||
|
First |
Reading |
Adaptation: Spring 2005 |
8 |
25/50/25 |
||
|
Second |
Reading |
Accommodation: Spring 2005 |
332 |
20/30/49 |
||
|
Second |
Reading |
Adaptation: Spring 2005 |
17 |
6/24/71 |
||
|
Indiana: ISTEP+ (Grades 3-9) and GQE (Grade 10) “Special Ed with Accommodations”2 |
||||||
|
3 |
E/LA |
Accommodations |
5898 |
23% |
||
|
4 |
E/LA |
Accommodations |
7063 |
23% |
||
|
5 |
E/LA |
Accommodations |
7846 |
22% |
||
|
6 |
E/LA |
Accommodations |
8693 |
21% |
||
|
7 |
E/LA |
Accommodations |
9093 |
18% |
||
|
8 |
E/LA |
Accommodations |
9230 |
19% |
||
|
9 |
E/LA |
Accommodations |
8454 |
15% |
||
|
10 |
E/LA |
Accommodations |
8069 |
19% |
||
|
3 |
Math |
Accommodations |
5750 |
28% |
||
|
4 |
Math |
Accommodations |
6891 |
32% |
||
|
5 |
Math |
Accommodations |
7671 |
32% |
||
|
6 |
Math |
Accommodations |
8434 |
33% |
||
|
7 |
Math |
Accommodations |
8856 |
29% |
||
|
8 |
Math |
Accommodations |
9082 |
26% |
||
|
9 |
Math |
Accommodations |
8436 |
25% |
||
|
10 |
Math |
Accommodations |
8062 |
21% |
||
|
5 |
Science |
Accommodations |
7130 |
29% |
||
Kansas: “Students with IEPs Taking the Regular Assessment with Accommodations”3 |
||||||
|
All |
Reading |
Accommodations |
12,089 |
19% |
||
|
All |
Math |
Accommodations |
12,089 |
27% |
||
|
Kentucky: KY Core Content Test “Students with Disabilities Tested With Accommodations”2 |
||||||
|
4 |
Reading |
Accommodations |
5349 (11% of SWDs) |
539 (10%) |
||
|
7 |
Reading |
Accommodations |
5238 (10%) |
493 (9%) |
||
|
10 |
Reading |
Accommodations |
3755 (8%) |
458 (12%) |
||
|
5 |
Math |
Accommodations |
5666 (12%) |
540 (10%) |
||
|
8 |
Math |
Accommodations |
5022 (10%) |
500 (10%) |
||
|
11 |
Math |
Accommodations |
2,964 (7%) |
473 (16%) |
||
|
4 |
Science |
Accommodations |
5349 (11%) |
543 (10%) |
||
|
7 |
Science |
Accommodations |
5238 (10%) |
484 (9%) |
||
|
11 |
Science |
Accommodations |
2964 (7%) |
504 (17%) |
||
|
5 |
Soc. St. |
Accommodations |
5666 (12%) |
526 (9%) |
||
|
8 |
Soc. St. |
Accommodations |
5022 (10%) |
475 (9%) |
||
|
11 |
Soc. St. |
Accommodations |
2964 (7%) |
483 (16%) |
||
|
4 |
Writing Portfolio |
Accommodations |
5290 (11%) |
Proficiency levels report. |
||
|
4 |
Writing On Demand |
Accommodations |
5349 (11%) |
Proficiency levels report. |
||
|
7 |
Writing Portfolio |
Accommodations |
5166(10%) |
Proficiency levels report. |
||
|
7 |
Writing On Demand |
Accommodations |
5238 (10%) |
Proficiency levels report. |
||
|
5 |
A & H |
Accommodations |
5666 (12%) |
496 (9%) |
||
|
8 |
A & H |
Accommodations |
5022 (10%) |
467 (9%) |
||
|
5 |
PL/VS |
Accommodations |
5666(12%) |
496 (9%) |
||
|
8 |
PL/VS |
Accommodations |
5022 (10%) |
463 (9%) |
||
Kentucky: CTBS/5 “Students with Disabilities Tested With Accommodations”4 |
||||||
|
End of Primary |
Reading |
Accommodations |
4309 (9%) |
NP = 39 |
||
|
6 |
Reading |
Accommodations |
4646 (9%) |
NP = 29 |
||
|
End of Primary |
Math |
Accommodations |
4309 (9%) |
NP = 35 |
||
|
6 |
Math |
Accommodations |
4646 (9%) |
NP = 22 |
||
|
End of Primary |
Language |
Accommodations |
4309 (9%) |
NP = 30 |
||
|
6 |
Language |
Accommodations |
4646 (9%) |
NP = 25 |
||
|
Louisiana: ITBS “All Students”4 |
||||||
|
3 |
Reading |
Calculator Used |
12226 |
NP=48 |
||
|
5 |
Reading |
Calculator Used |
21709 |
NP=52 |
||
|
6 |
Reading |
Calculator Used |
29723 |
NP=43 |
||
|
7 |
Reading |
Calculator Used |
34400 |
NP=45 |
||
|
8 |
Reading |
Calculator Used |
1411 |
NP=16 |
||
|
9 |
Reading |
Calculator Used |
30827 |
NP=49 |
||
|
3 |
Math |
Calculator Used |
12229 |
NP=52 |
||
|
5 |
Math |
Calculator Used |
21710 |
NP=60 |
||
|
6 |
Math |
Calculator Used |
29728 |
NP=51 |
||
|
7 |
Math |
Calculator Used |
34417 |
NP=53 |
||
|
8 |
Math |
Calculator Used |
1421 |
NP=21 |
||
|
9 |
Math |
Calculator Used |
30886 |
NP=58 |
||
|
3 |
Language |
Calculator Used |
12226 |
NP=60 |
||
|
5 |
Language |
Calculator Used |
21709 |
NP=67 |
||
|
6 |
Language |
Calculator Used |
29718 |
NP=56 |
||
|
7 |
Language |
Calculator Used |
34397 |
NP=57 |
||
|
8 |
Language |
Calculator Used |
1411 |
NP=23 |
||
|
9 |
Language |
Calculator Used |
30841 |
NP=56 |
||
|
3 |
Soc. St. |
Calculator Used |
12221 |
NP=55 |
||
|
5 |
Soc. St. |
Calculator Used |
21704 |
NP=56 |
||
|
6 |
Soc. St. |
Calculator Used |
29707 |
NP=50 |
||
|
7 |
Soc. St. |
Calculator Used |
34384 |
NP=51 |
||
|
8 |
Soc. St. |
Calculator Used |
1405 |
NP=19 |
||
|
9 |
Soc. St. |
Calculator Used |
30839 |
NP=51 |
||
|
3 |
Science |
Calculator Used |
12222 |
NP=50 |
||
|
5 |
Science |
Calculator Used |
21705 |
NP=60 |
||
|
6 |
Science |
Calculator Used |
29706 |
NP=49 |
||
|
7 |
Science |
Calculator Used |
34378 |
NP=51 |
||
|
8 |
Science |
Calculator Used |
1405 |
NP=19 |
||
|
9 |
Science |
Calculator Used |
30841 |
NP=54 |
||
|
Michigan: MEAP “All Students” |
||||||
|
4 |
Math |
Standard Accommodations |
7598 |
43% |
||
|
Non-Standard Accommodations |
37 |
- |
||||
|
4 |
Reading |
Standard Accommodations |
3255 |
45% |
||
|
Non-Standard Accommodations |
60 |
- |
||||
|
4 |
Writing |
Standard Accommodations |
3005 |
21% |
||
|
Non-Standard Accommodations |
90 |
- |
||||
|
4 |
Listening |
Standard Accommodations |
1471 |
54% |
||
|
Non-Standard Accommodations |
27 |
- |
||||
|
Michigan: MEAP “Non Special Education” |
||||||
|
4 |
Math |
Standard Accommodations |
2380 |
54% |
||
|
Non-Standard Accommodations |
<10 |
- |
||||
|
4 |
Reading |
Standard Accommodations |
869 |
48% |
||
|
Non-Standard Accommodations |
14 |
- |
||||
|
4 |
Writing |
Standard Accommodations |
774 |
28% |
||
|
Non-Standard Accommodations |
65 |
- |
||||
|
4 |
Listening |
Standard Accommodations |
264 |
52% |
||
|
Non-Standard Accommodations |
<10 |
- |
||||
|
Michigan: MEAP “Special Education” |
||||||
|
4 |
Math |
Standard Accommodations |
5218 |
38% |
||
|
Non-Standard Accommodations |
30 |
- |
||||
|
4 |
Reading |
Standard Accommodations |
2386 |
44% |
||
|
Non-Standard Accommodations |
46 |
- |
||||
|
4 |
Writing |
Standard Accommodations |
2231 |
19% |
||
|
Non-Standard Accommodations |
25 |
- |
||||
|
4 |
Listening |
Standard Accommodations |
1207 |
54% |
||
|
Non-Standard Accommodations |
21 |
- |
||||
|
Michigan: MEAP “All Students” |
||||||
|
5 |
Science |
Standard Accommodations |
9132 |
58% |
||
|
Non-Standard Accommodations |
46 |
- |
||||
|
5 |
Soc. St. |
Standard Accommodations |
8195 |
7% |
||
|
Non-Standard Accommodations |
37 |
- |
||||
|
Michigan: MEAP “Non Special Education” |
||||||
|
5 |
Science |
Standard Accommodations |
2079 |
60% |
||
|
Non-Standard Accommodations |
<10 |
- |
||||
|
5 |
Soc. St. |
Standard Accommodations |
1222 |
10% |
||
|
Non-Standard Accommodations |
<10 |
- |
||||
|
Michigan: MEAP “Special Education” |
||||||
|
5 |
Science |
Standard Accommodations |
7053 |
58% |
||
|
Non-Standard Accommodations |
41 |
- |
||||
|
5 |
Soc. St. |
Standard Accommodations |
6973 |
7% |
||
|
Non-Standard Accommodations |
32 |
- |
||||
|
Michigan: MEAP “All Students” |
||||||
|
7 |
Reading |
Standard Accommodations |
3031 |
35% |
||
|
Non-Standard Accommodations |
30 |
- |
||||
|
7 |
Writing |
Standard Accommodations |
2954 |
25% |
||
|
Non-Standard Accommodations |
12 |
- |
||||
|
7 |
Listening |
Standard Accommodations |
1298 |
27% |
||
|
Non-Standard Accommodations |
<10 |
- |
||||
|
Michigan: MEAP “Non Special Education” |
||||||
|
7 |
Reading |
Standard Accommodations |
655 |
35% |
||
|
Non-Standard Accommodations |
<10 |
- |
||||
|
7 |
Writing |
Standard Accommodations |
650 |
32% |
||
|
Non-Standard Accommodations |
<10 |
- |
||||
|
7 |
Listening |
Standard Accommodations |
212 |
25% |
||
|
Non-Standard Accommodations |
<10 |
- |
||||
|
Michigan: MEAP “Special Education” |
||||||
|
7 |
Reading |
Standard Accommodations |
2376 |
35% |
||
|
Non-Standard Accommodations |
26 |
- |
||||
|
7 |
Writing |
Standard Accommodations |
2304 |
23% |
||
|
Non-Standard Accommodations |
<10 |
- |
||||
|
7 |
Listening |
Standard Accommodations |
1086 |
27% |
||
|
Non-Standard Accommodations |
<10 |
- |
||||
|
Michigan: MEAP “All Students” |
||||||
|
8 |
Math |
Standard Accommodations |
6818 |
22% |
||
|
Non-Standard Accommodations |
18 |
- |
||||
|
8 |
Science |
Standard Accommodations |
7313 |
30% |
||
|
Non-Standard Accommodations |
24 |
- |
||||
|
8 |
Soc. St. |
Standard Accommodations |
7222 |
6% |
||
|
Non-Standard Accommodations |
17 |
- |
||||
|
Michigan: MEAP “Non Special Education” |
||||||
|
8 |
Math |
Standard Accommodations |
1195 |
34% |
||
|
Non-Standard Accommodations |
<10 |
- |
||||
|
8 |
Science |
Standard Accommodations |
1246 |
29% |
||
|
Non-Standard Accommodations |
<10 |
- |
||||
|
8 |
Soc. St. |
Standard Accommodations |
1252 |
10% |
||
|
Non-Standard Accommodations |
<10 |
- |
||||
|
Michigan: MEAP “Special Education” |
||||||
|
8 |
Math |
Standard Accommodations |
5623 |
19% |
||
|
Non-Standard Accommodations |
14 |
- |
||||
|
8 |
Science |
Standard Accommodations |
6067 |
31% |
||
|
Non-Standard Accommodations |
15 |
- |
||||
|
8 |
Soc. St. |
Standard Accommodations |
5970 |
5% |
||
|
Non-Standard Accommodations |
13 |
- |
||||
|
Mississippi: Testing Accommodations used in 2004/2005 |
||||||
|
- |
- |
Read directions and items (repeating & paraphrasing) |
12,899 (24.4%) |
- |
||
|
- |
- |
Administered in a small group setting |
8454 (16.0%) |
- |
||
|
- |
- |
Read directions (repeating & paraphrasing) |
6295 (11.9%) |
- |
||
|
- |
- |
Reminders to stay on task |
5026 (9.5%) |
- |
||
|
- |
- |
Administered by a familiar teacher |
4515 (8.5%) |
- |
||
|
- |
- |
Allowing extra time to complete test |
3405 (6.4%) |
- |
||
|
- |
- |
Use of allowable memory aids |
2585 (4.9%) |
- |
||
|
- |
- |
Administered in a familiar room |
2112 (4.0%) |
- |
||
|
- |
- |
Sitting at the front of the class |
2112 (4.0%) |
- |
||
|
- |
- |
Facing the test administrator |
1573 (3.0%) |
- |
||
|
- |
- |
Read directions and items (repeating; not paraphrasing) |
888 (1.7%) |
- |
||
|
- |
- |
Read directions and items (no repeating or paraphrasing) |
495 (0.9%) |
- |
||
|
- |
- |
Highlighting |
415 (0.8%) |
- |
||
|
- |
- |
Read directions (repeating; not paraphrasing) |
352 (0.6%) |
- |
||
|
- |
- |
Individual administration |
320 (0.6%) |
- |
||
|
- |
- |
Native Language Dictionary |
286 (0.5%) |
- |
||
|
- |
- |
Read directions (without repeating or paraphrasing) |
275 (0.5%) |
- |
||
|
- |
- |
Scheduled rest breaks |
183 (0.3%) |
- |
||
|
- |
- |
Student dictates answers |
161 (0.3%) |
- |
||
|
- |
- |
Cues |
115 (0.2%) |
- |
||
|
Missouri: Subset of Students with Disabilities Who Took the Assessment with Accommodations |
||||||
|
3 |
Math |
- |
0 |
- |
||
|
4 |
Math |
- |
7240 |
- |
||
|
5 |
Math |
- |
0 |
- |
||
|
6 |
Math |
- |
0 |
- |
||
|
7 |
Math |
- |
0 |
- |
||
|
8 |
Math |
- |
8770 |
- |
||
|
10 |
Math |
- |
6740 |
- |
||
|
3 |
Reading |
- |
6383 |
- |
||
|
4 |
Reading |
- |
0 |
- |
||
|
5 |
Reading |
- |
0 |
- |
||
|
6 |
Reading |
- |
0 |
- |
||
|
7 |
Reading |
- |
8740 |
- |
||
|
8 |
Reading |
- |
0 |
- |
||
|
11 |
Reading |
- |
5484 |
- |
||
|
Nebraska: Statewide Writing Assessment “All Students” |
||||||
|
4 |
Writing |
Receiving Accommodations |
1487 (7.5%) |
- |
||
|
8 |
Writing |
Receiving Accommodations |
1331 (6.2%) |
- |
||
|
11 |
Writing |
Receiving Accommodations |
835 (4.2%) |
- |
||
|
Nebraska: Statewide Writing Assessment “Special Education” |
||||||
|
4 |
Writing |
Receiving Accommodations |
1200 (37.5%) |
- |
||
|
8 |
Writing |
Receiving Accommodations |
1158 (39.5%) |
- |
||
|
11 |
Writing |
Receiving Accommodations |
715 (34.9%) |
- |
||
|
Nevada: Reasons for Students Not Tested: Modified: ITBS/ITED |
||||||
|
4 |
Language |
- |
8 |
- |
||
|
4 |
Math |
- |
4 |
- |
||
|
4 |
Reading |
- |
29 |
- |
||
|
4 |
Science |
- |
5 |
- |
||
|
7 |
Language |
- |
65 |
- |
||
|
7 |
Math |
- |
68 |
- |
||
|
7 |
Reading |
- |
89 |
- |
||
|
7 |
Science |
- |
65 |
- |
||
|
10 |
Language |
- |
23 |
- |
||
|
10 |
Math |
- |
25 |
- |
||
|
10 |
Reading |
- |
23 |
- |
||
|
10 |
Science |
- |
25 |
- |
||
|
Nevada: Reasons for Students Not Tested: Modified: CRT |
||||||
|
3 |
Math |
- |
23 |
- |
||
|
3 |
Reading |
- |
35 |
- |
||
|
5 |
Math |
- |
13 |
- |
||
|
5 |
Reading |
- |
46 |
- |
||
|
5 |
Science |
- |
0 |
- |
||
|
8 |
Math |
- |
33 |
- |
||
|
8 |
Reading |
- |
28 |
- |
||
|
8 |
Science |
- |
0 |
- |
||
|
Nevada: Reasons for Students Not Tested: Modified: NAWE |
||||||
|
4 |
Writing |
- |
24 |
- |
||
|
8 |
Writing |
- |
19 |
- |
||
|
New Mexico: NMSBA and NMHSSA Combined |
||||||
|
- |
Reading |
Timing/Scheduling: Non-SPED |
- |
587 (38%) |
||
|
- |
Reading |
Timing/Scheduling: SPED |
- |
144 (6%) |
||
|
- |
Reading |
Response: Non-SPED |
- |
34 (31%) |
||
|
- |
Reading |
Response: SPED |
- |
32 (18%) |
||
|
- |
Reading |
Response & Timing/Scheduling: Non-SPED |
- |
6 (25%) |
||
|
- |
Reading |
Response & Timing/Scheduling: SPED |
- |
13 (7%) |
||
|
- |
Reading |
Presentation: Non-SPED |
- |
875 (20%) |
||
|
- |
Reading |
Presentation: SPED |
- |
318 (6%) |
||
|
- |
Reading |
Presentation & Timing/Scheduling: Non-SPED |
- |
231 (32%) |
||
|
- |
Reading |
Presentation & Timing/Scheduling: SPED |
- |
137 (7%) |
||
|
- |
Reading |
Response & Presentation: Non-SPED |
- |
94 (27%) |
||
|
- |
Reading |
Response & Presentation: SPED |
- |
71 (12%) |
||
|
- |
Reading |
Response, Presentation, & Timing/Scheduling: Non-SPED |
- |
175 (27%) |
||
|
- |
Reading |
Response, Presentation, & Timing/Scheduling: SPED |
- |
92 (7%) |
||
|
- |
Math |
Timing/Scheduling: Non-SPED |
- |
329 (24%) |
||
|
- |
Math |
Timing/Scheduling: SPED |
- |
36 (4%) |
||
|
- |
Math |
Response: Non-SPED |
- |
19 (37%) |
||
|
- |
Math |
Response: SPED |
- |
7 (12%) |
||
|
- |
Math |
Response & Timing/Scheduling: Non-SPED |
- |
4 (16%) |
||
|
- |
Math |
Response & Timing/Scheduling: SPED |
- |
3 (4%) |
||
|
- |
Math |
Presentation: Non-SPED |
- |
848 (14%) |
||
|
- |
Math |
Presentation: SPED |
- |
391 (4%) |
||
|
- |
Math |
Presentation & Timing/Scheduling: Non-SPED |
- |
181 (22%) |
||
|
- |
Math |
Presentation & Timing/Scheduling: SPED |
- |
110 (4%) |
||
|
- |
Math |
Response & Presentation: Non-SPED |
- |
269 (16%) |
||
|
- |
Math |
Response & Presentation: SPED |
- |
94 (7%) |
||
|
- |
Math |
Response, Presentation, & Timing/Scheduling: Non-SPED |
- |
117 (17%) |
||
|
- |
Math |
Response, Presentation, & Timing/Scheduling: SPED |
- |
58 (4%) |
||
|
North Carolina: “Students with Accommodations” |
||||||
|
Grade 3 Pretest |
Reading |
Braille Edition |
19 |
74% |
||
|
Large Print Edition |
38 |
45% |
||||
|
Assistive Technology Devices |
32 |
69% |
||||
|
Braille Writer/Slate and Stylus |
6 |
50% |
||||
|
Cranmer Abacus |
4 |
- |
||||
|
Dictation to Scribe |
59 |
32% |
||||
|
Interpreter Signs/Cues Tests |
13 |
39% |
||||
|
Magnification Devices |
16 |
63% |
||||
|
Marks Answers in Test Book |
5121 |
36% |
||||
|
Reads Test Aloud (in English) |
6534 |
32% |
||||
|
Keyboarding Devices |
1 |
- |
||||
|
Hospital/Home Testing |
2 |
- |
||||
|
Multiple Testing Sessions |
2516 |
35% |
||||
|
Scheduled Extended Time |
7645 |
38% |
||||
|
Testing in a Separate Room |
7095 |
36% |
||||
|
Dictionary/Electronic Translator |
203 |
42% |
||||
|
One Test Item Per Page Edition |
28 |
29% |
||||
|
Accommodation Notification Form |
15 |
33% |
||||
|
Grade 3 Pretest |
Math (participa-tion is an estimate from the reading test) |
Braille Edition |
19 |
95% |
||
|
Large Print Edition |
38 |
63% |
||||
|
Assistive Technology Devices |
32 |
72% |
||||
|
Braille Writer/Slate and Stylus |
6 |
67% |
||||
|
Cranmer Abacus |
4 |
- |
||||
|
Dictation to Scribe |
59 |
66% |
||||
|
Interpreter Signs/Cues Tests |
13 |
59% |
||||
|
Magnification Devices |
16 |
69% |
||||
|
Marks Answers in Test Book |
5121 |
70% |
||||
|
Reads Test Aloud (in English) |
6534 |
71% |
||||
|
|
|
Keyboarding Devices |
1 |
- |
|
Hospital/Home Testing |
2 |
- |
||
|
Multiple Testing Sessions |
2516 |
69% |
||
|
Scheduled Extended Time |
7645 |
72% |
||
|
Testing in a Separate Room |
7095 |
71% |
||
|
Dictionary/Electronic Translator |
203 |
79% |
||
|
One Test Item Per Page Edition |
28 |
41% |
||
|
Accommodation Notification Form |
15 |
53% |
||
|
End-of-Grade 3 |
Reading and Math |
Braille Edition |
5 |
40% |
|
Large Print Edition |
73 |
55% |
||
|
Assistive Technology Devices |
60 |
50% |
||
|
Braille Writer/Slate and Stylus |
2 |
- |
||
|
Cranmer Abacus |
4 |
- |
||
|
Dictation to Scribe |
112 |
38% |
||
|
Interpreter Signs/Cues Tests |
17 |
41% |
||
|
Magnification Devices |
24 |
63% |
||
|
Marks Answers in Test Book |
9510 |
44% |
||
|
Reads Test Aloud (in English) |
10,114 |
39% |
||
|
Keyboarding Devices |
2 |
- |
||
|
Hospital/Home Testing |
8 |
63% |
||
|
Multiple Testing Sessions |
5618 |
44% |
||
|
Scheduled Extended Time |
13,620 |
45% |
||
|
Testing in a Separate Room |
12,671 |
43% |
||
|
Dictionary/Electronic Translator |
348 |
49% |
||
|
One Test Item Per Page Edition |
76 |
42% |
||
|
Accommodation Notification Form |
78 |
55% |
||
|
End-of-Grade 4 |
Reading and Math |
Braille Edition |
1 |
- |
|
Large Print Edition |
76 |
58% |
||
|
Assistive Technology Devices |
68 |
48% |
||
|
Braille Writer/Slate and Stylus |
2 |
- |
||
|
Cranmer Abacus |
1 |
- |
||
|
Dictation to Scribe |
159 |
40% |
||
|
Interpreter Signs/Cues Tests |
15 |
20% |
||
|
Magnification Devices |
28 |
61% |
||
|
Marks Answers in Test Book |
9697 |
50% |
||
|
Reads Test Aloud (in English) |
10,429 |
42% |
||
|
Keyboarding Devices |
3 |
- |
||
|
Hospital/Home Testing |
10 |
50% |
||
|
Multiple Testing Sessions |
6020 |
49% |
||
|
Scheduled Extended Time |
14,838 |
51% |
||
|
Testing in a Separate Room |
13,582 |
49% |
||
|
Dictionary/Electronic Translator |
416 |
52% |
||
|
One Test Item Per Page Edition |
58 |
48% |
||
|
Accommodation Notification Form |
47 |
49% |
||
|
End-of-Grade 5 |
Reading and Math |
Braille Edition |
9 |
89% |
|
Large Print Edition |
85 |
83% |
||
|
Assistive Technology Devices |
55 |
69% |
||
|
Braille Writer/Slate and Stylus |
8 |
88% |
||
|
Cranmer Abacus |
6 |
83% |
|
|
|
Dictation to Scribe |
120 |
50% |
|
Interpreter Signs/Cues Tests |
31 |
52% |
||
|
Magnification Devices |
16 |
88% |
||
|
Marks Answers in Test Book |
9301 |
57% |
||
|
Reads Test Aloud (in English) |
9801 |
50% |
||
|
Keyboarding Devices |
2 |
- |
||
|
Hospital/Home Testing |
8 |
75% |
||
|
Multiple Testing Sessions |
5863 |
55% |
||
|
Scheduled Extended Time |
14,609 |
58% |
||
|
Testing in a Separate Room |
13,213 |
565 |
||
|
Dictionary/Electronic Translator |
401 |
55% |
||
|
One Test Item Per Page Edition |
48 |
47% |
||
|
Accommodation Notification Form |
62 |
66% |
||
|
End-of-Grade 6 |
Reading and Math |
Braille Edition |
3 |
- |
|
Large Print Edition |
69 |
73% |
||
|
Assistive Technology Devices |
42 |
56% |
||
|
Braille Writer/Slate and Stylus |
3 |
- |
||
|
Cranmer Abacus |
3 |
- |
||
|
Dictation to Scribe |
96 |
50% |
||
|
Interpreter Signs/Cues Tests |
17 |
29% |
||
|
Magnification Devices |
10 |
67% |
||
|
Marks Answers in Test Book |
6431 |
46% |
||
|
Reads Test Aloud (in English) |
8139 |
34% |
||
|
Keyboarding Devices |
5 |
40% |
||
|
Hospital/Home Testing |
31 |
45% |
||
|
Multiple Testing Sessions |
3739 |
41% |
||
|
Scheduled Extended Time |
13,615 |
45% |
||
|
Testing in a Separate Room |
11,095 |
41% |
||
|
Dictionary/Electronic Translator |
803 |
30% |
||
|
One Test Item Per Page Edition |
21 |
33% |
||
|
Accommodation Notification Form |
36 |
47% |
||
|
End-of-Grade 7 |
Reading and Math |
Braille Edition |
7 |
67% |
|
Large Print Edition |
64 |
70% |
||
|
Assistive Technology Devices |
33 |
58% |
||
|
Braille Writer/Slate and Stylus |
4 |
- |
||
|
Cranmer Abacus |
3 |
- |
||
|
Dictation to Scribe |
82 |
39% |
||
|
Interpreter Signs/Cues Tests |
23 |
22% |
||
|
Magnification Devices |
11 |
55% |
||
|
Marks Answers in Test Book |
5280 |
45% |
||
|
Reads Test Aloud (in English) |
7623 |
32% |
||
|
Keyboarding Devices |
5 |
60% |
||
|
Hospital/Home Testing |
37 |
54% |
||
|
Multiple Testing Sessions |
3409 |
38% |
||
|
Scheduled Extended Time |
14,082 |
44% |
||
|
Testing in a Separate Room |
11,059 |
39% |
||
|
Dictionary/Electronic Translator |
909 |
34% |
||
|
One Test Item Per Page Edition |
25 |
36% |
||
|
Accommodation Notification Form |
27 |
41% |
||
|
End-of-Grade 8 |
Reading and Math |
Braille Edition |
5 |
40% |
|
Large Print Edition |
64 |
50% |
||
|
Assistive Technology Devices |
36 |
51% |
||
|
Braille Writer/Slate and Stylus |
4 |
- |
||
|
Cranmer Abacus |
5 |
- |
||
|
Dictation to Scribe |
58 |
47% |
||
|
Interpreter Signs/Cues Tests |
30 |
43% |
||
|
Magnification Devices |
18 |
56% |
||
|
Marks Answers in Test Book |
4381 |
44% |
||
|
Reads Test Aloud (in English) |
7038 |
31% |
||
|
Keyboarding Devices |
5 |
20% |
||
|
Hospital/Home Testing |
52 |
40% |
||
|
Multiple Testing Sessions |
2901 |
37% |
||
|
Scheduled Extended Time |
13,729 |
45% |
||
|
Testing in a Separate Room |
10,359 |
40% |
||
|
Dictionary/Electronic Translator |
915 |
35% |
||
|
One Test Item Per Page Edition |
31 |
32% |
||
|
Accommodation Notification Form |
28 |
41% |
||
|
End-of-Course |
Algebra I |
Braille Edition |
8 |
75% |
|
Large Print Edition |
44 |
71% |
||
|
Assistive Technology Devices |
19 |
74% |
||
|
Keyboarding Devices |
10 |
30% |
||
|
Cranmer Abacus |
1 |
- |
||
|
Dictation to Scribe |
39 |
64% |
||
|
Magnification Devices |
9 |
67% |
||
|
Hospital/Home Testing |
29 |
55% |
||
|
Testing in a Separate Room |
16 |
81% |
||
|
Scheduled Extended Time |
7839 |
56% |
||
|
One Test Item Per Page Edition |
10 |
30% |
||
|
Multiple Testing Sessions |
605 |
49% |
||
|
Marks Answers in Test Book |
1566 |
63% |
||
|
Dictionary/Electronic Translator |
560 |
59% |
||
|
Interpreter Signs/Cues Test |
16 |
81% |
||
|
Reads Test Aloud (in English) |
3016 |
47% |
||
|
Braille Writer/Slate and Stylus |
4 |
- |
||
|
Accommodation Notification Form |
3 |
- |
||
|
End-of-Course |
Algebra II |
Braille Edition |
6 |
33% |
|
Large Print Edition |
20 |
75% |
||
|
Assistive Technology Devices |
8 |
88% |
||
|
Keyboarding Devices |
1 |
- |
||
|
Cranmer Abacus |
2 |
- |
||
|
Dictation to Scribe |
18 |
67% |
||
|
Magnification Devices |
5 |
20% |
||
|
Hospital/Home Testing |
13 |
62% |
||
|
Testing in a Separate Room |
19 |
63% |
||
|
Scheduled Extended Time |
1923 |
65% |
||
|
One Test Item Per Page Edition |
1 |
- |
||
|
Multiple Testing Sessions |
95 |
64% |
||
|
Marks Answers in Test Book |
309 |
68% |
||
|
Dictionary/Electronic Translator |
160 |
60% |
||
|
Interpreter Signs/Cues Test |
19 |
63% |
|
End-of-Course |
Algebra II |
Reads Test Aloud (in English) |
376 |
55% |
|
Braille Writer/Slate and Stylus |
4 |
- |
||
|
Accommodation Notification Form |
4 |
- |
||
|
End-of-Course |
Biology |
Braille Edition |
2 |
- |
|
Large Print Edition |
30 |
47% |
||
|
Assistive Technology Devices |
11 |
91% |
||
|
Keyboarding Devices |
8 |
38% |
||
|
Cranmer Abacus |
0 |
- |
||
|
Dictation to Scribe |
32 |
53% |
||
|
Magnification Devices |
3 |
- |
||
|
Hospital/Home Testing |
26 |
46% |
||
|
Testing in a Separate Room |
15 |
20% |
||
|
Scheduled Extended Time |
5230 |
31% |
||
|
One Test Item Per Page Edition |
8 |
38% |
||
|
Multiple Testing Sessions |
448 |
28% |
||
|
Marks Answers in Test Book |
963 |
41% |
||
|
Dictionary/Electronic Translator |
418 |
21% |
||
|
Interpreter Signs/Cues Test |
15 |
20% |
||
|
Reads Test Aloud (in English) |
2691 |
21% |
||
|
Braille Writer/Slate and Stylus |
1 |
- |
||
|
Accommodation Notification Form |
7 |
29% |
||
|
|
Chemistry |
Braille Edition |
1 |
- |
|
Large Print Edition |
10 |
80% |
||
|
Assistive Technology Devices |
1 |
- |
||
|
Keyboarding Devices |
1 |
- |
||
|
Cranmer Abacus |
1 |
- |
||
|
Dictation to Scribe |
8 |
63% |
||
|
Magnification Devices |
1 |
- |
||
|
Hospital/Home Testing |
4 |
- |
||
|
Testing in a Separate Room |
8 |
63% |
||
|
Scheduled Extended Time |
623 |
63% |
||
|
One Test Item Per Page Edition |
1 |
- |
||
|
Multiple Testing Sessions |
23 |
48% |
||
|
Marks Answers in Test Book |
105 |
72% |
||
|
Dictionary/Electronic Translator |
42 |
60% |
||
|
Interpreter Signs/Cues Test |
8 |
63% |
||
|
Reads Test Aloud (in English) |
90 |
41% |
||
|
Braille Writer/Slate and Stylus |
1 |
- |
||
|
Accommodation Notification Form |
1 |
- |
||
|
End-of-Course |
English I |
Braille Edition |
8 |
75% |
|
Large Print Edition |
26 |
65% |
||
|
Assistive Technology Devices |
9 |
67% |
||
|
Keyboarding Devices |
16 |
38% |
||
|
Cranmer Abacus |
0 |
- |
||
|
Dictation to Scribe |
38 |
50% |
||
|
Magnification Devices |
6 |
67% |
||
|
Hospital/Home Testing |
48 |
35% |
||
|
Testing in a Separate Room |
0 |
- |
||
|
Scheduled Extended Time |
8,180 |
43% |
|
End-of-Course |
English I |
One Test Item Per Page Edition |
16 |
38% |
|
Multiple Testing Sessions |
883 |
39% |
||
|
Marks Answers in Test Book |
1,753 |
52% |
||
|
Dictionary/Electronic Translator |
858 |
31% |
||
|
Interpreter Signs/Cues Test |
0 |
- |
||
|
Reads Test Aloud (in English) |
2 |
- |
||
|
Braille Writer/Slate and Stylus |
1 |
- |
||
|
Accommodation Notification Form |
21 |
24% |
||
|
End-of-Course |
Geometry |
Braille Edition |
4 |
- |
|
Large Print Edition |
22 |
55% |
||
|
Assistive Technology Devices |
12 |
42% |
||
|
Keyboarding Devices |
0 |
- |
||
|
Cranmer Abacus |
0 |
- |
||
|
Dictation to Scribe |
20 |
40% |
||
|
Magnification Devices |
4 |
- |
||
|
Hospital/Home Testing |
9 |
44% |
||
|
Testing in a Separate Room |
7 |
14% |
||
|
Scheduled Extended Time |
2,376 |
48% |
||
|
One Test Item Per Page Edition |
0 |
- |
||
|
Multiple Testing Sessions |
131 |
44% |
||
|
Marks Answers in Test Book |
399 |
54% |
||
|
Dictionary/Electronic Translator |
189 |
52% |
||
|
Interpreter Signs/Cues Test |
7 |
14% |
||
|
Reads Test Aloud (in English) |
590 |
36% |
||
|
Braille Writer/Slate and Stylus |
1 |
- |
||
|
Accommodation Notification Form |
1 |
- |
||
|
End-of-Course |
Physical Science |
Braille Edition |
2 |
- |
|
Large Print Edition |
25 |
40% |
||
|
Assistive Technology Devices |
8 |
25% |
||
|
Keyboarding Devices |
10 |
20% |
||
|
Cranmer Abacus |
0 |
- |
||
|
Dictation to Scribe |
24 |
46% |
||
|
Magnification Devices |
5 |
40% |
||
|
Hospital/Home Testing |
11 |
55% |
||
|
Testing in a Separate Room |
18 |
50% |
||
|
Scheduled Extended Time |
3,840 |
42% |
||
|
One Test Item Per Page Edition |
10 |
20% |
||
|
Multiple Testing Sessions |
324 |
41% |
||
|
Marks Answers in Test Book |
778 |
45% |
||
|
Dictionary/Electronic Translator |
289 |
38% |
||
|
Interpreter Signs/Cues Test |
18 |
50% |
||
|
Reads Test Aloud (in English) |
1,929 |
33% |
||
|
Braille Writer/Slate and Stylus |
1 |
- |
||
|
Accommodation Notification Form |
2 |
- |
||
|
End-of-Course |
Physics |
Braille Edition |
0 |
- |
|
Large Print Edition |
5 |
80% |
||
|
Assistive Technology Devices |
1 |
- |
||
|
Keyboarding Devices |
0 |
- |
||
|
Cranmer Abacus |
0 |
- |
|
End-of-Course |
Physics |
Dictation to Scribe |
3 |
- |
|
Magnification Devices |
1 |
- |
||
|
Hospital/Home Testing |
0 |
- |
||
|
Testing in a Separate Room |
0 |
- |
||
|
Scheduled Extended Time |
97 |
87% |
||
|
One Test Item Per Page Edition |
0 |
- |
||
|
Multiple Testing Sessions |
6 |
67% |
||
|
Marks Answers in Test Book |
22 |
82% |
||
|
Dictionary/Electronic Translator |
6 |
50% |
||
|
Interpreter Signs/Cues Test |
0 |
- |
||
|
Reads Test Aloud (in English) |
5 |
5% |
||
|
Braille Writer/Slate and Stylus |
0 |
- |
||
|
Accommodation Notification Form |
0 |
- |
||
|
|
||||
|
|
Math |
With Accommodations |
23,403 (62.5%) |
5012 (13.4%) |
|
|
Reading |
With Accommodations |
23,403 (62.5%) |
4314 (11.5%) |
|
|
||||
|
|
Math |
With Accommodations |
11,559 (32.5%) |
2904 (8.2%) |
|
End-of-Course |
Language Arts |
With Accommodations |
12,968 (36.5%) |
3054 (8.6%) |
|
|
||||
|
|
Math |
- |
1577 |
- |
|
|
Math |
- |
1868 |
- |
|
|
Math |
- |
2170 |
- |
|
6 |
Math |
- |
2177 |
- |
|
7 |
Math |
- |
2202 |
- |
|
8 |
Math |
- |
2149 |
- |
|
10 |
Math |
- |
1485 |
- |
|
3 |
Reading |
- |
931 |
- |
|
4 |
Reading |
- |
1053 |
- |
|
5 |
Reading |
- |
1249 |
- |
|
6 |
Reading |
- |
1162 |
- |
|
7 |
Reading |
- |
1021 |
- |
|
8 |
Reading |
- |
924 |
- |
|
10 |
Reading |
- |
792 |
- |
1
##/##/## format indicates the percent in
each proficiency group (GL3/GL2/GL1)
2
Also reports on LEP and non-LEP with
accommodations
3
From the State Performance Plan
4
National Percentile Rank
Appendix K
Performance Data for Reading and Math Assessments
|
State |
Subject |
Grade |
Type of Test |
Test Name |
|
Alabama |
Reading and Math |
4,8 |
CRT |
ARMT |
|
Reading and Math |
11 |
EXIT |
High School Graduation Exam |
|
|
Alaska |
Reading and Math |
3,8 |
CRT |
SBA |
|
Reading and Math |
10 |
EXIT |
HSGQE |
|
|
Arizona |
Reading and Math |
3,8 |
CRT |
AIMS |
|
Reading and Math |
10 |
EXIT |
AIMS Exit |
|
|
Arkansas |
Reading and Math |
4,8 |
CRT |
Benchmark Exams |
|
California |
Reading and Math |
4,7 |
CRT |
Content Standard |
|
Colorado |
Reading |
4,8,10 |
CRT |
CSAP |
|
Math |
5,8,10 |
CRT |
CSAP |
|
|
Connecticut |
Reading and Math |
4,8,10 |
CRT |
CMT |
|
Delaware |
Reading and Math |
3,8,10 |
NRT/CRT |
DSTP |
|
Georgia |
Reading and Math |
4,8 |
CRT |
CRCT |
|
Reading and Math |
11 |
EXIT |
GHSGT |
|
|
Hawaii |
Reading and Math |
4,8,10 |
CRT |
HCPS II |
|
Idaho |
Reading and Math |
4,8,10 |
CRT |
ISAT (referenced in charts as ID2) |
|
Illinois |
Reading and Math |
3,8 |
CRT |
ISAT |
|
Reading and Math |
11 |
CRT |
PSAE |
|
|
Indiana |
Reading and Math |
3,8 |
CRT |
ISTEP+ |
|
Reading and Math |
11 |
EXIT |
GQE |
|
|
Kansas |
Reading |
5,8,11 |
CRT |
KAS |
|
Math |
4,7,10 |
CRT |
KAS |
|
|
Kentucky |
Reading |
4,7 |
CRT |
KCCT |
|
Math |
5,8 |
CRT |
KCCT |
|
|
Louisiana |
Reading and Math |
4,8 |
CRT |
LEAP 21 |
|
Reading and Math |
10 |
EXIT |
GEE 21 |
|
|
Maine |
Reading and Math |
4,8,11 |
CRT |
MEA |
|
Maryland |
Reading and Math |
3,8,10 |
CRT |
MSA |
|
Reading and Math |
10 |
EXIT |
High School Assessment |
|
|
Massachusetts |
Reading |
4,7,10 |
CRT |
MCAS |
|
Math |
4,8,10 |
CRT |
MCAS |
|
|
Michigan |
Reading |
4,7 |
CRT |
MEAP |
|
Math |
4,8 |
CRT |
MEAP |
|
|
Minnesota |
Reading and Math |
3,7,10 |
CRT |
MCA |
|
Reading and Math |
8 |
EXIT |
BST |
|
|
Mississippi |
Reading and Math |
4,8 |
CRT |
MS Curriculum Test |
|
English and Algebra |
HS |
CRT |
Subject Area |
|
|
Missouri |
Reading |
3,7,11 |
CRT |
MAP |
|
Math |
4,8,10 |
CRT |
MAP |
|
|
Nebraska |
Math |
4,8,11 |
CRT |
Assess. of State Math Standards |
|
Nevada |
Reading and Math |
3 |
CRT |
NV Criterion-Referenced Test |
|
Reading and Math |
10 |
EXIT |
Graduation Exam |
|
|
New Hampshire |
Reading and Math |
3,6,10 |
CRT |
NHEIAP |
|
New Jersey |
Reading and Math |
4,8 |
CRT |
ESPA; GEPA |
|
Reading and Math |
11 |
EXIT |
HSPA |
|
|
New Mexico |
Reading and Math |
4,8 |
CRT |
NMAAP |
|
Reading and Math |
10 |
EXIT |
NM High Sch. Competency Exam |
|
|
New York |
Reading and Math |
4,8 |
CRT |
NY State Assessment Program |
|
Reading and Math |
|
EXIT |
Regents Comprehensive Exams / Regents Competency Test |
|
|
North Carolina |
Reading and Math |
3 |
CRT |
Grade 3 Pretest (referenced in charts as NC2) |
|
Reading and Math |
4,8,10 |
CRT |
End of Grade (referenced in charts as NC1) |
|
|
Reading and Math |
10 |
CRT |
End of Course (referenced in charts as NC3) |
|
|
Reading and Math |
10 |
CRT |
High School Comprehensive Test (referenced in charts as NC4) |
|
|
North Dakota |
Reading and Math |
4,8,12 |
CRT |
ND State Assessment |
|
Ohio |
Reading and Math |
4,6,10 |
CRT |
OH Proficiency Test (referenced as OH1) |
|
Reading |
3 |
CRT |
Grade 3 Reading Test (referenced as OH2) |
|
|
Reading and Math |
9 |
EXIT |
OH Proficiency Test |
|
|
Oklahoma |
Reading and Math |
5,8,HS |
CRT |
Core Content Test |
|
Pennsylvania |
Reading and Math |
5,8,11 |
CRT |
PSSA |
|
South Carolina |
Reading and Math |
10 |
EXIT |
High School Exit Exam |
|
Texas |
Reading and Math |
4, 8 |
CRT |
TAKS |
|
Utah |
Reading and Math |
10 |
EXIT |
TAKS-EXIT |
|
Reading |
4,8,10 |
CRT |
Core Criterion-Referenced Tests |
|
|
|
Math |
4,7 |
CRT |
Core Criterion-Referenced Tests |
|
Virginia |
Reading and Math |
3,8 |
CRT |
Standards of Learning |
|
Washington |
Reading and Math |
4,7,10 |
CRT |
WASL |
|
West Virginia |
Reading and Math |
EL,MS, HS |
CRT |
WESTTEST |
|
Wisconsin |
Reading and Math |
4,8,10 |
CRT |
WKCE |
|
Wyoming |
Reading and Math |
4,8,10 |
CRT |
WyCAS |