Synthesis Report 99
Science Alternate Assessments based on Alternate Achievement Standards (AA-AAS) During School Year 2014-2015
Christopher M. Rogers, Martha L. Thurlow, and Sheryl S. Lazarus
November 2015
All rights reserved. Any or all portions of this document may be reproduced and distributed without prior permission, provided the source is cited as:
Rogers, C. M., Thurlow, M. L., & Lazarus, S. S. (2015). Science alternate assessments based on alternate achievement standards (AA-AAS) during school year 2014-2015 (Synthesis Report 99). Minneapolis, MN: University of Minnesota, National Center on Educational Outcomes.
Table of Contents
Executive Summary
Federal law requires that all students, including students with disabilities, participate in state assessments used for accountability purposes. It also requires states to assess students in several content areas, including science. Most students with disabilities take the general science assessment with or without accommodations, but a few students with the most significant cognitive disabilities participate in alternate assessments based on alternate achievement standards (AA-AAS).
The purpose of this analysis was to learn more about the characteristics of states’ science AA-AAS in 2014-2015. Data for this report were gathered by examining information that was publicly available on state websites. Key findings include:
- Most states’ science AA-AAS covered the life science/biology, earth science/earth and space science, and physical sciences/physics content domains at all grade levels.
- In many states some content domains assessed differed between the general assessment and the AA-AAS.
- In some states more content domains were covered on the AA-AAS than on the general assessment and in others fewer content domains were covered.
- More than half of the states had item-based AA-AAS, while about a third of the states used portfolios; fewer than 10 used rating scales, either alone or in combination with another approach.
Although federal regulations do allow states to define the complexity, depth, and breadth of the AA-AAS, the apparent lack of consistency in the domains assessed suggests that some students with significant cognitive disabilities may not be getting access to the same rigorous grade-appropriate content. States’ evolving assessment systems provide an excellent opportunity for states and consortia to consider the content assessed by the science AA-AAS.
Top of Page / Table of Contents
Overview
The Elementary and Secondary Education Act (ESEA) requires that all children with disabilities are included in all state and district-wide assessment programs, and that students who are unable to participate in general assessments with or without accommodations participate in alternate assessments. Students with the most significant cognitive disabilities participate in alternate assessments based on alternate achievement standards (AA-AAS). ESEA also requires states to develop content standards and assessments for science (U.S. Department of Education, 2003, 2007). All states have had science assessments in place since the 2007-08 school year (Thurlow, Rogers, & Christensen, 2010); yet, little is known about states’ science AA-AAS.
The purpose of this analysis was to document the nature of states’ AA-AAS in science during the 2014-2015 school year. Three research questions are addressed in this report:
1. What science content domains were examined by the AA-AAS in science?
2.
How did the AA-AAS science content domains compare with the general assessment content domains? If different, were there fewer or more content domains on the AA-AAS than the general assessments?
3. What assessment approaches did states use for students participating in the AA-AAS in science? What were the response formats on the AA-AAS in science?
Top of Page / Table of Contents
Analysis Procedures
Data for this report were obtained through the examination and analysis of publicly-available information posted on state education department websites in the 50 regular states and Washington DC. Documents about states’ general science assessments and science AA-AAS were downloaded between January and June, 2015 to find information about their 2014-2015 AA-AAS. Information gathered included available information about test and item specifications, test blueprints, and other relevant documents.
The procedures used in the analysis of science domains were similar to the ones used by Thurlow et al. (2010) in their analysis of states’ general science assessments. The science domains for both the general and AA-AAS were coded using the same categories Thurlow et al. identified. To obtain a better understanding of how the science domains differed between a state’s general science assessment and its AA-AAS, we compared the science content domains, at each of the three schooling levels, for the two assessments. Data on the AA-AAS approach types and response formats were coded using a typology developed by Quenemoen, Quenemoen, Kearns, and Kennedy (2010). Quenemoen et al. identified four assessment approaches:
(1) Item-based testing is a compilation of individual questions designed to collectively ascertain the knowledge and skills of students at a single discrete point in time. Item-based tests were further categorized by the types of items included on a state’s assessment. For science, the three pertinent categories are:
- Selected-response items which typically employ multiple choice items.
- Constructed-response items where students produce written phrases or sentences to indicate their content knowledge.
- Performance tasks which are testing events that engage students in responding to a series of related questions or activities designed to evaluate students’ ability to apply their knowledge in both a process- and outcome-oriented manner.
(2) The student work product approach is when a body of evidence is collected across a span of time. The materials assembled into the portfolios are sets of student work collected purposefully to represent a subset of learning objectives linked to state academic content standards. Quenemoen et al. (2010) distinguished between structured and unstructured portfolios, which we simplified for the purposes of this analysis to one response category: portfolio.
(3) The teacher observation approach involves third parties, rather than students themselves, documenting students’ knowledge and skills through directly witnessing the knowledge and skills demonstrated by the student. Teacher observations employ checklists with rating scales, which were described by Quenemoen et al. as the rating of “student performance on a relatively long pre-scripted list of skills based on classroom observation” (p. 11).
Top of Page / Table of Contents
Results
AA-AAS Science Academic Content Specifications
As required by regulations, all states (including Washington DC) administered a science AA-AAS during the 2014-2015 school year. The specific content covered varied across states. Table 1 shows the content domains in elementary science assessments. At the elementary level, nearly all states (n=49) included life science/biology on their AA-AAS. The other two most common domains at the elementary level were earth science/earth and space science (n=47) and physical science (n=43), which typically included areas of physics such as objects in motion, and often also addressed chemistry. About half (n=26) of the states incorporated test items pertaining to the process of inquiry/investigation on their elementary AA-AAS. More than one-third (n=18) of the states addressed technology/engineering. Almost one-fourth (n=12) of states covered the nature of science/characteristics of science. A small number of states (n=5) had AA-AAS items addressing unique science content, such as nutrition, hygiene, and physical fitness and science applications. See Appendix A, Table A-1, for state-by-state details.
Table 1. AA-AAS Elementary Science Academic Content Specifications in 2014-2015
| Content Domain |
Number of Statesa |
| Earth Science / Earth & Space Science |
47 |
| Environmental / Ecological Science |
9 |
| Investigation / Inquiry Process |
26 |
| Life Science / Biology |
49 |
| Nature of Science / Characteristics of Science / History of Science |
12 |
| Personal and Social Impacts of Science |
8 |
| Physical Science / Physics / Physical & Chemical Science |
43 |
| Technology / Engineering |
18 |
| Unifying Concepts / Common Themes |
2 |
| Unique Categories / Uncategorizable |
5 |
aN=51
The same three content domains that were most often included on the elementary AA-AAS were also the most frequently listed domains at the middle school level, although in a different order of frequency (see Table 2). Earth science/earth and space science was the most common domain (n=47), physical science was the second-most frequent (in 46 states), and life science was the third-most frequent (n=44). The remaining science domains were ranked in the same order for the middle school AA-AAS as they were at the elementary level, and the tests had similar numbers of states with each domain. The less frequent content domains in middle school AA-AAS were very similar to those at the elementary level. See Appendix A, Table A-2, for more detail.
Table 2. AA-AAS Middle School Science Academic Content Specifications in 2014-2015
| Content Domain |
Number of Statesa |
| Earth Science / Earth & Space Science |
47 |
| Environmental / Ecological Science |
9 |
| Investigation / Inquiry Process |
25 |
| Life Science / Biology |
44 |
| Nature of Science / Characteristics of Science / History of Science |
13 |
| Personal and Social Impacts of Science |
8 |
| Physical Science / Physics / Physical & Chemical Science |
46 |
| Technology / Engineering |
17 |
| Unifying Concepts / Common Themes |
4 |
| Unique Categories / Uncategorizable |
4 |
aN=51
Table 3 shows the content domains in states’ high school science AA-AAS. Nearly all states’ high school AA-AAS contained life science/biology items (n=50). Many fewer states’ high-school AA-AAS addressed physical science (n=34) or earth science/earth and space science (n=29) than at the middle or elementary school level. Fewer than half (n=23) of all states had AA-AAS items about the investigation/inquiry process/scientific method. Less than 30 percent of states had test content either about the nature of science/characteristics of science/history of science or about technology/engineering. A few states (n=6) had tests that included only one domain-life science/biology. The high school level uniquely separated physical science/physics from chemistry into different content domains, and chemistry items were included on six states’ AA-AAS. The less frequently mentioned content domains in high school AA-AAS were very similar to those at the elementary and middle school levels. See Appendix A, Table A-3, for more detail.
Table 3. AA-AAS High School Science Academic Content Specifications in 2014-2015
| Content Domain |
Number of Statesa |
| Chemistry |
7 |
| Earth Science / Earth & Space Science |
29 |
| Environmental / Ecological Science |
11 |
| Investigation / Inquiry Process / Scientific Method |
22 |
| Life Science / Biology |
50 |
| Nature of Science / Characteristics of Science / History of Science |
14 |
| Personal and Social Impacts of Science |
8 |
| Physical Science / Physics |
35 |
| Technology / Engineering |
14 |
| Unifying Concepts / Common Themes |
3 |
| Unique Categories / Uncategorizable |
5 |
aN=51
Comparison of AA-AAS and General Assessment Science Academic Content Specifications
Figure 1 shows the summary of the comparisons of AA-AAS and general assessment domains. A majority of states had differences in content domains between the science AA-AAS and general assessment at all three schooling levels. Two-thirds (n=34) of states’ elementary and middle school AA-AAS had science domain differences when compared with general assessments; the other 17 states’ AA-AAS covered the same science domains as their general assessments. At the high school level, there were even more states (n=44) with content differences between the assessments. See Appendix B, Table B-1, for more detail about specific states.
Figure 1. Comparison of AA-AAS and General Assessment Science Content Domains
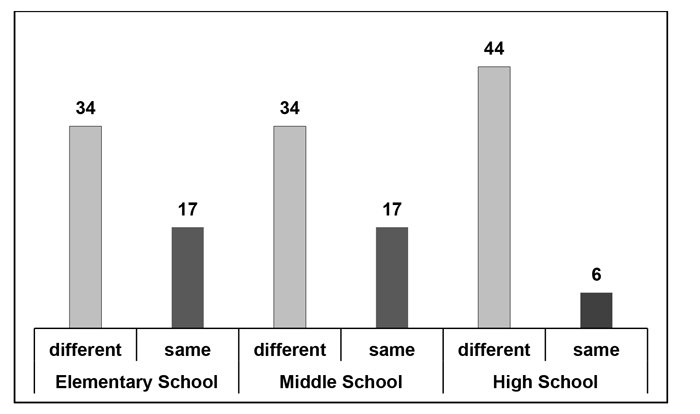
N=51. At the high school level, information for one state’s domains in the general assessment could not be located.
We performed a simple independent count of the number of science domains covered by states’ general assessments to measure the extent of science content differences between the AA-AAS and the general assessment. We applied the same categories of science content to the general assessments as we had in describing the AA-AAS. Consequently, when states had the same number of domains, even if they were different domains, the result showed that they were the same in number. These results provide a different analysis of the similarities in science content between the AA-AAS and general assessments.
Figure 2 shows how many states had fewer, the same number, and more content domains when comparing the AA-AAS to the general assessments. Comparisons at the elementary and middle school levels indicated that about 20 percent of states covered more science domains on their AA-AAS than on their general assessments. In contrast, nearly half of states (n=24) covered more science domains on their high school AA-AAS. Another trend was that at all three schooling levels, a substantial number of states, ranging between 18 (high school) and 23 (middle school), covered fewer science domains on their AA-AAS than on their general assessments. States that had the same number of content domains on both the AA-AAS and the general assessments showed differences between the high school and the other levels. Only 16 percent of states (n=8) had an identical number of domains on the high school science assessments, whereas about 40 percent had the same number of domains on the AA-AAS and general assessments for the elementary and middle school levels (n=21 and n=18, respectively).
Figure 2. Relative Number of AA-AAS Content Domains Compared to Number of General Assessment Content Domains by School Level
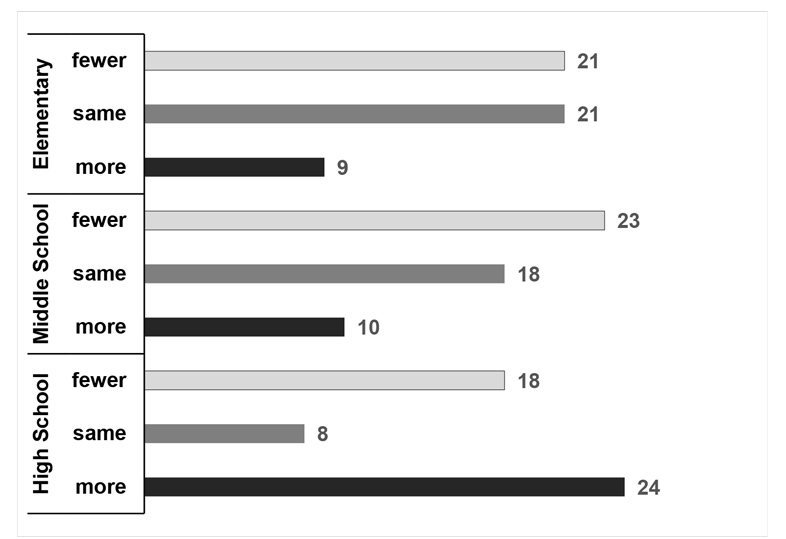
Elementary School: N=51; Middle School: N=51; High School: N=50
Additional examination yielded patterns of similarities and differences in content domains across the grade levels within each assessment type, and between the AA-AAS and the general assessment. For the AA-AAS, 18 states tested students using the same science domains for the elementary, middle school, and high school levels. For the science general assessment, 16 states tested students using the same domains at all three levels. In addition, seven states used the exact same science domains on both assessments. See Appendix B, Table B-2, for more detail about specific states.
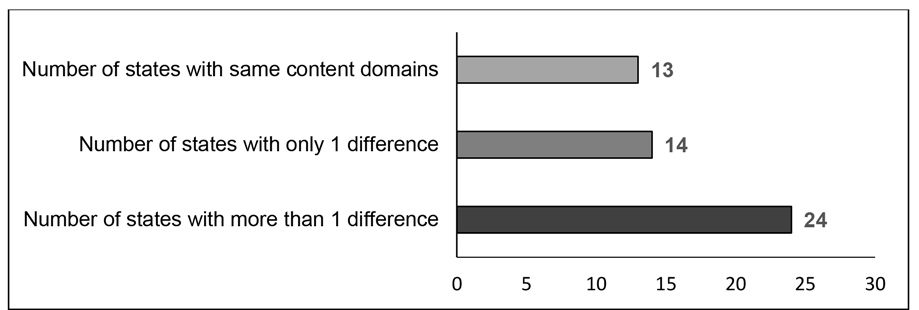
Figure 3 shows the number of states that had similarities and differences in the content domains between the AA-AAS and general assessments. Across all grade levels, 13 states had the same content domains, 14 states had only one difference between the two tests, and 24 states had more than one difference. See Appendix B, Table B-3 for state-by-state content domain comparisons of AA-AAS and general assessments.
Figure 3. Content Domain Similarities and Differences between AA-AAS and General Assessments
Comparison of AA-AAS and General Assessment Science Grade Tested
Figure 4 shows the comparisons of AA-AAS and general assessment grades tested, for all 50 states and for Washington DC. Approximately 80 percent of the states’ elementary and middle school general assessment and AA-AAS were given to students in the same grades. An example of a state where the assessments were administered to different grades was Wisconsin which gave science general assessments to students in grades 3 and 5, but administered the science AA-AAS to students in grade 4. At the high school level, there were similar numbers of states that administered their general assessment and AA-AAS at different grades (n=21) as states that administered the assessments at the same grades (n=29), with one state whose information was not located. Several of the states with testing at different high school grades (n=14) were states where the general assessment was not administered in a specific grade, but rather, it was to be offered after the student completed specific course content (e.g., biology); in contrast, the AA-AAS were specified for students at a certain grade, often grade 11. See Appendix B, Table B-4, for more detail about specific states.
Figure 4. Grade Comparison of AA-AAS and General Assessment by School Level
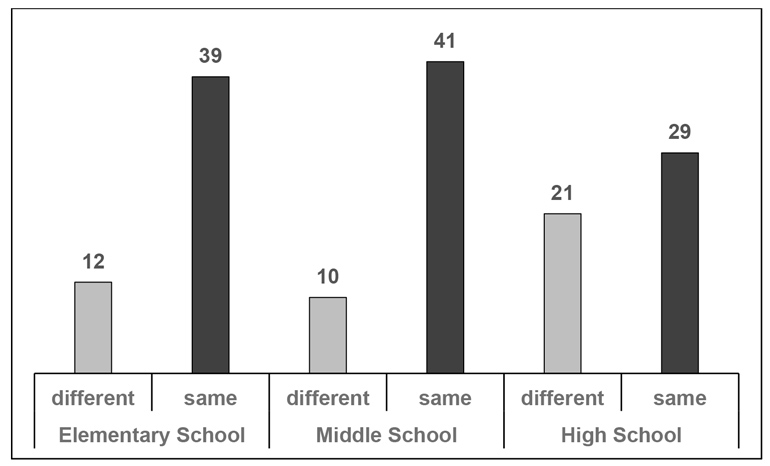
Elementary School: N=51; Middle School: N=51; High School: N=50
Assessment Approach Types and Response Formats
In applying the typology developed by Quenemoen et al. (2010), and using the approach of Thurlow et al. (2010), we examined assessment approaches of the AA-AAS and general assessment in science (see Table 5). In the 2014-2015 school year, just under half of all states (n=25) employed only one of the response formats associated with the item-based testing approach. Further, 20 of the 25 states used only performance tasks, and the other five states used only selected-response items. No states used only constructed-response items. Portfolio collections of student work, as a single response format, were used by 16 states. The least common single response format, used by only three states, was teacher rating scales.
Table 5. Assessment Approach Types and Response Formats
| Assessment Approach Types |
Response Formats |
Number of Statesa |
| Item-Based Testing |
performance tasks only
selected only
constructed only |
20
5
0 |
| selected and constructed |
1 |
| selected and performance tasks |
2 |
| Student Work Products |
portfolios only |
16 |
| Teacher Observation |
rating scales only |
3 |
| Combined Approaches |
performance tasks and rating scales |
2 |
| portfolios and rating scales |
2 |
aN=51
Table 5 also shows data for the states that employed combined approaches. Two approach combinations were used by two states each (i.e., performance tasks and rating scales; portfolios and rating scales). See Appendix C, Tables C-1 and C-2, for more detail about specific states.
Top of Page / Table of Contents
Discussion
Almost all states’ science AA-AAS covered the life science/biology content area across all grade levels. Many states also covered earth science/earth and space science and the physical sciences/physics at all grade levels. The content domains differed between the science general assessment and the AA-AAS in many states. Yet, in some states the AA-AAS covered more content domains than the general assessment and in others fewer content domains were covered. The apparent inconsistency in domains assessed on the AA-AAS and general assessment suggests that not all students with significant cognitive disabilities are provided with access to the same rigorous content.
This report presents a snapshot of states’ science AA-AAS. Many states are in the process of transitioning to new science AA-AAS. As states develop these new assessments, it is important that they carefully review the content domains to see how they compare to the content domains for the general assessment. Federal regulations allow states to define the appropriate depth, breadth, and complexity of content coverage for the AA-AAS. Nonetheless, it is problematic when the alternate assessment addresses different standards from those covered by the general assessment.
There was wide variation across states in the approach they used for their science AA-AAS. Item-based assessments (n=28) were the most common type of assessment with most of these states using performance tasks. About a third of the states (n=16) used portfolio assessments, which are bodies of student work. A few states used rating scales.
There are many complex issues related to the assessment of science. States have an opportunity to develop and implement better science AA-AAS that more appropriately measure what students know and can do.
Top of Page / Table of Contents
References
Quenemoen, M., Quenemoen, R., Kearns, J., & Kennedy, S. (2010). A proposed typology for characterizing states’ AA-AAS: Developing a common vocabulary to describe these assessments. Lexington, KY. Retrieved from http://www.naacpartners.org/publications/ApproachTypology.pdf
Thurlow, M., Rogers, C., & Christensen, L. (2007). Science assessments for students with disabilities in school year 2006-2007: What we know about participation, performance, and accommodations (Synthesis Report 77). Minneapolis, MN: University of Minnesota, National Center of Educational Outcomes. Retrieved from http://www.cehd.umn.edu/NCEO/OnlinePubs/Synthesis77/Synthesis77.pdf
U.S. Department of Education, Office of Elementary and Secondary Education (2007, April). Final Rule 34 CFR Parts 200 and 300: Title I-Improving the academic achievement of the disadvantaged; Individuals with disabilities education act (IDEA). Federal Register: 72(67), Washington DC: Author.
U.S. Department of Education, Office of Elementary and Secondary Education. (2003, December). Title I--Improving the academic achievement of the disadvantaged, final regulations. Washington, DC: U.S. Author.
Top of Page / Table of Contents
Appendix A
AA-AAS Science Content Domains by State
Table A-1. AA-AAS Elementary Science Content Domains by State
|
State
|
ES
|
Env
|
Inq
|
LS
|
NoS
|
P&SI
|
PS
|
T/E
|
UC
|
U/U
|
|
Alabama
|
X
|
|
X
|
X
|
|
|
X
|
X
|
X
|
|
|
Alaska
|
X
|
|
X
|
X
|
X
|
X
|
X
|
X
|
|
|
|
Arizona
|
X
|
|
X
|
X
|
X
|
X
|
X
|
|
|
|
|
Arkansas
|
X
|
|
|
X
|
|
|
X
|
|
|
|
|
California
|
X
|
|
X
|
X
|
|
|
X
|
|
|
|
|
Colorado
|
X
|
|
|
X
|
|
|
X
|
|
|
|
|
Connecticut
|
X
|
|
|
X
|
|
|
X
|
X
|
|
|
|
Delaware
|
X
|
|
|
X
|
X
|
|
X
|
|
|
|
|
District of Columbia
|
X
|
|
|
X
|
|
|
|
X
|
|
|
|
Florida
|
X
|
|
|
X
|
X
|
|
X
|
|
|
|
|
Georgia
|
X
|
|
|
X
|
|
|
X
|
|
|
|
|
Hawaii
|
X
|
X
|
X
|
X
|
|
|
X
|
|
|
|
|
Idaho
|
X
|
|
|
X
|
X
|
|
X
|
X
|
|
|
|
Illinois
|
X
|
|
X
|
X
|
|
X
|
X
|
X
|
|
|
|
Indiana
|
X
|
|
|
X
|
X
|
|
X
|
X
|
|
|
|
Iowa
|
X
|
|
X
|
X
|
|
|
X
|
|
|
|
|
Kansas
|
X
|
|
X
|
X
|
|
|
X
|
X
|
|
|
|
Kentucky
|
X
|
|
|
X
|
|
|
X
|
X
|
|
|
|
Louisiana
|
X
|
|
X
|
X
|
|
|
X
|
|
|
|
|
Maine
|
|
|
X
|
X
|
|
|
|
|
|
|
|
Maryland
|
X
|
X
|
|
X
|
|
|
X
|
|
|
|
|
Massachusetts
|
X
|
|
|
X
|
|
|
X
|
X
|
|
|
|
Michigan
|
X
|
|
|
X
|
|
|
X
|
|
|
Xa
|
|
Minnesota
|
X
|
|
|
X
|
X
|
|
X
|
X
|
|
|
|
Mississippi
|
X
|
|
X
|
X
|
|
|
X
|
|
|
|
|
Missouri
|
X
|
X
|
X
|
X
|
|
X
|
|
X
|
|
|
|
Montana
|
X
|
|
X
|
X
|
X
|
X
|
X
|
X
|
|
|
|
Nebraska
|
X
|
|
X
|
X
|
X
|
|
X
|
X
|
|
|
|
Nevada
|
|
|
|
|
X
|
|
X
|
|
|
|
|
New Hampshire
|
X
|
|
X
|
X
|
|
|
|
|
|
|
|
New Jersey
|
X
|
|
|
X
|
|
|
X
|
|
|
|
|
New Mexico
|
X
|
|
X
|
X
|
|
X
|
X
|
|
|
|
|
New York
|
|
|
X
|
X
|
|
|
|
|
|
|
|
North Carolina
|
X
|
X
|
|
X
|
|
|
X
|
|
|
|
|
North Dakota
|
X
|
|
X
|
X
|
|
|
X
|
X
|
X
|
|
|
Ohio
|
X
|
|
|
X
|
|
|
X
|
|
|
|
|
Oklahoma
|
X
|
|
X
|
X
|
|
|
X
|
|
|
|
|
Oregon
|
X
|
|
|
X
|
|
|
X
|
X
|
|
|
|
Pennsylvania
|
X
|
X
|
X
|
X
|
|
|
X
|
X
|
|
|
|
Rhode Island
|
X
|
|
|
X
|
|
|
X
|
|
|
|
|
South Carolina
|
X
|
|
X
|
X
|
|
|
X
|
|
|
|
|
South Dakota
|
X
|
X
|
|
X
|
|
X
|
X
|
X
|
|
|
|
Tennessee
|
X
|
|
|
X
|
|
|
X
|
|
|
|
|
Texas
|
X
|
|
|
X
|
|
|
X
|
|
|
|
|
Utah
|
X
|
X
|
X
|
X
|
|
|
|
|
|
Xb
|
|
Vermont
|
X
|
|
|
X
|
|
|
X
|
|
|
|
|
Virginia
|
X
|
|
X
|
X
|
|
|
X
|
|
|
|
|
Washington
|
X
|
|
X
|
X
|
|
|
|
|
|
Xc
|
|
West Virginia
|
|
|
|
|
X
|
|
|
|
|
Xd
|
|
Wisconsin
|
X
|
X
|
X
|
X
|
X
|
X
|
X
|
|
|
Xe
|
|
Wyoming
|
X
|
X
|
X
|
X
|
|
|
X
|
|
|
|
|
TOTAL
|
47
|
9
|
26
|
49
|
12
|
8
|
43
|
18
|
2
|
5
|
Note: The content areas are ordered alphabetically.
ES: Earth Science / Earth & Space Science
Env: Environmental / Ecological Science
Inq: Investigation / Inquiry Process
LS: Life Science / Biology
NoS: Nature of Science / Characteristics of Science / History of Science
P&SI: Personal and Social Impacts of Science
PS: Physical Science / Physics (includes Chemistry when specified)
T/E: Technology / Engineering
UC: Unifying Concepts / Common Themes
U/U: Unique Categories / Uncategorizable
a Constructing New and Reflecting on Scientific Knowledge
b Object Permanence, Nutrition, Hygiene, Physical Fitness
c Systems, Application
d Content of Science
e Science Applications
Table A-2. AA-AAS Middle School Science Content Domains by State
|
State
|
ES
|
Env
|
Inq
|
LS
|
NoS
|
P&SI
|
PS
|
T/E
|
UC
|
U/U
|
|
Alabama
|
X
|
|
X
|
X
|
|
|
X
|
X
|
X
|
|
|
Alaska
|
X
|
|
X
|
X
|
X
|
X
|
X
|
X
|
|
|
|
Arizona
|
X
|
|
X
|
X
|
X
|
X
|
X
|
|
|
|
|
Arkansas
|
X
|
|
|
X
|
|
|
X
|
|
|
|
|
California
|
X
|
|
X
|
X
|
|
|
X
|
|
|
|
|
Colorado
|
X
|
|
|
X
|
|
|
X
|
|
|
|
|
Connecticut
|
X
|
|
|
X
|
|
|
X
|
X
|
|
|
|
Delaware
|
X
|
|
|
X
|
X
|
|
X
|
|
|
|
|
District of Columbia
|
|
|
|
|
|
|
X
|
|
|
|
|
Florida
|
X
|
|
|
X
|
X
|
|
X
|
|
|
|
|
Georgia
|
X
|
|
|
X
|
|
|
X
|
|
|
|
|
Hawaii
|
X
|
X
|
X
|
X
|
|
|
X
|
|
|
|
|
Idaho
|
X
|
|
|
X
|
X
|
|
X
|
X
|
|
|
|
Illinois
|
X
|
|
X
|
X
|
|
X
|
X
|
X
|
|
|
|
Indiana
|
X
|
|
|
X
|
X
|
|
X
|
X
|
|
|
|
Iowa
|
X
|
|
X
|
X
|
|
|
X
|
|
|
|
|
Kansas
|
X
|
|
X
|
X
|
|
|
X
|
|
|
|
|
Kentucky
|
X
|
|
|
X
|
|
|
X
|
X
|
|
|
|
Louisiana
|
X
|
|
X
|
X
|
|
|
X
|
|
|
|
|
Maine
|
|
|
X
|
X
|
|
|
|
X
|
X
|
|
|
Maryland
|
X
|
X
|
|
X
|
|
|
X
|
|
|
|
|
Massachusetts
|
X
|
|
|
X
|
|
|
X
|
X
|
|
|
|
Michigan
|
X
|
|
|
X
|
|
|
X
|
|
X
|
|
|
Minnesota
|
X
|
|
|
X
|
X
|
|
X
|
X
|
|
|
|
Mississippi
|
X
|
|
X
|
X
|
|
|
X
|
|
|
|
|
Missouri
|
X
|
|
X
|
|
|
X
|
X
|
X
|
|
|
|
Montana
|
X
|
|
X
|
X
|
X
|
X
|
X
|
X
|
|
|
|
Nebraska
|
X
|
|
X
|
X
|
X
|
|
X
|
X
|
|
|
|
Nevada
|
X
|
|
|
|
X
|
|
|
|
|
|
|
New Hampshire
|
X
|
|
X
|
|
|
|
X
|
|
|
|
|
New Jersey
|
|
|
|
X
|
|
|
X
|
|
|
|
|
New Mexico
|
X
|
|
X
|
X
|
|
X
|
X
|
|
|
|
|
New York
|
X
|
|
|
|
|
|
|
|
|
|
|
North Carolina
|
X
|
X
|
|
X
|
|
|
X
|
|
|
|
|
North Dakota
|
X
|
|
X
|
X
|
|
|
X
|
X
|
X
|
|
|
Ohio
|
X
|
|
|
X
|
|
|
X
|
|
|
|
|
Oklahoma
|
X
|
|
X
|
X
|
|
|
X
|
|
|
|
|
Oregon
|
X
|
|
|
X
|
|
|
X
|
X
|
|
|
|
Pennsylvania
|
X
|
X
|
X
|
X
|
|
|
X
|
X
|
|
|
|
Rhode Island
|
X
|
|
|
X
|
|
|
X
|
|
|
|
|
South Carolina
|
X
|
|
X
|
X
|
|
|
X
|
|
|
|
|
South Dakota
|
X
|
X
|
|
|
X
|
X
|
X
|
X
|
|
|
|
Tennessee
|
X
|
|
|
X
|
|
|
X
|
|
|
|
|
Texas
|
X
|
|
|
X
|
|
|
X
|
|
|
|
|
Utah
|
X
|
X
|
X
|
X
|
|
|
|
|
|
Xa
|
|
Vermont
|
X
|
|
|
X
|
|
|
X
|
|
|
|
|
Virginia
|
X
|
X
|
X
|
X
|
|
|
X
|
|
|
|
|
Washington
|
X
|
|
X
|
X
|
|
|
X
|
|
|
|
|
West Virginia
|
|
|
|
|
X
|
|
|
|
|
Xb
|
|
Wisconsin
|
X
|
X
|
X
|
X
|
X
|
X
|
X
|
|
|
Xc
|
|
Wyoming
|
X
|
X
|
X
|
X
|
|
|
X
|
|
|
Xd
|
|
TOTAL
|
47
|
9
|
25
|
44
|
13
|
8
|
46
|
17
|
4
|
4
|
Note: The content areas are ordered alphabetically.
ES: Earth Science / Earth & Space Science
Env: Environmental / Ecological Science
Inq: Investigation / Inquiry Process
LS: Life Science / Biology
NoS: Nature of Science / Characteristics of Science / History of Science
P&SI: Personal and Social Impacts of Science
PS: Physical Science / Physics (includes Chemistry when specified)
T/E: Technology / Engineering
UC: Unifying Concepts / Common Themes
U/U: Unique Categories / Uncategorizable
a Object Permanence, Nutrition, Hygiene, Physical Fitness
b Application
c Content of Science
d Science Applications
Table A-3. AA-AAS High School Science Content Domains by State
|
State
|
Ch
|
ES
|
Env
|
Inq
|
LS
|
NoS
|
P&SI
|
PS
|
T/E
|
UC
|
U/U
|
|
Alabama
|
|
X
|
X
|
X
|
X
|
|
|
X
|
X
|
X
|
|
|
Alaska
|
|
X
|
|
X
|
X
|
X
|
X
|
X
|
X
|
|
|
|
Arizona
|
|
X
|
|
X
|
X
|
X
|
X
|
X
|
|
|
|
|
Arkansas
|
|
|
|
|
X
|
|
|
|
|
|
|
|
California
|
X
|
X
|
|
X
|
X
|
|
|
X
|
|
|
|
|
Colorado
|
|
X
|
|
|
X
|
|
|
X
|
|
|
|
|
Connecticut
|
|
|
|
|
X
|
|
|
|
|
|
|
|
Delaware
|
|
X
|
X
|
|
X
|
X
|
|
X
|
|
|
|
|
District of Columbia
|
|
|
|
|
X
|
|
|
|
|
|
|
|
Florida
|
|
X
|
|
|
X
|
X
|
|
X
|
|
|
|
|
Georgia
|
|
|
|
|
X
|
|
|
X
|
|
|
|
|
Hawaii
|
|
X
|
X
|
X
|
X
|
|
|
X
|
|
|
|
|
Idaho
|
|
X
|
|
|
X
|
X
|
|
X
|
X
|
|
|
|
Illinois
|
|
X
|
|
X
|
X
|
|
X
|
X
|
X
|
|
|
|
Indiana
|
|
|
|
|
X
|
X
|
|
|
|
|
|
|
Iowa
|
|
X
|
|
X
|
X
|
|
|
X
|
|
|
|
|
Kansas
|
X
|
X
|
|
X
|
X
|
|
|
X
|
X
|
|
|
|
Kentucky
|
|
X
|
|
|
X
|
|
|
X
|
X
|
|
|
|
Louisiana
|
|
|
|
X
|
X
|
|
|
X
|
|
|
|
|
Maine
|
|
|
|
X
|
X
|
|
|
|
X
|
X
|
|
|
Maryland
|
|
|
|
|
X
|
|
|
|
|
|
|
|
Massachusetts
|
X
|
X
|
|
|
X
|
|
|
X
|
X
|
|
|
|
Michigan
|
|
X
|
|
|
X
|
|
|
X
|
|
|
Xa
|
|
Minnesota
|
|
|
|
|
X
|
X
|
|
|
X
|
|
|
|
Mississippi
|
|
X
|
|
X
|
X
|
|
|
X
|
|
|
|
|
Missouri
|
|
|
X
|
X
|
X
|
|
X
|
X
|
X
|
|
|
|
Montana
|
|
X
|
|
X
|
X
|
X
|
X
|
X
|
X
|
|
|
|
Nebraska
|
|
X
|
|
X
|
X
|
X
|
|
X
|
X
|
|
|
|
Nevada
|
|
|
|
|
X
|
X
|
|
|
|
|
|
|
New Hampshire
|
|
|
|
X
|
X
|
|
|
X
|
|
|
|
|
New Jersey
|
|
|
X
|
|
X
|
|
|
X
|
|
|
|
|
New Mexico
|
|
X
|
|
X
|
X
|
|
X
|
X
|
|
|
|
|
New York
|
|
X
|
|
|
X
|
|
|
|
|
|
|
|
North Carolina
|
|
|
|
|
X
|
|
|
|
|
|
|
|
North Dakota
|
|
X
|
|
X
|
X
|
|
|
X
|
|
X
|
|
|
Ohio
|
X
|
|
X
|
|
X
|
|
|
X
|
|
|
|
|
Oklahoma
|
|
|
|
X
|
X
|
|
|
|
|
|
|
|
Oregon
|
|
X
|
|
|
X
|
|
|
X
|
X
|
|
|
|
Pennsylvania
|
X
|
|
X
|
|
X
|
|
|
X
|
|
|
|
|
Rhode Island
|
|
X
|
|
|
X
|
|
|
X
|
|
|
|
|
South Carolina
|
|
|
|
|
X
|
|
|
|
|
|
|
|
South Dakota
|
|
X
|
X
|
|
X
|
X
|
X
|
X
|
X
|
|
|
|
Tennessee
|
X
|
|
|
|
X
|
|
|
X
|
|
|
|
|
Texas
|
|
|
|
|
X
|
|
|
|
|
|
|
|
Utah
|
X
|
X
|
X
|
|
X
|
|
|
|
|
|
Xb
|
|
Vermont
|
|
X
|
|
|
X
|
|
|
X
|
|
|
|
|
Virginia
|
|
X
|
|
X
|
X
|
X
|
|
X
|
|
|
Xc
|
|
Washington
|
|
|
|
X
|
X
|
|
|
|
|
|
|
|
West Virginia
|
|
|
|
|
|
X
|
|
|
|
|
Xd
|
|
Wisconsin
|
|
X
|
X
|
X
|
X
|
X
|
X
|
X
|
|
|
Xe
|
|
Wyoming
|
|
X
|
X
|
X
|
X
|
|
|
X
|
|
|
|
|
TOTAL
|
7
|
29
|
11
|
22
|
50
|
14
|
8
|
35
|
14
|
3
|
5
|
Ch: Chemistry
ES: Earth Science / Earth & Space Science
Env: Environmental / Ecological Science
Inq: Investigation / Inquiry Process
LS: Life Science / Biology
NoS: Nature of Science / Characteristics of Science / History of Science
P&SI: Personal and Social Impacts of Science
PS: Physical Science / Physics (includes Chemistry when specified)
T/E: Technology / Engineering
UC: Unifying Concepts / Common Themes
U/U: Unique Categories / Uncategorizable
a Constructing new and reflecting on scientific knowledge
b Object permanence, Nutrition, Hygiene, Physical fitness
c Earth resources; Human interactions”
d Content of science
e Science applications
Top of Page / Table of Contents
Appendix B
General Assessment and AA-AAS Science Comparisons
Table B-1. General Assessment and AA-AAS Science Content Domain Comparisons by State and Schooling Level
|
State
|
Elementary Comparison
|
Middle School Comparison
|
High School Comparison
|
|
Same
|
Different
|
Same
|
Different
|
Same
|
Different
|
|
Alabama
|
|
X
|
|
X
|
|
X
|
|
Alaska
|
|
X
|
|
X
|
X
|
|
|
Arizona
|
X
|
|
X
|
|
|
X
|
|
Arkansas
|
X
|
|
X
|
|
|
X
|
|
California
|
X
|
|
X
|
|
|
X
|
|
Colorado
|
|
X
|
|
X
|
|
X
|
|
Connecticut
|
|
X
|
|
X
|
|
X
|
|
Delaware
|
|
X
|
|
X
|
|
X
|
|
District of Columbia
|
|
X
|
|
X
|
|
X
|
|
Florida
|
X
|
|
X
|
|
|
X
|
|
Georgia
|
X
|
|
X
|
|
|
X
|
|
Hawaii
|
|
X
|
|
X
|
|
X
|
|
Idaho
|
|
X
|
|
X
|
|
X
|
|
Illinois
|
|
X
|
|
X
|
|
X
|
|
Indiana
|
|
X
|
|
X
|
|
X
|
|
Iowa
|
X
|
|
X
|
|
X
|
|
|
Kansas
|
X
|
|
X
|
|
|
X
|
|
Kentucky
|
|
X
|
|
X
|
|
X
|
|
Louisiana
|
|
X
|
|
X
|
|
X
|
|
Maine
|
|
X
|
|
X
|
|
X
|
|
Maryland
|
|
X
|
|
X
|
|
X
|
|
Massachusetts
|
X
|
|
X
|
|
X
|
|
|
Michigan
|
|
X
|
|
X
|
|
X
|
|
Minnesota
|
X
|
|
X
|
|
|
X
|
|
Mississippi
|
X
|
|
X
|
|
|
X
|
|
Missouri
|
X
|
|
X
|
|
|
X
|
|
Montana
|
|
X
|
|
X
|
|
X
|
|
Nebraska
|
X
|
|
X
|
|
X
|
|
|
Nevada
|
|
X
|
|
X
|
|
X
|
|
New Hampshire
|
|
X
|
|
X
|
|
X
|
|
New Jersey
|
|
X
|
|
X
|
|
X
|
|
New Mexico
|
X
|
|
X
|
|
X
|
|
|
New York
|
|
X
|
|
X
|
|
X
|
|
North Carolina
|
|
X
|
|
X
|
|
X
|
|
North Dakota
|
|
X
|
|
X
|
|
X
|
|
Ohio
|
X
|
|
X
|
|
X
|
|
|
Oklahoma
|
X
|
|
X
|
|
|
X
|
|
Oregon
|
|
X
|
|
X
|
|
X
|
|
Pennsylvania
|
|
X
|
|
X
|
|
X
|
|
Rhode Island
|
|
X
|
|
X
|
|
X
|
|
South Carolina
|
|
X
|
|
X
|
|
X
|
|
South Dakota
|
|
X
|
|
X
|
|
X
|
|
Tennessee
|
|
X
|
|
X
|
|
X
|
|
Texas
|
|
X
|
|
X
|
|
X
|
|
Utah
|
|
X
|
|
X
|
|
X
|
|
Vermont
|
|
X
|
|
X
|
|
X
|
|
Virginia
|
X
|
|
X
|
|
|
X
|
|
Washington
|
|
X
|
|
X
|
|
X
|
|
West Virginia
|
X
|
|
X
|
|
|
X
|
|
Wisconsin
|
|
X
|
|
X
|
|
X
|
|
Wyoming
|
|
X
|
|
X
|
no info
|
no info
|
|
TOTAL
|
17
|
34
|
17
|
34
|
6
|
44
|
Table B-2. Relative Number of AA-AAS Content Domains Compared to Number of General Assessment Content Domains by State and Schooling Level
|
State
|
Elementary Comparison
|
Middle School Comparison
|
High School Comparison
|
|
Fewer
|
Same
|
More
|
Fewer
|
Same
|
More
|
Fewer
|
Same
|
More
|
|
Alabama
|
|
|
X
|
|
|
X
|
|
|
X
|
|
Alaska
|
|
|
X
|
|
|
X
|
|
X
|
|
|
Arizona
|
|
X
|
|
|
X
|
|
|
|
X
|
|
Arkansas
|
|
X
|
|
|
X
|
|
X
|
|
|
|
California
|
|
X
|
|
|
X
|
|
X
|
|
|
|
Colorado
|
X
|
|
|
X
|
|
|
X
|
|
|
|
Connecticut
|
X
|
|
|
X
|
|
|
X
|
|
|
|
Delaware
|
|
X
|
|
|
X
|
|
|
|
X
|
|
District of Columbia
|
X
|
|
|
X
|
|
|
X
|
|
|
|
Florida
|
|
X
|
|
|
X
|
|
|
|
X
|
|
Georgia
|
|
X
|
|
|
X
|
|
|
|
X
|
|
Hawaii
|
|
|
X
|
|
|
X
|
|
|
X
|
|
Idaho
|
X
|
|
|
X
|
|
|
|
X
|
|
|
Illinois
|
X
|
|
|
X
|
|
|
X
|
|
|
|
Indiana
|
X
|
|
|
X
|
|
|
|
|
X
|
|
Iowa
|
|
X
|
|
|
X
|
|
|
X
|
|
|
Kansas
|
|
X
|
|
|
X
|
|
X
|
|
|
|
Kentucky
|
|
X
|
|
|
X
|
|
|
|
X
|
|
Louisiana
|
X
|
|
|
X
|
|
|
|
|
X
|
|
Maine
|
X
|
|
|
X
|
|
|
X
|
|
|
|
Maryland
|
X
|
|
|
X
|
|
|
|
|
X
|
|
Massachusetts
|
|
X
|
|
|
X
|
|
|
X
|
|
|
Michigan
|
X
|
|
|
X
|
|
|
X
|
|
|
|
Minnesota
|
|
X
|
|
|
X
|
|
|
|
X
|
|
Mississippi
|
|
X
|
|
|
X
|
|
|
|
X
|
|
Missouri
|
|
X
|
|
|
X
|
|
|
|
X
|
|
Montana
|
|
|
X
|
|
|
X
|
|
|
X
|
|
Nebraska
|
|
X
|
|
|
X
|
|
|
X
|
|
|
Nevada
|
X
|
|
|
X
|
|
|
X
|
|
|
|
New Hampshire
|
X
|
|
|
X
|
|
|
X
|
|
|
|
New Jersey
|
X
|
|
|
X
|
|
|
|
|
X
|
|
New Mexico
|
|
X
|
|
|
X
|
|
|
X
|
|
|
New York
|
X
|
|
|
X
|
|
|
X
|
|
|
|
North Carolina
|
|
|
X
|
|
|
X
|
|
|
X
|
|
North Dakota
|
X
|
|
|
X
|
|
|
X
|
|
|
|
Ohio
|
|
X
|
|
|
X
|
|
|
X
|
|
|
Oklahoma
|
|
X
|
|
|
X
|
|
|
|
X
|
|
Oregon
|
X
|
|
|
X
|
|
|
X
|
|
|
|
Pennsylvania
|
|
|
X
|
|
|
X
|
|
|
X
|
|
Rhode Island
|
X
|
|
|
X
|
|
|
X
|
|
|
|
South Carolina
|
|
X
|
|
X
|
|
|
|
|
X
|
|
South Dakota
|
|
|
X
|
|
|
X
|
|
|
X
|
|
Tennessee
|
X
|
|
|
X
|
|
|
X
|
|
|
|
Texas
|
X
|
|
|
X
|
|
|
|
|
X
|
|
Utah
|
|
X
|
|
X
|
|
|
|
|
X
|
|
Vermont
|
X
|
|
|
X
|
|
|
X
|
|
|
|
Virginia
|
|
X
|
|
|
|
X
|
|
X
|
|
|
Washington
|
X
|
|
|
X
|
|
|
|
|
X
|
|
West Virginia
|
|
X
|
|
|
X
|
|
X
|
|
|
|
Wisconsin
|
|
|
X
|
|
|
X
|
|
|
X
|
|
Wyoming
|
|
|
X
|
|
|
X
|
|
|
|
|
TOTAL
|
21
|
21
|
9
|
23
|
18
|
10
|
18
|
8
|
24
|
Table B-3. States’ Content Domain Differences between AA-AAS and General Assessments
|
State
|
Number of
differences
in domains
|
AA-AAS
|
General Assessment
|
|
Alabama
|
2
|
Technology/Engineering, Unifying Concepts
|
|
|
Alaska
|
1
|
Personal & Social Impacts
|
|
|
Arizona
|
0
|
|
|
|
Arkansas
|
3
|
|
Chemistry, Environmental/Ecological, Nature of Science
|
|
California
|
2
|
|
Chemistry, Environmental/Ecological
|
|
Colorado
|
2
|
|
Inquiry Process, Nature of Science
|
|
Connecticut
|
4
|
Technology/Engineering
|
Chemistry, Inquiry Process, Unique/Uncategorizable
|
|
Delaware
|
2
|
Nature of Science
|
Inquiry Process
|
|
District of Columbia
|
0
|
|
|
|
Florida
|
0
|
|
|
|
Georgia
|
0
|
|
|
|
Hawaii
|
1
|
Environmental/Ecological
|
|
|
Idaho
|
1
|
|
Personal & Social Impacts
|
|
Illinois
|
2
|
|
Environmental/Ecological, Unique/Uncategorizable
|
|
Indiana
|
1
|
|
Inquiry Process
|
|
Iowa
|
0
|
|
|
|
Kansas
|
2
|
|
Chemistry, Technology/Engineering
|
|
Kentucky
|
2
|
Technology/Engineering
|
Unifying Concepts
|
|
Louisiana
|
1
|
|
Environmental/Ecological
|
|
Maine
|
1
|
|
Physical Science
|
|
Maryland
|
1
|
|
Inquiry Process
|
|
Massachusetts
|
0
|
|
|
|
Michigan
|
4
|
Unifying Concepts, Unique/Uncategorizable
|
Chemistry, Inquiry Process, Personal & Social Impacts
|
|
Minnesota
|
0
|
|
|
|
Mississippi
|
0
|
|
|
|
Missouri
|
0
|
|
|
|
Montana
|
1
|
Technology/Engineering
|
|
|
Nebraska
|
0
|
|
|
|
Nevada
|
3
|
Nature of Science
|
Life Science, Technology/Engineering
|
|
New Hampshire
|
4
|
Inquiry Process
|
Personal & Social Impacts, Technology/Engineering, Unique/Uncategorizable
|
|
New Jersey
|
3
|
|
Inquiry Process, Technology/Engineering, Unique/Uncategorizable
|
|
New Mexico
|
0
|
|
|
|
New York
|
5
|
|
Personal & Social Impacts, Physical Science, Technology/ Engineering, Unifying Concepts, Unique/Uncategorizable
|
|
North Carolina
|
1
|
Environmental/Ecological
|
|
|
North Dakota
|
1
|
|
Nature of Science
|
|
Ohio
|
0
|
|
|
|
Oklahoma
|
0
|
|
|
|
Oregon
|
1
|
|
Inquiry Process
|
|
Pennsylvania
|
3
|
Environmental/Ecological, Inquiry Process
|
Nature of Science
|
|
Rhode Island
|
1
|
|
Inquiry Process
|
|
South Carolina
|
2
|
Inquiry Process
|
Technology/Engineering
|
|
South Dakota
|
1
|
Environmental/Ecological
|
|
|
Tennessee
|
3
|
|
Chemistry, Inquiry Process, Technology/Engineering, Unique/Uncategorizable
|
|
Texas
|
1
|
|
Inquiry Process
|
|
Utah
|
3
|
Environmental/Ecological
|
Chemistry, Nature of Science, Personal & Social Impacts, Physical Science
|
|
Vermont
|
2
|
|
Inquiry Process, Nature of Science
|
|
Virginia
|
3
|
Environmental/Ecological
|
Chemistry, Nature of Science
|
|
Washington
|
2
|
Unique/Uncategorizable
|
Technology/Engineering
|
|
West Virginia
|
5
|
Chemistry, Earth Science, Life Science, Physical Science
|
Unique/Uncategorizable
|
|
Wisconsin
|
3
|
Environmental/Ecological, Unique/Uncategorizable
|
Unifying Concepts
|
|
Wyoming
|
3
|
Environmental/Ecological, Unique/Uncategorizable
|
|
|
Total Number of States
|
0=13 states,
1=14 states,
2=10 states,
3=9 states,
4=3 states,
5=2 states
|
1 Chemistry
1 Earth Science
8 Environmental/Ecological
3 Inquiry Process
1 Life Science
2 Nature of Science
1 Personal & Social Impacts
1 Physical Science
4 Technology/Engineering
2 Unifying Concepts
4 Unique/Uncategorizable
|
8 Chemistry
0 Earth Science
4 Environmental/Ecological
11 Inquiry Process
1 Life Science
7 Nature of Science
5 Personal & Social Impacts
3 Physical Science
8 Technology/Engineering
3 Unifying Concepts
7 Unique/Uncategorizable
|
Note: The content domains listed are additional domains that an assessment at any grade level has when compared to the other assessment at the same grade level.
Table B-4. General Assessment and AA-AAS Science Grade Levels Tested Comparisons by State and Schooling Level
|
State
|
Assessment
|
Grades and Schooling Levels
|
|
Elementary
|
Middle School
|
High School
|
|
3
|
4
|
5
|
6
|
7
|
8
|
9
|
10
|
11
|
12
|
|
Alabama
|
General
|
|
|
X
|
|
X
|
|
|
|
X
|
|
|
AA-AAS
|
|
|
X
|
|
X
|
|
|
|
X
|
|
|
Alaska
|
General
|
|
X
|
|
|
|
X
|
|
X
|
|
|
|
AA-AAS
|
X
|
X
|
X
|
X
|
X
|
X
|
X
|
X
|
|
|
|
Arizona
|
General
|
|
X
|
|
|
|
X
|
not specific
|
|
AA-AAS
|
|
X
|
|
|
|
X
|
|
X
|
|
|
|
Arkansas
|
General
|
|
|
X
|
|
X
|
|
|
|
X
|
|
|
AA-AAS
|
|
|
X
|
|
X
|
|
|
X
|
|
|
|
California
|
General
|
|
|
X
|
|
|
X
|
|
X
|
|
|
|
AA-AAS
|
|
|
X
|
|
|
X
|
|
X
|
|
|
|
Colorado
|
General
|
|
|
X
|
|
|
X
|
not specific
|
|
AA-AAS
|
|
|
X
|
|
|
X
|
not specific
|
|
Connecticut
|
General
|
|
|
X
|
|
|
X
|
|
X
|
|
|
|
AA-AAS
|
|
|
X
|
|
|
X
|
|
X
|
|
|
|
Delaware
|
General
|
|
|
X
|
|
|
X
|
|
X
|
|
|
|
AA-AAS
|
|
|
X
|
|
|
X
|
|
X
|
|
|
|
District of Columbia
|
General
|
|
|
X
|
|
|
X
|
not specific
|
|
AA-AAS
|
|
|
X
|
|
|
X
|
|
x
|
|
|
|
Florida
|
General
|
|
|
X
|
|
|
X
|
|
|
X
|
|
|
AA-AAS
|
|
|
X
|
|
|
X
|
|
|
X
|
|
|
Georgia
|
General
|
X
|
X
|
X
|
X
|
X
|
X
|
not specific
|
|
AA-AAS
|
X
|
X
|
X
|
X
|
X
|
X
|
X
|
X
|
X
|
X
|
|
Hawaii
|
General
|
|
X
|
|
|
|
X
|
not specific
|
|
AA-AAS
|
|
X
|
|
|
|
X
|
|
X
|
|
|
|
Idaho
|
General
|
|
|
X
|
|
X
|
|
not specific
|
|
AA-AAS
|
|
|
X
|
|
X
|
|
|
X
|
|
|
|
Illinois
|
General
|
|
X
|
|
|
X
|
|
|
|
X
|
|
|
AA-AAS
|
|
X
|
|
|
X
|
|
|
|
X
|
|
|
Indiana
|
General
|
|
X
|
|
X
|
|
|
not specific
|
|
AA-AAS
|
|
X
|
|
X
|
|
|
|
X
|
|
|
|
Iowa
|
General
|
|
|
X
|
|
|
X
|
|
|
X
|
|
|
AA-AAS
|
|
|
X
|
|
|
X
|
|
|
X
|
|
|
Kansas
|
General
|
|
X
|
|
|
X
|
|
|
|
X
|
|
|
AA-AAS
|
|
X
|
|
|
X
|
|
|
|
X
|
|
|
Kentucky
|
General
|
|
X
|
|
|
X
|
|
not specific
|
|
AA-AAS
|
|
X
|
|
|
X
|
|
|
|
X
|
|
|
Louisiana
|
General
|
X
|
X
|
X
|
X
|
X
|
X
|
not specific
|
|
AA-AAS
|
|
X
|
|
|
|
X
|
|
|
X
|
|
|
Maine
|
General
|
|
|
X
|
|
|
X
|
|
|
X
|
|
|
AA-AAS
|
|
|
X
|
|
|
X
|
|
|
X
|
|
|
Maryland
|
General
|
|
X
|
X
|
X
|
X
|
X
|
not specific
|
|
AA-AAS
|
|
|
X
|
|
|
X
|
|
X
|
|
|
|
Massachusetts
|
General
|
|
|
X
|
|
|
X
|
not specific
|
|
AA-AAS
|
|
|
X
|
|
|
X
|
not specific
|
|
Michigan
|
General
|
|
X
|
|
|
X
|
|
|
|
X
|
|
|
AA-AAS
|
|
|
X
|
|
|
X
|
|
|
X
|
|
|
Minnesota
|
General
|
|
|
X
|
|
|
X
|
not specific
|
|
AA-AAS
|
|
|
X
|
|
|
X
|
not specific
|
|
Mississippi
|
General
|
|
|
X
|
|
|
X
|
not specific
|
|
AA-AAS
|
|
|
X
|
|
|
X
|
not specific
|
|
Missouri
|
General
|
|
|
X
|
|
|
X
|
|
|
X
|
|
|
AA-AAS
|
|
|
X
|
|
|
X
|
|
|
X
|
|
|
Montana
|
General
|
|
X
|
|
|
|
X
|
|
X
|
|
|
|
AA-AAS
|
|
X
|
|
|
|
X
|
|
X
|
|
|
|
Nebraska
|
General
|
|
|
X
|
|
|
X
|
|
|
X
|
|
|
AA-AAS
|
|
|
X
|
|
|
X
|
|
|
|
X
|
|
Nevada
|
General
|
|
|
X
|
|
|
X
|
|
X
|
|
|
|
AA-AAS
|
|
|
X
|
|
|
X
|
|
|
X
|
|
|
New Hampshire
|
General
|
|
X
|
|
|
|
X
|
|
|
X
|
|
|
AA-AAS
|
|
X
|
|
|
|
X
|
|
|
X
|
|
|
New Jersey
|
General
|
|
X
|
|
|
|
X
|
not specific
|
|
AA-AAS
|
|
X
|
|
|
|
X
|
not specific
|
|
New Mexico
|
General
|
|
X
|
|
|
X
|
|
not specific
|
|
AA-AAS
|
|
X
|
|
|
X
|
|
|
|
|
X
|
|
New York
|
General
|
|
X
|
|
|
|
X
|
not specific
|
|
AA-AAS
|
|
X
|
|
|
|
X
|
not specific
|
|
North Carolina
|
General
|
|
|
X
|
|
|
X
|
not specific
|
|
AA-AAS
|
X
|
X
|
X
|
X
|
X
|
X
|
not specific
|
|
North Dakota
|
General
|
|
X
|
|
|
|
X
|
|
|
X
|
|
|
AA-AAS
|
|
X
|
|
|
|
X
|
|
|
X
|
|
|
Ohio
|
General
|
|
|
X
|
|
|
X
|
not specific
|
|
AA-AAS
|
X
|
X
|
X
|
X
|
X
|
X
|
X
|
X
|
X
|
X
|
|
Oklahoma
|
General
|
|
|
X
|
|
|
X
|
not specific
|
|
AA-AAS
|
|
|
X
|
|
|
X
|
not specific
|
|
Oregon
|
General
|
|
|
X
|
|
|
X
|
not specific
|
|
AA-AAS
|
|
|
X
|
|
|
X
|
|
|
X
|
|
|
Pennsylvania
|
General
|
|
X
|
|
|
|
X
|
not specific
|
|
AA-AAS
|
X
|
X
|
X
|
X
|
X
|
X
|
|
X
|
|
X
|
|
Rhode Island
|
General
|
|
X
|
|
|
|
X
|
|
|
X
|
|
|
AA-AAS
|
|
X
|
|
|
|
X
|
|
|
X
|
|
|
South Carolina
|
General
|
|
X
|
X
|
X
|
X
|
X
|
not specific
|
|
AA-AAS
|
Xa
|
Xa
|
Xa
|
Xa
|
Xa
|
Xa
|
|
|
|
|
|
South Dakota
|
General
|
|
|
X
|
|
|
X
|
|
|
X
|
|
|
AA-AAS
|
|
|
X
|
|
|
X
|
|
|
X
|
|
|
Tennessee
|
General
|
X
|
X
|
X
|
X
|
X
|
X
|
X
|
X
|
X
|
X
|
|
AA-AAS
|
X
|
X
|
X
|
X
|
X
|
X
|
X
|
X
|
X
|
X
|
|
Texas
|
General
|
|
|
X
|
|
|
X
|
not specific
|
|
AA-AAS
|
|
|
X
|
|
|
X
|
not specific
|
|
Utah
|
General
|
|
X
|
X
|
X
|
X
|
X
|
X
|
X
|
X
|
X
|
|
AA-AAS
|
|
X
|
X
|
X
|
X
|
X
|
X
|
X
|
X
|
X
|
|
Vermont
|
General
|
|
X
|
|
|
|
X
|
|
|
X
|
|
|
AA-AAS
|
X
|
X
|
X
|
X
|
X
|
X
|
X
|
X
|
X
|
|
|
Virginia
|
General
|
X
|
|
X
|
|
|
X
|
not specific
|
|
AA-AAS
|
|
|
X
|
|
|
X
|
not specific
|
|
Washington
|
General
|
|
|
X
|
|
|
X
|
|
X
|
|
|
|
AA-AAS
|
|
|
X
|
|
|
X
|
not specific
|
|
West Virginia
|
General
|
|
X
|
|
X
|
|
|
|
X
|
|
|
|
AA-AAS
|
|
X
|
|
X
|
|
|
|
X
|
|
|
|
Wisconsin
|
General
|
X
|
|
X
|
|
|
X
|
not specific
|
|
AA-AAS
|
|
X
|
|
|
|
X
|
|
X
|
|
|
|
Wyoming
|
General
|
|
X
|
|
|
|
X
|
no info available
|
|
AA-AAS
|
X
|
X
|
X
|
X
|
X
|
X
|
X
|
X
|
X
|
|
|
TOTAL
|
|
12 different,
39 same
|
10 different,
41 same
|
21 different,
29 same
|
Note: There is an “X” in the box when both the general assessment and AA-AAS are administered in a specific grade.
a Not by grade, but rather, by age, such that the SC-Alt is administered to students who meet the participation guidelines for alternate assessment and who are ages 8–13 and age 15 on September 1 of the assessment year. (These are the ages of students who are typically in grades 3–8 and 10.)
Top of Page / Table of Contents
Appendix C
Assessment Approach Types and Response Formats
Table C-1. Assessment Approach Types and Response Formats by State
|
State
|
Item Based
|
Portfolio
|
Rating Scale
|
|
Selected
|
Constructed
|
Performance Task
|
|
Alabama
|
|
|
|
X
|
|
|
Alaska
|
X
|
|
|
|
|
|
Arizona
|
X
|
|
X
|
|
|
|
Arkansas
|
|
|
|
X
|
|
|
California
|
|
|
X
|
|
|
|
Colorado
|
X
|
|
X
|
|
|
|
Connecticut
|
|
|
|
|
X
|
|
Delaware
|
|
|
X
|
|
|
|
District of Columbia
|
|
|
|
X
|
|
|
Florida
|
|
|
X
|
|
|
|
Georgia
|
|
|
|
X
|
|
|
Hawaii
|
|
|
X
|
|
|
|
Idaho
|
|
|
|
X
|
|
|
Illinois
|
|
|
X
|
|
|
|
Indiana
|
|
|
|
|
X
|
|
Iowa
|
|
|
|
|
X
|
|
Kansas
|
X
|
|
|
|
|
|
Kentucky
|
|
|
X
|
|
X
|
|
Louisiana
|
|
|
X
|
|
|
|
Maine
|
|
|
|
X
|
|
|
Maryland
|
|
|
|
X
|
|
|
Massachusetts
|
|
|
|
X
|
|
|
Michigan
|
X
|
|
|
|
|
|
Minnesota
|
|
|
X
|
|
|
|
Mississippi
|
|
|
|
X
|
|
|
Missouri
|
|
|
|
X
|
|
|
Montana
|
|
|
X
|
|
X
|
|
Nebraska
|
|
|
X
|
|
|
|
Nevada
|
X
|
X
|
|
|
|
|
New Hampshire
|
|
|
|
X
|
|
|
New Jersey
|
|
|
|
X
|
|
|
New Mexico
|
X
|
|
|
|
|
|
New York
|
|
|
|
X
|
|
|
North Carolina
|
|
|
X
|
|
|
|
North Dakota
|
|
|
X
|
|
|
|
Ohio
|
|
|
X
|
|
|
|
Oklahoma
|
|
|
|
X
|
|
|
Oregon
|
|
|
X
|
|
|
|
Pennsylvania
|
|
|
X
|
|
|
|
Rhode Island
|
|
|
X
|
|
|
|
South Carolina
|
|
|
X
|
|
|
|
South Dakota
|
|
|
|
X
|
X
|
|
Tennessee
|
|
|
|
X
|
|
|
Texas
|
X
|
|
|
|
|
|
Utah
|
|
|
X
|
|
|
|
Vermont
|
|
|
|
X
|
X
|
|
Virginia
|
|
|
|
X
|
|
|
Washington
|
|
|
X
|
|
|
|
West Virginia
|
|
|
X
|
|
|
|
Wisconsin
|
|
|
X
|
|
|
|
Wyoming
|
|
|
X
|
|
|
|
TOTAL
|
8
|
1
|
24
|
18
|
7
|
Note: 8 states had more than one response format.
*Additional Details and Specification are in Table C-2.
Table C-2. Details and Specifications
|
State
|
Details and Specifications
|
|
Alabama
|
Rubric (January 2014) for extended standards identifies complexity and evidence needed to be met by portfolio.
|
|
Alaska
|
The Participation Guidelines document, pp. 23-31, details that either the student or the test administrator may “enter the student’s response.”
|
|
Arizona
|
According to AIMS A 2014 Test Administration Directions document, performance tasks are standardized constructed response items. The test administrator will then input the student responses into the AIMS A application. Only this portion of the test can be entered by the test administrator at anytime during the testing window (p. 9).
|
|
Arkansas
|
According to webpage about Assessment Materials for Students with Disabilities, the format is portfolio; although there is a “portfolio checklist.” This is not a teacher rating scale but rather an organizational cover sheet to accompany each student portfolio.
|
|
California
|
According to webpage titled CAPA Blueprints Preface, the focus for the alternate assessment describes what CAPA students should know and be able to do in relationship to the content standards. One or more focuses may be targeted for assessment in an individual task. Each standard has an equal opportunity for representation on the CAPA operational form in a given administration.
|
|
Colorado
|
According to CoAlt Examiner’s Manual Science and Social Studies, Selected Response items present three answer options from which the student selects an answer to the question presented. Supported Performance Tasks (SPTs) require students to complete a chart or graphic (p. 1).
|
|
Connecticut
|
According to CMT Skills Checklist Grade 8, the Checklist must be completed by the student’s primary special education teacher in collaboration with other team members (p. v).
|
|
Delaware
|
According to DCAS-Alt1 Test Administration Manual Spring 2015, a task is a set of four to six related activities, called items. The responses to the items provide evidence of what a student knows and can do in Reading, Mathematics, Science, and Social Studies (p. 20).
|
|
District of Columbia
|
Scoring rubric for 2013-2014 tests (including ELA, math, and science) specifies performance, level of complexity, and supports expected for targeted skills to be met by portfolio.
|
|
Florida
|
According to the Florida Alternate Assessment Administration Manual 2014-2015, scoring rubric for performance tasks listed out the procedures for transferring students’ responses from the Response Booklets (including for science) to the scannable student answer sheet, by trained administrators.
|
|
Georgia
|
The Georgia Alternate Assessment Examiner’s Manual 2014-2015 provided guidelines for compiling portfolios; the Observation Form and Interview Form in Appendix C do not ask for rating scale information, but rather provides “secondary evidence” that serves to describe the circumstances around the production of student work in the portfolio.
|
|
Hawaii
|
According to HSAA Test Administration Manual Spring 2015, a task is a set of four to six related activities, called items. The responses to the items provide evidence of what a student knows and can do in reading, mathematics and science (p. 17).
|
|
Idaho
|
According to ISAT-Alt Portfolio Manual 2014-2015, the portfolio can include various types of artifacts, including “student class work evidence,” or “digital video clips,” and/or “digital photographs” (p. 12) showing student demonstrating task completion.
|
|
Illinois
|
According to webpage on Illinois Alternate Assessment (IAA), the IAA is a performance-based assessment that uses on demand tasks.
|
|
Indiana
|
According to the Indiana Department of Education webpage on Alternate Assessments, ISTAR is a teacher rated web-based, standards-referenced assessment system.
|
|
Iowa
|
According to the Iowa Department of Education webpage on Iowa’s AYP Alternate Assessments 1%, under the heading Assessment Reporting Periods & Rating Scale Requirements (for the Iowa Alternate Assessment Science), teachers select Rating Scale Items within the IAAS Online System Student Profile.
|
|
Kansas
|
According to the Kansas Assessment Examiner’s Manual 2014-2015, the Section 1: Assessment Overview section science table indicates that the KSA test is “Multiple-choice, machine-scored” and the alternate DLM Science Pilot Test is “Multiple-choice, technology-enhanced items; machine-scored” (p. 3).
|
|
Kentucky
|
According to the Kentucky Department of Education webpage on Alternate K-PREP (which included science), attainment tasks are performance events that require students to complete a task, working step by step as directed by the teacher. Also, the Transition Attainment Record (TAR) is a checklist which evaluates the student’s readiness in reading, mathematics, and science.
|
|
Louisiana
|
According to Chapter 3: Science of LAA1 Assessment Guide, performance tasks are multi-modal tasks that are read aloud to the student by the test administrator while the student is shown pictures, symbols, tables, charts, graphs, and/or text. Student responses are scored by the test administrator using item specific scoring rubrics on a 0–2 point or 0–1 point scale, depending on whether the task provides for a partially correct response (p. 3-2).
|
|
Maine
|
According to the Maine Department of Education webpage on Personalized Alternate Assessment Portfolio, the Personalized Alternate Assessment Portfolio (PAAP) is an assessment that provides academic achievement reporting for our students with the most significant cognitive disabilities. Tasks are available to teachers throughout a five month window to provide multiple opportunities for science instruction to be embedded into students’ daily work. . . . Students taking the PAAP provide evidence of their proficiency through completion of Alternate Grade Level Expectations (AGLEs) that are aligned to the science standards on which their grade-level peers are measured. Levels of progression are available and measured through eight Levels of Complexity (LoCs) for each AGLE.
|
|
Maryland
|
According to the Alt-MSA 2015 Handbook, as the student is receiving instruction and is being given the opportunity to demonstrate mastery of his or her MOs, a portfolio of student work (Alt-MSA artifacts) in reading, mathematics and science (grades 5, 8, 10) and other supporting information is assembled by the Test Examiner Team (TET) (p. O-5). Artifacts can include student work, data chart “that summarizes the student’s instruction and progress towards mastery of an objective” (p. 0-5). Other types of artifacts required for math and reading are also detailed, including videotapes and audiotapes.
|
|
Massachusetts
|
According to the 2015 Educator’s Manual for MCAS-Alt, the student’s portfolio must include, at minimum, the primary evidence described below for each strand/domain/conceptual category required for the assessment of a student in that grade. It is advisable to include more than the minimum evidence requirement to reduce the chance that a portfolio will be scored as Incomplete. A minimum of one data chart and two pieces of additional primary evidence (called the “core set of evidence”) is required in each portfolio strand that together assess the “measurable outcome” (bolding as in original; p. 33).
|
|
Michigan
|
According to the MI-Access Assessment Plan: Science, multiple choice items will have 3 answer choices in a text and/or picture format.
|
|
Minnesota
|
According to Test Specifications for Science MTAS, test specifications for the MTAS indicate which strands, standards and benchmarks have been selected as priorities for students with the most significant cognitive disabilities. For each benchmark, task specifications clarify, define and limit how performance tasks should address the extended benchmarks; they are intended to represent essential understandings and are not intended to describe all instruction (p. 2).
|
|
Mississippi
|
According to the Data Collection Requirements section of the Mississippi Extended Science Frameworks (MESF) for Students with Significant Cognitive Disabilities, the MESF (Mississippi Extended Science Frameworks) for science are aligned to the 2010 Mississippi Science Framework and specify what students should know and be able to do at the end of each assessment grade. The competencies for assessment are organized by strand and broken down into clusters. Each cluster is contains objectives that increase in complexity from an access level to most complex to provide a variety of learning opportunities. The clusters and objectives are also organized for continuity across grade levels (p. 6).
|
|
Missouri
|
According to the MAP-A Science 2014-2015 Instructor’s Guide and Implementation Manual, the Science MAP-A consists of data and supporting evidence collected by an instructional team. It provides information on a student’s knowledge and skills in Science. It assesses accuracy, independence, and connection to the standards on four Science Alternate Performance Indicators (APIs) (p.16).
|
|
Montana
|
According to the CRT-ALT and Issues of Interrater Reliability presentation slides, regarding approaches to alternate assessment, Montana’s choice: checklist (ITBS Alternate); performance task (CRT-Alternate) (slide 5).
|
|
Nebraska
|
According to Update: Standards, Assessment, and Accountability (SAA) Beginning the School Year 2014-2015, the NeSA-AAR, NeSA-AAM and NeSA-AAS are tests of appropriate tasks, summative in nature, that provide a single snapshot of a student’s performance (p. 49).
|
|
Nevada
|
According to the Nevada AA Administration Manual 2014-2015, Designed specifically for students with significant cognitive disabilities, the NAA is a selected response and open-response assessment that is linked to the Nevada Academic Content Standards (NVACS) in English Language Arts (ELA), Mathematics, and Science (p. 6).
|
|
New Hampshire
|
According to the New Hampshire ALPS Science Administration Manual 2014-2015, The New Hampshire Science Alternate Learning Progressions (NH ALPs) Portfolio is a flexible, individualized portfolio of student video evidence samples. Data are collected from December to May for each participating student. Student video evidence samples are chosen through a collaborative team process and serve as a means of documenting the student’s highest and best performance on academic standards (p. 23). The NH Science ALPs requires two science performance tasks per grade that show the application of science process skills to address selected content. This is begun by determining which two performance tasks are required for your student’s current grade level. The requirements differ by grade level (p. 24).
|
|
New Jersey
|
According to webpage titled Alternate Proficiency Assessment in Science (APA), the Alternate Proficiency Assessment (APA) in science is a portfolio assessment designed to measure progress toward achieving New Jersey’s state educational standards for those students with the most significant intellectual disabilities who are unable to participate in the New Jersey Assessment of Skills and Knowledge (NJASK) Science or the New Jersey Biology Competency Test (NJBCT).
|
|
New Mexico
|
According to the New Mexico Alternate Performance Assessment (NMAPA) Test Administrator Manual, the New Mexico Alternate Performance Assessment (NMAPA) test materials for Science and Social Studies, including the test booklets, Student Score Forms, printed materials (e.g., storybook for Social Studies), and artifacts produced as a result of test administration, are secure test materials (p. 3). Also, A task is a set of four to six related activities, called items. The responses to the items provide evidence of what students know and can do in Science and Social Studies (p. 25).
|
|
New York
|
According to webpage titled New York State Alternate Assessment (NYSAA), The NYSAA is a datafolio-style assessment. Student performance is recorded through direct observation and documentation and may include other information such as student work products, photographs, audio and videotapes.
|
|
North Carolina
|
According to North Carolina Testing Program Summative Assessment Options, 2013-2014, the NCEXTEND1 uses performance tasks (p. 1).
|
|
North Dakota
|
According to the North Dakota Alternate Assessment 1 (NDAA1) Teacher Feedback Survey 2013-2014 Evaluation Summary, the method for scoring the NDAA1 was based on collecting performance based data over four trials and collecting information on the 9 “situational” indicators (e.g., number of settings, number of integrated settings, whether student planned and monitored his/her performance, etc.). The summary indicates that this method represents an appropriate way to evaluate student performance on the State Standards (p. 12). Also, in an unpaginated preface to the North Dakota State Assessment Science Fall 2014 Test Coordinator’s Manual, under the heading An Important Note to Teachers and Administrators Regarding the 2014-15 North Dakota State Assessment Program, students eligible to participate in the science North Dakota Alternate Assessment based on alternate achievement standards (NDAA 1), will take the NDAA 1 in a form similar to previous years’ NDAA 1 administrations. There will be no overt changes to the NDAA 1 test administration practices.
|
|
Ohio
|
According to the Test Design Document Alternate Assessment for Students with Significant Cognitive Disabilities (AASCD), Science Grade 5, Grade 8, and Ohio Graduation Test (OGT), the Ohio Science Alternate Assessment for Students with Significant Cognitive Disabilities (AASCD) was developed for grades: 5, 8 and the Ohio Graduation Test (OGT). Each assessment contains a series of 12 performance tasks and a field-test task block. Each operational task ranges from four to six items. Each field-test task includes six to eight items. Students are not required to take every task in the assessment and will start the test at the point that is most appropriate for the student. The task at which the student begins the assessment is determined by a Student Placement Questionnaire completed by the student’s teacher (p. 3).
|
|
Oklahoma
|
According to the Oklahoma Alternate Assessment Program (OAAP) Portfolio 2014-2015 Portfolio Administration Manual, the OAAP Portfolio requires teachers to submit evidence demonstrating their students’ levels of academic knowledge and skills through collections of academic evidence. Beginning in 2011, the OAAP Portfolio test included videos as part of evidence to be collected by teachers (p. 4).
|
|
Oregon
|
According to the Oregon Extended Assessment Administration Manual 2014-2015, the ORExt test structure no longer places items within tasks, but presents 5 to 8 items per page to ensure sufficient space for assessors. These items are not necessarily linked to the same content prompt but vary from item to item. Selection type responses are used so all students can access the test with varying administration techniques (p. 8).
|
|
Pennsylvania
|
According to webpage titled Pennsylvania Alternate System of Assessment (PASA), the PASA is an individually administered test given each spring to students by their teacher or another certified Test Administrator who knows the student well. Each test item represents an authentic, relevant, and age-appropriate skill related to reading, mathematics, or science. Student performance is video recorded and submitted for scoring to the contractor.
|
|
Rhode Island
|
According to Rhode Island Alternate Assessment (RIAA) 2014-2015 Policies, Procedures, and Test Administration Guidance Documents, the RIAA design consists of an assessment that utilizes Structured Performance Tasks (SPT), which promote integrated academic and life opportunities for students (p. 5).
|
|
South Carolina
|
According to webpage titled South Carolina Alternate Assessments, the SC-Alt in science and social studies consists of a series of performance tasks that are linked to the grade level academic standards although at a less complex level.
|
|
South Dakota
|
According to the South Dakota State Test of Educational Progress for Alternate Assessment (Dakota STEP-A) Technical Report: 2013 Administration, the STEP-A included a rating form [see Rating Form Scoring Rubric, p. 26] and “supporting evidence.” The Supporting Evidence component of the Dakota STEP-A assessment consists of samples or documentation of student work collected by the special education teacher (Rater 1) for each of the reporting categories. Supporting Evidence submissions were to be typical of student performance on a specific task or skill. They should also be clear and understandable to an independent third party evaluating the work sample. Tasks/activities aligned to the student’s IEP should be selected for Supporting Evidence. The sample submitted should provide evidence of performance on an entire task (or as much of the task as a student accomplished) (p. 26).
|
|
Tennessee
|
According to the webpage titled TCAP Assessments for Students with Disabilities, the TCAP is comprised of portfolios.
|
|
Texas
|
According to the STAAR Alternate 2 Test Administrator Manual, on the STAAR Alternate 2 test, each question measures a targeted prerequisite skill. Each essence statement has four questions that form a cluster and test a common skill or concept at varying levels of difficulty. Six clusters make up a test form resulting in 24 questions per test (p. T-6).
|
|
Utah
|
According to the Utah Alternate Assessment Administration Manual and Assessment Tasks, the Utah Alternate Assessment (UAA) consists of approximately 200 assessment tasks from which the IEP team selects relevant tasks for individual students. Each task is presented in a common format to provide clarity and ease of use. This common format consists of three sections: (a) Task Description, (b) Administration and Scoring, and (c) Assessment Record (p. 11).
|
|
Vermont
|
According to the Vermont Alternate Assessment Portfolio (VTAAP) Student Performance Scoring Guide Science Content Knowledge Domains 2014-2015, the state employed portfolios and rating scales (termed “Baseline and Endline Record forms”). Under the heading “Scoring,” are these directions: You will . . . assign ratings to each of the four scoring elements (Behavior Alignment, Application Alignment; Quantity, and Accuracy). Also, under the heading “Targets Behaviors,” are these directions: Orient to the student Product by reading the Baseline and Endline Record forms, examining all of the evidence (worksheets, pictures, video, etc.) connected to the entry point task(s), and any other annotation (p. 2).
|
|
Virginia
|
According to the Virginia Alternate Assessment Program Implementation Manual 2014-2015, the VAAP provides the student the opportunity to demonstrate what he or she knows through a non-traditional method of testing. By completing products and work samples that demonstrate his/her understanding or skill, under testing conditions, the student proves that he/she knows the content. The selection of evidence used to demonstrate student performance on the ASOL is the responsibility of the student and submitting teacher. Evidence should be viewed from a qualitative, not quantitative, perspective. Evidence submitted should clearly demonstrate the level of competency the student has in regard to each ASOL being defended. All evidence submitted must have been completed under testing conditions by the student in the presence of a teacher or other school personnel (p. 4). Appendix E also contains the 2014-2015 Teacher Checklist for Collections of Evidence; however, this is not a teacher rating scale but rather an organizational cover sheet to accompany each student portfolio.
|
|
Washington
|
According to the WA-Access to Instruction & Measurement Alternate Assessment 2014-2015 Science Access Point Frameworks, the Access Point Frameworks are the underpinning for the WA-Access to Instruction & Measurement and serve as the foundation for the performance task component of the assessment (p. 1).
|
|
West Virginia
|
According to webpage West Virginia Alternate Performance Task Assessment (APTA), APTA assesses questions in three content areas: Reading/Language Arts, Mathematics, and Science. A separate test was developed for each grade level in Reading/Language Arts and Mathematics (grades 3-8 and 11) and in Science (grades 4, 6, and 10).
|
|
Wisconsin
|
According to webpage titled Wisconsin Alternate Assessment for Students with Disabilities (WAA-SwD), the WAA-SwD includes a performance task assessment for the content areas of science for 4th, 8th, and 10th grades. These are linked with the state’s content standards through the Wisconsin Extended Grade Band Standards . . .
|
|
Wyoming
|
According to the Test Design Document Wyoming Alternate Assessment for Students with Significant Cognitive Disabilities (Wy-ALT) Science, each assessment contains a series of 12 performance tasks. Each operational task ranges from four to six items. The items become increasingly more complex and difficult within a task; the tasks become increasingly more complex as the student moves through the test form. Students are not required to take every task in the assessment and will start the test at the point that is most appropriate for the student (p. 3).
|
Top of page |
