Synthesis Report 94A Summary of the Research on the Effects of Test Accommodations, 2011-2012Christopher M. Rogers, Sheryl S. Lazarus, and Martha L. Thurlow September 2014 All rights reserved. Any or all portions of this document may be reproduced and distributed without prior permission, provided the source is cited as: Rogers, C. M., Lazarus, S. S., & Thurlow, M. L. (2014). A summary of the research on the effects of test accommodations, 2011-2012 (Synthesis Report 94). Minneapolis, MN: University of Minnesota, National Center on Educational Outcomes. Table of Contents
Executive SummaryThe use of accommodations in instruction and assessments continues to be of great importance for students with disabilities. This importance is reflected in an emphasis on research to investigate the effects of accommodations. Key issues under investigation include how accommodations affect test scores, how educators and students perceive accommodations, and how accommodations are selected and implemented. The purpose of this report is to provide an update on the state of the research on testing accommodations as well as to identify promising future areas of research. Previous reports by the National Center on Educational Outcomes (NCEO) have covered research published since 1999. We summarize the research to review current research trends and enhance understanding of the implications of accommodations use in the development of future policy directions, implementation of current and new accommodations, and valid and reliable interpretations when accommodations are used in testing situations. For 2011 and 2012, 49 published research studies on the topic of testing accommodations were found. Among the main points of the 2011-12 research are:
The studies in 2011-2012 demonstrated several similarities when viewing them in comparison with previous research, especially in relation to the 2009-2010 studies examined in our previous accommodations research review. Continuing trends showed more empirical research on accommodations effects at the postsecondary level, and increased accommodations perceptions research that involved educators. Researchers continued to build evidence about oral delivery, computer administration, calculators, and extended time, yet they also examined unique or unusual accommodations, including some high-tech accommodations. Accommodations for mathematics and reading testing continued to receive attention. Research designs with multiple purposes persisted. Still, there were several differences, or shifts, as well between research conducted in 2009-2010 and 2011-2012. Science assessment accommodations research decreased. Inquiry about construct validity became more complex, permitting the identification of factors that might influence the interface of accommodations with assessments of specific academic subjects. Top of Page | Table of Contents OverviewAll students, including students with disabilities, are required by the Individuals with Disabilities Education Act (IDEA) of 2004 and Title I of the 2001 reauthorization of the Elementary and Secondary Education Act (ESEA) to participate in assessments used for accountability. Some students need accommodations to meaningfully access assessments. States and assessment consortia look to accommodations research when making policy decisions about accommodations. To synthesize accommodations research efforts completed across the years, the National Center on Educational Outcomes (NCEO) has published a series of reports on accommodations research. The time periods included 1999-2001 (Thompson, Blount, & Thurlow, 2002), 2002-2004 (Johnstone, Altman, Thurlow, & Thompson, 2006), 2005-2006 (Zenisky & Sireci, 2007), 2007-2008 (Cormier, Altman, Shyyan, & Thurlow, 2010), and 2009-2010 (Rogers, Christian, & Thurlow, 2012). This report covers the time period 2011-2012. The purpose of this report is to present a synthesis of the research on test accommodations published in 2011 and 2012. The literature described here encompasses empirical studies of score comparability and validity studies as well as investigations into accommodations use, implementation practices, and perceptions of their effectiveness. As a whole, the current research body offers a broad view and a deep examination of issues pertaining to assessment accommodations. Reporting the findings of current research studies was a primary goal of this analysis; a secondary goal was to identify areas requiring continued investigation in the future. Review ProcessSimilar to the process used in past accommodations research syntheses (Cormier et al., 2010; Johnstone et al., 2006; Rogers et al., 2012; Thompson et al., 2002; Zenisky & Sireci, 2007), a number of sources were accessed to complete the review of the accommodations research published in 2011 and 2012. Specifically, five research databases were consulted: Educational Resources Information Center (ERIC), PsycINFO, Academic Search Premier, Digital Dissertations, and Educational Abstracts. To help confirm the thoroughness of our searches, we used the Web search engine Google Scholar to search for additional research. In addition, a hand-search of 47 journals was completed, in efforts to ensure that no qualifying study was missed. A list of hand-searched journals is available on the National Center on Educational Outcomes website (www.nceo.info/OnlinePubs/AccommBibliography/AccomStudMethods.htm). Online archives of several organizations were also searched for relevant publications. These organizations included Behavioral Research and Teaching (BRT) at the University of Oregon (http://brt.uoregon.edu), the College Board Research Library (http://research.collegeboard.org), the National Center for Research on Evaluation, Standards, and Student Testing (CRESST; http://www.cse.ucla.edu), and the Wisconsin Center for Educational Research (WCER; http://testacc.wceruw.org/). The initial search was completed in December, 2012. A second search was completed in April, 2013, and a third search in June, 2013, to ensure that all articles published in 2011 and 2012 were found and included in this review. Within each of these research databases and publications archives, we used a sequence of search terms. Terms searched for this review were:
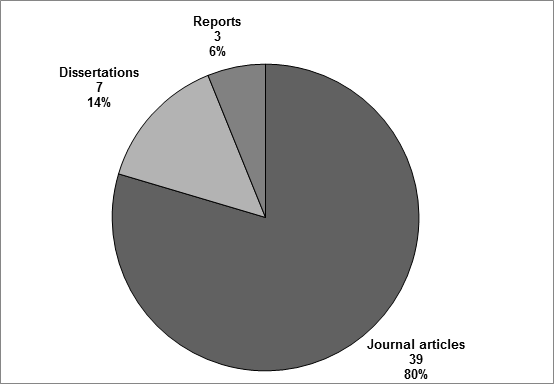
Many of these search terms were used as delimiters when searches yielded large pools of documents found to be irrelevant to the searches. The research documents from these searches were then considered for inclusion in this review with respect to several criteria. First, the decision was made to focus only on research published or defended (in doctoral dissertations) in 2011 and 2012. Second, the scope of the research was limited to investigations of accommodations for regular assessment; hence, articles specific to alternate assessments, accommodations for instruction or learning, and universal design in general were not part of this review. Third, research involving English language learners (ELLs) was included only if the target population was ELLs with disabilities. Fourth, presentations from professional conferences were not searched or included in this review, based on the researchers’ criteria to include only research that would be accessible to readers and that had gone through the level of peer review typically required for publication in professional journals or through a doctoral committee review. (This criterion was implemented for the first time during the 2007-2008 review.) Finally, to be included in the online bibliography and summarized in this report, studies needed to involve (a) experimental manipulation of an accommodation, (b) investigation of the comparability of test scores across accommodated and non-accommodated conditions, or (c) examination of survey results about students’ or teachers’ knowledge or perceptions of accommodations. To reflect the wide range of accommodations research that was conducted in 2011 and 2012, the studies are summarized and compared in the following ways: (a) purposes of research; (b) research type and data collection source; (c) assessment or data collection focus; (d) characteristics of the independent and dependent variables under study; (e) comparability of findings between studies in similar domains; and (f) limitations and directions of future research. The information provided in each of these categories should provide insight into the current state of accommodations research in education and highlight trends in current accommodations research. Top of Page | Table of Contents ResultsThe results of our analyses of the 49 studies published from January 2011 through December 2012 are presented in substantive detail. We identify the studies’ publication types, as well as the range of research purposes. We specify the types of research approaches and the primary and secondary sources of data collection. We also describe the data collection methods and instruments. We report the academic content areas covered in the research. We depict research participants in terms of their being students, educators, and parents, their ages or grade levels, the participant sample sizes and disability status, and their disability categories. We report the types of accommodations studied. We also explicate the research findings in terms of the impact of accommodations as well as perceptions about accommodations, incidence of accommodations use, and implementation. Additional sections offer perspectives on accommodations in postsecondary education, the effects of accommodations on construct validity, and the association of accommodations to academic discipline. Finally, limitations and future research directions in the assembled body of research literature are presented as reported by the researchers. Accommodations research takes a variety of approaches. It ranges from a large-scale approach that might examine aggregated accommodations data to an approach that involves testing an individual accommodation for a specific disability category. This range of approaches is reflected in research questions that focus on areas such as: the use or implementation of accommodations; the perception of accommodations by educational professionals, students, and parents; and the effects of accommodations on test scores. Publication TypeThe results of the review process showed a total of 49 studies were published from January 2011 through December 2012. As shown in Figure 1, of these 49 studies, 39 were journal articles, 7 were dissertations, and 3 were published professional reports released by research organizations (e.g., CRESST, Behavior Research and Training). Figure 1. Percentage of Accommodations Studies by Publication Type
The total number of studies published on accommodations in 2011-2012 (n=49) increased only slightly since the previous report examining accommodations research published in 2009-2010 (n=48). There was an increase in the number of journal articles (n=36 in 2009-2010; n=39 in 2011-2012), and a slight decrease in the number of dissertations published on accommodations (n=10 in 2009-2010; n=7 in 2011-2012). The report on accommodations research in 2009-2010 included 36 articles from 24 journals; the 39 articles described in the current report were found in 23 journals. In 2011-2012 there was a mean of 1.7 articles per journal that included any papers about accommodations, as compared to 2009-2010 when there was a mean of 1.5 articles per journal. Purposes of the ResearchA number of purposes were identified in the accommodations research published in 2011 and 2012. Table 1 provides a view of the predominant focus of each of these 49 studies. Ten studies listed single purposes (see Appendix A). The majority of studies sought to accomplish multiple purposes. In those cases, we identified the “primary purpose” according to the title of the work or the first-mentioned purpose in the text of the work. Table 1. Primary Purpose of Reviewed Research
The most common primary purpose for research published during 2011-2012 was to report on the effect of accommodations on test scores (41%) by comparing scores of students who received accommodations to those who did not (see Table A-1 in Appendix A). The next most common primary purposes were studying perceptions of the accommodations and preferences between or among a small number of accommodations of a certain type, reporting on implementation practices and accommodations use, and comparing test items. The third most frequent purpose, comparing test items, refers to whether item difficulty or other item-specific content validity issues changed when test format changed. Examples of these types of format changes included: from print-based to electronic (e.g., Alt & Moreno, 2012; Taherbhai, Seo, & Bowman, 2012), or from print to audio presentation (e.g., Shelton, 2012). The results presented in Table 1 include some literature reviews. We identified the primary purpose of summarizing research in studies that were expressly written as literature reviews; for example, Smith and Amato (2012) inquired about the impact of various accommodations on the assessment outcomes of students with visual impairments. Investigating test structure and identifying predictors of the need for accommodations were each fairly uncommon as a primary study purpose, each represented by less than 3% of the studies (n=1; test structure was primarily investigated in Posey & Henderson, 2012; identifying predictors was primarily identified in Brown, Reichel, & Quinlan, 2011). Table 2 provides a more detailed view of the accommodations research body of literature. It shows the multiple purposes of many studies. These multi-purpose studies contained up to four different purposes, but most commonly there were two purposes. For example, some efforts (Feldman, Kim, & Elliott, 2011; Kim, 2012; Patterson, Higgins, Bozman, & Katz, 2011; Schmitt, McCallum, Hennessey, Lovelace, & Hawkins, 2012; Schmitt, McCallum, Rubinic, & Hawkins, 2011) included analyses of score comparisons between students with disabilities and students without disabilities when using accommodations, yet also studied perceptions by analyzing students’ comments through survey or interview about their test-taking experience. Table 2. All Purposes of Reviewed Research
a The total of these percentages is >100% due to the multiple purposes identified in most (39) of the studies; 26 of the studies had 2 identified purposes, 9 of the studies had 3 identified purposes, and 5 of the studies had 4 identified purposes.When all purposes (i.e., primary, secondary) are included, the most common single purpose of the 2011-2012 published studies was inquiring from study participants about their perceptions of accommodations. The second most common purpose in this set of studies was demonstrating the effect of accommodations on test scores. Study approaches either compared test scores of students with disabilities and students without disabilities when using accommodations, or compared test scores of students with disabilities when using and not using accommodations. Each of these approaches was used in about half of this category of research. These first two purposes were both investigated in many of the 2011-2012 studies (n=11; see Tables A-1 and A-2 in Appendix A). Another purpose we identified in almost one-third of the studies was summarizing research on test accommodations, when a substantive part of the document was devoted to a comprehensive review of accommodations and their effects. All of the dissertations (n=7) among these studies, along with literature reviews, were identified with this purpose. Although not reported as a primary purpose, discussing issues was identified in almost one-third of the studies, usually noted when the researchers offered detailed considerations of central issues related to accommodations. For example, Holmes and Silvestri (2012) presented information about availability of assistive technology for postsecondary students with disabilities. The purpose of reporting on implementation practices and/or accommodations use was part of nearly one-fourth of the studies. For example, Qi and Mitchell (2012) detailed accommodations practice and use with the Stanford Achievement Test for deaf and hard-of-hearing children. The purpose of comparing test items co-occurred in some studies (n=4) on comparing scores between accommodated and non-accommodated tests adding a focus on analyzing differential item functioning (DIF). For instance, Flowers, Kim, Lewis, and Davis (2011) compared effects of oral delivery when provided on print tests and computerized tests, and also examined differential benefits of standard print format and computerized format on individual items. Additionally, comparison of test items was part of studies that simultaneously considered construct validity. For example, Cho, Lee, and Kingston (2012) measured whether item characteristics were related to item difficulty, and also analyzed whether item functioning was related to use of an accommodations package to discern test validity. The least common purposes, evaluating test structure and predicting the need for accommodations, were investigated by two studies each. An example of the former was when Posey and Henderson (2012) sought expert feedback in examining test features. An example of the latter was when Zebehazy, Zigmond, and Zimmerman (2012) analyzed the score patterns of students with visual impairments to discern the need for the accommodations that they received. Research Type and Data Collection SourceAbout two-fifths of the accommodations research reviewed here used a quasi-experimental research design to gather data for their research purposes. As seen in Table 3, in over twice as many quasi-experimental studies (n=14), researchers themselves gathered the data (i.e., primary source data), compared to studies with secondary data sources (n=6), such as extant or archival data. The number of quasi-experimental research studies increased slightly in 2012 compared to 2011, while the number of studies using a descriptive quantitative design remained the same. Researchers reported using truly experimental studies only 2 times in 2011 and 3 times in 2012. Though few studies were reported to use descriptive qualitative, longitudinal, or meta-analytic designs, these categories also were rarely included in past reports. Furthermore, there appeared to be a small difference between data collection sources, with almost two-thirds of studies using primary sources and over one-third of studies using secondary sources of data. This is similar to the previous report in which a similar proportion of about twice as many studies used primary data in comparison with secondary data sources. Table 3. Research Type and Data Collection Source by Year
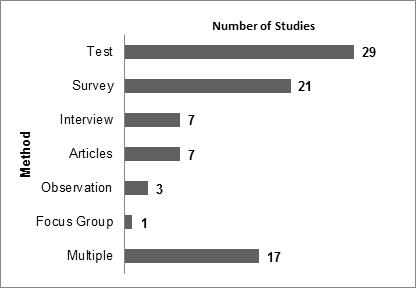
Data Collection Methods and InstrumentsThe researchers collected study data that were gathered through primary or secondary procedures using various methods and tools, as seen in Figure 2. Most of the research (n=29; 59%) included in this synthesis for 2011-2012 used data acquired through academic content testing. About two-fifths (n=21) of the studies employed surveys to gather data. Interviews were used much less frequently. For this analysis, we considered “articles” the method or source for those studies that reviewed research, including one study that employed formal meta-analysis. Three studies used observations, and one study used focus groups as a data source. Over one-third of the studies reported using more than one method or tool to gather data. Figure 2. Data Collection Methods Used in 2011-2012 Research
Note. Of the 49 studies reviewed for this report, 14 reported using two data collection methods, and 3 reported using three data collection methods.Nearly all of the 2011-2012 studies used data collection instruments of one form or another; only four studies did not employ any instruments. Table 4 presents the types of data collection instruments used in studies. Surveys presented items of an attitudinal or self-report nature. Tests were course- or classroom-based. Assessments were statewide or large-scale in scope. Protocols refer to nonacademic sets of questions, usually presented in an interview or focus group format. Measures referred to norm-referenced academic or cognitive instruments. All of these instruments were placed into five categories: protocols or surveys developed by study authors, norm-referenced cognitive ability measures, norm-referenced academic achievement measures, state criterion-referenced academic assessments, and surveys or academic tests developed by education professionals or drawn by researchers from other sources. Non-test protocols developed by the author or authors of the studies—the most commonly-used instrument type—included performance tasks, questionnaires or surveys, and interview and focus-group protocols, among others. Surveys or academic tests developed by education professionals or researchers used sources outside of current studies, and were exemplified by perception surveys such as the Accessibility Rating Matrix (ARM; Beddow, Elliott, & Kettler, 2009; as in Kettler, et al., 2012), or by subsets of items drawn from released or otherwise-available pools such as the Discovery Education Assessment (e.g., Beddow, 2011). State criterion-referenced assessments included those of Georgia, Maryland, Pennsylvania, and Virginia, as well as some from states that remained unidentified in the research. Nine norm-referenced academic achievement measures were used in one or more studies, including the TerraNova Achievement Test and the Nelson-Denny Reading Test (NDRT). Norm-referenced cognitive ability measures included the Clinical Evaluation of Language Fundamentals—Fourth Edition (CELF-4), among others. A substantial minority—16 studies in all—used instrumentation of more than one kind. Additionally, a small number of studies used multiple instruments in each of them, often of the same kind (Brown et al., 2011; Feldman et al., 2011; Shelton, 2012; Srivastava & Gray, 2012). A small number (n=3) of instruments was used in more than one study: Clinical Evaluation of Language Fundamentals—Fourth Edition (CELF-4), the National Assessment of Educational Progress (NAEP), and Georgia’s Criterion-Referenced Competency Tests (CRCT) in mathematics. We present a complete listing of the instruments used in each of the studies in Appendix C, including the related studies that served as sources for these instruments, when available. Table 4. Data Collection Instrument Types
1 Other: 1 study used an observation procedure (Bouck, Flanagan, & Joshi, 2011), 1 study used a college course exam (Makeham & Lee, 2012).2 4 studies were literature reviews employing various data collection approaches and/or instruments (Holmes & Silvestri, 2012; Lovett, 2011; Shinn & Ofiesh, 2012; Smith & Amato, 2012).Content Area AssessedA number of studies published during 2011-2012 focused on accommodations used in certain academic content areas. As shown in Table 5, math and reading were the two most commonly studied content areas. Table 5 also provides a comparison to content areas in NCEO’s previous reports on accommodations (Rogers et al., 2012; Cormier et al., 2010). In general, the emphasis on reading and math is consistent across reviews. The number of studies on writing, social studies, and psychology has remained fairly consistent since 2005. An increase in science studies, apparent in previous years, was not evident in the current report, where there was a decrease in numbers. There have been no studies citing Civics/U.S. History since 2005-2006, so we did not include this content area in the current report. Two studies published in 2011-2012 did not specify a content area. This is a change from the last report, in which all studies specified the content areas of the assessments and their accommodations. Table 5. Academic Content Area Assessed Across Three Reports
a Studies in 2007-2008 including examinations of more than one content area ranged in number of areas assessed from 2 to 4.
|
|||||||||||||||||||||||||||||||||||||||||||||||||||||||||||||||||||||||||||||||||||||||||||||||||||||||||||||||||||||||||||||||||||||||||||||||||||||||||||||||||||||||||||||||||||||||||||||||||||||||||||||||||||||||||||||||||||||||||||||||||||||||||||||||||||||||||||||||||||||||||||||||||||||||||||||||||||||||||||||||||||||||||||||||||||||||||||||||||||||||||||||||||||||||||||||||||||||||||||||||||||||||||||||||||||||||||||||||||||||||||||||||||||||||||||||||||||||||||||||||||||||||||||||||||||||||||||||||||||||||||||||||||||||||||||||||||||||||||||||||||||||||||||||||||||||||||||||||||||||||||||||||||||||||||||||||||||||||||||||||||||||||||||||||||||||||||||||||||||||||||||||||||||||||||||||||||||||||||||||||||||||||||||||||||||||||||||||||||||||||||||||||||||||||||||||||||||||||||||||||||||||||||||||||||||||||||||||||||||||||||||||||||||||||||||||||||||||||||||||||||||||||||||||||||||||||||||||||||||||||||||||||||||||||||||||||||||||||||||||||||||||||||||||||||||||||||||||||||||||||

Number of Research Participants by Study |
Number of Studies by Proportion of Sample Comprising Individuals with Disabilities |
|||||
|
0-24% |
25-49% |
50-74% |
75-100% |
Unavail.1 |
Total |
1-9 |
0 |
0 |
0 |
5 |
0 |
5 |
10-24 |
0 |
0 |
1 |
1 |
0 |
2 |
25-49 |
0 |
1 |
2 |
0 |
0 |
3 |
50-99 |
1 |
1 |
0 |
2 |
0 |
4 |
100-299 |
3 |
1 |
0 |
2 |
1 |
6 |
300-499 |
1 |
1 |
0 |
0 |
0 |
2 |
500-999 |
0 |
1 |
1 |
0 |
0 |
2 |
1000 or more |
4 |
1 |
0 |
4 |
0 |
9 |
Unavailable2 |
0 |
0 |
0 |
1 |
0 |
1 |
Total |
9 |
6 |
4 |
15 |
1 |
34 |
a 1 study did not specify the proportion of participants who had disabilities.
b 1 study did not specify the number of participants.
In 2011-2012, there was a larger number of studies in which at least 50% of the participants were people with disabilities (n=18) than there were studies with fewer than 50% of the participants being people with disabilities (n=15); only one study did not have the number of participants available (Taherbhai et al., 2012). The six studies with between 25% and 49% people with disabilities had participant group sizes ranging from 39 to 1,944, and involved only student participants. Of the nine studies with fewer than 25% people with disabilities, six studies ranged in participant numbers from 282 to 769,550, and these six studies were focused on student assessment performance; further, four of these studies examined extant data sets of over 50,000 students each. The other three studies in that set were focused on educators’ perceptions and knowledge of accommodations (Brockelmann, 2011; Phillips et al., 2012; Zhou et al., 2011). There were only three studies with 50% people with disabilities and 50% without disabilities, and they each had fewer than 50 participants, who were students.
Fifteen studies examined participant groups composed almost entirely of people with disabilities; these are reported in the 75-100% column. In fact, 14 of these 15 studies focused only on students with disabilities. The exception was a study (Kuti, 2011) that engaged 8 educators in providing qualitative interview data and examined extant data from 7,002 students with disabilities. Of the studies involving more than 50% participants with disabilities, there were three distinct group sizes: fewer than 25, between 50 and 299, and over 4,000. Finally, almost all of the 2011-2012 studies reported sufficient data to determine the proportion of study participants who had disabilities and who did not have disabilities. This observation substantially contrasts with information from the 2009-2010 studies, when about 25% of the studies did not have sufficient data to determine these proportions. However, unlike the previous reporting period which had a complete accounting of the number of participants in the relevant studies, there was a study that did not publish the exact proportion of participants with disabilities, due to circumstances explained in that study (Patterson et al., 2011).
School Level
Research on accommodations published during 2011 and 2012 involved kindergarten through college-aged participants (see Table 7). Previous reports included research with participants in kindergarten through postsecondary (see Appendix D for more detail). Postsecondary included both university participants and participants in other postsecondary settings. For example, Ihori (2012) investigated the perspectives of faculty members in two-year and four-year higher education institutions, and Gregg and Nelson (2012) gathered accommodated test scores from students transitioning from postsecondary settings to work settings. This shift toward including studies about accommodations in testing for postsecondary-aged youth began in the previous report (Rogers et al., 2012).
As seen in Table 7, a plurality of the studies published in 2011 and 2012 focused on middle school students (n=21). Twelve studies involved elementary school students, and ten involved high school students. Nearly one-quarter of the studies (n=12) involved samples from across more than one grade-level cluster; nearly all of these studies included relatively larger groups of 50 or more participants (91%), and one-half of them used secondary data sources (see Appendices B and D). Put another way, these multiple grade-level studies were either analyses of extant large-scale assessment data sets, often drawn at the state level, or examinations of data gathered by researchers under experimental and quasi-experimental conditions. Although not more common than K-12 studies, there was a noteworthy number of studies that examined accommodations use and implementation at the postsecondary/college level; further, some (n=2) of these involved adult learners who were not in formal higher education institutions. For example, Patterson and her colleagues (2011) piloted the General Equivalency Diploma (GED) mathematics test in a computerized form with accessibility tools to provide for adult learners’ accommodations needs.
Table 7. School Level of Research Participants
Education Level of Participants in Studies |
Number of Studies |
Elementary school (K-5) |
12 |
Middle school (6-8) |
21 |
High school (9-12) |
10 |
Postsecondary |
6 |
Multiple grade-level clusters |
12 |
Not applicable (No age) |
12 |
Disability Categories
A broad range of disability categories was included in samples in the 2011-2012 research (see Appendix D for details). As shown in Table 8, seven studies did not specify disability categories of student participants, eleven studies did not include students in the sample, and five studies did not enumerate participants. Of the remaining 26 studies, the most commonly studied disability category was learning disabilities (n=17); five of these studies had only participants with learning disabilities, and four more compared students with learning disabilities to students without disabilities. About one-fourth of these remaining 26 studies included students with blindness/visual impairments (n=7), students with emotional behavioral disabilities (n=6), or students with speech/language impairments (n=6). About one-fifth of the 26 studies included students with deafness/hearing impairments (n=5), and another one-fifth included students with autism (n=5). The lowest proportions of studies—between one-sixth and one-eighth—included students with attention problems, students with physical disabilities, or students with intellectual disabilities. Only two studies reported participants with “multiple disabilities.” Over one-half of relevant studies included students without disabilities as comparison groups.
Besides students with learning disabilities, very few studies examined accommodations for only participants with one specific category of disabilities: students with blindness/visual impairments, 2 studies (Kim, 2012; Posey & Henderson, 2012); students with hearing impairments, 1 study (Cawthon, Winton, Garberoglio, & Gobble, 2011); students with speech/language impairments, 1 study (Koutsoftas & Gray, 2012); students with autism, 1 study (Alt & Moreno, 2012); and students with attention problems, 1 study (Brown et al., 2011). Eight studies included participant groups with various disabilities, rather than all having one specific category of disability.
Table 8. Disabilities Reported for Research Participants
Disabilities of Research Participants |
Number of Studies |
Learning disabilities |
17 |
Blindness/Visual impairment |
7 |
Emotional behavioral disability |
6 |
Speech/Language |
6 |
Deafness/Hearing impairment |
5 |
Autism |
5 |
Attention problem |
4 |
Physical disabilitya |
3 |
Intellectual disabilities |
3 |
Multiple disabilitiesb |
2 |
No disability |
15 |
Not specifiedc |
8 |
Not applicabled |
11 |
a Physical disability = mobility impairments and/or impairment with arm use.
b Multiple disabilities = individual students who were each specifically categorized as having more than one disability.
c Not specified = those studies or reviews (1) of studies that did not report about or provide detail as to the participants’ disabilities.
d Not applicable = those documents that had only non-students as participants.
Types of Accommodations
The number of times specific categories of accommodations were included in 2011-2012 published research is summarized in Table 9. Presentation accommodations were the most frequently studied category (n=35), and within this category the most common accommodation was oral delivery—including human reader, and via technology (n=23). The next three most common presentation accommodations were computer administration (n=9), large print (n=8), and braille (n=7). The next most frequent category studied was response accommodations (n=23), and in that category, dictated response (n=11) was the most common accommodation. It should be noted that the computer administration accommodation fits into three categories: presentation, equipment/materials, and response. The next most common response accommodation was dictated response (n=8).
Several studies (n=28) analyzed accommodations from more than one category. For example, Kim (2012) studied students with visual impairments who were provided the read-aloud accommodation by a human reader, in addition to other accommodations including large print, braille, and extended-time. Two studies—Beddow (2011) and Fox (2012)—examined accommodations as they were naturalistically identified in students’ IEPs, and their effects were not individually measured. Many of these instances of multi-category accommodations studies are related to the fact that some accommodations fit into more than one category. For example, studies examining computer administration (n=10) fit into three categories: presentation, equipment/materials, and response. In contrast, fewer studies (n=13) investigated accommodations within the same category. In fact, nearly all of these studies (n=11) focused on single accommodations, and most of them studied either read-aloud (n=6) or extended-time (n=4). A complete listing of accommodations examined in each study is provided in Appendix E.
Table 9. Accommodations in Reviewed Research
Accommodation Category |
Number of Studies |
Presentation |
35 |
Equipment/Materials |
20 |
Response |
23 |
Timing/Scheduling |
17 |
Setting |
8 |
Multiple accommodations |
29 |
Research Findings
The findings of the studies about accommodations published in 2011 and 2012 are summarized in Tables 10-20. We present information according to the nature of the studies, in keeping with the range of their purposes and focuses. The findings included sets of research about specific accommodations: oral delivery, computer administration, extended-time, calculator, and aggregated sets of accommodations commonly called “bundles.” We also report the findings about unique accommodations—those examined in only one study each—including a specialized calculator, American sign language (ASL) via digital video, word-processing, and visual chunking representation. We also report about descriptions of perceptions about accommodations, including those of student test-takers as well as educators. We summarize the findings of the accommodations, and describe a range of implementation conditions as well as incidence of use of various accommodations across large data sets. The findings from studies in postsecondary educational contexts, which have grown over time from 6 or 7 in our past three reports to 11 in this report, are given separate attention. This report also presents findings by academic content areas: math, reading, science, and writing. In Appendix F, we provide substantial detail about individual studies.
Impact of Accommodations
Research examining the effects of accommodations on assessment performance for students with disabilities comprised 29 studies published in 2011 and 2012 (see Table 10; see also Appendix F, Tables F-1 to F-6 for details about each study of this type). We detail the effects of these four discrete accommodations—oral delivery, computer administration, extended time, and calculator—along with lists of aggregated accommodations and uncommon accommodations.
Oral delivery, provided using text-to-speech devices or human reader, was the single most investigated accommodation in 2011-2012 with six studies. For clarity in this report, we used “oral delivery” in place of “read aloud” to explicitly acknowledge the range of media formats used, including human readers, recordings of assessment items or instructions, and text-reading software or text-to-speech devices. The delivery methods that do not use human delivery of the accommodation have been increasing in research attention.
Of the six studies examining oral delivery, three studies supported performance improvements for some students with disabilities but not all or in some testing conditions but not all. Lazarus, Thurlow, Rieke, Halpin, and Dillon (2012) noted no average score differences for the 24 participants as a whole when using and not using a human reader, yet found that individual scoring patterns indicated that seven participants scored higher when using read-aloud, eight scored higher when not using read-aloud, and nine scored the same under both conditions. Schmitt and colleagues (2012) found that the three college student participants with reading disabilities varied in degree of score improvement on reading comprehension, when using a ReadingPen Advanced Edition (2006) device with a digitized voice. Comparing each student’s scores under a control condition, when using the device for only decoding, and for decoding and seeking vocabulary definitions, researchers indicated that the student with lowest comprehension skills benefited most in both reading pen conditions in contrast to the other students, who scored better when not using the accommodation. The same least-skilled individual student benefited more from the reading pen’s decoding support than from using it for both decoding and vocabulary definition. In a similar study, which measured comprehension accuracy and comprehension rate per minute, Schmitt and colleagues (2011) found that high school students with learning disabilities using a ReadingPen Advanced Edition (2006) device to decode words and to define vocabulary words scored worse on rate than when using it to decode words only. Two of the three participants scored highest on accuracy without the accommodation. The other three oral delivery findings seemed at odds with one another. Shelton (2012) found that audio-recorded oral delivery supported score improvements for both students with and without (learning) disabilities. Kim (2012) found that students with disabilities (visual impairments) scored differentially better with support of an human reader. Holmes and Silvestri (2012) summated that the studies on assistive technology (AT) indicated that text-to-speech supported reading, and also provided additional benefits, such as improvement in comprehension, task persistence, and reading rate. (See Appendix F, Table F-1.)
Computer administration, which is both a presentation and response accommodation, was the next most frequently-studied accommodation in the 2011-2012 published literature, comprising one-seventh of the effect studies (n=4). Most of the study findings (75%) indicated that use of computer administration as a stand-alone accommodation (i.e., it was not bundled with other accommodations), did not result in higher performance for students with disabilities. This result occurred for youth and adults completing the General Equivalency Diploma exam (Patterson, Higgins, Bozeman, & Katz, 2011), grade 8 students with and without language-learning disabilities completing reading comprehension assessments (Srivastava & Gray, 2012), and students in grades 7 and 8 with learning disabilities matched with similar-ability students without disabilities completing reading and math state assessments (Taherbhai, Seo, & Bowman, 2012). The study (Alt & Moreno, 2012) that differed in findings from these three studies compared test formats for age 5-13 year old students with and without autism spectrum disorders on expressive and receptive language and found that students with disabilities did not differentially benefit from computerized test format when comparing their scores with those of students without disabilities, who were matched for age and sex. (See Appendix F, Table F-2.)
The extended-time accommodation was investigated in three studies (Brown, Reichel, & Quinlan, 2011; Gregg & Nelson, 2012; Lovett, 2011). The findings about the effect of extended time on assessment scores varied widely, yielding no consensus. One study (Brown et al., 2011) indicated that extended time supported improved reading comprehension scores for students with attention deficit hyperactivity disorder (ADHD). A meta-analysis (Gregg & Nelson, 2012) indicated that studies published from 1986 through 2006 supported the differential boost hypothesis, that is, students with disabilities scored significantly better with extended time than without, and had differentially greater score gains than did students without disabilities using extended time (in comparison with their standard performance). In contrast, one study (Lovett, 2011) reported that students without disabilities improved scores in a similar manner to students with disabilities. (See Appendix F, Table F-3.)
Effects of the calculator accommodation were explored in three studies. Two studies yielded the conclusion that all students, both with and without disabilities, improved in performance on a math state assessment when using calculator as an accommodation (Engelhard, Fincher, & Domaleski, 2011) or as a modification (Randall, Cheong, & Engelhard, 2011). In addition, item-level analyses of extant state math assessment data demonstrated that the benefit of the calculator use for students with disabilities was complicated by the relative difficulty of the items. On items that had low difficulty, due to requiring lower-level skills such as operation and number sense, students with disabilities benefited when using calculators on these easier items. In contrast, students with disabilities not using calculators performed better on items requiring higher-level skills. (See Appendix F, Table F-4.)
Two studies examined effects of resource guides on assessment performance. In one study, Engelhard and colleagues (2011) conceptualized the resource guide as expressly not providing information that would affect the construct being tested, but instead provided scaffolding supports that could assist students with disabilities with eliminating construct-irrelevant barriers to assessment. The study results indicated that the resource guide did not support an improvement in math assessment performance, either for students with disabilities, or students without disabilities (Engelhard et al., 2011). In the other study, Randall and colleagues (2011) used the term “modification” when referring to the resource guide. The study results yielded that both students with disabilities and students without disabilities performed better when using the resource guide modification than when not using it, with no differential benefit for either group of students (Randall et al., 2011).
Researchers in five studies scrutinized effects of different aggregated sets of accommodations—also called accommodations packages or bundles. These studies used five different aggregations of accommodations, and the effects of their uses during assessment were also divergent. One study (Feldman, Kim, & Elliott, 2011) indicated that use of various accommodations packages individualized to students with disabilities during a reading/language arts achievement test supported score improvements for both students with and without disabilities in an equal manner. Another study’s results yielded that different accommodations packages supported improved scores for students with disabilities (Flowers, Kim, Lewis, & Davis, 2011; Kim, 2012). Flowers and her colleagues (2011) studied effects on test performance of students with disabilities in grades 3-11, when using an oral delivery accommodation via text-to-speech software, in combination with a computerized or print format, on state assessments in reading, science, and mathematics. Examining effect sizes, the researchers found no differing results between or across grade levels, but did note that there were larger effect sizes for reading than for math. In addition, there were small to moderate effect size differences that tended to favor the printed text with human reader accommodations package.
In a study examining sets of accommodations and modifications, termed enhancement packages, Kettler and his colleagues (2012) concluded that the collection of assessment enhancements supported improvements in science assessment performance for both students with disabilities and students without disabilities. Additional analyses indicated that only 7 of the 40 items demonstrated a differential boost, and 11 showed a minimal differential boost. The researchers indicated that some enhancements did not seem to benefit test-takers while others did, making the results unclear overall (Kettler et al., 2012). Finally, Kim (2012) found that when human readers provided the accommodation along with large print, braille, and extended time, students with visual impairments scored better in reading comprehension (in Korean language, in South Korea) than when using these other accommodations without read aloud. (See Table 10 for detail about findings of each study; also, see Appendix F, Table F-5.)
We classified five studies as having investigated the impact of unique accommodations (i.e., accommodations that were the focus of just one study during the two years included in this report). Two studies reported that the unique accommodations did not support improved performance for students with disabilities: the voice input, speech output (VISO) calculator (Bouck, Flanagan, & Joshi, 2011) and American sign language (ASL) presented by an interpreter on digital video (Cawthon, Winton, Garberoglio, & Gobble, 2011). The former study investigated the VISO calculator’s impact on mathematics test behavior, and the latter study inquired about ASL via DVD for test directions and ASL via DVD for test items, and the possibility of different effects on reading and math achievement measures. Two unique accommodations—word processing (Holmes & Silvestri, 2012) and visual chunking representation (VCR; Zhang, Ding, Stegall, & Mo, 2012)—supported improved performance for students with disabilities. The effects of word processing on written products at the postsecondary level, and the literature review, indicated that the outcomes were improved spelling error detection, higher grade point averages, and increased course-completion rates for students with learning disabilities to a level equivalent to that of students without disabilities (Holmes & Silvestri, 2012). Visual chunking’s purpose was to support the visual memory of grade 3 students with math-related disabilities, and geometry assessment scores improved significantly when using VCR (Zhang et al., 2012). Finally, one study (Kettler et al., 2012) provided evidence about three unique enhancements (i.e., shorter item stems, bulleted text, simplified graphics). When examined separately, shorter item stems supported improved performance for all students, and bulleted text and simplified graphics did not support improvements for either students with disabilities or students without disabilities. (See Table 10 for detail about findings of each study; also, see Appendix F, Table F-6.)
Table 10. Summary of Research Findings by Specific Accommodation (n=23)
Accommodation Studied (total) |
Finding |
Number of Studies |
FREQUENTLY-STUDIED |
16 |
|
Oral delivery (5) |
The oral delivery accommodations supported improvement in assessment performance for some but not all students with disabilities or in some but not all testing conditions |
3 |
The oral delivery accommodation supported improved assessment performance and in other ways beyond for students with learning disabilities |
1 |
|
The oral delivery accommodation supported improved assessment performance of all students |
1 |
|
Computer administration (3) |
The computer administration accommodation did not support improved scores for students with disabilities more than the paper assessment format |
2 |
The computer administration accommodation did not support improved assessment performance for all students |
1 |
|
Extended-time (3) |
The extended-time accommodation supported improved scores for students with disabilities |
1 |
The extended-time accommodation supported score improvements differentially for students with disabilities compared to those of students without disabilities |
1 |
|
The extended-time accommodation supported improved scores for all students |
1 |
|
Calculator (2) |
The calculator accommodation supported improved performance for all students |
1 |
The calculator accommodation had mixed results for students with disabilities |
1 |
|
Aggregated set (3) |
Accommodations package supported improved scores for all students in an equal manner (Package: any combination of the following: unlimited time, highlighting test directions, read-aloud directions only, test books in large-print format, student dictation to a human scribe, and allowing frequent rest breaks) |
1 |
An accommodations package supported improved scores for students with disabilities more than another accommodations package (Packages: computerized vs. print format, with oral delivery accommodation via text-to-speech software AND oral delivery accommodation via human reading aloud in combination with large print, braille, and extended time) |
1 |
|
Accommodations package supported improved scores for students with disabilities (Package: oral delivery accommodation via human reader in combination with large print, braille, and extended time) |
1 |
|
UNCOMMON / UNIQUE |
7 |
|
Voice-input, speech output (VISO) calculator |
The unique accommodations did not support improved performance for students with disabilities |
2 |
ASL via DVD for directions and items |
||
Word-processing |
The unique accommodations supported improved performance for students with disabilities |
2 |
Visual chunking representation to support working memory for visual images |
||
Math resource guides |
The unique enhancement did not support improved performance for all -- students with disabilities as well as students without disabilities |
1 |
Shorter item stems |
The unique enhancement supported improvements differentially for a subset of students with disabilities |
1 |
Bulleted text and simplified graphics |
The unique enhancement did not support improvements differentially for a subset of students with disabilities |
1 |
Perceptions about Accommodations
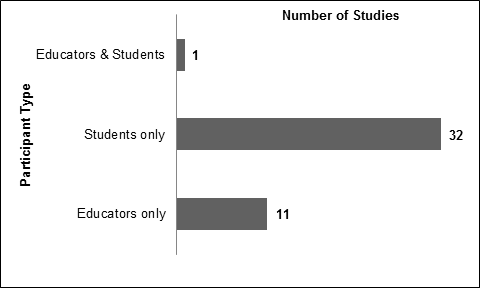
Table 11 shows the set of 25 findings from 24 studies on perceptions about accommodations or modifications. Over one-half of the perceptions studies (n=13) reported on student perceptions only, while a slightly smaller proportion (46%) reported on educator perceptions only; one study (Flowers et al., 2011) examined the perceptions of both educators and students. Studies on student perceptions found that students viewed accommodations or modifications as helping them perform better on assessments (Beddow, 2011; Kettler et al., 2012; Lazarus et al., 2012; Zhang et al., 2012), and supported them while taking assessments by benefiting them in some other way (Bouck et al., 2011; Feldman et al., 2011; Patterson et al., 2011; Shelton, 2012). Three studies (Makeham & Lee, 2012; Schmitt et al., 2012; Schmitt et al., 2011) found that there were conflicting views among student participants about unique accommodations, such as the iPod aural presentation and the “reading pen.” Some students indicated that using an iPod to access test items was beneficial and supported understanding through intonation and pacing; others indicated that this unique oral-delivery medium provided little or no benefit (Makeham & Lee, 2012). For the reading pen, some indicated that they enjoyed using this tool, and slightly fewer indicated the opposite. Each study had only three participants. Schmitt and colleagues (2012) found a pattern in student perception: the least-skilled test-taker expressed the least satisfaction from using the reading pen. Finally, two studies (Bolt et al., 2011; Kim, 2012) observed that students preferred some accommodations over others. For example, students with visual impairments preferred to use oral delivery accommodations along with braille or magnification rather than using only braille or magnification; alternately, students without disabilities predominantly preferred not to use oral delivery because their reading speed was quicker than the human reader’s speed (Kim, 2012).
The studies on educators’ perceptions of accommodations or modifications predominantly found that these enhancements to assessments were beneficial to student test-takers’ performance (Ihori, 2012; Leyser, Greenberger, Sharoni, & Vogel, 2011; Lipscomb, 2012) and to students’ motivation and endurance (Hodgson et al., 2012). Only one study (Meadows, 2012) indicated that some educators had less than favorable attitudes about accommodations. Meadows found that educators with less than a Master’s degree credentials and little teaching experience had less positive and supportive attitudes toward using assessment accommodations than other educators. Four studies reported about educators’ knowledge of and familiarity with accommodations. Three of these studies (Phillips et al., 2012; Zhou et al., 2012; Zhou et al., 2011) indicated a wide continuum of knowledge and familiarity among study participants in each study, including little or no certainty about their capabilities and relatively high degrees of confidence in their capabilities. In contrast, one study (Davis, 2011) yielded a narrower range of perceived knowledge of accommodations, in that participants reported only moderate to high levels of knowledge, with no participants having little or no accommodations knowledge. The researchers identified various factors mitigating knowledge and familiarity: depending on the accommodations categories (Davis, 2011) or the specific accommodations (Zhou et al., 2011), on the application of accommodations —such as instruction or assessment (Zhou et al., 2012), and on the number of instances of providing accommodations to students in an online class format (Phillips et al., 2012). The finding of perceptions from both the students’ and educators’ perspectives asserted that students preferred the accommodations package of computerized format with text-to-speech software over the package of printed text format with human reader; nevertheless, the assessment results did not support better performance using that package (Flowers et al., 2011). (See Appendix F, Table F-7 for more detailed explanation of findings of each study.)
Table 11. Summary of Research Findings on Perceptions about Accommodations (n=24)
Study Findings |
Number of Studies |
Students |
13 |
Students indicated that using accommodations or modifications benefited them in terms of performance score |
4 |
Students indicated that using accommodations benefited them beyond performance score improvements |
4 |
Student perceptions were mixed about the accommodations studied |
3 |
Students expressed a preference for one accommodation over one or more others |
2 |
Educators |
11 |
Educators had similarly positive or supportive attitudes about accommodations or modifications |
3 |
Educators had varying degrees of positive or supportive attitudes about accommodations or modifications |
3 |
Educators indicated that they had various levels of familiarity or knowledge about accommodations |
3 |
Educators indicated that using accommodations benefited students beyond performance score improvements |
1 |
Educators indicated that they had moderate to high levels of knowledge about accommodations |
1 |
Educators and Students |
1 |
Participant groups had similar perspectives about accommodations provided |
1 |
Implementation and Use of Accommodations
Table 12 displays a summary of the 13 studies that reported 13 findings on incidence of accommodations use and implementation-related matters. The nature and outcomes of this set of studies were divergent overall, yet we identified some commonalities. In a few studies (Davis, 2011; Ihori, 2012, Phillips et al., 2012), researchers noted that implementation challenges and atypical use patterns affected accommodations practices. For instance, about 20% of postsecondary faculty participants expressed disagreement with the practice of providing specific response accommodations for students with ADHD (Ihori, 2012), and implementation barriers and facilitators were associated with training as well as educators’ demographics and grade levels of instruction (Davis, 2011). Researchers of three studies (Fox, 2012; Kim, 2011; Smith & Amato, 2012) reported that students with visual impairments were typically provided large print and extended-time accommodations, among others, on reading assessments. Fox (2012) added that other popular accommodations for this group of students with disabilities were small group and individual or separate room settings, and Smith and Amato (2012) clarified that most states also offered lighting adjustment as an accommodation.
In contrast with the previous report which noted that five studies observed that the most common accommodation for students with disabilities was small group administration, the current set of studies had a consensus of only two studies indicating that the most common accommodation for students with disabilities was extended time (Bolt, Decker, Lloyd, & Morlock, 2011; Lovett, 2011). Two studies (Hodgson et al., 2012; Holmes & Silvestri, 2012) elaborated implementation variations that oral-delivery accommodations have had, including co-occurring accommodations offered in combination with oral delivery, the considerations of providing the accommodation during math assessments (Hodgson et al., 2012), and the functions that text-to-speech software can offer during reading and writing assessments (Holmes & Silvestri, 2012). Individual findings were also provided in three other studies (Shinn & Ofiesh, 2012; Cawthon, 2011), including that students with hearing impairments are most often provided sign language and extended-time (Cawthon, 2011). (See Appendix F, Table F-8 for more detailed explanation of findings of each study.)
Table 12. Summary of Research Findings on the Implementation of Accommodations (n=13)
Study Findings |
Number of Studies |
Implementation challenges and atypical use patterns affected accommodations practices |
3 |
Common accommodations for students with visual impairments on reading included large print and braille and extended-time |
3 |
The most common accommodation provided to students with disabilities was extended-time |
2 |
The oral delivery accommodation has had variations in its implementation |
2 |
Various factors complicated the provision of accommodations to students at the postsecondary level |
1 |
Common accommodations for students with hearing impairments included sign language interpretation and extra time |
1 |
Accommodations use patterns differed among students with visual impairments |
1 |
In Table 13, we report on the seven studies providing seven findings about academic construct validity when accommodations were used on state assessments. Two studies resulted in there being no effect of the accommodation on academic construct for reading (Posey & Henderson, 2012) and for reading, science, and mathematics (Flowers et al., 2011). Posey and Henderson (2012) reported that students with visual impairments using contracted braille performed similarly to students without disabilities not using accommodations. Also, when comparing a newer computerized test using text-to-speech software to the print format using a human reader, Flowers and colleagues (2011) determined through differential item functioning (DIF) analyses that, despite various differences on some items, there were no patterns showing that either format condition was favored more frequently than the other. Another study (Lovett, 2011) yielded an opposite result: extended time was shown in this review of the literature to have changed the meaning of students’ assessment performance. Further, item-level analyses using two different analysis approaches were conducted in another study (Randall, Cheong, & Engelhard, 2011). Randall and colleagues found that two problem-solving items included in a group of 10 items functioned differently under certain conditions. One problem-solving item was differentially more difficult for students with disabilities than for students without disabilities when presented without modifications, yet it was easier for students with disabilities when using the calculator modification. The other problem-solving item was found to be differentially easier for students without disabilities than for students with disabilities both with the calculator modification and with no modifications; the statistical significance of this finding differed between analysis approaches.
Two studies (Cho et al., 2012; Scarpati, Wells, Lewis, & Jirka, 2011) addressed the nuances of validity research, noting that various factors can complicate research results. Cho and colleagues (2012) reported that an accommodations package of read aloud, frequent breaks, and separate quiet setting improved scores for students with disabilities on some specific items, yet that students’ ability levels affected the degree of benefit from the accommodations package. Scarpati and colleagues indicated that both the difficulty level of individual items and the ability level ranges of students with disabilities can complicate research results. As Scarpati and colleagues noted, “students using calculators fared better on easier items whereas the nonaccommodated group fared better on more difficult items” (p. 60). Put another way, students using calculators did not derive any benefit from the accommodation when answering more difficult items unless the students also had higher math abilities. (See Appendix F, Table F-9 for more detailed explanation of findings of each study.)
Table 13. Summary of Research Findings Pertaining to Accommodations and Modifications Validity (n=7)
Study Findings |
Number of Studies |
The accommodations did not change the construct |
2 |
The accommodations/modifications changed the construct |
2 |
Construct validity was affected by other factors |
2 |
The manner of scoring changed the construct/s being tested |
1 |
Accommodations in Postsecondary Education
In Table 14, we present a set of 15 findings from 11 studies that examined accommodations provided in educational settings beyond the K-12 school setting. Researchers investigated effects of accommodations on test performance, test-takers’ experiences using accommodations, and faculty members’ perceptions of accommodations, along with implementation practices and uses of accommodations; three studies each reported findings in two of these areas. The five studies (Gregg & Nelson, 2012; Gregg, 2012; Holmes & Silvestri, 2012; Posey & Henderson, 2012; Schmitt et al., 2012) examining accommodation effects included three literature reviews investigating multiple accommodations, as well as a study on contracted braille (Posey & Henderson, 2012) and a study on the reading pen (Schmitt et al., 2012). Gregg (2012) included a review of 32 studies about accommodations on testing for adult basic education learners. Over half (57%) of the studies examined effects of accommodations on university admissions testing. Nearly all (n=29) analyzed impacts of the extended-time accommodation, indicating that people with learning disabilities gained benefits.
The meta-analysis (Gregg & Nelson, 2012) focused on the effects of extended time for people in transition from secondary education, namely postsecondary students and youth with disabilities in work settings. The findings were mixed in the nine studies analyzed, five of which specifically examined effects on university admissions testing. Study participants scored significantly higher in all three studies comparing the extended-time condition to the non-accommodated condition, with medium to large effect sizes. In the two studies comparing performance of youth without disabilities when accommodated and not accommodated, they performed moderately better with accommodations, with small to large effect sizes. According to two studies, the extended-time accommodation provided a differential boost for scores of students with disabilities compared to those of students without disabilities. Additional explanations of the moderator variables, including academic content and type of test, were also reported in detail for those two sets of studies of a sufficient number.
Holmes and Silvestri (2012), in reporting about effects of assistive technology to support postsecondary students with learning disabilities, noted that there have been few studies on academic outcomes; they identified two studies that found that word-processing helped postsecondary students to improve spelling error detection, to increase GPAs, and to complete courses at a rate similar to the rate of students without disabilities. Posey and Henderson (2012) reported that contracted braille work-based reading skills scores for students with visual impairments were equivalent to the scores without the accommodation for students without disabilities. Schmitt and colleagues (2012) reported that the student with the lowest comprehension level demonstrated the most benefit from the reading pen (with digitized voice) from among the three students with reading disabilities, while the other two students’ reading comprehension scores decreased with the use of both forms of the accommodation from their scores without it. Further, the lowest-performing student performed better when using the decoding-only function in comparison to using the decoding and vocabulary definition functions.
The four studies reporting postsecondary faculty perceptions of accommodations (Brockelmann, 2011; Ihori, 2012; Phillips et al., 2012; and Posey & Henderson, 2012) yielded a variety of perspectives and ideas, partly related to their identities and roles, and other setting dynamics. All faculty participants in one study (Brockelmann, 2011) used similar numbers of accommodations during course examinations, but faculty in science, technology, engineering, and math (STEM) programs employed extended-time, individual setting, and exam formats—including read-aloud, dictated, typed, or scribed—more frequently than non-STEM faculty members, and STEM faculty regarded extended time as more effective than non-STEM faculty. Another study (Ihori, 2012) found no significant differences across faculty members in attitudes and beliefs about students with Attention Deficit Hyperactivity Disorder (ADHD), knowledge of legal protections for this group, and willingness to accommodate them, based on institutional setting (i.e., two- or four-year institution, public four-year or private four-year institution).
Phillips and her colleagues (2012) surveyed a subset of faculty at one state public institution, those who teach online courses, and found that only one-third of participants (34%) felt capable of providing accommodations to students with disabilities, and that less than one-fourth (24%) had actually done so before, including extended time, alternate test formats, and assistive technology. The researchers also provided a list of disability categories and accommodations that faculty reported having provided. Posey and Henderson (2012) reported educators’ suggestions for improving testing administration to support adults in basic education to access testing.
Postsecondary students offered their perceptions about accommodations in testing in three studies (Bolt et al., 2011; Makeham & Lee, 2012; Schmitt et al., 2012). The findings of each study were unique, and we found little pattern to them as a group. Bolt and colleagues (2011) reported that the postsecondary students indicated that dictated response to a scribe and word processor with spell check were most helpful to them in the university setting, which were different from the most helpful accommodations during high school, which were extended-time and dictionary, along with dictated response to a scribe. The students varied in their experience of barriers to accommodations use, with about one-third (36%) identifying system-level issues, such as accessing support and selecting appropriate accommodations; on the other hand, about one-third (34%) of students indicated that facilitators of accommodations use were other individuals, and another one-third (32%) credited system-level issues.
Makeham and Lee (2012) indicated that most participants endorsed a strong preference for using oral-delivery accommodations via iPod in comparison with a human reader, and all participants expressed social discomfort, including embarrassment, when offered exam readers. In contrast, half of the participants reported that the iPod accommodation did not benefit them personally, and that any form of oral delivery would be similarly not helpful. Schmitt and colleagues (2012) reported that although the lowest-skilled participant benefited most from using the reading pen, that participant also indicated the lowest degree of satisfaction with the experience. The three studies (Bolt et al., 2011; Holmes & Silvestri, 2012; Shinn & Ofiesh, 2012) also had a diversity of findings. Focusing on 14 accommodations of interest, Bolt and colleagues (2011) indicated that the most frequently-used accommodation for a group of postsecondary students was extended time; they indicated that they also used the accommodation most often in high school.
In a literature review, Holmes and Silvestri (2012) reported that software programs used during computerized assessments in reading provided supports such as text-to-speech, optical character recognition (OCR), and synthesized speech, and computerized writing assessments supported students with speech- or voice-recognition, word prediction, and mind mapping and outlining. Shinn and Ofiesh (2012) described both universal design and accommodations solutions for postsecondary students; to address access demands, they identified font size and text-to-speech software, among others; to address output demands, extended time, word processing and keyboard composition via computer access, and dictation software. Finally, Posey and Henderson (2012) reported that reading skills constructs were essentially the same for students with visual impairments using contracted braille during an assessment as they were for students without disabilities not using accommodations, in that both groups achieved similar results. (See Appendix F, Table F-10 for more detailed explanation of findings of each study.)
Table 14. Summary of Research Findings on Accommodations at the Postsecondary Level
Study Findings |
Number of Studies |
Postsecondary student performance |
4 |
Postsecondary faculty perceptions |
4 |
Postsecondary student perceptions |
3 |
Postsecondary accommodations practices/uses |
3 |
Postsecondary accommodations validity |
1 |
Accommodations by Academic Content Assessments
As in the previous report, we analyzed findings according to academic content area that was the focus of the research. Employing this approach recognized that many accommodations are associated with specific academic content. Some examples of these cases include: calculators for math and science assessments, and word processing for writing assessments or constructed responses on reading, other English language arts (ELA) assessments, and science assessments. Some accommodations, such as oral delivery, may be presented differently depending on the academic construct being assessed.
We present findings for each content area here according to the frequency with which the content areas were identified in the set of 49 research studies reviewed, with most prevalent content areas presented first: 28 findings from 20 studies in mathematics, 26 findings from 15 studies in reading, 9 findings from 3 studies in science, and 5 findings from 4 studies in writing (see Figure 4). Analysis of findings for each content area are the same as those we employed earlier in this report, including the impact of accommodations on assessment performance, perceptions about accommodations, construct validity of accommodated assessments, and matters of implementation and instances of use of accommodations.
Figure 4. Research Findings by Content Area
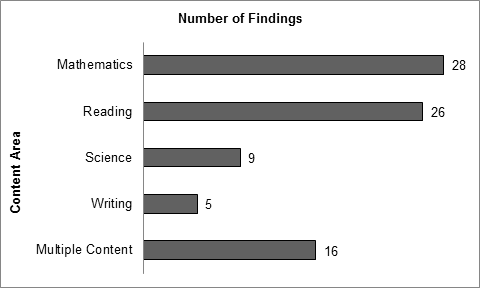
Note: The number of findings does not equate with the number of studies, because many studies reported more than one finding.
Mathematics. Table 15 displays the 28 research findings for accommodations from 20 studies of mathematics assessments, organized according to research type and participant populations then sorted by frequency according to the nature of the individual findings. The findings were diverse, represented by small numbers of studies for each finding, and with little agreement across the findings. Effects of accommodations on performance comprised the most frequent type of finding, with 12 findings from 11 studies. Eleven different effects of accommodations or modifications were reported in these 12 findings; calculator use was the only accommodation reported in more than one finding. The 10 accommodations were: voice-input speech-output calculator, American sign language (ASL), oral delivery, basic functions calculator, computerized format, visual chunking representation, math resource guides, extended time, various and multiple accommodations, and unique accommodations packages; and the one modification was: shortening the item stem.
Of the 12 findings, 7 of them pertained to effects for students with disabilities, and 5 pertained to effects for all students. The most common individual finding, supported by three studies, was that accommodations did not facilitate improved test performance in math for students with disabilities; this was found for voice-input speech-output calculator (Bouck et al., 2011), various and multiple accommodations (Cawthon, Kaye, Lockhart, & Beretvas, 2012), and ASL (Cawthon et al., 2011). Another finding, supported by two studies, indicated that accommodations—including oral delivery (Lazarus et al., 2012) and basic calculator (Scarpati et al., 2011)—had mixed results for students with disabilities, supporting score improvements for some items and not for other items. The last finding supported by more than one study was that accommodations, including basic calculator (Engelhard, Fincher, & Domaleski, 2011) and computerized format with online-delivered accommodations (Patterson et al., 2011), did not support math score improvements for either students with or without disabilities. The remaining five findings were unique to one study each, and not supported by other studies; two of these findings pertained to effects for students with disabilities, and three findings pertained to effects for all students (See Appendix F, Table F-11 for details of the individual study findings.)
Perceptions of accommodations used during math assessments comprised another set of findings; these six findings were identified in six different studies. Although these findings were categorized by whose perceptions were examined—students or educators, or both, most of the findings (n=4) indicated that the various accommodations were perceived as beneficial to students in terms of their math assessment performance (n=2; Beddow, 2011; Lazarus et al., 2012) or had some other benefit beside math score (n=2; Patterson et al., 2011; Hodgson et al., 2012). The other two findings indicated that students expressed preferences for one version of an accommodation (Zhang, Ding, Stegall, & Mo, 2012) or set of accommodations (Flowers et al., 2011) over a different accommodation or set. The enhancements reported in these six perception findings numbered five in all, and included accommodations such as oral delivery (in 2 studies; Lazarus et al., 2012; Hodgson et al., 2012), computerized format with online-delivered accommodations (Patterson et al., 2011), visual chunking representation (Zhang et al., 2012), and computerized format (Flowers et al., 2011), along with various modifications (Beddow, 2011).
Finally, researchers in three studies reported five findings about patterns of use of specific math accommodations and accommodations practices. A finding on use patterns indicated that oral delivery was provided on math assessments to students with disabilities as a group more often than many familiar accommodations, such as breaks and calculators (Flowers et al., 2011). Another use finding was that students with visual impairments most often received large print during math (and reading) assessments, and others were nearly as frequent, like small group or individual and extended time (Fox, 2012). The last use pattern findings distinguished between students with visual impairments who had more and less functional vision. In general, students using more vision for math (and reading) assessment tasks received fewer accommodations, but some students with less vision sometimes received fewer or no accommodations than other low-vision peers (Zebehazy et al., 2012).
The findings on accommodations practices pertained to oral delivery as it was offered during state assessments. Oral delivery was administered in various ways, and implemented differently during math assessments. Oral delivery was provided by human readers to individual students or to small groups with similar pacing needs. Several researchers pointed out that this accommodation was provided in combination with other accommodations due to circumstances (e.g., reading aloud during assessment administration required a separate setting and frequent breaks) rather than as a function of students’ needs on their individual education program (IEP) plans (Flowers et al., 2011). The math accommodations reported in the five studies that included use and practices findings were oral delivery (Flowers et al., 2011), large print, setting based, and extended time (Fox, 2012), and various vision-related accommodations (Zebehazy et al., 2012). (See Appendix F, Table F-11 for more detailed explanation of findings of each study.)
Table 15. Summary of Research Findings on Accommodations in Mathematics Assessments
Study Findings |
Number of Findings |
MATH PERFORMANCE EFFECTS |
12 |
Students with Disabilities |
7 |
Accommodations did not support improved math performance for students with disabilities. |
3 |
Accommodations had mixed results on math assessments for students with disabilities. |
2 |
Accommodations supported improved math performance for students with disabilities. |
1 |
Accommodation set supported improved math performance for students with disabilities more than another accommodation set. |
1 |
All Students |
5 |
Accommodation supported improved math performance for all students. |
2 |
Accommodation did not support improved math performance for either students with disabilities or students without disabilities. |
1 |
Accommodation provided differential benefits in math performance scores of students with disabilities compared to those of students without disabilities. |
1 |
A unique modification supported differential benefits for a subset of students with disabilities who were eligible for modified math assessments. |
1 |
PERCEPTIONS OF ACCOMMODATIONS IN MATH |
6 |
Students/test-takers |
4 |
Students indicated that using accommodations or modifications benefited them in terms of math performance score. |
2 |
Students indicated that using accommodations benefited them beyond math performance score improvements. |
1 |
Students with disabilities expressed preference for using one version of an accommodation over another on the math test. |
1 |
Educators |
1 |
Educators indicated that using accommodations benefited students beyond math performance score improvements. |
1 |
Students/test-takers and Educators |
1 |
Students with disabilities and their teachers indicated students' preference for using one accommodation package over another on the mathematics tests. |
1 |
USES AND PRACTICES ON MATH ASSESSMENTS |
5 |
A common math assessment accommodation provided to students with disabilities was oral delivery. |
1 |
The oral delivery accommodation on math assessments has had variations in its manner of administration. |
1 |
The oral delivery accommodation was implemented differently in math than in other content areas. |
1 |
Common accommodations for students with visual impairments on math assessments included large print, setting-based, and extended-time. |
1 |
This subset of students with visual impairments had unusual accommodations use patterns. |
1 |
MATH ASSESSMENT VALIDITY |
5 |
Construct validity was affected by other factor/s. |
2 |
The accommodations did not change the math construct/s being tested. |
2 |
The accommodations or modifications changed the math construct/s. |
1 |
Note: Some of these 21 studies reported support for more than one category of findings.
Reading. Table 16 presents the 26 findings from 16 studies about accommodations in reading assessments, according to participant population then frequency of findings. Reading accommodation findings were wide-ranging, similar to math findings. The most frequent category of finding was effects of accommodations on reading assessment performance, with 11 findings from 11 studies. Eight enhancements’ effects were reported in these 11 findings, with oral delivery, extended time, and accommodations packages reported in more than one finding each. The nine enhancements included seven accommodations: oral delivery (via reading pen and via text-to-speech software), extended-time (2 studies), ASL, digital format, accommodation packages (3 studies), and various and multiple accommodations (1 study); and two modifications: shortening the item stem and adding graphics. Six of the eleven findings pertained to effects for students with disabilities, and five pertained to effects for all students. Only two findings were supported by more than one study each. The first of these was that accommodations facilitated higher reading performance, found for extended time (Gregg, 2012) and oral delivery (Holmes & Silvestri, 2012). The second finding was that accommodations had mixed results for students with disabilities, found for comparisons of accommodations categories (Cawthon et al., 2012) and for reading pen effects (Schmitt et al., 2012). The remaining seven findings were unique to one study each, and not supported by other studies; two of these findings pertained to effects for students with disabilities, and five findings pertained to effects for all students. (See Appendix F, Table F-12 for details of the individual study findings.)
The next most frequent type of findings was accommodations patterns of use and practices for reading assessments. These seven findings were reported in six different studies.
Use patterns comprised five findings from four studies. Two studies (Fox, 2012; Kim, 2012) supported the general finding that two of the most frequently used accommodations for students with visual impairments on reading assessments were large print and extended time. Each study diverged from the other in finding additional common accommodations: Fox (2012) indicated that other frequent accommodations for this group were small group and individual settings, and Kim (2012) included braille as a frequent accommodation for students with visual impairments in South Korea. Another finding was that one of the most frequently provided reading accommodations for students with disabilities in general was oral delivery using human readers (Flowers et al., 2011). The fourth finding was from a literature review (Gregg, 2012) that indicated that youth with learning disabilities, in the context of post-secondary settings, commonly received presentation accommodations—primarily oral delivery using text to speech or human readers—and timing/scheduling accommodations—primarily extended time, frequent breaks, unlimited time, and testing over multiple days.
The last use pattern finding distinguished between students with visual impairments who had more and less functional vision: in general, students using more vision for reading (and math) assessment tasks received fewer accommodations, but some students with less vision sometimes received fewer or no accommodations than other low-vision peers (Zebehazy et al., 2012). The findings on accommodations practices—supported by two studies (Flowers et al., 2011; Holmes & Silvestri, 2012)—indicated that oral delivery was administered based on circumstances during reading assessments. The contexts diverged in these two studies. Flowers and colleagues (2011) found that, during state reading assessments, this accommodation was provided in combination with other accommodations due to circumstances—oral delivery during assessment administration required a separate setting and frequent breaks—rather than as a function of students’ needs on their individual education program (IEP) plans). Holmes and Silvestri (2012) reported that, in postsecondary reading testing, oral delivery was provided through computer software, which provided functions such as text to speech and optical character recognition (OCR). The reading accommodations reported in the seven use and practices findings were large print and extended time (Fox, 2012; Kim, 2012), small group and individual (Fox, 2012), braille and oral delivery—provided by human readers (Kim, 2012), and other visual, tactile, and response-type accommodations (Zebehazy et al., 2012) for students with visual impairments; oral delivery (Gregg, 2012; Holmes & Silvestri, 2012) for students with learning disabilities; and oral delivery provided by human readers and text-to-speech software (Flowers et al., 2011) for students with disabilities in general.
Researchers in five studies reported five findings about perceptions of accommodations used during reading assessments. These findings were categorized by whose perceptions were examined: students only—three findings, educators only—one finding, and students and educators—one finding. Generally, the findings indicated that accommodations for reading assessments were perceived positively. The most common finding, from two studies (Kim, 2012; Flowers et al., 2011), was that students with disabilities had preferences for accommodations delivered in certain ways, over accommodations delivered in other ways. The accommodations reported in these five perception findings were oral delivery provided by human reader (Kim, 2012) and reading pen (Schmitt et al., 2012), contracted braille (Posey & Henderson, 2012), and computerized format (Flowers et al., 2011), along with accommodations as assigned on students’ IEPs (Feldman et al., 2011).
Finally, three findings were identified in the 2011-2012 body of research that pertained to potential effects that accommodations might have on reading constructs being assessed. All three findings affirmed that accommodations—text-to-speech software for students with reading disabilities (Flowers et al., 2011), contracted braille for students with visual impairments (Posey & Henderson, 2012), and online test modes for students with learning disabilities (Taherbhai et al., 2012)—did not change the reading constructs being tested. (See Appendix F, Table F-12 for more detailed explanation of findings of each study.)
Table 16. Summary of Research Findings on Accommodations in Reading Assessments (26 findings from 16 studies)
Study Findings |
Number of Findings |
READING PERFORMANCE EFFECTS |
11 |
Students with Disabilities |
6 |
Accommodations had mixed results on reading assessments for students with disabilities. |
2 |
Accommodations supported improved reading performance for students with disabilities. |
2 |
Accommodation set supported improved reading performance for students with disabilities more than another accommodation set. |
1 |
Accommodations did not support improved reading performance for students with disabilities. |
1 |
All Students |
5 |
Accommodations package supported improved scores for all students in an equal manner. |
1 |
Accommodation provided differential benefits in reading performance scores of students with disabilities compared to those of students without disabilities. |
1 |
A unique modification supported differential benefits for a subset of students with disabilities who were eligible for modified reading assessments. |
1 |
Accommodations package supported improved scores for students with disabilities. |
1 |
Accommodation did not support improved scores for students with disabilities more than the paper assessment format. |
1 |
USES AND PRACTICES ON READING ASSESSMENTS |
7 |
Common accommodations for students with visual impairments on reading assessments included large print and extended-time. |
2 |
The oral delivery accommodation has had variations in its manner of administration during reading assessments. |
2 |
A common reading assessment accommodation provided to students with disabilities was oral delivery. |
1 |
Common categories of reading assessment accommodations provided to youth with learning disabilities include presentation and timing. |
1 |
This subset of students with visual impairments had unusual accommodations use patterns. |
1 |
PERCEPTIONS OF ACCOMMODATIONS IN READING |
5 |
Students/test-takers only |
3 |
Students expressed a preference for one or more accommodations over one or more others. |
1 |
Students indicated that using accommodations benefited them beyond performance score improvements. |
1 |
Student perceptions were mixed about the accommodations studied. |
1 |
Educators only |
1 |
Educators recommended improvements in test administration instructions in order to ensure appropriate supports including accommodations were provided. |
1 |
Students/test-takers and Educators |
1 |
Students with disabilities and their teachers indicated students' preference for using one accommodation package over another on the reading tests. |
1 |
READING ASSESSMENT VALIDITY |
3 |
The accommodations did not change the reading construct/s being tested. |
3 |
Note: Some of these 16 studies reported support for more than one category of findings.
Science. Table 17 details the 9 findings from three studies concerning science assessment accommodations. These findings were categorized into four types, in descending order of frequency: performance effects, perceptions, accommodations uses and practices, and validity. There was little agreement either across or within categories in the nature of their findings. For instance, of the four findings about accommodations’ effects on performance, two indicated a similar conclusion, and one directly conflicted with that conclusion. An enhancement—shortened item stems—supported improved science assessment performance for all students, both with and without disabilities (Kettler et al., 2012), and an accommodation—oral delivery via recording—supported improvement in one part of a science testing module for all students (Shelton, 2012). Alternately, two other enhancements—bulleted text and simplified graphics—did not support improvements in science assessment scores for all students (Kettler et al., 2012). The fourth effects finding was that a set of accommodations, printed text format with a human reader, supported greater improvements in science scores larger assessment score results than the score changes by the other set, which was a digital format with text-to-speech software (Flowers et al., 2011).
Researchers in three studies reported three findings about perceptions of accommodations used during science assessments. These findings were categorized by whose perceptions were examined: students only—two findings, and students and educators—one finding. Generally, the findings indicated that accommodations for science assessments were perceived positively. A closer review indicated that the findings differed beyond this salient point. One finding was that students expressed the general opinion that enhancements benefited them on assessment performance (Kettler et al., 2012), and another was that students perceived that a unique oral delivery accommodation, in which characters from a virtual environment each “spoke” through pre-recorded audio to test takers, was not distracting to assessment completion (Shelton, 2012). The third finding was that both teachers and students reported that students showed a preference for digital assessment format over printed text format, even though there was no improvement in performance (Flowers et al., 2011).
Another set of findings was accommodations patterns of use and practices during science assessments; these two findings were reported in one study. One finding pertained to use patterns, and one finding was about accommodations practices. Both reported on oral delivery, accompanied by print format and digital format science assessments. Flowers and colleagues (2011) reported that oral delivery using human readers was one of the most frequently provided accommodations, according to state extant data; they contextualized that the frequent use during science assessments is consistent with many states findings. In the same study, and as was observed about oral delivery during math and reading state assessments, the accommodation was administered during science assessments by human readers in combination with other accommodations because reading aloud required a separate setting and frequent breaks rather than as a function of students’ needs on their individual education program (IEP) plans (Flowers et al., 2011).
Finally, one validity finding was observed about the impact of accommodations on science constructs. Flowers and colleagues (2011) reported that text-to-speech software did not change the science constructs being assessed. This was consistent with the same impact noted by these researchers for math constructs and reading constructs. (See Appendix F, Table F-13 for more detailed explanation of findings of each study.)
Table 17. Summary of Research Findings on Accommodations in Science Assessments
Study Findings |
Number of Findings |
SCIENCE PERFORMANCE EFFECTS |
3 |
All Students |
3 |
Enhancement supported improved science performance for all—students with disabilities as well as students without disabilities. |
1 |
Enhancements did not support improved science performance for all—students with disabilities as well as students without disabilities. |
1 |
Accommodation supported improved science assessment performance of all students. |
1 |
Enhancement supported improved science performance for all—students with disabilities as well as students without disabilities. |
1 |
Students with Disabilities |
1 |
Accommodation set supported improved science performance for students with disabilities more than another accommodation set. |
1 |
PERCEPTIONS OF ACCOMMODATIONS IN SCIENCE |
3 |
Students/test-takers |
2 |
Students indicated that using enhancements benefited them in terms of performance score. |
1 |
Students indicated that using accommodations benefited them beyond performance score improvements. |
1 |
Students/test-takers and Educators |
1 |
Students with disabilities and their teachers indicated students' preference for using one accommodation package over another on the science tests. |
1 |
USES AND PRACTICES ON SCIENCE ASSESSMENTS |
2 |
A common accommodation provided to students with disabilities was oral delivery. |
1 |
The oral delivery accommodation has had variations in its manner of administration. |
1 |
SCIENCE ASSESSMENT VALIDITY |
1 |
The accommodations did not change the science construct being tested. |
1 |
Note: Some of these 3 studies reported support for more than one category of findings.
Writing. Table 18 presents the six findings from four studies about accommodations in writing assessments. Writing accommodations findings were categorized into three types: performance effects, uses and practices, and impact on validity. The most frequent findings category was effects of accommodations on writing assessment performance, with three findings from two studies. Mostly, accommodations were reported to have supported improved performance for youth and adults with disabilities, for extended-time (Gregg, 2012) and word-processing (Holmes & Silvestri, 2012). Another finding was that word-processing had inconclusive effects for adults with learning disabilities completing writing tests, according to a literature review (Gregg, 2012). A meta-analysis (Gregg & Nelson, 2012) studying writing performance effects for students with and without disabilities yielded that youth with learning disabilities benefited more from extended-time than youth without disabilities.
The other two findings types were writing accommodations uses and practices and writing accommodations’ effects on assessment validity. Oral delivery had implementation variations in the literature review (Holmes & Silvestri, 2012), in that the text-to-speech software examined had several supports such as speech- or voice-recognition, as well as other writing supports. The researchers also noted that the research literature paid much more attention to other academic content and little to writing specifically. The validity finding detailed that the manner of scoring writing tests and assessments changed the construct of writing (Koutsoftas & Gray, 2012). (See Appendix F, Table F-14 for more detailed explanation of findings of each study.)
Table 18. Summary of Research Findings on Accommodations in Writing Assessments (6 findings from 4 studies)
Study Findings |
Number of Findings |
WRITING PERFORMANCE EFFECTS |
4 |
Students with Disabilities |
3 |
Accommodation supported improved writing performance for students with disabilities |
2 |
Accommodation neither supported nor failed to support improved writing performance scores of students with disabilities |
1 |
All Students |
1 |
Accommodation provided differential benefits in writing performance scores of students with disabilities compared to those of students without disabilities |
1 |
USES AND PRACTICES ON WRITING ASSESSMENTS |
1 |
The oral delivery accommodation has had variations in its implementation |
1 |
WRITING ASSESSMENT VALIDITY |
1 |
The manner of scoring writing tests and assessments changed the writing construct/s being tested |
1 |
Note: Some of these 4 studies reported support for more than one category of findings.
Accommodations in English Language Proficiency Assessments
Although uncommon in the research about accommodations for students with disabilities, one study (Kuti, 2011) examined the performance effects of accommodations on English language proficiency (ELP) assessments. The research participants were English language learners who had disabilities, and the findings described the use of enhancements—in this case, the changes to test directions, presentation formats, timing, and detailed test anxiety-reducing practices. (See Appendix F, Table F-15 for more detailed explanation of findings of the study.)
Limitations and Future Research Directions
The researchers of most of the studies (n=39) in this body of research literature discussed several limitations (n=85) that provided context for the results they reported. Table 19 presents the categories of limitations. We identified all limitations reported in the studies and categorized them as fitting in these categories: methodology, sample characteristics, results, test/test context, and other. We also noted when none were reported by researchers. Of the 39 studies, 30 of them identified more than one category of limitation each; the overall average was about two limitation categories per study.
The most commonly reported category of limitations in 2011-2012 studies was sample characteristics (n=27), which usually referred to the issue that the sample was smaller or narrower than intended or required. This issue yielded a challenge to population representativeness, limiting the generalizability of the findings beyond the research participants. Almost as frequently reported were limitations about results (n=23), when researchers indicated that confounding factors constrained the accuracy or consistency of the data, limiting the confidence readers would hold about the study’s results. Methodology limitations were also fairly common (n=20); these were flaws in research design or practices. Examples of methodology limitations included: students were provided multiple accommodations, limiting strong claims about relative gains supported by individual accommodations, and randomization of assessment accommodations conditions was not possible when using extant data set. Methodology limitations pertained to problems with random selection of participants, when sampling from a population, and random assignment of participants to study conditions. We observed test and test context limitations less commonly, in one-third of the studies (n=13). These types of limitations typically referred to the degree of authenticity of the testing circumstances, especially pertaining to accommodations. Examples included when students’ experience with accommodations was uncertain (Posey & Henderson, 2012), and when the interface between assessments and accommodations was less than ideal (Beddow, 2011; Bouck et al., 2011).
Table 19. Categorized Limitations Identified by Authors
Limitation Category |
Number of Studies1 |
Sample Characteristics |
27 |
Results |
23 |
Methodology |
20 |
Test/Test Context |
13 |
No Limitation Listed |
8 |
Other |
3 |
a Thirty studies included more than one category of limitations, represented in 2 to 4 limitations categories.
The researchers of most of the studies (n=44) in this body of research literature discussed several future research directions (n=90); these provided indicators of lessons they learned as well as their views of the next relevant steps needed to confirm or extend the current studies. Table 20 presents the categories of limitations; we identified all future research directions reported in the studies and categorized them as fitting in these categories: methodology, sample characteristics, results, test/test context, and other, and noted when none were reported by researchers. Of the 44 studies, 32 studies identified more than one future research direction category each; the overall average was about two categories per study.
The most commonly reported category of future research directions in 2011-2012 studies was methodology (n=24), where researchers pointed to additional angles that could be taken to increase the field’s knowledge and understanding about accommodations—often suggesting qualitative methods to uncover meaning beneath findings of the current studies. This category was closely followed by research ideas about test or test context (n=21), where researchers indicated the need for improvements in assessments in terms of accessibility, and the need for deeper understandings of how accommodations might support this goal. Ideas about sample characteristics (n=18) as well as results (n=17) to pursue in future research were also fairly common. Typical directions about sample characteristics were engaging different types of students to affirm or find exceptions to the current studies’ findings. Examples of results-related future research directions included discovering the effects of accommodations beyond the academic content scope of the current studies (Patterson et al., 2011), and to identify factors that might influence assessment scores (Bouck et al., 2011; Schmitt et al., 2011). Finally, the “other” category numbered 10 studies with various unrelated ideas that were outside of the categories we used, such as investigating the effects of professional development activities in changing faculty attitudes (Leyser et al., 2011), developing appropriate procedures to systematize identification of disabilities (Bolt et al., 2011), and analyzing practical benefits of using computerized testing (Patterson et al., 2011).
Table 20. Categorized Areas of Future Research Directions Identified by Authors
Future Research |
Number of Studies1 |
Methodology |
24 |
Test/Test Context |
21 |
Sample Characteristics |
18 |
Results |
17 |
Other |
10 |
No Future Directions Listed |
7 |
a Thirty-two studies listed directions for future research that fit into multiple categories.
Top of Page | Table of Contents
Discussion
Several themes are evident in the research studies published in 2011 and 2012, especially in relation to the research studies from 2009 and 2010, which were reported in the previous NCEO accommodations research review (Rogers et al., 2012). We address here themes of purposes, research designs, assessment types, study participant characteristics, accommodations, academic content areas and research findings associated with them, and study limitations and future research directions. We conclude with several comments on promising trends overall.
Research Purposes
Accommodations research literature has continued to change in its focuses. In comparison with the research purposes for studies in 2009-2010, the purposes for studies in 2011-2012 have seemed to change in priorities. In 2009-2010, the purpose of comparing scores between participant populations related to the effects of accommodations during assessments comprised the largest proportion of studies (at 52%), and the second most frequently-studied purpose was examining perceptions and preferences about accommodations (at 40%). In contrast, in 2011-2012, the order has shifted to 47% of studies inquiring about perceptions and preferences and 44% examining accommodations’ effects on assessment performance. Other purposes have become more prominent in researchers’ attention; namely, research summaries have shifted from 17% of all studies in 2009-2010 to 29% of all studies in 2011-2012, and investigations of test validity were 6% of all studies in 2009-2010 and were 14% in 2011-2012. Incidentally, some purposes have decreased in their proportion of all studies: discussing issues comprised 38% of 2009-2010 studies and 29% of 2011-2012 studies, and evaluating test structure comprised 10% of 2009-2010 studies and 4% of 2011-2012 studies. However, accommodations use and implementation practices were similar in proportion to all studies since they were 21% of 2009-2010 studies and 24% of 2011-2012 studies. Additionally, addressing multiple purposes in each study has continued to be the norm, with nearly 80% of the studies having at least two purposes; in fact, in 2011-2012, about 10% of the studies had four purposes, whereas the maximum number of purposes in the 2009-2010 studies was three. Similar to 2009-2010, many of the studies in 2011-2012 combined the purposes of comparing scores related to the effect of accommodations on assessments and examining perceptions and preferences about accommodations.
Research Types and Data Collection Sources
Half of the research studies in 2011-2012 were quasi-experimental (41%) or experimental (10%). Quasi-experimental and experimental designs comprised a smaller proportion of the studies in 2011-2012 than in 2009-2010. However, the proportion of descriptive quantitative studies was nearly identical (about 20%) across the two time periods. Similarly, the data sources were alike—about two-thirds were primary sources and one-third were secondary sources (such as extant or archival data) in 2009-2010 and in 2011-2012. Further, the categorical data are about evenly split between 2011 and 2012, much like between 2009 and 2010 in the last report. Only one exception was noted to this pattern in 2011-2012: for descriptive quantitative studies, four used secondary data in 2012 and only one used secondary data in 2011.
Data Collection Methods
Comparing 2009-2010 studies’ data with 2011-2012 studies’ data, the collection methods were very similar in frequency of use. The most common method was administering tests, used about 65% of the time in 2009-2010 and almost 60% of the time in 2011-2012. Interviews were put to use in about 14% of the studies, and observation in about 6% of the studies, in both 2009-2010 and 2011-2012. There were only a few, and relatively small, differences in use frequency. The second most frequent method was using surveys, employed about 52% of the time in 2009-2010 and 43% of the time in 2011-2012. Article review, a method engaged for literature reviews and meta-analyses, was used for 6% of the studies in 2009-2010, but for 14% of the studies in 2011-2012. Analysis of state policies was utilized in 2009-2010 but not in 2011-2012. In both sets of research, about 35% of the studies employed more than one method of data collection.
Research Participants
School Level
Accommodations research has varied in the school level of research participants. We use the term “school level” to clarify that we are distinguishing between elementary, middle school, and high school. The apparent pattern of increased analysis of multiple school levels within the same studies, which was mentioned for the 2009-2010 studies, has sustained at about 25% of the studies in 2011-2012. There were only minor differences between the proportions of studies when comparing school levels in 2009-2010 and 2011-2012. About 27% of studies in each time frame engaged elementary student participants. Nearly 38% of studies in 2009-2010, and around 43% of studies in 2011-2012, involved middle school student participants. About 21% of studies in each time frame examined data of high school students. Nearly 15% of studies in 2009-2010, and around 12% of studies in 2011-2012, employed postsecondary participants. Finally, the same proportion of studies (about 25%) did not involve students as participants in 2009-2010 and 2011-2012.
Disability Categories
The disability categories of study participants with disabilities differed when comparing 2009-2010 studies and 2011-2012 studies. The overall proportion of participants in many disability categories decreased. Students with attention-related disabilities (i.e., students identified with attention-deficit hyperactivity disorder, or ADHD) participated in 33% of 2009-2010 studies and 13% of 2011-2012 studies. Similar decreases occurred for participants with physical disabilities, from 27% in 2009-2010 to 10% in 2011-2012 studies, and for participants with multiple disabilities, from 24% in 2009-2010 to 7% in 2011-2012. Additional decreases are reported here in descending order of difference: for participants with intellectual disabilities, from 24% to 10%; for participants with hearing impairments or deafness, from 27% to 17%; and for visual impairments or blindness, from 30% to 23%. Among disability groups, only speech/language impairments received about the same amount of attention, in terms of proportion of studies with participants (20%), in 2009-2010 and 2011-2012. On the other hand, the proportion of studies engaging participants without disabilities increased from 33% in 2009-2010 to 50% in 2011-2012, students with learning disabilities increased from 53% to 57% of relevant studies, and students with autism increased from 15% to 17%. We must note that a number of studies were excluded from these calculations because they did not include individuals using accommodations, whether K-12 students or youth in postsecondary settings, as well as studies in which the disability categories were not reported. The relative number of excluded studies increased from 15 of 48 in 2009-2010 to 17 of 49 in 2011-2012 (see Table 8 for further details). A measure of the decreases in the numbers of studies engaging students in several disabilities categories seems to be related to the decrease in the overall proportion of quasi-experimental and experimental studies (comprising nearly 10% fewer), studies that examined the impact of accommodations on assessment performance for students with various disabilities.
Accommodations
In 2011-2012, research findings highlighted eight specific accommodations, in four of the five accommodation categories. In the previous report, spanning 2009-2010, we discussed findings about 10 specific accommodations in four categories. In the presentation category, the 2009-2010 accommodations were oral delivery, braille, and large print; in contrast, 2011-2012 presentation accommodations were oral delivery and visual chunking representation (VCR). In 2009-2010, equipment/materials accommodations were computer administration, calculator, and American sign language (ASL) recording; in 2011-2012, computer administration, basic (four-function) calculator, voice-input/speech-output (VISO) calculator, and ASL presented via DVD, comprised this category. In 2009-2010, response accommodations were partial scribe, word processing, and virtual manipulative; by contrast, only word-processing was specifically examined in 2011-2012. Finally, the timing/scheduling category was represented by extended time in both 2009-2010 and 2011-2012. Additionally, in 2011-2012, modifications were mentioned, including: math resource guides, shortening of item stems, bulleted text, and simplified graphics.
The effects of specific accommodations during various assessments and testing continued to receive heightened attention through the analyses of primary data sources. Similar to 2009-2010, primary data sources were used in 69% of studies, or 33 out of 48 studies, whereas in 2011-2012, 65% of studies, or 32 of 49 studies, used primary data sources.
Academic Content Areas and Associated Research Findings
Accommodations for mathematics and reading assessments continued to be the most commonly examined in 2011-2012 studies, with the number of studies on reading-related accommodations increasing (over 2009-2010) to the point where research on math and reading produced similar numbers of findings in 2011-2012. Accommodations for science assessments drew attention by researchers to similar degrees, with nine identified research findings for 2011-2012 and seven in 2009-2010; still, the number of studies differed, with seven studies in 2009-2010 and three in 2011-2012. Accommodations for writing assessments were investigated by similar numbers of studies, with three studies in 2009-2010 and four studies in 2011-2012; the number of findings differed, with three findings in 2009-2010 and six findings in 2011-2012. Accommodations for social studies assessments were studied twice in 2009-2010, but not at all in 2011-2012. The 2009-2010 studies that investigated accommodations in multiple content areas numbered 13; there were 7 in 2011-2012 studies. It appeared that the outlying year was 2010, in which nine studies investigated accommodations in multiple content areas; the other three years averaged about four such studies.
When examining the findings by specific accommodation, we observed some interesting comparisons and contrasts for the 2011-2012 studies in relation to the 2009-2010 studies. In 2011-2012, the performance effects of oral delivery (i.e., human reader, text to speech, pre-recorded audio) were more qualified in the sense that the nature of their support for students with disabilities was mostly conditioned on student characteristics or testing conditions; in 2009-2010, in contrast, the studies reported a more generalized and definitive improvement for students with disabilities. A similarity across the two sets of studies is that only one study in each set (Lindstrom, 2010; Lazarus et al., 2012) investigated the performance effects for only math; the rest studied effects on reading assessments—or both reading and math, in the case of Jordan (2009).
Findings on the impact of computer administration were reported in studies published in 2011-2012, but with less frequency and with more problematic outcomes than in 2009-2010. Previously, three of the four relevant studies found that this accommodation benefited students with disabilities—covering the content area of math, or for college coursework in social sciences. In 2011-2012, on the other hand, the three studies indicated that computer administration did not support improved scores for students with disabilities or even for students without disabilities; this finding spanned the content areas of math, reading, and other constructs of language arts.
The calculator accommodation was studied nearly as often in 2011-2012 as it was in 2009-2010—that is, there were three studies in 2009-2010 and two studies in 2011-2012. The findings showed more positive, although nuanced, support for students with disabilities’ performance, in contrast to the 2009-2010 study findings that mostly indicated little benefit for students with disabilities. Both 2011-2012 studies examined the impact of calculators on math assessments, and no studies examined effects on science assessments.
The extended-time accommodation’s effect on assessment performance was investigated in three studies in 2011-2012, and in five studies in 2009-2010. The slight tendency mentioned in 2009-2010 studies toward examining the impact of this accommodation for students in post-secondary education has continued to a similar degree in 2011-2012, with one study (Gregg & Nelson, 2012) presenting a meta-analysis of extended time and its impact for transitioning adolescents with learning disabilities. The findings about the extended-time accommodation in 2009-2010 studies ranged across several content areas; this finding of various content areas has continued in 2011-2012, with academic areas included reading only (Brown et al., 2011) and math, reading and writing (Gregg & Nelson, 2012), and unspecified academic content areas in the third study, a literature review (Lovett, 2011).
Perceptions
In another set of studies from 2011 through 2012, researchers described perceptions about accommodations, as expressed by test-takers and educators, through surveys, focus groups, or interviews. In this timeframe, the studies produced 24 findings, in comparison with 14 in 2009-2010. Students’ perceptions were reported in 13 findings in 2011-2012, and 9 in 2009-2010. Educators’ perceptions were reported in 11 findings in 2011-2012, and 4 in 2009-2010. Through closer examination of student perception findings, we identified in 2011-2012 many more findings indicating that students were more positive about various accommodations, both in relation to assessment performance (n=4) and about additional benefits (n=4); in contrast, we noted in 2009-2010 that students expressed “mixed” perceptions about accommodations (n=2). In addition, student perception findings decreased from five findings about preferences of one version of specific accommodations over another in 2009-2010 to only two studies of this type in 2011-2012.
Educator perceptions about accommodations seem to have shifted from being described as “mixed” (n=3) or positive (n=1) in 2009-2010; instead, in 2011-2012, educator perceptions were reported to be either varying degrees of positive (n=3) or generally positive (n=3). Also, descriptions of educators’ reflections findings increased to four studies in 2011-2012. These studies addressed educators’ reflections on their own knowledge of, and familiarity with, various accommodations. Finally, one study in 2009-2010 (Jordan, 2009) noted that different participant groups—students, teachers, and parents—had various and different views of accommodations; in contrast, a similar study in 2011-2012 (Flowers et al., 2011) reported on similar views of accommodations from both students and educators. When analyzing perceptions findings by academic content area, there have been several changes. In 2009-2010, about 25% of studies about mathematics included accommodations perceptions; the 2011-2012 proportion for math was 29%. In reading, the 2009-2010 perceptions studies accounted for approximately 17% of that content area; the corresponding 2011-2012 proportion was about 31% of studies, and about 20% of all findings. All three 2011-2012 science studies had at least a component about accommodations perceptions, whereas in 2009-2010, only one of seven studies reported these types of findings. Finally, perceptions of writing-related accommodations have remained uninvestigated from 2009 through 2012.
Validity
The increased emphasis on the impact of accommodations on construct validity in the 2009-2010 literature changed in 2011-2012—from 21 findings then to 8 findings. The relevant statistic in 2007-2008 was also eight findings. A contrast was found in the nature of the research findings, in that 2009-2010 studies predominantly indicated that accommodations did not influence academic construct measurement in nearly all of the findings pertaining to validity. Construct validity findings in 2011-2012 studies were more complicated than in 2009-2010: three findings indicated no impact on reading, science, and math constructs; two findings indicated that math construct validity (Randall, Cheong, & Engelhard, 2011) was affected, as were the validities of various academic constructs (Lovett, 2011). Finally, three findings indicated that other factors mediated the relationship between accommodations and the academic constructs being measured on the assessments.
Limitations
The most noticeable difference between the accommodations research of 2009 through 2010 and the research of 2011 through 2012 in terms of researchers’ identification of limitations of their studies is the change in the rank-ordering of the five categories of limitations. The 2011-2012 studies listed in order of frequency were: sample characteristics, results, methodology, test/test context, and other; in contrast, the 2009-2010 studies listed in order of frequency were: methodology, sample characteristics, results, test/test context, and other. Within this observation, the largest difference was that results-type limitations numbered 23 in 2011-2012, compared to only 12 in 2009-2010. There were only 20 methodology-related limitations in 2011-2012, compared to 29 in 2009-2010. Other comparisons of limitations between the timeframes yielded modest differences. In 2011-2012, researchers identified no limitations in 16% of the studies, and we classified limitations as “other” in 6% of the studies. In 2009-2010, researchers identified no limitations in about 21% of the studies, and we classified limitations as “other” in about 13% of the studies. Additionally, researchers noted more types of limitations and future research directions in each study in 2011-2012. In the 2011-2012 studies, 61% of the studies reported more than one limitation category, whereas multiple limitation categories in 2009-2010 were identified in 54% of the studies. Further, the 2009-2010 studies averaged about 2 types of limitations per study, but the 2011-2012 studies averaged 2.1 types of limitations per study. It is difficult to discern whether this difference is a trend, yet it seems that more study researchers reported limitations, and more types of limitations were being reported in those studies that noted them, than in the previous time span studied.
Future Research Directions
When comparing the reporting of future research directions in the 2011-2012 studies and the 2009-2010 studies, there was a change in the rank-ordering of the five categories used to classify them, and also a change in prevalence of studies in the categories. Test and/or test context-related directions were identified in 21 studies in 2011-2012, compared to 15 studies in 2009-2010, and sample characteristics denoted research ideas in 18 studies in 2011-2012, compared to 15 studies in 2009-2010. Also, we observed results-oriented future research directions in 17 studies in 2011-2012, compared to 5 studies in 2009-2010. In 2011-2012, researchers identified no future research directions in 14% of the studies, and we classified limitations as “other” in 20% of the studies. In 2009-2010, researchers identified no limitations in about 19% of the studies, and we classified future research directions as “other” in about 13% of the studies. Additionally, researchers noted more limitations and future research directions in each study in 2011-2012. In the current studies, 65% of the studies reported more than one future research direction, whereas multiple future directions in 2009-2010 were identified in 42% of the studies. Further, the 2009-2010 studies averaged about 1.7 future research direction categories per study, but the 2011-2012 studies averaged 2.1 categories per study. It seems possible that this difference could be a trend because the differences were broader than for the limitations.
Top of Page | Table of Contents
References
Report References
(References in the report to papers that were part of the 2011-2012 accommodations research analysis are not included in this list. They are in the separate list titled: 2011 and 2012 Accommodation References.)
Bayles, M. (2009). Perceptions of educators and parents of the California High School Exit Examination (CAHSEE) requirement for students with disabilities. Dissertation Abstracts International: Section A. Humanities and Social Sciences, 71(04).
Becker, M., Martin, L., Wajeeb, E., Ward, J., & Shern, D. (2002). Students with mental illnesses in a university setting: Faculty and student attitudes, beliefs, knowledge, and experiences. Psychiatric Rehabilitation Journal, 25(4), 359-368. doi:10.1037/h0095001
Beddow, P. A., Elliott, S. N., & Kettler, R. J. (2008a). Test Accessibility and Modification Inventory. Nashville, TN: Vanderbilt University. Retrieved from http://peabody.vanderbilt.edu/tami.xml
Beddow, P. A., Elliott, S. N., & Kettler, R. J. (2008b). Test Accessibility and Modification Inventory (TAMI) accessibility rating matrix. Nashville, TN: Vanderbilt University. Retrieved from http://peabody.vanderbilt.edu/docs/pdf/PRO/TAMI_Accessibility_Rating_Matrix.pdf
Beddow, P. A., Elliott, S. N., & Kettler, R. J. (2009a). TAMI Accessibility Rating Matrix. Nashville, TN: Vanderbilt University. Retrieved from http://peabody.vanderbilt.edu/tami.xml
Beddow, P. A., Elliott, S. N., & Kettler, R. J. (2009b). TAMI Accessibility Rating Matrix Technical Supplement. Nashville, TN: Vanderbilt University. Retrieved from http://peabody.vanderbilt.edu/tami.xml
Braun, H., Ragosta, M., & Kaplan, B. (1986). The predictive validity of the Scholastic Aptitude Test for disabled students (ETS Research Report 86-38). New York: College Board.
Brown, J. L., Fishco, V. V., & Hanna, G. (1993). Nelson-Denny Reading Test. Itasca, IL: Riverside Publishing Company.
Brownell, R. (2000a). Expressive One-Word Picture Vocabulary Test-Second edition. Novato, CA: Academic Therapy Publications.
Brownell, R. (2000b). Receptive One-Word Picture Vocabulary Test-Second edition. Novato, CA: Academic Therapy Publications.
Cahalan, C., Mandinach, E., & Camara, W. (2002). Predictive validity of SAT I: Reasoning tests for test takers with learning disabilities and extended time accommodations (College Board Research Report No. 2002-05). New York: College Board.
Camara, W., Copeland, T., & Rothchild, B. (1998). Effects of extended time on the SAT I: Reasoning Test: Score growth for students with learning disabilities (College Board Research Report 98-7). New York: College Board.
CASAS—Comprehensive Adult Student Assessment Systems. (2008). Technical manual for use in the National Reporting System (NRS), Workforce Investment Act, Reading Assessments. San Diego, CA: Author.
Cochran, H. K. (1998, October). Differences in teachers’ attitudes toward inclusive education as measured by the Scale of Teachers’ Attitudes Toward Inclusive Classrooms (STATIC). Paper presented at the annual meeting of the Mid-Western Educational Research Association, Chicago, IL.
Conners, C. K. (1997). Conners’ Rating Scales—Revised. New York: Multi-Health Systems.
Cormier, D. C., Altman, J. R., Shyyan, V., & Thurlow, M. L. (2010). A summary of the research on the effects of test accommodations: 2007-2008 (Technical Report 56). Minneapolis, MN: University of Minnesota, National Center on Educational Outcomes.
CTB/McGraw-Hill. (1997). TerraNova multiple assessment battery. Monterey, CA: Author.
Dollaghan, C., & Campbell, T. F. (1998). Nonword repetition and child language impairment. Journal of Speech, Language, and Hearing Research, 41, 1136-1146.
Education Northwest. (2006). 6 + 1 trait writing. Portland, OR: Author. Retrieved from http://educationnorthwest.org/traits
GED Testing Service. (2010). 2009 GED testing program statistical report. Washington, DC: American Council on Education.
Hoover, H. D., Dunbar, S. B., & Frisbie, D. A. (2001). Iowa Tests of Basic Skills (ITBS) Forms A, B, and C. Rolling Meadows, IL: Riverside.
Johnstone, C. J., Altman, J., Thurlow, M. L., & Thompson, S. J. (2006). A summary of research on the effects of test accommodations: 2002 through 2004 (Technical Report 45). Minneapolis, MN: University of Minnesota, National Center on Educational Outcomes.
Jordan, A. S. (2009). Appropriate accommodations for individual needs allowable by state guidelines. Dissertation Abstracts International: Section A. Humanities and Social Sciences, 70(10).
Ketelhut, D. (2007). The impact of student self-efficacy on scientific inquiry skills: An exploratory investigation in River City, a multi-user virtual environment. Journal of Science Education & Technology, 16(1), 99-111. doi:10.1007/s10956-006-9038-y
Metritech, Inc. (2007). Assessing Comprehension and Communication in English Test (ACCESS) for ELLs. Champaign, IL: Author.
Mitchell, R. E., Qi, S., & Traxler, C. B. (2007). Stanford Achievement Test, 10th Edition. National performance norms for deaf and hard of hearing students: A technical report. Unpublished manuscript, Gallaudet Research Institute, Gallaudet University, Washington, DC.
Murray, C., Wren, C. T., & Keys, C. (2008). University faculty perceptions of students with learning disabilities: Correlates and group differences. Learning Disability Quarterly, 31(3), 95-113. doi: 10.2307/25474642
National Assessment of Educational Progress (2005). NAEP sample items. Retrieved from: http://nces.ed.gov/nationsreportcard/about/naeptools.asp
ReadingPen Advanced Edition [Apparatus]. (2006). Westford, MA: Wizcom Technologies.
Rogers, C. M., Christian, E. M., & Thurlow, M. L. (2012). A summary of the research on the effects of test accommodations: 2009-2010 (Technical Report 65). Minneapolis, MN: University of Minnesota, National Center on Educational Outcomes. Retrieved from http://www.cehd.umn.edu/NCEO/OnlinePubs/Tech65/default.htm
Semel, E., Wiig, E., & Secord, W. (2003). Clinical Evaluation of Language Fundamentals-fourth edition. San Antonio, TX: The Psychological Corporation.
Smith, D. W., Kelley, P., Maushak, N. J., Griffin-Shirley, N., & Lan, W. Y. (2009). Assistive technology competencies for teachers of students with visual impairments. Journal of Visual Impairment & Blindness, 103(8), 457-469. Retrieved from http://www.afb.org/jvib/jvib_main.asp
Spargo, E. (1989). Timed readings in literature. Providence, RI: Jamestown.
Thompson, S., Blount, A., & Thurlow, M. (2002). A summary of research on the effects of test accommodations: 1999 through 2001 (Technical Report 34). Minneapolis, MN: University of Minnesota, National Center on Educational Outcomes. Retrieved from http://education.umn.edu/NCEO/OnlinePubs/Technical34.htm
Wagner, M., Marder, C., Blackorby, J., Cameto, R., Newman, L., Levine, P., & Davies-Mercier, E. (with Chorost, M., Garza, N., Guzman, A., & Sumi, C.). (2003). The achievements of youth with disabilities during secondary school. A report from the National Longitudinal Transition Study-2 (NLST2). Menlo Park, CA: SRI International. Retrieved from http://www.nlts2.org/reports/2003_11/nlts2_report_2003_11_complete.pdf
Wechsler, D. (1997). Wechsler Adult Intelligence Scale-third edition administration and scoring manual. San Antonio, TX: The Psychological Corporation.
Wechsler, D. (1997). Wechsler Memory Scale-third edition. Austin, TX: Pro-Ed.
Wechsler, D. (2002). Wechsler Individual Achievement Test-second edition. San Antonio, TX: The Psychological Corporation.
Wechsler, D. (2003). Wechsler Intelligence Scale for Children-fourth edition. San Antonio, TX: The Psychological Corporation.
Wiederholt, J. L., & Bryant, B. R. (2001). Gray Oral Reading Test-fourth edition. Austin, TX: Pro-Ed.
Woodcock, R. W., Mather, N., & McGrew, K. S. (2001). Woodcock-Johnson-Third edition tests of achievement. Itasca, IL: Riverside.
Zenisky, A. L., & Sireci, S. G. (2007). A summary of the research on the effects of test accommodations: 2005-2006 (Technical Report 47). Minneapolis, MN: University of Minnesota, National Center on Educational Outcomes. Retrieved from http://www.cehd.umn.edu/NCEO/OnlinePubs/Tech47/default.html
2011 and 2012 Accommodation References
2011
Abedi, J., Leon, S., Kao, J., Bayley, R., Ewers, N., Herman, J., & Mundhenk, K. (2011). Accessible reading assessments for students with disabilities: The role of cognitive, grammatical, lexical, and textual/visual features. (CRESST Report No. 785). Los Angeles: National Center for Research on Evaluation, Standards, and Student Testing. Retrieved from www.cse.ucla.edu/products/reports/R785.pdf
Beddow, P. A. (2011). Effects of testing accommodations and item modifications on students’ performance: An experimental investigation of test accessibility strategies. Dissertation Abstracts International: Section A. Humanities and Social Sciences, 72(12). Retrieved from
http://etd.library.vanderbilt.edu/available/etd-02092011-230046/unrestricted/Beddow.pdf
Bolt, S. E., Decker, D. M., Lloyd, M., & Morlock, L. (2011). Students’ perceptions of accommodations in high school and college. Career Development for Exceptional Individuals, 34(3), 165-175. doi:10.1177/0885728811415098
Bouck, E. C., Flanagan, S., & Joshi, G. S. (2011). Speaking math—A voice input, speech output calculator for students with visual impairments. Journal of Special Education Technology, 26(4), 1-14. Retrieved from http://www.tamcec.org/jset-index/speaking-math-%25E2%2580%2593-a-voice-input-speech-output-calculator-for-students-with-visual-impairments/
Brockelmann, K. (2011). Faculty members’ ratings of the effectiveness of academic strategies for university students with psychiatric disabilities. Journal of Postsecondary Education and Disability, 24(1), 43-52. Retrieved from http://ahead.org/publications/jped/vol_24
Brown, T. E., Reichel, P. C., & Quinlan, D. M. (2011). Extended time improves reading comprehension test scores for adolescents with ADHD. Open Journal of Psychiatry, 1(3), 79-87. doi:10.4236/jsemat.2011.13012
Cawthon, S. W. (2011). Making decisions about assessment practices for students who are deaf or hard of hearing. Remedial and Special Education, 32(1) 4-21. doi:10.1177/0741932509355950
Cawthon, S. W., Winton, S. M., Garberoglio, C. L., & Gobble, M. E. (2011). The effects of American sign language as an assessment accommodation for students who are deaf or hard of hearing. Journal of Deaf Studies and Deaf Education, 16(2), 198-211. doi:10.1093/deafed/enq053
Davis, J. E. (2011). Secondary education teachers’ perceptions related to their knowledge and effectiveness of accommodations for students with mild disabilities. Dissertation Abstracts International: Section A. Humanities and Social Sciences, 72(10). Retrieved from http://search.proquest.com/docview/884226584
Engelhard, G., Jr., Fincher, M., & Domaleski, C. S. (2011). Mathematics performance of students with and without disabilities under accommodated conditions using resource guides and calculators on high stakes tests. Applied Measurement in Education, 24(1), 22-38. doi:10.1080/08957347.2010.485975
Feldman, E., Kim, J., & Elliott, S. N. (2011). The effects of accommodations on adolescents’ self-efficacy and test performance. The Journal of Special Education, 45(2), 77-88. doi:10.1177/0022466909353791
Flowers, C., Kim, D. H., Lewis, P., & Davis, V. C. (2011). A comparison of computer-based testing and pencil-and-paper testing for students with a read-aloud accommodation. Journal of Special Education Technology, 26(1), 1-12. Retrieved from http://www.tamcec.org/jset/
Kettler, R. J., Rodriguez, M. C., Bolt, D. M., Elliott, S. N., Beddow, P. A., & Kurz, A. (2011). Modified multiple-choice items for alternate assessments: Reliability, difficulty, and differential boost. Applied Measurement in Education, 24(3), 210-234. doi:10.1080/08957347.2011.580620
Kuti, L. M. (2011). Accommodations for English language learners with disabilities in federally-mandated statewide English language proficiency assessment. Dissertation Abstracts International: Section A. Humanities and Social Sciences, 72(11). Retrieved from http://search.proquest.com/docview/888048530
Leyser, Y., Greenberger, L., Sharoni, V., & Vogel, G. (2011). Students with disabilities in teacher education: Changes in faculty attitudes toward accommodations over ten years. International Journal of Special Education, 26(1), 162-174. Retrieved from
http://www.internationalsped.com/documents/16%202011%20No1%20Disabilities%20in%20Tchr%20Ed%20Leyser%20et%20al1.doc
Lovett, B. J. (2011). Extended time testing accommodations: What does the research say? NASP Communique, 39(8), 14-15. Retrieved from http://www.nasponline.org/publications/cq/39/8/pdf/CQ_39_8.pdf
Patterson, M. B., Higgins, J., Bozman, M., & Katz, M. (2011). Transitioning the GED mathematics test to computer with and without accommodations: A pilot project. Adult Basic Education and Literacy Journal, 5(2), 67-73. Retrieved from http://www.coabe.org/html/abeljournal.html
Randall, J., Cheong, Y. F., & Engelhard, G. J. (2011). Using explanatory item response theory modeling to investigate context effects of differential item functioning for students with disabilities. Educational and Psychological Measurement, 71(1), 129-147. doi:10.1177/0013164410391577
Scarpati, S. E., Wells, C. S., Lewis, C., & Jirka, S. (2011). Accommodations and item-level analyses using mixture differential item functioning models. The Journal of Special Education, 45(1), 54-62. doi:10.1177/0022466909350224
Schmitt, A. J., McCallum, E., Rubinic, D., & Hawkins, R. (2011). Reading pen decoding and vocabulary accommodations: Impact on student comprehension accuracy and rate. Journal of Evidence-Based Practices for Schools, 12(2) 223-240. Retrieved from https://rowman.com/page/je
Zhou, L., Parker, A. T., Smith, D. W., & Griffin-Shirley, N. (2011). Assistive technology for students with visual impairments: Challenges and needs in teachers’ preparation programs and practice. Journal of Visual Impairment & Blindness, 105(4), 197-210. Retrieved from http://www.afb.org/jvib/jvib_main.asp
2012
Alt, M., & Moreno, M. H. (2012). The effect of test presentation on children with autism spectrum disorders and neurotypical peers. Language, Speech, and Hearing Services in Schools, 43(2), 121-131. doi:10.1044/0161-1461(2011/10-0092)
Cawthon, S. W., Kaye, A. D., Lockhart, L. L., & Beretvas, S. N. (2012). Effects of linguistic complexity and accommodations on estimates of ability for students with learning disabilities. Journal of School Psychology, 50(3), 293-316. doi:10.1016/j.jsp.2012.01.002
Cho, H. J., Lee, J., & Kingston, N. (2012). Examining the effectiveness of test accommodation using DIF and a mixture IRT model. Applied Measurement in Education, 25(4), 281-304. doi:10.1080/08957347.2012.714682
Fox, L. A. (2012). Performance of students with visual impairments on high-stakes tests: A Pennsylvania report card. Dissertation Abstracts International: Section A. Humanities and Social Sciences, 74(03). Retrieved from http://d-scholarship.pitt.edu/13954/1/foxla_etdPitt2012.3.pdf
Gregg, N. (2012). Increasing access to learning for the adult basic education learner with learning disabilities: Evidence-based accommodation research. Journal of Learning Disabilities, 45(1), 47-63. doi:10.1177/0022219411426855
Gregg, N., & Nelson, J. M. (2012). Meta-analysis on the effectiveness of extra time as a test accommodation for transitioning adolescents with learning disabilities: More questions than answers. Journal of Learning Disabilities, 45(2), 128-138. doi:10.1177/0022219409355484
Hodgson, J. R., Lazarus, S. S., Price, L. M., Altman, J. R., & Thurlow, M. L. (2012). Test administrators’ perspectives on the use of the read aloud accommodation in math on state tests for accountability. (Technical Report 66). Minneapolis, MN: University of Minnesota, National Center on Educational Outcomes. Retrieved from http://www.cehd.umn.edu/NCEO/OnlinePubs/Tech66/TechnicalReport66.pdf
Holmes, A., & Silvestri, R. (2012). Assistive technology use by students with LD in postsecondary education: A case of application before investigation? Canadian Journal of School Psychology, 27(1), 81-97. doi:10.1177/0829573512437018
Ihori, D. K. (2012). Postsecondary faculty attitudes, beliefs, practices, and knowledge regarding students with ADHD: A comparative analysis of two-year and four-year institutions. Dissertation Abstracts International: Section A. Humanities and Social Sciences, 73(11). Retrieved from http://search.proquest.com.ezp2.lib.umn.edu/docview/1027593732
Kettler, R. J., Dickenson, T. S., Bennett, H. L., Morgan, G. B., Gilmore, J. A., Beddow, P. A., Swaffield, S., Turner, L., Herrera, B., Turner, C., & Palmer, P. W. (2012). Enhancing the accessibility of high school science tests: A multistate experiment. Exceptional Children, 79(1), 91-106. Retrieved from http://www.highbeam.com/doc/1G1-301555733.html
Kim, J. S. (2012). The effect of “read-aloud” as a test accommodation for students with visual impairments in South Korea. Journal of Visual Impairment & Blindness, 106(6), 356-361. Retrieved from http://www.afb.org/jvib/jvib_main.asp
Koutsoftas, A. D., & Gray, S. (2012). Comparison of narrative and expository writing in students with and without language-learning disabilities. Language, Speech, and Hearing Services in Schools, 43(4), 395-409. doi:10.1044/0161-1461(2012/11-0018)
Lazarus, S. S., Thurlow, M. L., Rieke, R., Halpin, D., & Dillon, T. (2012). Using cognitive labs to evaluate student experiences with the read aloud accommodation in math. (Technical Report 67). Minneapolis, MN: University of Minnesota, National Center on Educational Outcomes. Retrieved from http://www.cehd.umn.edu/NCEO/OnlinePubs/Tech67/TechnicalReport67.pdf
Lipscomb, T. T. (2012). Teachers’ perceptions regarding the effectiveness of accommodations for students with specific learning disabilities. Dissertation Abstracts International: Section A. Humanities and Social Sciences, 73(08). Retrieved from http://search.proquest.com/docview/1009071837
Makeham, S., & Lee, C. (2012). Making the aural presentation of examination papers student friendly: An alternative to a reader in examinations. Assessment & Evaluation in Higher Education, 37(2), 237-243. doi:10.1080/02602938.2010.527915
Meadows, M. P. (2012). Teacher attitudes toward the use of accommodations in the classroom and on standardized tests. Dissertation Abstracts International: Section A. Humanities and Social Sciences, 73(10). Retrieved from http://search.proquest.com.ezp2.lib.umn.edu/docview/1021724385
Phillips, A., Terras, K., Swinney, L., & Schneweis, C. (2012). Online disability accommodations: Faculty experiences at one public university. Journal of Postsecondary Education and Disability, 25(4), 331-344. Retrieved from http://ahead.org/uploads/publications/JPED/jped25_4/JPED25_4.pdf#page=61
Posey, V., & Henderson, B. (2012). Comprehensive Adult Student Assessment Systems braille reading assessment: An exploratory study. Journal of Visual Impairment & Blindness, 106(8), 488-499. Retrieved from http://www.afb.org/jvib/jvib_main.asp
Qi, S., & Mitchell, R. E. (2012). Large-scale academic achievement testing of deaf and hard-of-hearing students: Past, present, and future. Journal of Deaf Studies and Deaf Education, 17(1), 1-18. doi:10.1093/deafed/enr028
Schmitt, A. J., McCallum, E., Hennessey, J., Lovelace, T., & Hawkins, R. O. (2012). Use of reading pen assistive technology to accommodate post-secondary students with reading disabilities. Assistive Technology, 24(4), 229-239. doi:10.1080/10400435.2012.659956
Shelton, A. (2012). Comparing the performance and preference of students experiencing a reading aloud accommodation to those who do not on a virtual science assessment. Dissertation Abstracts International: Section A. Humanities and Social Sciences, 73(10). Retrieved from http://search.proquest.com.ezp2.lib.umn.edu/docview/1022482368
Shinn, E., & Ofiesh, N. (2012). Cognitive diversity and the design of classroom tests for all learners. Journal of Postsecondary Education and Disability, 25(3), 227-245. Retrieved from http://ahead.org/publications/jped/vol_25
Smith, D. W., & Amato, S. (2012). Synthesis of available accommodations for students with visual impairments on standardized assessments. Journal of Visual Impairment & Blindness, 106(5), 299-304. Retrieved from Retrieved from http://www.afb.org/jvib/jvib_main.asp
Srivastava, P., & Gray, S. (2012). Computer-based and paper-based reading comprehension in adolescents with typical language development and language-learning disabilities. Language, Speech, and Hearing Services in Schools, 43(4), 424-437. doi:10.1044/0161-1461(2012/10-0108)
Taherbhai, H., Seo, D., & Bowman, T. (2012). Comparison of paper-pencil and online performances of students with learning disabilities. British Educational Research Journal, 38(1), 61-74. doi:10.1080/01411926.2010.526193
Zebehazy, K. T., Zigmond, N., & Zimmerman, G. J. (2012). Performance measurement and accommodation: Students with visual impairments on Pennsylvania’s alternate assessment. Journal of Visual Impairment & Blindness, 106(1), 17-30. Retrieved from http://www.afb.org/jvib/jvib_main.asp
Zhang, D., Ding, Y., Stegall, J., & Mo, L. (2012). The effect of visual-chunking-representation accommodation on geometry testing for students with math disabilities. Learning Disabilities Research & Practice, 27(4), 167-177. doi:10.1111/j.1540-5826.2012.00364.x
Zhou, L., Ajuwon, P. M., Smith, D. W., Griffin-Shirley, N., Parker, A. T., & Okungu, P. (2012). Assistive technology competencies for teachers of students with visual impairments: A national study. Journal of Visual Impairment & Blindness, 106(10), 656-665. Retrieved from http://www.afb.org/jvib/jvib_main.asp
Top of Page | Table of Contents
Appendix A
Research Purposes
Table A-1. Purpose Category: Study or Compare Perceptions of Accommodation Use (n=23)
Author/s |
Stated Research Purpose |
Also |
Beddow (2011) |
Identify test-takers’ perceptions about their testing experiences; also, discern effects of using accommodations and modifications for students who were eligible for participating in state alternate assessments based on modified achievement standards (AA-MASs), when administered mathematics items under grade-level and alternate standards conditions; finally, summarize research findings on the effects of accommodations and/or modifications provided during states’ AA-MASs. |
A-2, A-3 |
Bolt et al. (2011) |
Inquire from postsecondary students with reading and writing disabilities about their experiences of 14 accommodations including 5 forms of read-aloud (including human reader and via various media), dictionary, large-print, extended-time, more frequent breaks, individual setting, small-group setting, dictated response (to scribe or to recording), and word-processor with spell-check; also, uncover from accommodations users about what hindered and facilitated their accommodation use. |
A-5 |
Bouck et al. (2011) |
Investigate the impact of a computer-based voice-input, speech output calculator on test-taking behaviors of students with visual impairments, and the perspectives of these students regarding using the accommodation. |
N/A |
Brockelmann (2011) |
Uncover academic strategies including assessment accommodations that higher education faculty use with students who have psychiatric disabilities, and discern strategy differences of degree and kind between faculty teaching science, technology, engineering, and mathematics (STEM) courses, and faculty who teach courses in other academic disciplines. |
N/A |
Feldman et al. (2011) |
Investigate the possible influence of the factors of test-related anxiety, test-related self-efficacy, motivation to work hard on tests, and positive regard for large-scale achievement tests in general, also, examine the different scoring patterns that students with disabilities and students without disabilities have during reading and language arts achievement assessments. |
A-2 |
Flowers et al. (2011) |
Explore the perspectives of students and educators about the testing experience; discover possible performance variation in an extant data set of students with disabilities using read-aloud on paper-and-pencil and computerized formats; also, clarify whether item difficulty was associated with item format; finally, discern construct validity related to the formats of the assessment. |
A-2, A-6, A-7 |
Hodgson et al. (2012) |
Describe perspectives of special educators regarding read-aloud, including the differing use and implementation with reading versus math assessments, including that math requires more administrator preparation and content knowledge; also, discuss issues regarding additional benefits, beyond access, such as increased endurance and motivation and decreased concentration under some circumstances. |
A-4 |
Ihori (2012) |
Investigate postsecondary faculty perceptions of various accommodations as provided in 2-year and 4-year programs; contextualize this study’s findings with the current research literature; also, discuss issues of youth with attention-deficit hyperactivity disorder (ADHD); finally, report on accommodation knowledge and practices of postsecondary faculty members. |
A-3, A-4, A-5 |
Kettler et al. (2012) |
Report on students’ perceptions of assessment enhancements; compare extant state mathematics assessment data of students with various disabilities and students without disabilities when using presentation accommodations and calculators; also, compare the effects of modifications and accommodations on alternate science (biology) assessment items for students with disabilities who were eligible or not eligible for modified assessment, along with students without disabilities; finally, determine construct validity of the items when using enhancements. |
A-2, A-6, A-7 |
Kim (2012) |
Report about test-takers’ experiences while completing assessment items; also, compare the effects of read-aloud, when offered and not offered, along with large print, braille, and extended-time, for students with and without visual impairments; finally, report on accommodations use for students with visual impairments on Korean reading assessment items in South Korea. |
A-2, A-5 |
Lazarus et al. (2012) |
Inquire about the perspectives of test-takers on their testing accommodation experiences; also, compare the impact of read-aloud on statewide math assessment item scores for students already identified to receive that accommodation. |
A-2 |
Leyser et al. (2011) |
Investigate perceptions of postsecondary faculty about accommodations at two points across a ten-year time span. |
N/A |
Lipscomb (2012) |
Detail demographic differences in perceptions, including regarding accommodations’ effectiveness; also, summarize research literature and this study’s findings in context; finally, report on the experience of general educators and special educators about accommodations typically provided to students with specific learning disabilities. |
A-3, A-4 |
Makeham & Lee (2012) |
Discuss results of test-takers’ perceptions of the trial use of oral delivery via iPod. |
N/A |
Meadows (2012) |
Describe the attitudes and practices of general educators and special educators about assessment and instructional accommodations; also, summarize the research literature on the topic, and report about the current study’s findings in context. |
A-3 |
Patterson et al. (2011) |
Report on participants’ examination experiences; also, investigate the effects of computerized format on General Equivalency Diploma (GED) examination scores of youths and adults with and without disabilities and report on participants’ examination experiences. |
A-2 |
Phillips et al. (2012) |
Seek information from higher education faculty regarding their perspectives about providing online course accommodations, including for examinations; also, discuss issues related to higher education institutions providing access to online coursework opportunities for students with disabilities; finally, discover the current accommodations implementation activities, including detecting variation of resources and skill based on faculty members’ fields and professional experiences. |
A-4, A-5 |
Schmitt et al. (2012) |
Report on users’ perceptions of reading pen benefits, including enjoyment and satisfaction; also, compare comprehension effects of using reading pen as a decoder with using it with additional vocabulary support, for postsecondary students with varying degrees of reading disabilities. |
A-2 |
Schmitt et al. (2011) |
Report on users’ perceptions of reading pen benefits, including helpfulness and enjoyment; also, compare comprehension effects including speed and accuracy of using reading pen as a decoder with using it with additional vocabulary support, for high school students with specific learning disabilities. |
A-2 |
Shelton (2012) |
Report about students’ perceptions of read-aloud and attitudes about content during assessment; compare effects of read-aloud on scores on science assessment from students with and without learning disabilities; also, summarize research findings and this study’s findings in context; finally, analyze item-level effects. |
A-2, A-3, A-6 |
Zhang et al. (2012) |
Report on students’ perceptions of accommodation benefits; also, compare memory effects of using visual chunking representation accommodation on geometry test items for students with math disabilities. |
A-2 |
Zhou et al. (2012) |
Report about the self-perceived knowledge of special educators of students with visual impairments throughout the U.S. about assistive technology; also, discuss the issues about professional development programs regarding supporting assistive technology needs of students with visual impairments. |
A-4 |
Zhou et al. (2011) |
Report about the self-perceived knowledge of Texas special educators of students with visual impairments about assistive technology; also, discuss the issues about professional development programs regarding supporting assistive technology needs of students with visual impairments. |
A-4 |
Table A-2. Purpose Category: Compare Scores from Standard/Nonstandard Administration Conditions (n=21)
Author/s |
Stated Research Purpose |
Also |
Only students with disabilities |
||
Cawthon et al. (2011) |
Compare the impact on reading and math scores between the use of ASL instructions with standard written administration and ASL instructions and items interpreted for students with deafness or hearing impairments. |
N/A |
Cawthon et al. (2012) |
Investigate the differing impact of various types of accommodations on scores on National Assessment of Educational Progress (NAEP) mathematics and reading items for students with learning disabilities; also, analyze linguistic complexity’s effects on item difficulty for students with learning disabilities. |
A-6 |
Flowers et al. (2011) |
Explore the perspectives of students and educators about the testing experience; discover possible performance variation in an extant data set of students with disabilities using read-aloud on paper-and-pencil and computerized formats; also, clarify whether item difficulty was associated with item format; finally, discern construct validity related to the formats of the assessment. |
A-1, A-6, A-7 |
Fox (2012) |
Investigate the differing effects, on state mathematics and reading assessment scores, of accommodations as provided to different grade levels, and cohorts across three years, of the state’s population of students with each disability category—such as students with visual impairments, students with hearing impairments, and students with learning disabilities; also, contextualize these performance results in light of similar studies of accommodations effects for similar students with disabilities; finally, report on accommodations use for and by these students. |
A-4, A-5 |
Kuti (2011) |
Investigate the effects of various accommodations on English language proficiency (ELP) assessment scores for English language learners with disabilities; also, summarize research findings on benefits and limitations of assessment supports across disability groups and language groups; report on the current availability of ELP tests for ELLs with disabilities, and accessibility issues related to addressing students’ unique needs, from educators’ perspectives; finally, analyze data from students with various disabilities who received various accommodations for patterns. |
A-3, A-4, A-5 |
Lazarus et al. (2012) |
Inquire about the perspectives of test-takers on their testing accommodation experiences; also, compare the impact of read-aloud on statewide math assessment item scores for students already identified to receive that accommodation. |
A-1 |
Schmitt et al. (2012) |
Report on users’ perceptions of reading pen benefits, including enjoyment and satisfaction; also, compare comprehension effects of using reading pen as a decoder with using it with additional vocabulary support, for postsecondary students with varying degrees of reading disabilities. |
A-1 |
Schmitt et al. (2011) |
Report on users’ perceptions of reading pen benefits, including helpfulness and enjoyment; also, compare comprehension effects including speed and accuracy of using reading pen as a decoder with using it with additional vocabulary support, for high school students with specific learning disabilities. |
A-1 |
Zebehazy et al. (2012) |
Examine extant reading and mathematics alternate assessment data from students with visual impairments (VI) to compare the varying score results for students with more and less functional vision; also, analyze the score patterns of students with VI to discern the need for the accommodations that they received. |
A-9 |
Zhang et al. (2012) |
Report on students’ perceptions of accommodation benefits; also, compare memory effects of using visual chunking representation accommodation on geometry test items for students with math disabilities. |
A-1 |
Both students with disabilities and students without disabilities |
||
Alt & Moreno (2012) |
Compare receptive and expressive language scores on vocabulary assessments when using paper-based and computer-administered tests, for students with autism spectrum disorders (ASDs) and students with no neurological disabilities; also, detect any differences in behavioral difficulties between administration formats during the test-taking experience. |
A-6 |
Beddow (2011) |
Identify test-takers’ perceptions about their testing experiences; also, discern effects of using accommodations and modifications for students who were eligible for participating in state alternate assessments based on modified achievement standards (AA-MASs), when administered mathematics items under grade-level and alternate standards conditions; finally, summarize research findings on the effects of accommodations and/or modifications provided during states’ AA-MASs. |
A-1, A-3 |
Engelhard et al. (2011) |
Investigate the individual impacts of calculators and resource guides on state mathematics assessment performance extant data from both students with disabilities and students without disabilities. |
N/A |
Feldman et al. (2011) |
Investigate the possible influence of the factors of test-related anxiety, test-related self-efficacy, motivation to work hard on tests, and positive regard for large-scale achievement tests in general; also, examine the different scoring patterns that students with disabilities and students without disabilities have during reading and language arts achievement assessments. |
A-1 |
Kettler et al. (2011) |
Compare the effects of modifications on alternate assessment items for students with disabilities who were eligible or not eligible for modified assessment, along with students without disabilities. |
N/A |
Kettler et al. (2012) |
Report on students’ perceptions of assessment enhancements; compare extant state mathematics assessment data of students with various disabilities and students without disabilities when using presentation accommodations and calculators; also, compare the effects of modifications and accommodations on alternate science (biology) assessment items for students with disabilities who were eligible or not eligible for modified assessment, along with students without disabilities; finally, determine construct validity of the items when using enhancements. |
A-1, A-6, A-7 |
Kim (2012) |
Report about test-takers’ experiences while completing assessment items; also, compare the effects of read-aloud, when offered and not offered, along with large print, braille, and extended-time, for students with and without visual impairments; finally, report on accommodations use for students with visual impairments on Korean reading assessment items in South Korea. |
A-1, A-5 |
Koutsoftas & Gray (2012) |
Compare narrative and expository writing evaluation results of students with language learning disabilities and students without disabilities; also, uncover patterns in assessment results when applying analytic and holistic scoring approaches. |
A-7 |
Patterson et al. (2011) |
Report on participants’ computerized examination experiences; also, investigate the effects of computerized format on General Equivalency Diploma (GED) examination scores of youths and adults with and without disabilities. |
A-1 |
Shelton (2012) |
Report about students’ perceptions of read-aloud and attitudes about content during assessment; compare effects of read-aloud on scores on science assessment from students with and without learning disabilities; also, summarize research findings and this study’s findings in context; finally, analyze item-level effects. |
A-1, A-3, A-6 |
Srivastava & Gray (2012) |
Compare scores of students with learning disabilities and without learning disabilities on reading assessments using nonlinear paper-based text passages and nonlinear computerized text passages. Nonlinear text passages permitted test-takers to determine the order of text reading, and included vocabulary support. |
N/A |
Table A-3. Purpose Category: Summarize Research Literature about Accommodations (n=14)
Author/s |
Stated Research Purpose |
Also |
Beddow (2011) |
Identify test-takers’ perceptions about their enhanced testing experiences; also, discern effects of using accommodations and modifications for students who were eligible for participating in state alternate assessments based on modified achievement Standards (AA-MASs), when administered mathematics items under grade-level and alternate standards conditions; finally, summarize research findings on the effects of accommodations and/or modifications provided during states’ AA-MASs. |
A-1, A-2 |
Davis (2011) |
Summarize research findings on the effects and limitations of accommodations; also, review various accommodations practices issues, including implementation barriers; finally, inquire from secondary general educators about specific knowledge and practices related to many types of accommodations, such as read-aloud in various formats, scribe, breaks, and individual administration. |
A-4, A-5 |
Fox (2012) |
Investigate the differing effects, on state mathematics and reading assessment scores, of accommodations as provided to different grade levels, and cohorts across three years, of the state’s population of students with each disability category—such as students with visual impairments, students with hearing impairments, and students with learning disabilities; also, contextualize these performance results in light of similar studies of accommodations effects for similar students with disabilities; finally, report on accommodations use for and by these students. |
A-2, A-5 |
Gregg (2012) |
Summarize research findings of 32 studies (not all empirical) on the effects of accommodations, most notably extended-time; discuss accommodations issues of students with learning disabilities in late adolescence and young adulthood, including when completing college entrance examinations. |
A-3, A-4 |
Gregg & Nelson (2012) |
Meta-analyze research findings of 9 studies on the effects of the extended-time accommodation on assessment results of youth with learning disabilities, including when completing college entrance examinations; also, discuss assessment accommodations issues of youths with learning disabilities, identified using various disability definitions. |
A-4 |
Holmes & Silvestri (2012) |
Summarize findings of about 20 studies regarding assistive technology’s effects for students with learning disabilities (LD) in postsecondary settings; also, discuss issues regarding avenues of availability of assistive technology (AT) for postsecondary students with disabilities; finally, describe AT practices and use for postsecondary students with disabilities. |
A-4, A-5 |
Ihori (2012) |
Investigate postsecondary faculty perceptions of various accommodations as provided in 2-year and 4-year programs; also, contextualize this study’s findings with the current research literature; discuss issues of youth with attention-deficit hyperactivity disorder (ADHD); finally, report on accommodation knowledge and practices of postsecondary faculty members. |
A-1, A-4, A-5 |
Kuti (2011) |
Investigate the effects of various accommodations on English language proficiency (ELP) assessment scores for English language learners with disabilities; also, summarize research findings on benefits and limitations of assessment supports across disability groups and language groups; report on the current availability of ELP tests for ELLs with disabilities, and accessibility issues related to addressing students’ unique needs, from educators’ perspectives; finally, analyze data from students with various disabilities who received various accommodations for patterns. |
A-2, A-4, A-5 |
Lipscomb (2012) |
Detail demographic differences in perceptions, including regarding accommodations’ effectiveness; also, summarize research literature and this study’s findings in context; finally, report on the experience of general educators and special educators about accommodations typically provided to students with specific learning disabilities. |
A-1, A-4 |
Meadows (2012) |
Describe the attitudes and practices of general educators and special educators about assessment and instructional accommodations; also, summarize the research literature on the topic, and report about the current study’s findings in context. |
A-1 |
Qi & Mitchell (2012) |
Present a longitudinal perspective on developments in accommodations for students with hearing impairments; also, describe issues pertaining to the provision of accommodations to students with deafness and hearing impairments, such as American sign language and modified English; finally, detail accommodations practice and use, especially pertaining to the Stanford Achievement Test for deaf students. |
A-4, A-5 |
Shelton (2012) |
Report about students’ perceptions of read-aloud and attitudes about content during assessment; compare effects of read-aloud on scores on science assessment from students with and without learning disabilities; also, summarize research findings and this study’s findings in context; finally, analyze item-level effects. |
A-1, A-2, A-6 |
Shinn & Ofiesh (2012) |
Present evidence for types of cognitive challenges that a segment of higher education students with disabilities and others has when taking tests, and demonstrate that research literature has identified effective accommodations for students with cognitive difficulties, even beyond identified disability populations; discuss issues related to higher education providing wider access for underserved populations. |
A-4 |
Smith & Amato (2012) |
Present a list of accommodations based on literature on best practices for students with visual impairments; also, report on state-by-state use of accommodations policies and practices. |
A-5 |
Table A-4. Purpose Category: Discuss Issues Related to Accommodations (n=14)
Author/s |
Stated Research Purpose |
Also |
Davis (2011) |
Summarize research findings on the effects and limitations of accommodations; also, review various accommodations practices issues, including implementation barriers; finally, inquire from secondary general educators about specific knowledge and practices related to many types of accommodations, such as read-aloud in various formats, scribe, breaks, and individual administration. |
A-3, A-5 |
Gregg (2012) |
Summarize research findings of 32 studies (not all empirical) on the effects of accommodations, most notably extended-time; also, discuss accommodations issues of students with learning disabilities in late adolescence and young adulthood, including when completing college entrance examinations. |
A-3 |
Gregg & Nelson (2012) |
Meta-analyze research findings of 9 studies on the effects of the extended-time accommodation on assessment results of youth with learning disabilities, including when completing college entrance examinations; also, discuss assessment accommodations issues of youths with learning disabilities, identified using various disability definitions. |
A-3 |
Hodgson et al. (2012) |
Describe perspectives of special educators regarding read-aloud, including the differing use and implementation with reading versus math assessments, including that math requires more administrator preparation and content knowledge; also, discuss issues regarding additional benefits, beyond access, such as increased endurance and motivation and decreased concentration under some circumstances. |
A-1 |
Holmes & Silvestri (2012) |
Summarize findings of about 20 studies regarding assistive technology’s effects for students with learning disabilities (LD) in postsecondary settings; also, discuss issues regarding avenues of availability of assistive technology (AT) for postsecondary students with disabilities; finally, describe AT practices and use for postsecondary students with disabilities. |
A-3, A-5 |
Ihori (2012) |
Investigate postsecondary faculty perceptions of various accommodations as provided in 2-year and 4-year programs; also, contextualize this study’s findings with the current research literature; discuss issues of youth with attention-deficit hyperactivity disorder (ADHD); finally, report on accommodation knowledge and practices of postsecondary faculty members. |
A-1, A-3, A-5 |
Kuti (2011) |
Investigate the effects of various accommodations on English language proficiency (ELP) assessment scores for English language learners with disabilities; also, summarize research findings on benefits and limitations of assessment supports across disability groups and language groups; report on the current availability of ELP tests for ELLs with disabilities, and accessibility issues related to addressing students’ unique needs, from educators’ perspectives; finally, analyze data from students with various disabilities who received various accommodations for patterns. |
A-2, A-3, A-5 |
Lipscomb (2012) |
Detail demographic differences in perceptions, including regarding accommodations’ effectiveness; also, summarize research literature and this study’s findings in context; finally, report on the experience of general educators and special educators about accommodations typically provided to students with specific learning disabilities. |
A-1, A-3 |
Lovett (2011) |
Discuss issues including limitations of using the extended-time accommodation; also, describe practical considerations for using extended-time for students with disabilities. |
A-5 |
Phillips et al. (2012) |
Seek information from higher education faculty regarding their perspectives about providing online course accommodations, including for examinations; also, discuss issues related to higher education institutions providing access to online coursework opportunities for students with disabilities; finally, discover the current accommodations implementation activities, including detecting variation of resources and skill based on faculty members’ fields and professional experiences. |
A-1, A-5 |
Shinn & Ofiesh (2012) |
Present evidence for types of cognitive challenges that a segment of higher education students with disabilities and others has when taking tests, and demonstrate that research literature has identified effective accommodations for students with cognitive difficulties, even beyond identified disability populations; also, discuss issues related to higher education providing wider access for underserved populations. |
A-3 |
Qi & Mitchell (2012) |
Present a longitudinal perspective on developments in accommodations for students with hearing impairments; also, describe issues pertaining to the provision of accommodations to students with deafness and hearing impairments, such as American sign language and modified English; finally, detail accommodations practice and use, especially pertaining to the Stanford Achievement Test for deaf students. |
A-3, A-5 |
Zhou et al. (2012) |
Report about the self-perceived knowledge of special educators of students with visual impairments throughout the U.S. about assistive technology; also, discuss the nature of professional development programs regarding supporting assistive technology needs of students with visual impairments. |
A-1 |
Zhou et al. (2011) |
Report about the self-perceived knowledge of Texas special educators of students with visual impairments about assistive technology; also, discuss the issues about professional development programs regarding supporting assistive technology needs of students with visual impairments. |
A-1 |
Table A-5. Purpose Category: Report on Implementation Practices and Accommodations Use (n=11)
Author/s |
Stated Research Purpose |
Also |
Bolt et al. (2011) |
Inquire from postsecondary students with reading and writing disabilities about their experiences of 14 accommodations including 5 forms of read-aloud (including human reader and provision via various forms of technology), dictionary, large-print, extended-time, more frequent breaks, individual setting, small-group setting, dictated response (to scribe or to recording), and word-processor with spell-check; also, uncover from accommodations users about what hindered and facilitated their accommodation use. |
A-1 |
Cawthon (2011) |
Examine decision-making processes for educators of students with hearing impairments regarding selection of possible accommodations including extended time, test directions interpreted, test items interpreted, student signs response to a scribe, and others. |
N/A |
Davis (2011) |
Summarize research findings on the effects and limitations of accommodations; also, review various accommodations practices issues, including implementation barriers; finally, inquire from secondary general educators about specific knowledge and practices related to many types of accommodations, such as read-aloud in various formats, scribe, breaks, and individual administration. |
A-3, A-4 |
Fox (2012) |
Investigate the differing effects, on state mathematics and reading assessment scores, of accommodations as provided to different grade levels, and cohorts across three years, of the state’s population of students with each disability category—such as students with visual impairments, students with hearing impairments, and students with learning disabilities; also, contextualize these performance results in light of similar studies of accommodations effects for similar students with disabilities; finally, report on accommodations use for and by these students. |
A-2, A-3 |
Holmes & Silvestri (2012) |
Summarize findings of about 20 studies regarding assistive technology’s effects for students with learning disabilities (LD) in postsecondary settings; also, discuss issues regarding avenues of availability of assistive technology (AT) for postsecondary students with disabilities; finally, describe AT practices and use for postsecondary students with disabilities. |
A-3, A-4 |
Ihori (2012) |
Investigate postsecondary faculty perceptions of various accommodations as provided in 2-year and 4-year programs; contextualize this study’s findings with the current research literature; also, discuss issues of youth with attention-deficit hyperactivity disorder (ADHD); finally, report on accommodation knowledge and practices of postsecondary faculty members. |
A-1, A-3, A-4 |
Kim (2012) |
Report about test-takers’ experiences while completing assessment items; also, compare the effects of read-aloud, when offered and not offered, along with large print, braille, and extended-time, for students with and without visual impairments; finally, report on accommodations use for students with visual impairments on Korean reading assessment items in South Korea. |
A-1, A-2 |
Kuti (2011) |
Investigate the effects of various accommodations on English language proficiency (ELP) assessment scores for English language learners with disabilities; also, summarize research findings on benefits and limitations of assessment supports across disability groups and language groups; report on the current availability of ELP tests for ELLs with disabilities, and accessibility issues related to addressing students’ unique needs, from educators’ perspectives; finally, analyze data from students with various disabilities who received various accommodations for patterns. |
A-2, A-3, A-4 |
Lovett (2011) |
Discuss issues including limitations of using the extended-time accommodation; also, describe practical considerations for using extended-time for students with disabilities. |
A-4 |
Phillips et al. (2012) |
Seek information from higher education faculty regarding their perspectives about providing online course accommodations, including for examinations; also, discuss issues related to higher education institutions providing access to online coursework opportunities for students with disabilities; finally, discover the current accommodations implementation activities, including detecting variation of resources and skill based on faculty members’ fields and professional experiences. |
A-1, A-4 |
Qi & Mitchell (2012) |
Present a longitudinal perspective on developments in accommodations for students with hearing impairments; also, describe issues pertaining to the provision of accommodations to students with deafness and hearing impairments, such as American sign language and modified English; finally, detail accommodations practice and use, especially pertaining to the Stanford Achievement Test for deaf students. |
A-3, A-4 |
Smith & Amato (2012) |
Present a list of accommodations based on literature on best practices for students with visual impairments; also, report on a state-by-state view of accommodations policies and practices. |
A-3 |
Table A-6. Purpose Category: Compare Test Items across Assessment Formats (n=11)
Author/s |
Stated Research Purpose |
Also |
Abedi et al. (2011) |
Investigate the role that certain features of reading test items (cognitive, grammatical, lexical, textual/visual) play in leading to these functional differences; also, examine the scoring patterns that students with disabilities and students without disabilities have during reading assessments to determine construct validity. |
A-7 |
Alt & Moreno (2012) |
Compare receptive and expressive language scores on vocabulary assessments when using paper-based and computer-administered tests, for students with autism spectrum disorders (ASDs) and students with no neurological disabilities; also, detect any differences in behavioral difficulties between administration formats during the test-taking experience. |
A-2 |
Cawthon et al. (2012) |
Investigate the differing impact of various types of accommodations on scores on National Assessment of Educational Progress (NAEP) mathematics and reading items for students with learning disabilities; also, analyze linguistic complexity’s effects on item difficulty for students with learning disabilities. |
A-7 |
Cho et al. (2012) |
Using extant data sets, measure whether item characteristics were related to item difficulty for state mathematics assessments; also, discern test validity by analyzing item functioning and whether it was associated with students’ accommodation status (a package of three accommodations: read-aloud, frequent breaks, and separate quiet setting) and other demographic variables. |
A-7 |
Flowers et al. (2011) |
Explore the perspectives of students and educators about the testing experience; discover possible performance variation in an extant data set of students with disabilities using read-aloud on paper-and-pencil and computerized formats; also, clarify whether item difficulty was associated with item format; finally, discern construct validity related to the formats of the assessment. |
A-1, A-2, A-7 |
Kettler et al. (2012) |
Report on students’ perceptions of assessment enhancements; compare extant state mathematics assessment data of students with various disabilities and students without disabilities when using presentation accommodations and calculators; also, compare the effects of modifications and accommodations on alternate science (biology) assessment items for students with disabilities who were eligible or not eligible for modified assessment, along with students without disabilities; finally, determine construct validity of the items when using enhancements. |
A-1, A-2, A-7 |
Posey & Henderson (2012) |
Examine item difficulty of adult education functional reading test items using contracted braille and ascertain item reliability; also, compare scoring patterns of students without disabilities on the test in print format with scoring patterns of students with blindness on the test in braille format to determine construct validity; finally, analyze test features with expert feedback from adult basic education teachers. |
A-7, A-8 |
Randall et al. (2011) |
Comparing two models’ utility (Many-Facet Rasch Model and Hierarchical Generalized Linear Model), analyze state mathematics assessment item scores of students with various disabilities and students without disabilities when using modifications of a basic function calculator and a special resource guide, in order to pinpoint items varying in difficulty based on multiple variables; also, determine construct validity of the items when using modifications under separate conditions. |
A-7 |
Scarpati et al. (2011) |
Compare extant state mathematics assessment data of students with various disabilities using presentation accommodations and calculators and students without disabilities not using accommodations in order to explore differential item functioning; also, ascertain construct validity of the items when using accommodations in various combinations. |
A-7 |
Shelton (2012) |
Report about students’ perceptions of read-aloud and attitudes about content during assessment; compare effects of read-aloud on scores on science assessment from students with and without learning disabilities; also, summarize research findings and this study’s findings in context; finally, analyze item-level effects. |
A-1, A-2, A-3 |
Taherbhai et al. (2012) |
Examine extant data of students with learning disabilities matched by ability level for the degree of impact of the computerized and paper-and-pencil formats of state reading and mathematics modified assessments for students with learning disabilities, at the individual item level and full-test levels; also, ascertain the construct validity of computerized format reading assessment. |
A-7 |
Table A-7. Purpose Category: Investigate Test Validity under Accommodated Conditions (n=7)
Author/s |
Stated Research Purpose |
Also |
Abedi et al. (2011) |
Investigate the role that certain features of reading test items (cognitive, grammatical, lexical, textual/visual) play in leading to these functional differences; also, examine the scoring patterns that students with disabilities and students without disabilities have during reading assessments to determine construct validity. |
A-6 |
Cho et al. (2012) |
Using extant data sets, measure whether item characteristics were related to item difficulty for state mathematics assessments; also, discern test validity by analyzing item functioning and whether it was associated with students’ accommodation status (a package of three accommodations: read-aloud, frequent breaks, and separate quiet setting) and other demographic variables. |
A-6 |
Flowers et al. (2011) |
Explore the perspectives of students and educators about the testing experience; discover possible performance variation in an extant data set of students with disabilities using read-aloud on paper-and-pencil and computerized formats; also, clarify whether item difficulty was associated with item format; finally, discern construct validity related to the formats of the assessment. |
A-1, A-2, A-6 |
Kettler et al. (2012) |
Report on students’ perceptions of assessment enhancements; compare extant state mathematics assessment data of students with various disabilities and students without disabilities when using presentation accommodations and calculators; also, compare the effects of modifications and accommodations on alternate science (biology) assessment items for students with disabilities who were eligible or not eligible for modified assessment, along with students without disabilities; finally, determine construct validity of the items when using enhancements. |
A-1, A-2, A-6 |
Posey & Henderson (2012) |
Examine item difficulty of adult education functional reading test items using contracted braille and ascertain item reliability; also, compare scoring patterns of students without disabilities on the test in print format with scoring patterns of students with blindness on the test in braille format to determine construct validity; finally, analyze test features with expert feedback from adult basic education teachers. |
A-6, A-8 |
Randall et al. (2011) |
Comparing two models’ utility (Many-Facet Rasch Model and Hierarchical Generalized Linear Model), analyze state mathematics assessment item scores of students with various disabilities and students without disabilities when using modifications of a basic function calculator and a special resource guide, in order to pinpoint items varying in difficulty based on multiple variables; determine construct validity of the items when using modifications under separate conditions. |
A-6 |
Scarpati et al. (2011) |
Compare extant state mathematics assessment data of students with various disabilities using presentation accommodations and calculators and students without disabilities not using accommodations in order to explore differential item functioning; also, ascertain construct validity of the items when using accommodations in various combinations. |
A-6 |
Taherbhai et al. (2012) |
Examine extant data of students with learning disabilities matched by ability level for the degree of impact of the computerized and paper-and-pencil formats of state reading and mathematics modified assessments for students with learning disabilities, at the individual item level and full-test levels; also, ascertain the construct validity of computerized format reading assessment. |
A-6 |
Table A-8. Purpose Category: Evaluate Test Structure (n=2)
Author/s |
Stated Research Purpose |
Also |
Koutsoftas & Gray (2012) |
Compare narrative and expository writing evaluation results of students with language learning disabilities and students without disabilities; also, uncover patterns in assessment results when applying analytic and holistic scoring approaches. |
A-1 |
Posey & Henderson (2012) |
Examine adult education functional reading test items using contracted braille for item-level validity; also, analyze test features with expert feedback from adult basic education teachers. |
A-6 |
Table A-9. Purpose Category: Identify Predictors of the Need for Test Accommodation/s (n=2)
Author/s |
Stated Research Purpose |
Also |
Brown et al. (2011) |
Investigate the underlying benefits and specific processes of extended-time regarding reading comprehension skills for adolescents with attention-deficit hyperactivity disorder (ADHD). |
N/A |
Zebehazy et al. (2012) |
Examine extant reading and mathematics alternate assessment data from students with visual impairments (VI) to compare the varying score results for students with more and less functional vision; also, analyze the score patterns of students with VI to discern the need for the accommodations that they received. |
A-1 |
Top of Page | Table of Contents
Appendix B
Research Characteristics
Table B-1. Reference Types, Research Types, Research Designs, Data Collection Sources, and Collection Instruments
| Authors | Reference Type | Research Type |
Research Design | Data Collection Source | Collection Instrument |
Abedi et al. (2011) |
Report |
Quantitative |
Quasi-Experimental |
Secondary |
Test |
Alt & Moreno (2012) |
Journal |
Quantitative |
Quasi-Experimental |
Primary |
Observations, Survey, Test |
Beddow (2011) |
Journal |
Mixed |
Quasi-Experimental |
Primary |
Survey, Test |
Bolt et al. (2011) |
Journal |
Mixed |
Descriptive Quantitative |
Primary |
Survey |
Bouck et al. (2011) |
Journal |
Mixed |
Quasi-Experimental |
Primary |
Interview Protocol, Observations |
Brockelmann (2011) |
Journal |
Quantitative |
Descriptive Quantitative |
Primary |
Survey |
Brown et al. (2011) |
Journal |
Quantitative |
Quasi-Experimental |
Primary |
Test |
Cawthon (2011) |
Journal |
Quantitative |
Quasi-Experimental |
Primary |
Survey |
Cawthon et al. (2012) |
Journal |
Quantitative |
Descriptive Quantitative |
Secondary |
Test |
Cawthon et al. (2011) |
Journal |
Quantitative |
Quasi-Experimental |
Primary |
Survey, Test |
Cho et al. (2012) |
Journal |
Quantitative |
Correlation/ Prediction |
Secondary |
Test |
Davis (2011) |
Dissertation |
Mixed |
Descriptive Quantitative |
Primary |
Survey |
Engelhard et al. (2011) |
Journal |
Quantitative |
Quasi-Experimental |
Primary |
Test |
Feldman et al. (2011) |
Journal |
Quantitative |
Quasi-Experimental |
Primary |
Survey, Test |
Flowers et al. (2011) |
Journal |
Quantitative |
Quasi-Experimental |
Secondary |
Survey, Test |
Fox (2012) |
Dissertation |
Quantitative |
Quasi-Experimental |
Secondary |
Test |
Gregg (2012) |
Journal |
Quantitative |
Descriptive Quantitative |
Secondary |
Articles |
Gregg & Nelson (2012) |
Journal |
Quantitative |
Meta-analysis |
Secondary |
Articles |
Hodgson et al. (2012) |
Report |
Qualitative |
Descriptive Qualitative |
Primary |
Focus Group |
Holmes & Silvestri (2012) |
Journal |
Expository/Opinion |
Descriptive Quantitative |
Secondary |
Articles |
Ihori (2012) |
Dissertation |
Quantitative |
Descriptive Quantitative |
Primary |
Survey |
Kettler et al. (2012) |
Journal |
Mixed |
Experimental |
Primary |
Survey, Test |
Kettler et al. (2011) |
Journal |
Quantitative |
Experimental |
Primary |
Test |
Kim (2012) |
Journal |
Mixed |
Quasi-Experimental |
Primary |
Interview Protocol, Test |
Koutsoftas & Gray (2012) |
Journal |
Quantitative |
Quasi-Experimental |
Primary |
Test |
Kuti (2011) |
Dissertation |
Mixed |
Descriptive Quantitative |
Secondary |
Interview Protocol, Test |
Lazarus et al. (2012) |
Report |
Mixed |
Quasi-Experimental |
Primary |
Interview Protocol, Test |
Leyser et al. (2011) |
Journal |
Quantitative |
Descriptive Quantitative |
Primary |
Survey |
Lipscomb (2012) |
Dissertation |
Quantitative |
Descriptive Quantitative |
Primary |
Survey |
Lovett (2011) |
Journal |
Expository/ Opinion |
Descriptive Qualitative |
Secondary |
Articles |
Makeham & Lee (2012) |
Journal |
Qualitative |
Descriptive Qualitative |
Primary |
Interview Protocol, Test |
Meadows (2012) |
Dissertation |
Quantitative |
Quasi-Experimental |
Primary |
Survey |
Patterson et al. (2011) |
Journal |
Mixed |
Experimental |
Primary |
Survey, Test |
Phillips et al. (2012) |
Journal |
Mixed |
Descriptive Qualitative |
Primary |
Survey |
Posey & Henderson (2012) |
Journal |
Mixed |
Correlation/ Prediction |
Primary |
Survey, Test |
Qi & Mitchell (2012) |
Journal |
Expository/ Opinion |
Longitudinal |
Secondary |
Articles |
Randall et al. (2011) |
Journal |
Quantitative |
Experimental |
Primary |
Test |
Scarpati et al. (2011) |
Journal |
Quantitative |
Quasi-Experimental |
Secondary |
Test |
Schmitt et al. (2012) |
Journal |
Mixed |
Quasi-Experimental |
Primary |
Survey, Test |
Schmitt et al. (2011) |
Journal |
Quantitative |
Quasi-Experimental |
Primary |
Observations, Survey, Test |
Shelton (2012) |
Dissertation |
Mixed |
Experimental |
Primary |
Interview Protocol, Survey, Test |
Shinn & Ofiesh (2012) |
Journal |
Qualitative |
Descriptive Qualitative |
Secondary |
Articles |
Smith & Amato (2012) |
Journal |
Quantitative |
Descriptive Quantitative |
Secondary |
Articles |
Srivastava & Gray (2012) |
Journal |
Quantitative |
Quasi-Experimental |
Primary |
Test |
Taherbhai et al. (2012) |
Journal |
Quantitative |
Quasi-Experimental |
Secondary |
Test |
Zebehazy et al. (2012) |
Journal |
Quantitative |
Quasi-Experimental |
Secondary |
Test |
Zhang et al. (2012) |
Journal |
Mixed |
Quasi-Experimental |
Primary |
Interview Protocol, Test |
Zhou et al. (2012) |
Journal |
Quantitative |
Correlation/ Prediction |
Primary |
Survey |
Zhou et al. (2011) |
Journal |
Quantitative |
Descriptive Quantitative |
Primary |
Survey |
Top of Page | Table of Contents
Appendix C
Instrument Characteristics
Table C-1. Instrument Types and Specific Instruments Used, and Their Sources
Authors |
Non-Academic Protocols or Surveys Developed by Study Author/s |
Surveys or Academic Tests Developed by Professionals or Researchers Using Sources Outside of Current Study |
Norm-referenced Academic Achievement Measures |
State Criterion-referenced Assessment |
Norm-referenced Cognitive Ability Measures |
Abedi et al. (2011) |
External raters also rated the accessibility of items |
|
|
Nine reading assessment forms across the three unidentified participating states; assessments included multiple-choice, extended-response, and field test items |
|
Alt & Moreno (2012) |
Parent survey about their children’s autism spectrum disorder |
Behavioral observations during testing, using the Conners’ Rating Scales (Conners, 1997) |
|
|
Expressive One-Word Picture Vocabulary Test (EOWPVT-2000; Brownell, 2000a) and the Receptive One-Word Picture Vocabulary Test (ROWPVT-2000; Brownell, 2000b) |
Beddow (2011) |
Student participant survey about testing experiences |
Mathematics items from Discovery Education Assessment item bank |
|
|
|
Bolt et al. (2011) |
Test-taker (student participants) Instructional and Testing Accommodations Survey |
|
|
|
|
Bouck et al. (2011)1 |
No instrument information for this study. |
||||
Brockelmann (2011) |
|
Perception survey adapted from part of the Mental Health and Illness Awareness Survey (MIHAS; Becker et al., 2002) |
|
|
|
Brown et al. (2011) |
|
|
Nelson-Denny Reading Test (NDRT; Brown et al., 1993) on reading comprehension; reading screening tests included the word attack and word reading scales from the Woodcock-Johnson Achievement Test (WJ-III; Woodcock et al., 2001) or the Wechsler Individual Achievement Test (WIAT-II; Wechsler, 2002) |
|
Verbal Comprehension Index (VCI) of the WISC-IV (Wechsler, 2003) or the WAIS III (Wechsler, 1997) |
Cawthon (2011) |
Teacher survey about accommodations selection for three hypothetical students |
|
|
|
|
Cawthon et al. (2012) |
|
|
NAEP math and reading test items |
|
|
Cawthon et al. (2011) |
Student survey on linguistic background, to determine the effects of exposure to ASL and student proficiency in each subject area being tested |
|
Iowa Tests of Basic Skills (ITBS; Hoover et al., 2001) Reading tests, parts 1 and 2, and the Mathematics test, parts 1 and 3 |
|
|
Cho et al. (2012) |
|
|
|
Unspecified state mathematics assessment; content included algebra, data, geometry, and number and computation |
|
Davis (2011) |
Teacher survey with demographics as well as perceived knowledge of test accommodations (TPK), perceived practices relative to the effectiveness of accommodations (PREA), and a set of open-ended items about accommodations purposes and implementation barriers |
|
|
|
|
Engelhard et al. (2011) |
|
|
|
Georgia Criterion-Referenced Competency Tests (CRCT) in mathematics |
|
Feldman et al. (2011) |
Student pre- and post-test surveys on test-related anxiety, test-related self-efficacy, motivation to work hard on tests, and positive regard for large-scale achievement tests in general |
|
TerraNova Achievement Test (CTB/McGraw-Hill, 1997) reading/language arts subtest |
|
|
Flowers et al. (2011) |
Students and school staff surveys about the testing experience |
|
|
Unspecified large-scale assessment in reading, science, and mathematics |
|
Fox (2012) |
|
|
|
Pennsylvania System of School Assessment (PSSA) in mathematics and reading for grades 3-8 and grade 11 |
|
Gregg (2012) |
|
|
Literature review on youth/young adult accommodations use, mostly on college entrance examination, on reading, writing, and mathematics |
|
|
Gregg & Nelson (2012) |
|
|
Assessments for high school students or those transitioning to postsecondary or adult education, including the Scholastic Aptitude Test (SAT); the academic content measured included mathematics, reading, and writing skills |
|
|
Hodgson et al. (2012) |
Semi-structured focus group interview protocol |
|
|
|
|
Holmes & Silvestri (2012)2 |
No instrument information for this study. |
||||
Ihori (2012) |
|
Faculty survey adapted from the Productive Learning University Strategies (PLuS) survey (Murray, Wren, & Keys, 2008). The PLuS survey measured 12 factors regarding accommodations use during examinations |
|
|
|
Kettler et al. (2012) |
Student participant survey on perceptions of the test enhancements |
Two 20-item sets of computer-delivered science items on high school biology content, common to all three states, were compared across experimental conditions. The Accessibility Rating Matrix (ARM; Beddow, Elliott, & Kettler, 2009) served to evaluate the science tests; A Maze reading fluency measure provided participant skill data |
|
|
|
Kettler et al. (2011) |
|
Items from Discovery Education Assessment item pool on reading and mathematics |
|
|
|
Kim (2012) |
|
Items drawn from the 2003 National Assessment of Educational Achievement on Korean reading comprehension |
|
|
|
Koutsoftas & Gray (2012) |
Interview protocol with student participants about testing experience; handwriting screener (including production speed) |
1 expository sample and 1 narrative sample of writing, using two different evaluation criteria |
|
|
Clinical Evaluation of Language Fundamentals—Fourth Edition (CELF-4; Semel et al., 2003) served as a screener |
Kuti (2011) |
Interview protocol with educational professionals at the levels of state, district, and school |
|
|
Virginia’s Assessing Comprehension and Communication in English Test (ACCESS; Metritech, 2007), an English proficiency assessment; five content areas: language arts, mathematics, science, social studies, and social and instructional language; four domains: reading, writing, listening, and speaking. |
|
Lazarus et al. (2012) |
Cognitive lab individual interview protocol |
Items from South Dakota’s Dakota Test of Educational Progress in Mathematics (DSTEP-Math) |
|
|
|
Leyser et al. (2011) |
Teacher attitude survey using Likert-type rating scale |
|
|
|
|
Lipscomb (2012) |
|
Teacher survey from the National Longitudinal Transition Study (NLTS2), and the Cochran Scale of Teachers’ Attitudes Toward Inclusive Classrooms (STATIC; Cochran, 1998) for measuring educator perceptions about accommodations use |
|
|
|
Lovett (2011)2 |
No instrument information for this study. |
||||
Makeham & Lee (2012)3 |
No instrument information for this study. |
||||
Meadows (2012) |
Teacher surveys using a Likert-type rating scale on instructional and assessment accommodations and the incidence of their use |
|
|
|
|
Patterson et al. (2011) |
|
|
GED Official Practice Test (OPT; GED Testing Service, 2008) in mathematics |
|
|
Phillips et al. (2012) |
Faculty survey seeking feedback about the test |
|
|
|
|
Posey & Henderson (2012) |
Teacher survey seeking feedback about the test |
Items from the Comprehensive Adult Student Assessment Systems (CASAS, 2008) life and work skills reading test |
|
|
|
Qi & Mitchell (2012) |
|
|
Literature review where studies primarily used Stanford Achievement Test for deaf students, in reading and mathematics |
Literature review where some studies used unspecified state reading and mathematics assessments |
|
Randall et al. (2011) |
|
Items from the Georgia statewide mathematics assessment testing problem-solving skills |
|
|
|
Scarpati et al. (2011) |
|
|
|
Unspecified statewide mathematics assessment |
|
Schmitt et al. (2012) |
Postsecondary student survey about experiences using the reading pen |
Reading comprehension skills were measured using reading passages (Spargo, 1989) at the postsecondary level of difficulty |
|
|
|
Schmitt et al. (2011) |
Student survey about experiences using the reading pen |
Reading comprehension skills were measured using reading passages from Spargo (1989) at the high school grade level of difficulty |
|
|
|
Shelton (2012) |
Participants provided demographic data and attitudinal surveys about science; participant post-test survey about the testing experience |
Items at the end of three science-content modules from the Situated Assessment using Virtual Environments (SAVE) project. Additional measures included patterns of assessment tools use and interactions with testing materials, which were recorded as students completed tests; survey about self-efficacy (Self-Efficacy in Technology in Science, or SETS; Ketelhut, 2007). |
|
|
|
Shinn & Ofiesh (2012)2 |
No instrument information for this study. |
||||
Smith & Amato (2012)2 |
No instrument information for this study. |
||||
Srivastava & Gray (2012) |
|
Assessment items using four reading comprehension passages and related test items at the grade 8 level, from Texas, Washington, and Florida |
Gray Oral Reading Test-Fourth Edition (GORT-4; Wiederholt & Bryant, 2001) on decoding skills |
|
Clinical Evaluation of Language Fundamentals-Fourth Edition (CELF-4; Semel et al., 2003) subtests on expressive and receptive language, tasks from the Nonword Repetition (NWR) test and the Visual Spatial Span Board (VSSB) from the Wechsler Memory Scale-Third Edition (WMS-3; Wechsler, 1997) |
Taherbhai et al. (2012) |
|
|
|
Modified version of Maryland’s state assessments of mathematics and reading |
|
Zebehazy et al. (2012) |
|
|
|
Spring 2005 Pennsylvania Alternate System of Assessment (PASA) |
|
Zhang et al. (2012) |
Interview protocol on testing experiences |
Geometry test items drawn from state assessment materials |
|
|
|
Zhou et al. (2012) |
Teacher survey including demographic data as well as self-rating of 10 domains of knowledge and skill on 111 assistive technology competencies level (Smith et al., 2009) |
|
|
|
|
Zhou et al. (2011) |
|
Adapted from a list of assistive technologies organized into domains of knowledge and skill which were rated by expertise level (Smith et al., 2009) |
|
|
|
TOTAL (number of studies) |
23 |
20 |
9 |
9 |
4 |
1 Observations and/or interview questions
2 Literature review without specific tests identified
3 Course-based examination in postsecondary setting
Table C-2. Content Areas Assessed
Author/s |
Math |
Reading |
Writing |
Other LA |
Science |
Social Studies |
Intelligence Test |
Psychology |
Not Specific1 |
N |
Abedi et al. (2011) |
|
● |
|
|
|
|
|
|
|
1 |
Alt & Moreno (2012) |
|
|
|
|
|
|
● |
|
|
1 |
Beddow (2011) |
● |
|
|
|
|
|
|
|
|
1 |
Bouck et al. (2011) |
● |
|
|
|
|
|
|
|
|
1 |
Brown et al. (2011) |
|
● |
|
|
|
|
● |
|
|
2 |
Cawthon et al. (2012) |
● |
● |
|
|
|
|
|
|
|
2 |
Cawthon et al. (2011) |
● |
● |
|
|
|
|
|
|
|
2 |
Cho et al. (2012) |
● |
|
|
|
|
|
|
|
|
1 |
Engelhard et al. (2011) |
● |
|
|
|
|
|
|
|
|
1 |
Feldman et al. (2011) |
|
● |
|
●2 |
|
|
|
|
|
2 |
Flowers et al. (2011) |
● |
● |
|
|
● |
|
|
|
|
3 |
Fox (2012) |
● |
● |
|
|
|
|
|
|
|
2 |
Gregg (2012) |
● |
● |
● |
|
|
|
|
|
|
3 |
Gregg & Nelson (2012) |
● |
● |
● |
|
|
|
|
|
|
3 |
Hodgson et al. (2012) |
● |
|
|
|
|
|
|
|
|
1 |
Holmes & Silvestri (2012) |
|
● |
● |
|
|
|
|
|
|
2 |
Kettler et al. (2012) |
|
|
|
|
● |
|
|
|
|
1 |
Kettler et al. (2011) |
● |
● |
|
|
|
|
|
|
|
2 |
Kim (2012) |
|
●3 |
|
|
|
|
|
|
|
1 |
Koutsoftas & Gray (2012) |
|
|
● |
|
|
|
|
|
|
1 |
Kuti (2011) |
● |
|
|
●4 |
● |
● |
|
|
|
4 |
Lazarus et al. (2012) |
● |
|
|
|
|
|
|
|
|
1 |
Lovett (2011) |
|
|
|
|
|
|
|
|
● |
1 |
Makeham & Lee (2012) |
● |
|
● |
|
|
|
|
|
|
2 |
Patterson et al. (2011) |
● |
|
|
|
|
|
|
|
|
1 |
Posey & Henderson (2012) |
|
● |
|
|
|
|
|
|
|
1 |
Qi & Mitchell (2012) |
● |
● |
|
|
|
|
|
|
|
2 |
Randall et al. (2011) |
● |
|
|
|
|
|
|
|
|
1 |
Scarpati et al. (2011) |
● |
|
|
|
|
|
|
|
|
1 |
Schmitt et al. (2012) |
|
● |
|
|
|
|
|
|
|
1 |
Schmitt et al. (2011) |
|
● |
|
|
|
|
|
|
|
1 |
Shelton (2012) |
|
|
|
|
● |
|
|
|
|
1 |
Smith & Amato (2012) |
|
|
|
|
|
|
|
|
● |
1 |
Srivastava & Gray (2012) |
|
● |
|
|
|
|
● |
|
|
2 |
Taherbhai et al. (2012) |
● |
● |
|
|
|
|
|
|
|
2 |
Zebehazy et al. (2012) |
● |
● |
|
|
|
|
|
|
|
2 |
Zhang et al. (2012) |
● |
|
|
|
|
|
|
|
|
1 |
|
22 |
19 |
5 |
2 |
4 |
1 |
3 |
0 |
2 |
58 |
Note: This table encompasses the subset of studies (n=37) which used assessments or tests on academic content area/s or cognitive skills; studies that were excluded used surveys or other data collection mechanisms only.
1 Studies not specifying academic content were reviews of literature regarding a specified accommodation’s effect on assessment scores across a various study settings.
2 In this study, other LA = composition of short-answers and essays, in addition to reading.
3 In this study from South Korea, native Korean reading skills were tested.
4 In this study, other LA = English language proficiency, including reading, writing, listening, and speaking.
Top of Page | Table of Contents
Appendix D
Participant and Sample Characteristics
Table D-1. Unit of Analysis, Total Sample Sizes, Grade/Education Level, and Types of Disabilities
| Authors | Unit of Analysis | Sample Size | Percent of Sample with Disabilities | Grade / Education Level | Disability Categories Included in Sample |
Abedi et al. (2011) |
Students |
286023 |
10% |
8th |
NS, None |
Alt & Moreno (2012) |
Students |
36 |
50.0% |
Ages 5-13 |
A, None |
Beddow (2011) |
Students |
449 |
23.0% |
7th |
A, EBD, LD, None |
Bolt et al. (2011) |
Students |
55 |
100% |
Postsecondary |
LD, S/L |
Bouck et al. (2011) |
Students |
3 |
100% |
High; ages18-19 |
VI |
Brockelmann (2011) |
Educators |
107 |
N/A |
N/A |
N/A |
Brown et al. (2011) |
Students |
145 |
100% |
Ages 13-18 |
AP |
Cawthon (2011) |
Educators |
372 |
N/A |
N/A |
N/A |
Cawthon et al. (2012) |
Students |
4350 |
100% |
4th |
LD |
Cawthon et al. (2011) |
Students |
64 |
100% |
5th – 8th; Ages 10-15 |
HI |
Cho et al. (2012) |
Students |
51591 |
3.4% |
3rd-8th |
AP, EBD, LD, PD, S/L, None |
Davis (2011) |
Educators |
288 |
N/A |
N/A |
N/A |
Engelhard et al. (2011) |
Students |
1944 |
45.7% |
3rd-4th; 6th-7th |
AP, A, EBD, HI, LD, ID, PD, S/L, VI |
Feldman et al. (2011) |
Students |
48 |
50% |
8th |
EBD, LD, S/L, None |
Flowers et al. (2011) |
Students |
47404 |
100% |
3rd-11th |
NS |
Fox (2012) |
Students |
441000 |
100% |
3rd, 8th, 11th |
HI, LD, VI |
Gregg (2012) |
N/A |
N/A |
N/A |
N/A |
N/A |
Gregg & Nelson (2012) |
Students |
769550 |
2% |
High school to adult |
LD, None |
Hodgson et al. (2012) |
Educators |
12 |
N/A |
N/A |
N/A |
Holmes & Silvestri (2012) |
N/A |
N/A |
N/A |
N/A |
N/A |
Ihori (2012) |
Educators |
327 |
N/A |
N/A |
N/A |
Kettler et al. (2012) |
Students |
400 |
43% |
High school |
LD, None |
Kettler et al. (2011) |
Students |
755 |
64% |
8th |
AP, A, EBD, HI, LD, Mult., None |
Kim (2012) |
Students |
20 |
50% |
Middle school |
VI, None |
Koutsoftas & Gray (2012) |
Students |
56 |
42% |
4th-5th |
S/L, None |
Kuti (2011) |
Educators, Students |
7010 |
99.9% |
3rd-12th |
A, EBD, HI, LD, ID, PD, S/L, VI, Mult., None |
Lazarus et al. (2012) |
Students |
24 |
100% |
8th |
NS |
Leyser et al. (2011) |
Educators |
304 |
N/A |
N/A |
N/A |
Lipscomb (2012) |
Educators |
56 |
N/A |
N/A |
N/A |
Lovett (2011) |
Students |
N/A |
N/A |
N/A |
N/A |
Makeham & Lee (2012) |
Students |
6 |
100% |
Postsecondary |
NS |
Meadows (2012) |
Educators |
298 |
N/A |
N/A |
N/A |
Patterson et al. (2011) |
Students |
216 |
Unavailable |
Youth-adult |
NS |
Phillips et al. (2012) |
Educators |
83 |
N/A |
N/A |
N/A |
Posey & Henderson (2012) |
Students |
147 |
44% |
Youth-adult |
VI, None |
Qi & Mitchell (2012) |
N/A |
N/A |
N/A |
N/A |
N/A |
Randall et al. (2011) |
Students |
868 |
44% |
7th |
NS, None |
Scarpati et al. (2011) |
Students |
73000 |
16.8% |
8th |
NS, None |
Schmitt et al. (2012) |
Students |
3 |
100% |
Postsecondary |
LD |
Schmitt et al. (2011) |
Students |
3 |
100% |
High; ages 16-17 |
LD |
Shelton (2012) |
Students |
282 |
11% |
6th, 7th, 8th |
LD, None |
Shinn & Ofiesh (2012) |
N/A |
N/A |
N/A |
N/A |
N/A |
Smith & Amato (2012) |
N/A |
N/A |
N/A |
N/A |
N/A |
Srivastava & Gray (2012) |
Students |
39 |
36% |
8th |
LD, None |
Taherbhai et al. (2012) |
Students |
Unavailable |
100% |
7th-8th, ages 13-16 |
LD |
Zebehazy et al. (2012) |
Students |
286 |
100% |
3rd-8th |
ID, VI |
Zhang et al. (2012) |
Students |
4 |
100% |
3rd |
LD |
Zhou et al. (2012) |
Educators |
840 |
N/A |
N/A |
N/A |
Zhou et al. (2011) |
Educators |
165 |
N/A |
N/A |
N/A |
AP: Attention Problem ID: Intellectual Disability S/L: Speech/Language Disability A: Autism LD: Learning Disability V/I: Visual Impairment / Blindness
EBD: Emotional/Behavioral Disability PD: Physical Disability Mult.: Multiple Disabilities
HI: Hearing Impairment / Deafness RD: Reading Disability None: Students without Disabilities
NS: Disability Not Specified
Top of Page | Table of Contents
Appendix E
Accommodations Studied
Table E-1. Presentation Accommodations Itemized by Study
Study Author/s |
Braille |
Clarify directions |
Computer administration |
Cueing |
Dictionary |
Examiner familiarity |
Format |
Large print |
Alt & Moreno (2012) |
0 |
0 |
1 |
0 |
0 |
0 |
0 |
0 |
Beddow (2011) |
0 |
1 |
0 |
0 |
0 |
0 |
0 |
0 |
Bolt et al. (2011) |
0 |
0 |
0 |
0 |
1 |
0 |
0 |
1 |
Brockelmann (2011) |
0 |
0 |
0 |
0 |
0 |
0 |
0 |
0 |
Cawthon (2011) |
0 |
0 |
0 |
0 |
0 |
0 |
0 |
0 |
Cawthon et al. (2012) |
0 |
0 |
1 |
0 |
0 |
1 |
0 |
1 |
Cawthon et al. (2011) |
0 |
0 |
0 |
0 |
0 |
0 |
0 |
0 |
Cho et al. (2012) |
0 |
0 |
0 |
0 |
0 |
0 |
0 |
0 |
Davis (2011) |
0 |
0 |
0 |
1 |
0 |
0 |
0 |
0 |
Flowers et al. (2011) |
0 |
0 |
1 |
0 |
0 |
0 |
0 |
0 |
Fox (2012) |
1 |
0 |
1 |
0 |
0 |
0 |
0 |
1 |
Gregg (2012) |
0 |
0 |
0 |
0 |
0 |
0 |
0 |
0 |
Hodgson et al. (2012) |
0 |
0 |
0 |
0 |
0 |
0 |
0 |
0 |
Holmes & Silvestri (2012) |
0 |
0 |
0 |
0 |
0 |
0 |
0 |
0 |
Kettler et al. (2012) |
0 |
0 |
0 |
0 |
0 |
0 |
0 |
0 |
Kettler et al. (2011) |
0 |
0 |
0 |
0 |
0 |
0 |
0 |
0 |
Kim (2012) |
1 |
0 |
0 |
0 |
0 |
0 |
0 |
1 |
Kuti (2011) |
1 |
1 |
1 |
0 |
0 |
0 |
1 |
1 |
Lazarus et al. (2012) |
0 |
0 |
0 |
0 |
0 |
0 |
0 |
0 |
Lipscomb (2012) |
1 |
0 |
0 |
1 |
0 |
0 |
0 |
1 |
Makeham & Lee (2012) |
0 |
0 |
0 |
0 |
0 |
0 |
0 |
0 |
Patterson et al. (2011) |
0 |
0 |
1 |
0 |
0 |
0 |
0 |
0 |
Phillips et al. (2012) |
0 |
0 |
0 |
0 |
0 |
0 |
1 |
0 |
Posey & Henderson (2012) |
1 |
0 |
0 |
0 |
0 |
0 |
0 |
0 |
Qi & Mitchell (2012) |
0 |
0 |
0 |
0 |
0 |
0 |
0 |
0 |
Scarpati et al. (2011) |
1 |
0 |
0 |
0 |
0 |
1 |
0 |
1 |
Schmitt et al. (2012) |
0 |
0 |
0 |
0 |
1 |
0 |
0 |
0 |
Schmitt et al. (2011) |
0 |
0 |
0 |
0 |
1 |
0 |
0 |
0 |
Shelton (2012) |
0 |
0 |
0 |
0 |
0 |
0 |
0 |
0 |
Shinn & Ofiesh (2012) |
1 |
0 |
1 |
0 |
0 |
0 |
1 |
0 |
Smith & Amato (2012) |
1 |
0 |
1 |
0 |
0 |
0 |
0 |
1 |
Srivastava & Gray (2012) |
0 |
0 |
1 |
0 |
0 |
0 |
0 |
0 |
Taherbhai et al. (2012) |
0 |
0 |
1 |
0 |
0 |
0 |
0 |
0 |
Zebehazy et al. (2012) |
0 |
0 |
0 |
0 |
0 |
0 |
0 |
0 |
Zhang et al. (2012) |
0 |
0 |
0 |
0 |
0 |
0 |
0 |
0 |
TOTAL |
8 |
2 |
10 |
2 |
3 |
2 |
3 |
8 |
Table E-1. Presentation Accommodations Itemized by Study (continued)
Study Author/s |
Read aloud / Oral delivery |
Read directions |
Signed administration |
Simplified language |
Student read aloud |
Visual cues |
TOTAL |
Alt & Moreno (2012) |
1 |
0 |
0 |
0 |
0 |
0 |
2 |
Beddow (2011) |
1 |
0 |
1 |
0 |
0 |
1 |
5 |
Bolt et al. (2011) |
1 |
1 |
0 |
0 |
0 |
0 |
3 |
Brockelmann (2011) |
1 |
0 |
0 |
0 |
0 |
0 |
1 |
Cawthon (2011) |
0 |
0 |
1 |
0 |
0 |
0 |
1 |
Cawthon et al. (2012) |
1 |
0 |
0 |
1 |
0 |
0 |
5 |
Cawthon et al. (2011) |
0 |
0 |
1 |
0 |
0 |
0 |
1 |
Cho et al. (2012) |
1 |
0 |
0 |
0 |
0 |
0 |
1 |
Davis (2011) |
1 |
0 |
0 |
0 |
1 |
1 |
4 |
Flowers et al. (2011) |
1 |
0 |
0 |
0 |
0 |
0 |
2 |
Fox (2012) |
1 |
0 |
0 |
0 |
0 |
0 |
4 |
Gregg (2012) |
1 |
0 |
0 |
0 |
0 |
0 |
1 |
Hodgson et al. (2012) |
1 |
0 |
0 |
0 |
0 |
0 |
1 |
Holmes & Silvestri (2012) |
1 |
0 |
0 |
0 |
0 |
0 |
1 |
Kettler et al. (2012) |
1 |
0 |
0 |
1 |
0 |
0 |
2 |
Kettler et al. (2011) |
1 |
0 |
0 |
0 |
0 |
1 |
2 |
Kim (2012) |
1 |
0 |
0 |
0 |
0 |
0 |
3 |
Kuti (2011) |
0 |
0 |
0 |
0 |
0 |
0 |
5 |
Lazarus et al. (2012) |
1 |
0 |
0 |
0 |
0 |
0 |
1 |
Lipscomb (2012) |
0 |
0 |
1 |
0 |
0 |
0 |
4 |
Makeham & Lee (2012) |
1 |
0 |
0 |
0 |
0 |
0 |
1 |
Patterson et al. (2011) |
0 |
0 |
0 |
0 |
0 |
0 |
1 |
Phillips et al. (2012) |
0 |
0 |
0 |
0 |
0 |
0 |
1 |
Posey & Henderson (2012) |
0 |
0 |
0 |
0 |
0 |
0 |
1 |
Qi & Mitchell (2012) |
0 |
0 |
1 |
0 |
0 |
0 |
1 |
Scarpati et al. (2011) |
1 |
0 |
1 |
0 |
0 |
0 |
5 |
Schmitt et al. (2012) |
1 |
0 |
0 |
0 |
0 |
0 |
2 |
Schmitt et al. (2011) |
1 |
0 |
0 |
0 |
0 |
0 |
2 |
Shelton (2012) |
1 |
0 |
0 |
0 |
0 |
0 |
1 |
Shinn & Ofiesh (2012) |
0 |
0 |
0 |
0 |
0 |
0 |
4 |
Smith & Amato (2012) |
1 |
1 |
0 |
0 |
0 |
1 |
6 |
Srivastava & Gray (2012) |
0 |
0 |
0 |
0 |
0 |
0 |
1 |
Taherbhai et al. (2012) |
0 |
0 |
0 |
0 |
0 |
0 |
1 |
Zebehazy et al. (2012) |
0 |
0 |
0 |
1 |
0 |
1 |
2 |
Zhang et al. (2012) |
0 |
0 |
0 |
0 |
0 |
1 |
1 |
TOTAL |
22 |
2 |
6 |
3 |
1 |
6 |
79 |
Table E-2. Equipment Accommodations Itemized by Study
Study Author/s |
Audio cassette |
Computer administration |
Physical supports |
Screen display |
Technological aid |
TOTAL |
Alt & Moreno (2012) |
0 |
1 |
0 |
0 |
0 |
1 |
Beddow (2011) |
0 |
0 |
1 |
1 |
1 |
3 |
Bouck et al. (2011) |
0 |
0 |
0 |
0 |
1 |
1 |
Cawthon et al. (2012) |
0 |
1 |
0 |
0 |
0 |
1 |
Davis (2011) |
0 |
0 |
1 |
0 |
1 |
2 |
Flowers et al. (2011) |
0 |
1 |
0 |
0 |
0 |
1 |
Fox (2012) |
0 |
1 |
0 |
0 |
1 |
2 |
Gregg (2012) |
0 |
0 |
0 |
0 |
1 |
1 |
Holmes & Silvestri (2012) |
0 |
0 |
0 |
0 |
1 |
1 |
Kuti (2011) |
0 |
1 |
0 |
0 |
0 |
1 |
Lipscomb (2012) |
1 |
0 |
1 |
0 |
1 |
3 |
Makeham & Lee (2012) |
0 |
0 |
0 |
0 |
1 |
1 |
Patterson et al. (2011) |
0 |
1 |
0 |
0 |
0 |
1 |
Phillips et al. (2012) |
0 |
0 |
0 |
0 |
1 |
1 |
Schmitt et al. (2012) |
0 |
0 |
0 |
0 |
1 |
1 |
Schmitt et al. (2011) |
0 |
0 |
0 |
0 |
1 |
1 |
Shinn & Ofiesh (2012) |
0 |
1 |
0 |
0 |
0 |
1 |
Smith & Amato (2012) |
1 |
1 |
0 |
1 |
1 |
4 |
Srivastava & Gray (2012) |
0 |
1 |
0 |
0 |
0 |
1 |
Taherbhai et al. (2012) |
0 |
1 |
0 |
0 |
0 |
1 |
TOTAL |
2 |
10 |
3 |
2 |
12 |
29 |
Table E-3. Response Accommodations Itemized by Study
Study Author/s |
Calculator |
Computer administration |
Dictated response |
Mark answer in test booklet |
Speech recognition system |
Tape recorder |
Signed response |
Word-processor |
TOTAL |
Alt & Moreno (2012) |
0 |
1 |
0 |
0 |
0 |
0 |
0 |
0 |
1 |
Beddow (2011) |
0 |
0 |
1 |
1 |
0 |
0 |
0 |
0 |
2 |
Bolt et al. (2011) |
0 |
0 |
1 |
0 |
0 |
1 |
0 |
1 |
3 |
Bouck et al. (2011) |
1 |
0 |
1 |
0 |
1 |
0 |
0 |
0 |
3 |
Brockelmann (2011) |
0 |
0 |
1 |
0 |
0 |
0 |
0 |
1 |
2 |
Cawthon (2011) |
0 |
0 |
0 |
0 |
0 |
0 |
1 |
0 |
1 |
Cawthon et al. (2012) |
0 |
1 |
1 |
1 |
0 |
0 |
0 |
0 |
3 |
Davis (2011) |
0 |
0 |
1 |
0 |
0 |
0 |
0 |
0 |
1 |
Engelhard et al. (2011) |
1 |
0 |
0 |
0 |
0 |
0 |
0 |
0 |
1 |
Flowers et al. (2011) |
0 |
1 |
0 |
0 |
0 |
0 |
0 |
0 |
1 |
Fox (2012) |
0 |
1 |
1 |
0 |
0 |
0 |
0 |
1 |
3 |
Gregg (2012) |
1 |
0 |
0 |
0 |
0 |
0 |
0 |
1 |
2 |
Holmes & Silvestri (2012) |
0 |
0 |
1 |
0 |
1 |
0 |
0 |
1 |
3 |
Kuti (2011) |
0 |
1 |
1 |
0 |
0 |
0 |
0 |
0 |
2 |
Lipscomb (2012) |
1 |
0 |
0 |
0 |
0 |
1 |
0 |
0 |
2 |
Patterson et al. (2011) |
0 |
1 |
0 |
0 |
0 |
0 |
0 |
0 |
1 |
Randall et al. (2011) |
1 |
0 |
0 |
0 |
0 |
0 |
0 |
0 |
1 |
Scarpati et al. (2011) |
1 |
0 |
0 |
0 |
0 |
0 |
0 |
0 |
1 |
Shinn & Ofiesh (2012) |
0 |
1 |
1 |
0 |
0 |
0 |
0 |
1 |
3 |
Smith & Amato (2012) |
0 |
1 |
0 |
0 |
0 |
0 |
0 |
0 |
1 |
Srivastava & Gray (2012) |
0 |
1 |
0 |
0 |
0 |
0 |
0 |
0 |
1 |
Taherbhai et al. (2012) |
0 |
1 |
0 |
0 |
0 |
0 |
0 |
0 |
1 |
Zebehazy et al. (2012) |
0 |
0 |
1 |
0 |
0 |
0 |
0 |
0 |
1 |
TOTAL |
5 |
10 |
11 |
2 |
1 |
2 |
1 |
6 |
37 |
Table E-4. Scheduling Accommodations Itemized by Study
Study Author/s |
Extended time |
Multiple day |
Test breaks |
TOTAL |
Beddow (2011) |
1 |
0 |
1 |
2 |
Bolt et al. (2011) |
1 |
0 |
1 |
2 |
Brockelmann (2011) |
1 |
0 |
0 |
1 |
Brown et al. (2011) |
1 |
0 |
0 |
1 |
Cawthon (2011) |
1 |
0 |
0 |
1 |
Cawthon et al. (2012) |
1 |
0 |
1 |
2 |
Cho et al. (2012) |
0 |
0 |
1 |
1 |
Davis (2011) |
0 |
1 |
1 |
2 |
Fox (2012) |
1 |
1 |
0 |
2 |
Gregg (2012) |
1 |
1 |
1 |
3 |
Gregg & Nelson (2012) |
1 |
0 |
0 |
1 |
Kim (2012) |
1 |
0 |
0 |
1 |
Lipscomb (2012) |
1 |
0 |
0 |
1 |
Lovett (2011) |
1 |
0 |
0 |
1 |
Phillips et al. (2012) |
1 |
0 |
0 |
1 |
Qi & Mitchell (2012) |
1 |
0 |
0 |
1 |
Shinn & Ofiesh (2012) |
1 |
0 |
0 |
1 |
TOTAL |
15 |
3 |
6 |
24 |
Table E-5. Setting Accommodations Itemized by Study
Study Author/s |
Individual |
Small group |
Specialized setting |
TOTAL |
Beddow (2011) |
1 |
1 |
1 |
3 |
Bolt et al. (2011) |
1 |
1 |
0 |
2 |
Brockelmann (2011) |
1 |
0 |
0 |
1 |
Cawthon et al. (2012) |
1 |
1 |
1 |
3 |
Cho et al. (2012) |
0 |
0 |
1 |
1 |
Davis (2011) |
1 |
0 |
0 |
1 |
Fox (2012) |
1 |
1 |
1 |
3 |
Qi & Mitchell (2012) |
0 |
0 |
1 |
1 |
TOTAL |
6 |
4 |
5 |
15 |
Top of Page | Table of Contents
Appendix F
Research Findings
Table F-1. Findings for Studies Examining Effects of Oral Delivery Accommodations (n=5)
Authors |
Findings |
The oral delivery accommodation supported improvement in assessment performance for some but not all students with disabilities and/or in some but not all testing conditions (n=3) |
|
Lazarus et al. (2012) |
On average, performance on 5 math items was not significantly different with the use of the read-aloud accommodation, presented by an in-person reader, than performance on the other, similar, 5 items without the read-aloud accommodation. When reviewed individually, 7 students scored higher with the accommodation, 8 students scored higher without the accommodation, and 9 students scored the same. |
Schmitt et al. (2012) |
The degree of score improvement across the accommodation conditions was not consistent for all participants. The student with the lowest comprehension skills, specifically oral fluency, demonstrated the most benefit of the three participants when using the reading pen, in both conditions. However, when using the reading pen for vocabulary definition, she mostly scored lower than when using the oral delivery-only tool setting. The other two participants’ comprehension skills actually worsened when using the reading pen than when not doing so, which the researchers attributed to those participants having difficulties manipulating the reading pen and disrupting their reading fluency. |
Schmitt et al. (2011) |
All three students scored lowest on comprehension accuracy when using the reading pen for decoding and vocabulary. Two of the three students exhibited the highest comprehension accuracy (with a small effect size) when using the reading pen for decoding, and one scored highest (with a moderate effect size) without the accommodation. When calculating comprehension rates, or correct answers per minute of reading time, all three students had the lowest rates in the decoding and vocabulary condition. Two students had the best rates in the control condition and one student had the best rate in the decoding condition. Comparing the rates for the control condition to the decoding condition, the two scoring highest in the control condition had moderate effect sizes, whereas the student with the highest rate in the decoding condition had a small effect size. Overall, then, the researchers concluded that the reading pen accommodation was not consistently beneficial for these students on grade-level test materials. |
The oral delivery accommodation supported improved assessment performance and in other ways beyond for students with learning disabilities (n=1) |
|
Holmes & Silvestri (2012) |
The results of this literature review indicated that text-to-speech supported reading, benefiting comprehension, reading rate, and task persistence. The degree of benefit in some areas depended on the degree of reading disabilities, in that those with more difficulties exhibited improvements more than those with fewer difficulties. For instance, people with phonological processing challenges were aided more than others. |
The oral delivery accommodation supported improved assessment performance of all students (n=1) |
|
Shelton (2012) |
Students using oral delivery accommodations, via audio recording, scored a higher total score than students not using read-aloud for one of the science content modules, but no difference in scores for the other science content module tests. When controlling for learning disability status, there were no score differences in any of the modules. |
Table F-2. Findings for Studies Examining Effects of Computerized Accommodations (n=3)
Authors |
Findings |
The computer administration accommodation did not support improved scores for students with disabilities more than the paper assessment format (n=2) |
|
Patterson et al. (2011) |
The researchers demonstrated the feasibility, at least on a small scale, of shifting the mode from paper to electronic computer-based format. For the test-takers using paper-based then computerized tests, there were no significant differences in final test scores. In other words, the 25 test-takers using NimbleTools on computerized tests scored higher than test-takers had on the accommodated paper tests, although the difference was not statistically significant. |
Srivastava & Gray (2012) |
Students without disabilities scored significantly higher than students with language-learning disabilities (LLD). The scores of students without disabilities were not significantly different between testing conditions. The students with LLD experienced the same pattern—no score differences between test formats. This was an unexpected result, as it was hypothesized that the computerized format with hyperlinked vocabulary definitions would increase students’ cognitive load. The researchers reviewed possible factors related to the finding, as well as the observation that students with LD did not often stop reading and review hyperlinked text. The mean passage-reading times and item response times across testing conditions did not differ significantly between students with and without LD, although students with LD tended to be somewhat slower. |
The computer administration accommodation did not support improved scores for all students (n=1) |
|
Alt & Moreno (2012) |
There were no significant differences in scores between the test formats for students with autism spectrum disorders (ASD) and students without disabilities. In fact, the reliability across the two test formats was high for both the expressive and receptive tests for both groups. However, the scores of students without disabilities were higher on both tests than scores of students with ASD. All students scored higher on the expressive test than on the receptive test. Neither group had observable differences in behavior between the paper-based and computer-based formats. The behavioral ratings were higher, indicating more negative behaviors, for the students with ASD than for students without disabilities. |
Table F-3. Findings for Studies Examining Effects of Extended-time Accommodations (n=3)
Authors |
Findings |
The extended-time accommodation supported improved scores for students with disabilities (n=1) |
|
Brown et al. (2011) |
Participants—who all had Attention Deficit Hyperactivity Disorder (ADHD)—had Verbal Comprehension Index (VCI) scores in the high-average range, and their Working Memory Index (WMI) and Processing Speed Index (PSI) were lower, in the average range—all of which fits with scores typical of students with ADHD, as these are difficulties in executive functions related to ADHD. On the standard timed Nelson-Denny Reading Test (NDRT), about 48% of participants failed to attempt all of the vocabulary items, and about 53% of participants failed to attempt all of the reading comprehension items. Participants’ NDRT scores without extended-time, on average, were significantly lower than when provided extended-time. Put another way, about 63% of participants’ NDRT scores, without extended-time, were within one standard deviation (SD) of their VCI score, and for reading comprehension items, about 43% of the scores were within 1 SD of VCI scores. However, with extended-time, about 73% of participants’ (NDRT) vocabulary scores within 1 SD of their VCI scores, and about 78% of participants’ (NDRT) comprehension scores were within 1 SD of their VCI scores. |
The extended-time accommodation supported score improvements differentially for students with disabilities compared to those of students without disabilities (n=1) |
|
Gregg & Nelson (2012) |
This meta-analysis examined nine studies, ranging from 1986 to 2006, yet empirical conclusions pertaining to extended-time drew from fewer studies. Three studies indicated that youth with learning disabilities scored significantly higher with extended-time than without, with medium to large effect sizes. Two studies found that youth without disabilities also scored moderately higher with accommodations, with small to large effect sizes. Two studies supported the differential boost hypothesis, indicating the benefits from extended-time were greater for youth with learning disabilities than youth without disabilities. |
The extended-time accommodation has supported improved scores for all students (n=1) |
|
Lovett (2011) |
The author argued that there are four main findings that should be considered before allowing the use of extended-time testing accommodations, including that extended-time has helped non-disabled students as well as students with disabilities, and that extended-time has been changing the meaning of students’ test performance. The author concluded by suggesting steps that practitioners can take in order to recommend the extended-time accommodation only when appropriate. |
Table F-4. Findings for Studies Examining Effects of Calculator Accommodations (n=2)
Authors |
Findings |
The calculator accommodation supported improved performance for all students (n=1) |
|
Engelhard et al. (2011) |
Calculator use seemed to result in a small increase in the mean scores of students with and without disabilities in both age groups in most cases. No support was found in this study for the interaction hypothesis (no evidence that the accommodations were reducing construct-irrelevant barriers to the achievement of students with disabilities). Overall, students without disabilities experienced larger gains in scores than students with disabilities. |
The calculator accommodation had mixed results for students with disabilities (n=1) |
|
Scarpati et al. (2011) |
On state math assessments, the calculator accommodation provided a differential boost on some items for students with disabilities, whereas not using accommodations for some items provided a differential boost for students with disabilities. |
Table F-5. Findings for Studies Examining Effects of Aggregated Accommodations (n=3)
Authors |
Findings |
Accommodations package supported improved scores for all students in an equal manner (n=1) |
|
Feldman et al. (2011) |
Packages of accommodations individualized to the needs of each student with disabilities and could include any combination of the following: unlimited time (similar to extended-time), highlighting test directions, read-aloud directions only, test books in large-print format, student dictation to a human scribe, and allowing frequent rest breaks. Note: Each student with disabilities was paired with a student without disabilities, who received the same package of accommodations. |
An accommodations package supported improved scores for students with disabilities more than another accommodations package (n=1) |
|
Flowers et al. (2011) |
Packages: computerized format with oral delivery accommodation via text-to-speech software vs. print text format with human reader. |
Accommodations package supported improved scores for students with disabilities (n=1) |
|
Kim (2012) |
Package: oral delivery accommodation via human reader in combination with large print, braille, and extended time. |
Table F-6. Findings for Studies Examining Uncommon or Unique Accommodations and Modifications (n=7)
Authors |
|
The unique accommodations did not support improved performance for students with disabilities (n=2) |
|
Bouck et al (2011) |
|
Cawthon et al. (2011) |
|
The unique accommodations supported improved performance for students with disabilities (n=2) |
|
Holmes & Silvestri (2012) |
|
Zhang et al. (2012) |
|
The unique enhancement did not support improved performance for all—students with disabilities as well as students without disabilities (n=1) |
|
Engelhard et al. (2011) |
|
The unique enhancement supported improvements differentially for a subset of students with disabilities (n=1) |
|
Kettler et al. (2011) |
|
The unique enhancement did not support improvements differentially for a subset of students with disabilities (n=1) |
|
Kettler et al. (2011) |
|
Table F-7. Findings for Studies Examining Perceptions about Accommodations and Modifications (n=25)
Authors |
Findings |
STUDENT PERCEPTIONS ONLY (n=13) |
|
Students indicated that using accommodations and/or modifications benefited them in terms of performance score (n=4) |
|
Beddow (2011)
|
The survey findings included that all students comprehended the modified math items better than the standard math items. Students without IEPs comprehended items (both standard and modified forms) better than the students with IEPs. All students reported that they had to work less to answer modified items than standard items. Similarly, students without IEPs indicated a lower degree of cognitive load than students with IEPs indicated, for both modified and standard items. Students also offered their perceptions of their having learned the content, and confidence in being correct on the items. |
Kettler et al. (2012) |
The test-takers mostly indicated that the enhancements (accommodations or modifications) seemed to decrease the difficulty of science testing, but when viewing specific original items and enhanced items, they indicated that each item had a similar level of difficulty. |
Lazarus et al. (2012) |
Most of the students (61%) reported that using read-aloud reduced stress associated with test-taking, and/or helped them arrive at correct answers on the math test, yet only 7 of the 24 students scored higher when using this accommodation. |
Zhang et al. (2012) |
Participants also reported a preference for visual chunking representation on geometry assessment items, and reported that the items were easier when using visual chunking. |
Students indicated that using accommodations benefited them beyond performance score improvements (n=4) |
|
Bouck et al. (2011) |
Two of three student participants expressed they felt more independent using the voice-input, speech output calculator because they did not have to rely on a human access assistant during math assessment. |
Feldman et al. (2011) |
Results indicated that the accommodations package had an effect on test-related thoughts and attitudes, regardless of disability status. For example, students who received accommodations showed larger increases between the pre- and post-test on measures of self-efficacy than students who did not receive accommodations. For students with disabilities, receiving accommodations appeared to increase motivation to work hard during reading/language arts assessment, whereas for students without disabilities this was not the case. |
Patterson et al. (2011) |
Survey results indicated that 61% of participants preferred to take the GED math examination via computer, and that 61% preferred to use NimbleTools rather than be tested on paper. Also, about 75% of participants indicated that it was easy to use the NimbleTools. |
Shelton (2012) |
Students indicated on surveys about their generally positive perceptions about the oral delivery testing condition. An example survey question asked about participants’ use of oral delivery, specifically of listening to the characters explain science problems. Most test-takers (87%) indicated that they had done so to varying degrees from very much to very little, and only 13% responded that they did not do so at all. Another survey item inquired about the degree to which the characters speaking was distracting; 34% responded that they disagreed and 22% responded that they strongly disagreed with that notion, and about 27% indicated a neutral response about distractedness. Only 17% indicated that they were distracted by the characters speaking. Students with learning disabilities tended to have a more positive perception of hearing the segments of characters speaking, and tended not to find them distracting but rather useful to form their test answers. |
Student perceptions were mixed about the accommodations studied (n=3) |
|
Makeham & Lee (2012) |
The results were primarily reported as categorized qualitative data about students’ perceptions. All participants indicated social discomfort, including embarrassment, when offered a human exam reader. In comparison with a human reader, many participants stated a preference for iPod aural presentation. Two of the three math examinees were also the two students reporting the greatest benefit with the iPod. Compared with having only printed exams, they noted that this recorded read-aloud exam supported their needs for understanding what was being asked of them by the additional cues of intonation and pacing. Three of the students reported little or no benefit from using the iPod-presented oral delivery, compared with printed exam alone; their comments indicated that this accommodation (oral delivery) via any medium would not be helpful to them. |
Schmitt et al. (2012) |
There seemed to be an inverse relationship between actual benefits and enjoyment of using the reading pen: the lowest-skilled participant indicated a lesser degree of satisfaction than the other two participants. |
Schmitt et al. (2011) |
Two high school participants with learning disabilities reported that they enjoyed using the reading pen accommodations during reading task, while one other did not enjoy this technology. All three students indicated that the decoding function was helpful for unknown words, yet one indicated that the vocabulary (definition) function was helpful only for unknown words. |
Students expressed a preference for one or more accommodations over one or more others (n=2) |
|
Bolt et al. (2011) |
In terms of degree of helpfulness, participants using certain accommodations indicated that these were most helpful: in high school, extended-time, dictionary use, and dictated response to a scribe; in college, dictated response to a scribe and word processor with spell-check. In terms of barriers to accommodations use, the largest proportion (36%) of participants indicated that underlying reasons were system-level issues, such as accessing support, specifying appropriate accommodations, and documentation of diagnosis, among others. Other barrier categories (besides systems issues) were oneself (19%)—embarrassment and failing to advocate, and others (17%)—lack of knowledge or negative attitudes. Facilitators of accommodations use, in order of proportion of participants endorsing them, included: other individuals (34%), system-level issues (32%), and self (7%). |
Kim (2012) |
Students with visual impairments expressed a preference for using oral delivery when presented by a human reader, noting that they moved more slowly through the reading test items when using either braille or magnification alone, and that they had difficulties with reading long text passages. Almost all students without disabilities reported that they were more comfortable not using read-aloud accommodations, noting that their reading speed was faster than the rate of read-aloud accommodation. |
EDUCATOR PERCEPTIONS ONLY (n=11) |
|
Educators had similarly positive or supportive attitudes about accommodations and/or modifications (n=3) |
|
Ihori (2012) |
There were no significant differences in survey response patterns of faculty participants based on being at two-year or four-year institutions, nor any differences based on being at public or private four-year institutions. That is, faculty members had similar attitudes and beliefs about students with ADHD, similar knowledge bases about legal protections for students with ADHD, and similar willingness to accommodate students with ADHD. A small proportion—10-20% or so—of the survey responses across the participant population indicated limited knowledge about aspects of accommodations. For example, about 20% indicated disagreement with accommodating students with ADHD on the response method for exams, and 25% expressed disagreement with permitting laptop, calculator, or spell checker during exams. |
Leyser et al. (2011) |
There were some demographic differences between the 1996/7 cohort and the 2006/7 cohort, namely more respondents with advanced degrees, and older mean age of respondents. No major differences were found, however, in faculty willingness to provide students with accommodations, faculty attitudes toward accommodations remaining positive over the last ten years. The findings also revealed a need for training in the area of disabilities, and a need for increased contact with the Office of Special Services (OSS). |
Lipscomb (2012) |
First of all, there were no overall differences in positivity or negativity about the accommodations or modifications that the checklist identified, although the general education teachers rated all adaptations as more effective than the special education teachers did. Specific adaptations rated significantly more highly by general educators than special educators included read-aloud and modified test grading. General educators provided responses about fewer accommodations, and the researcher suggested that this phenomenon may have been related to lack of familiarity with some accommodations listed, or perhaps a perception that some accommodations were not available. When comparing perspectives of female regular education teachers and female special education teachers, there were no apparent differences overall regarding their views of the effectiveness of the adaptations for students with LD. However, there were some perception differences about specific adaptations, including that female regular educators rated modified tests more favorably than female special educators did. Due to few female special educators participating in the study, some score differences could not be reported. Finally, comparisons between male general educators and male special educators could not be reported with reliability due to there being only two male special educators. |
Educators had varying degrees of positive or supportive attitudes about accommodations and/or modifications (n=3) |
|
Brockelmann (2011) |
The most broadly used assessment accommodations included extended-time for exams and using a private testing space, such as in the testing center, and the least commonly used assessment accommodation was alternate test format. Of the strategies rated as most effective, the assessment accommodation identified was extended-time for exams. When comparing the subset of participants who were STEM or non-STEM faculty, each group used a similar average number of strategies, but the types of strategies differed. STEM faculty members used the following significantly more frequently than non-STEM faculty members: extended-time for exams, using a private testing room, and changing the form or format of the exam—permitting read-aloud, dictated, typed, or scribed. When comparing the STEM and non-STEM faculty about their effectiveness ratings of assessment accommodations, STEM faculty members rated extended-time for exams as more effective than non-STEM faculty members rated that accommodation. |
Davis (2011) |
Educators reported that accommodations have facilitated students with disabilities demonstrating their knowledge, and that accommodations have supported students with disabilities by individualizing instruction and assessment. Educators also reported that accommodations have shown limited benefit and provided more support than needed and to the detriment of students. |
Meadows (2012) |
General education teachers had an overall more positive attitude than special education teachers toward instructional and assessment accommodations. Special education teachers had a more positive attitude, across all grade levels, toward both types of accommodations. When comparing teachers with at least masters degrees with teachers without master’s degrees, the former had more positive attitudes than the latter toward assessment accommodations. However, those with masters’ degrees had no difference in attitudes toward instructional accommodations. Teachers with at least 16 years of work experience had more positive attitudes toward all accommodations than those with less work experience. Teachers of elementary students had more positive attitudes than others toward instructional accommodations, but there were no attitude differences among teachers’ grade level clusters about assessment accommodations. Attitudes were more positive about instructional accommodations than assessment accommodations. When comparing use of five specific accommodations—extended test time, seating preference, segmenting assignments, small group instruction, and read-aloud of assessments or assignments—all teachers concurred that the most commonly offered accommodations were extended test time and read-aloud of assessments or assignments. |
Educators indicated that they had various levels of familiarity or knowledge about accommodations (n=3) |
|
Phillips et al. (2012) |
Almost one-quarter (24%) of the faculty participants reported having provided online course testing accommodations (extended-time, alternate test formats, and/or assistive technology) to students with disabilities that were verified by Disability Services, and 15% had provided online accommodations for students who self-reported their disabilities to the faculty members. Most faculty participants (53%) had substantial experience with online courses (requiring no assistance with managing technology), yet a majority of participants (54%) were uncertain about their capability to manage providing online accommodations, with only about one-third (34%) of faculty indicating that they were capable of doing so. Of those faculty members who had provided online accommodations, most indicated their perception that there had been no change in the nature or degree of student requests for accommodations throughout faculty members’ time at the institution. In fact, they indicated that students already used accommodations from their own resources, chose not to use accommodations, or chose not to request accommodations from the university. Further, some participants indicated their views that implementing universal design principles addressed students’ needs without accommodations. Recommendations from participants centered on the need of both faculty and students for ongoing institutional support regarding accommodations for online courses. |
Zhou et al. (2012) |
The participants rated themselves as having various degrees of confidence in teaching with assistive technology: about 10% were very confident, 31% were confident, 39% had some confidence, 19% had limited confidence, and about 1% had no confidence. For the assessment competency, Domain 8, the mean score was 2.47, signifying that on average the participants estimated that they had basic knowledge and skill. Participants had the lowest levels of knowledge/skill in: deaf-blindness and AT use, foundations of AT, and use of refreshable braille, use of Nemeth code translation software, and funding professional development in AT. An implication discussed was that students may not have been receiving instruction in using refreshable braille, due to their educators’ insufficient knowledge. Participants had proficiency or advanced levels of knowledge/skill in: using student data in designing instruction, using closed-circuit TV in instruction, collaborating on multidisciplinary teams, using standard braille-writers, and teaching AT to students individually or in groups. |
Zhou et al. (2011) |
Participants, who taught students with visual impairments, indicated that their levels of expertise on 55 of the 74 assistive technology (AT) competencies were significantly lower than the expected levels of expertise. Of the 6 domains of knowledge and skill, survey respondents had sufficient expertise in only the learning environments domain. Put another way, about 58% of respondents indicated less than adequate confidence in teaching assistive technology to students. Respondents indicated that they were sufficiently familiar with AT devices such as closed-circuit television (CCTV), handheld and stand magnifiers, and telescopes, as well as common technologies used by the general population of students; however, they were not appropriately expert in any other AT devices (e.g., augmented communication devices, braille note takers and writers, braille and Nemeth code translation software, personal digital assistants/PDAs, screen-readers, tactile graphics devices, talking calculators, and talking dictionaries). Further, survey respondents were limited in their knowledge of appropriate resources for improving their AT expertise. When examining participant demographics, researchers found a small positive relationship between higher numbers of years working with students with visual impairments and their expertise levels. |
Educators indicated that using accommodations benefited students beyond performance score improvements (n=1) |
|
Hodgson et al. (2012) |
Test administrators had views that the oral delivery accommodation, presented by test administrators, provided a range of benefits. In addition to supporting reading and providing access to tests, oral delivery can assist with focus when students have difficulty with testing endurance and motivation, and can decrease concentration if administrator’s reading pace differs with students’ pace. In comparison with other academic content tests, read-aloud provided during math tests differed in how it was implemented. For example, participants indicated that administration of read-aloud on math tests required more training and math content familiarity, in order to limit inadvertent pronunciation mistakes and variations in following guidelines across administrators. |
Educators indicated that they had moderate to high levels of knowledge about accommodations (n=1) |
|
Davis (2011) |
The level of knowledge of the general education teachers about accommodations was moderate to somewhat high to high overall, depending on category—presentation, response, time and scheduling, and setting. The presentation category included read-aloud, student read-aloud into recording device and play back to self, oral administration by test administrator, blank marker to keep place on test and on answer document, amplification device, and colored overlays and markers for notes on colored overlays. Response accommodations were scribe, supplemental aide, and blank graphic organizer. The time and scheduling category included testing across two days; frequent or extended breaks; and verbal, visual, or tactile reminders for staying on-task. Setting accommodations were minimizing distractions and individual administration. |
EDUCATOR AND STUDENT PERCEPTIONS (n=1) |
|
Students with disabilities and their teachers indicated students’ preference for using one accommodation package over another (n=1) |
|
Flowers et al. (2011) |
Teachers and students both reported that students preferred the computerized format with oral delivery accommodation via text-to-speech reader over the printed text format with a human reader (although the results did not support better performance in this condition). |
Table F-8. Findings for Studies Examining the Implementation and Use of Accommodations (n=13)
Authors |
Findings |
Implementation challenges and atypical use patterns affected accommodations practices (n=3) |
|
Davis (2011) |
Educators’ implementations of practices were associated with training, identity demographics, and grade levels of instruction. The participants reported they have engaged in moderate to high levels of practices which have made accommodations effective. The barriers that participants reported about using accommodations included the concern reported by students with disabilities that they felt conspicuous about using accommodations, the difficulty of class size limiting teachers’ capacity to assist all students including those with and without disabilities, limited staff and funding, limited time, teachers’ lack of understanding disabilities and appropriate accommodations, and the need for training to address implementation barriers. |
Ihori (2012) |
A small proportion of faculty participants—10-20% or so—of the survey responses across the participant population indicated limited knowledge about aspects of accommodations. For example, about 20% indicated disagreement with accommodating students with ADHD on the response method for exams, and 25% expressed disagreement with permitting laptop, calculator, or spell checker during exams. |
Phillips et al. (2012) |
Only one-fourth of faculty member participants reported that they had been asked by students to provide accommodations in online courses, and approximately two-fifths (43%) of faculty member participants reported that they had never been asked to provide accommodations to students in online courses. Accounting for the relative infrequency of being asked to provide accommodations, faculty members indicated their observations that students have already been using accommodations from their own resources, chose not to use accommodations, or chose not to request accommodations from the university. The researchers also provide a schematic about accommodations that were typically provided to students based on the nature of their disabilities; for instance, students with learning disabilities were provided extended testing time and assistive technology, among others, and students with communication disorders were provided alternate testing format. |
Common accommodations for students with visual impairments on reading included large print and extended-time (n=3) |
|
Fox (2012) |
For students with visual impairments (VI), the most commonly used accommodation in both math and reading for the three test years was large print, followed in popularity by small group, separate room (individual), and extended time. For only some students with VI, there were a few patterns of accommodations bundles in either reading or math, such as large-print and extended-time and magnification and administrator-transcription and sometimes dictated-response. Another bundle used consistently across years for some students was braille and extended-time and separate room (individual) and dictated-response and sometimes braille writer. However, from a longitudinal view of accommodations use, there were very few trends across years in the number or type of accommodations; that is, students typically might be provided specific accommodations in one year but different accommodations in another. |
Kim (2012) |
Students with visual impairments typically used the oral delivery accommodation in combination with large print, braille, and extended-time on reading assessments in South Korea. |
Smith & Amato (2012) |
Only two of five timing and scheduling accommodations were specific to students with visual impairments, though it was not often stated explicitly that these students may need such accommodations. Most states provided small group and lighting adjustment accommodations, though these were not unique for students with disabilities. Most states allowed scribes or other necessary response modifications, though it was surprising that electronic note-takers or PDAs were not more widely used. All states provided braille and large-print accommodations for students with visual impairments, but fewer allowed an abacus or talking calculator even when other students were allowed to use scratch paper. Other presentation accommodations were allowed even less frequently. The authors concluded that there was some lack of vision-specific accommodations in state manuals, which have presented challenges for students with visual impairments. |
The most common accommodation provided to students with disabilities was extended-time (n=2) |
|
Bolt et al. (2011) |
About half of the participants (N=30) received accommodations through special education and/or Section 504 services in high school, as well as in college, with the remainder accessing accommodations only at the postsecondary level. In both the high school and postsecondary levels, the rank order of commonality of accommodation category was: scheduling accommodations, setting accommodations, presentation accommodations, and response accommodations. The most common single accommodation used at both levels was extended-time, followed by individual setting. It was more common to be provided via oral delivery using a human reader in high school, and more common via computer using text-to-speech software in college. |
Lovett (2011) |
The author argued that there are four main findings that should be considered before allowing the use of extended-time testing accommodations, including that decisions about extended-time have not been made consistently, and that providing accommodations has been taking the focus away from providing interventions. The author concluded by suggesting steps that practitioners can take in order to recommend the extended-time accommodation only when appropriate. |
The oral delivery accommodation has had variations in its implementation (n=2) |
|
Hodgson et al. (2012) |
Researchers found that this state is similar to many others which have provided oral delivery using human readers on state mathematics assessments as one of the most frequent accommodations offered. The researchers found that there were variations in administration practices—some arranged small-group or individual space for providing oral delivery, and some provided oral delivery to students with similar reading pacing needs. In comparison with other academic content tests, oral delivery provided during math tests differed in how it was implemented. For example, participants indicated that administration of oral delivery on math tests required more training and math content familiarity, in order to limit inadvertent pronunciation mistakes and variations in following guidelines across administrators. In comparison with other accommodations, oral delivery was used more often than accommodations such as breaks, calculator, enlarged print, and scribe, among others. Additionally, oral delivery was provided in combination with other accommodations such as alternative setting or frequent breaks, due to the circumstances of having a person read the test aloud, rather than because those other accommodations were identified in the individualized education program (IEP) plan. |
Holmes & Silvestri (2012) |
In this literature review identifying needs of postsecondary students and the ways assistive technology (AT) is used to address them, the researchers indicated that AT for reading could include software programs with functions such as text-to-speech, optical character recognition (OCR), and synthesized speech; for writing, software functions could include speech- or voice-recognition, word-prediction, and mind-mapping and outlining. More research attention was paid to AT studies examining impacts on reading, and little or none on writing. |
Various factors complicated the provision of accommodations to students at the postsecondary level (n=1) |
|
Shinn & Ofiesh (2012) |
Fitting with the cognitive issues being reviewed, the researchers described both universal design and accommodations solutions, including for access demands, font size, text-to-speech software, and other presentation and appearance-based aspects; and for output demands, extended-time, word-processing and keyboard composition via computer access, and dictation software. The researchers presented a model for training university instructors to implement universal design and accommodations. |
Common accommodations for students with hearing impairments included sign language interpretation and extra time (n=1) |
|
Cawthon (2011) |
Findings revealed that the most common accommodations recommended for students with hearing impairments were test directions interpreted, extra time, and test items interpreted. Findings also revealed that recommendations for accommodations differed by subject (math vs. reading) and by student proficiency (high skill level vs. low skill level), but communication mode (ASL vs. Total Communication) was not a significant factor in choosing accommodations. |
Accommodations use patterns differed among students with visual impairments (n=1) |
|
Zebehazy et al. (2012) |
From among students with visual impairments who participated in the state alternate assessments in math and reading, students with more functional vision performed better overall than students using vision for some or no tasks. Students using more vision to complete tasks also received fewer accommodations, though students with less vision sometimes did not receive accommodations as well, which may present a problem of accessibility and availability of accommodations. |
Table F-9. Findings for Studies Analyzing the Validity of Accommodations or Modifications Use on Assessments (n=8)
The accommodations did not change the construct/s (n=3) |
|
Flowers et al. (2011) |
The computer administration accommodation with text-to-speech software package did not change the academic constructs of reading, science, and mathematics on the state assessment. |
Posey & Henderson (2012) |
There were no significant differences in reading skills assessment scores between the group of students with visual impairments and the group of students without disabilities. Put another way, the use of contracted braille for the test items permitted students with visual impairments to access the test and perform at a level commensurate with students without disabilities. |
Taherbhai et al. (2012) |
At the test-level, there were no significant differences between scores on the paper and pencil and online test modes, for both math and reading; that is, the online test mode did not benefit students with learning disabilities more than the paper-based testing condition. At the item-level, some individual items in both grade levels and both content areas behaved differently between the test modes. The paper-based format benefited students with disabilities on only a couple of the paper-based math items, and the online format benefited participants on a few more of the math and reading items, all at a moderate level of differential item functioning (DIF). However, the researchers note that the number of items showing these differences were fewer than might occur by chance, and item content analysis by experts indicated no bias by test modes, suggesting that the meaning of these results did not imply something important about the test format. |
The accommodations or modifications changed the construct/s (n=2) |
|
Lovett (2011) |
The extended-time accommodation changed the meaning of students’ test performance, according to this review of literature. |
Randall et al. (2011) |
The basic function calculator modification functioned differently for some items in state mathematics assessment item performance of students with disabilities and students without disabilities. On one item, students with disabilities’ performance with the calculator was higher than performance without the modification; on another item, students without disabilities performed better than students with disabilities with the calculator modification as well as without the modification. |
Construct validity was affected by other factor/s (n=2) |
|
Cho et al. (2012) |
An accommodations package (read-aloud, frequent breaks, and separate quiet setting) supported improved scores for students with disabilities on some specific items on a state math assessment; students’ ability levels affected the degree of benefit from the accommodations package. |
Scarpati et al. (2011) |
Fourteen out of 34 math items exhibited differential item functioning (DIF) when comparing scores of examinees with disabilities who used a calculator and students with disabilities who did not have any accommodations. Of these items, eight were easier for the accommodated group, and six were easier for the nonaccommodated group. Results also revealed that item difficulty and student ability level contribute to differences in performance above and beyond accommodation status. |
The manner of scoring changed the construct/s being tested (n=1) |
|
Koutsoftas & Gray (2012) |
When comparing group mean scores of students with language learning disabilities (LLD) and students without disabilities analytically, the former scored significantly lower for many elements on narrative writing, but did so for fewer elements on expository writing. Specifically, both groups scored similarly on productivity and clausal density, which researchers attributed to the complexity of the writing prompts. In other words, the wording of the instructions or questions supported students with LLD in performing a skill better. When comparing participant groups holistically, the students with LLD scored significantly lower than the students without disabilities on all six traits. This was expected, as the combination of skill measures effectively blended the individual skill strengths and weaknesses, resulting in a lower overall score. |
Table F-10. Findings for Studies Examining Accommodations in Postsecondary Settings (n=15)
Authors |
Findings |
Postsecondary student performance (n=4) |
|
Gregg (2012) |
The primary result of this literature review was that relatively few studies empirically examined effects of testing accommodations in postsecondary education and work settings. Of the 32 studies identified as relevant to accommodations for testing, 29 specifically addressed extended-time. The researcher found that extended-time supported many adolescents and adults with learning disabilities effectively. When academic content areas were specified, most of the studies pertained to reading testing, mathematics was the next-most common, and only one study examined writing performance. Other specific effects of the accommodations noted during testing were not reported by the researcher. |
Gregg & Nelson (2012) |
This meta-analysis examined nine studies, ranging from 1986 to 2006, yet empirical conclusions pertaining to extended-time drew from fewer studies. Three studies indicated that youth with learning disabilities scored significantly higher with extended-time than without, with medium to large effect sizes. Two studies found that youth without disabilities also scored moderately higher with accommodations, with small to large effect sizes. Two studies supported the differential boost hypothesis, indicating the benefits from extended-time were greater for youth with learning disabilities than youth without disabilities. |
Holmes & Silvestri (2012) |
The results of this literature review indicated that text-to-speech supported reading, benefiting comprehension, reading rate, and task persistence. The degree of benefit in some areas depended on the degree of reading disabilities, in that those with more difficulties exhibited improvements more than those with fewer difficulties. For instance, people with phonological processing challenges were aided more than others. Also, two studies in the literature review indicated that word-processing assisted writing outputs for postsecondary students, improving spelling error detection, increasing GPAs, and changed course completion to a rate similar to students without disabilities. |
Schmitt et al. (2012) |
The degree of score improvement across the accommodation conditions was not consistent for all participants. The student with the lowest comprehension skills, specifically oral fluency, demonstrated the most benefit of the three participants when using the reading pen, in both conditions. However, when using the reading pen for vocabulary definition, she mostly scored lower than when using the read-aloud only tool setting. The other two participants’ comprehension skills actually worsened when using the reading pen than when not doing so, which the researchers attributed to those participants having difficulties manipulating the reading pen and disrupting their reading fluency. |
Postsecondary faculty perceptions (n=4) |
|
Brockelmann (2011) |
The most broadly used assessment accommodations included extended-time for exams and using a private testing space, such as in the testing center, and the least commonly used assessment accommodation was alternate test format. Of the strategies rated as most effective, the assessment accommodation identified was extended-time for exams. When comparing the subset of participants who were STEM or non-STEM faculty, each group used a similar average number of strategies, but the types of strategies differed. STEM faculty members used the following significantly more frequently than non-STEM faculty members: extended-time for exams, using a private testing room, and changing the form or format of the exam—permitting read-aloud, dictation, word-processing, and scribing. When comparing the STEM and non-STEM faculty about their effectiveness ratings of assessment accommodations, STEM faculty members rated extended-time for exams as more effective than non-STEM faculty members rated that accommodation. |
Ihori (2012) |
There were no significant differences in survey response patterns of faculty participants based on being at two-year or four-year institutions, nor any differences based on being at public or private four-year institutions. That is, faculty members had similar attitudes and beliefs about students with ADHD, similar knowledge bases about legal protections for students with ADHD, and similar willingness to accommodate students with ADHD. A small proportion—10-20% or so—of the survey responses across the participant population indicated limited knowledge about aspects of accommodations. For example, about 20% indicated disagreement with accommodating students with ADHD on the response method for exams, and 25% expressed disagreement with permitting laptop, calculator, or spell checker during exams. |
Phillips et al. (2012) |
Almost one-quarter (24%) of the faculty participants reported having provided online course testing accommodations (extended-time, alternate test formats, and/or assistive technology) to students with disabilities that were verified by Disability Services, and 15% had provided online accommodations for students who self-reported their disabilities to the faculty members. Most faculty participants (53%) had substantial experience with online courses (requiring no assistance with managing technology), yet a majority of participants (54%) were uncertain about their capability to manage providing online accommodations, with only about one-third (34%) of faculty indicating that they were capable of doing so. Of those faculty members who had provided online accommodations, most indicated their perception that there had been no change in the nature or degree of student requests for accommodations. In fact, they indicated that students already used accommodations from their own resources, chose not to use accommodations, or chose not to request accommodations from the university. Further, some participants indicated their views that implementing universal design principles addressed students’ needs without accommodations. Recommendations from participants centered on the need of both faculty and students for ongoing institutional support regarding accommodations for online courses. |
Posey & Henderson (2012) |
Educators provided feedback in the form of suggestions for improving test administration instructions, such as consistent page numbering, as well as for improving the construction of the test, such as prompts related to changes in item types and formats. |
Postsecondary student perceptions (n=3) |
|
Bolt et al. (2011) |
In terms of degree of helpfulness, participants using certain accommodations indicated that these were most helpful: in high school, extended-time, dictionary use, and dictated response to a scribe; in college, dictated response to a scribe, and word processor with spell-check. In terms of barriers to accommodations use, the largest proportion (36%) of participants indicated that underlying reasons were system-level issues, such as accessing support, specifying appropriate accommodations, and documentation of diagnosis, among others. Other barrier categories (besides systems issues) were oneself (19%)—embarrassment and failing to advocate, and others (17%)—lack of knowledge or negative attitudes. Facilitators of accommodations use, in order of proportion of participants endorsing them, included other individuals (34%), system-level issues (32%), and self (7%). |
Makeham & Lee (2012) |
The results were primarily reported as categorized qualitative data about students’ perceptions. All participants indicated social discomfort, including embarrassment, when offered a human exam reader. In comparison with a human reader, many participants stated a preference for iPod aural presentation. Three examinees used the accommodation during math exams and three examinees used the accommodation during course exams requiring written essays. Two of the three math examinees were also the two students reporting the greatest benefit with the iPod. Compared with having only printed exams, they noted that this recorded read-aloud exam supported their needs for understanding what was being asked of them by the additional cues of intonation and pacing. Three of the students reported little or no benefit from using the iPod-presented read-aloud, compared with printed exam alone; their comments indicated that this accommodation (oral delivery) via any medium would not be helpful to them. |
Schmitt et al. (2012) |
There seemed to be an inverse relationship between actual benefits and enjoyment of using the reading pen: the lowest-skilled participant indicated a lesser degree of satisfaction than the other two participants. |
Postsecondary accommodations practices/uses (n=3) |
|
Bolt et al. (2011) |
About half of the participants (N=30) received accommodations through special education and/or Section 504 services in high school, as well as in college, with the remainder accessing accommodations only at the postsecondary level. In both the high school and postsecondary levels, the rank order of commonality of accommodation category was: scheduling accommodations, setting accommodations, presentation accommodations, and response accommodations. The most common single accommodation used at both levels was extended-time, followed by individual setting. It was more common to be provided via oral delivery using a human reader in high school, and more common via computer using text-to-speech software in college. |
Holmes & Silvestri (2012) |
In this literature review identifying needs of postsecondary students and the ways assistive technology (AT) is used to address them, the researchers indicated that AT for reading could include software programs with functions such as text-to-speech, optical character recognition (OCR), and synthesized speech; for writing, software functions could include: speech- or voice-recognition, word-prediction, and mind-mapping and outlining. More research attention was paid to AT studies examining impacts on reading, and little or none on writing. |
Shinn & Ofiesh (2012) |
Fitting with the cognitive issues being reviewed, the researchers described both universal design and accommodations solutions: for access demands, font size, text-to-speech software, and other presentation and appearance-based aspects; and for output demands, extended-time, word-processing and keyboard composition via computer access, and dictation software. The researchers presented a model for training university instructors to implement universal design and accommodations. |
Postsecondary accommodations validity (n=1) |
|
Posey & Henderson (2012) |
There were no significant differences in reading skills assessment scores between the group of students with visual impairments and the group of students without disabilities. Put another way, the use of contracted braille for the test items permitted students with visual impairments to access the test and perform at a level commensurate with students without disabilities. |
Table F-11. Findings for Studies Examining Accommodations for Mathematics Assessments (n=28)
Authors |
Findings |
MATHEMATICS PERFORMANCE EFFECTS (n=12) |
|
Students with Disabilities (n=7) |
|
Accommodations did not support improved math performance for students with disabilities (n=3) |
|
Bouck et al. (2011) |
The voice-input, speech-output (VISO) calculator, using aspects of speech-recognition and dictated-response accommodations, required more time and more item attempts to complete calculations on math assessment items than did the typical strategies of students with visual impairments. |
Cawthon et al. (2012) |
Linguistic complexity had impacts on both math and reading items; its relative effect for math items was rated as lower than that of reading items, indicating that students with learning disabilities had comparatively less difficulty with math on average. Accommodations in all four categories of presentation, response, setting, and timing were not associated with any differences in math item performance for students with learning disabilities. There were no interaction effects of linguistic complexity and accommodation types on math items, suggesting that the effect of linguistic complexity did not depend on the accommodations received by students with learning disabilities. |
Cawthon et al. (2011) |
No significant differences were found in overall performance between the written English for items and items presented via American sign language (ASL). ASL exposure was largely not a significant predictor of performance. |
Accommodations had mixed results on math assessments for students with disabilities (n=2) |
|
Lazarus et al. (2012) |
On average, performance on 5 math items was not significantly different with the use of the oral delivery accommodation, presented by a human reader, than performance on the other, similar, 5 items without the oral delivery accommodation. When reviewed individually, 7 students scored higher with the accommodation, 8 students scored higher without the accommodation, and 9 students scored the same. |
Scarpati et al. (2011) |
On state math assessments, the calculator accommodation provided a differential boost on some items for students with disabilities, whereas not using accommodations for some items provided a differential boost for students with disabilities. |
Accommodation set supported improved math performance for students with disabilities more than another accommodation set (n=1) |
|
Flowers et al. (2011) |
Results showed no differences in effect sizes between grade levels, suggesting that there were no differences across grade/school levels. There were differences in effect sizes between academic content, with larger effect sizes found for reading than for math or science. There were small to moderate differences between paper-and-pencil test and computer-based test conditions that tended to favor the paper-and-pencil test condition. The researchers noted that scores were generally lower in the computer-based testing condition, but that this trend may have been due to extraneous factors. DIF analyses showed that items did not favor either group more frequently. [Packages: computerized format with oral delivery accommodation via text-to-speech software vs. print text format with human reader] |
Accommodations supported improved math performance for students with disabilities (n=1) |
|
Zhang et al. (2012) |
Grade 3 students with math disabilities scored significantly better on geometry assessment items with the visual chunking accommodation—which supported visual memory—than without it. |
All Students (n=5) |
|
Accommodation did not support improved math performance for either students with disabilities or students without disabilities (n=2) |
|
Engelhard et al. (2011) |
Results showed that math resource guides, providing definitions of academic terms as well as graphics, were not an effective accommodation for students with or without disabilities. |
Patterson et al. (2011) |
The researchers demonstrated the feasibility, at least on a small scale, of shifting the mode from paper to electronic computer-based format. For the youth and adult test-takers using paper-based then computerized tests, there were no significant differences in final test scores. In other words, the 25 test-takers using NimbleTools on computerized tests scored higher than test-takers had on the accommodated paper tests, although the difference was not statistically significant. |
Enhancements supported improved math performance for all students (n=1) |
|
Engelhard et al. (2011) |
Calculator use seemed to result in a small increase in the mean scores of students with and without disabilities in both age groups in most cases. |
Accommodation provided differential benefits in math performance scores of students with disabilities compared to those of students without disabilities (n=1) |
|
Gregg & Nelson (2012) |
This meta-analysis examined nine studies, ranging from 1986 to 2006, yet empirical conclusions pertaining to extended-time drew from fewer studies. Three studies indicated that youth with learning disabilities scored significantly higher on assessments of math, reading, and writing when using extended-time than without, with medium to large effect sizes. Two studies found that youth without disabilities also scored moderately higher with accommodations, with small to large effect sizes. Two studies supported the differential boost hypothesis, indicating the benefits from extended-time were greater for youth with learning disabilities than youth without disabilities. |
A unique modification supported improvements differentially for a subset of students with disabilities who were eligible for modified math assessments (n=1) |
|
Kettler et al. (2011) |
Various modifications—including simplified language, removal of response option, graphic support, and reorganization of layout—were analyzed for reliability. When the modifications were examined separately, for the sets of math and reading assessment items, the modification of shortening the item stem differentially supported students with disabilities who were identified as eligible for modified assessments (in comparison to students with disabilities not eligible for modified assessments and in comparison to students without disabilities). |
PERCEPTIONS OF ACCOMMODATIONS IN MATHEMATICS (n=6) |
|
Students/test-takers only (n=4) |
|
Students indicated that using accommodations and/or modifications benefited them in terms of math performance score (n=2) |
|
Beddow (2011) |
The survey findings included that all students comprehended the modified items better than the standard items. Students without IEPs comprehended items (both standard and modified forms) better than the students with IEPs. All students reported that they had to work less to answer modified items than standard items. Similarly, students without IEPs indicated a lower degree of cognitive load than students with IEPs indicated, for both modified and standard items. Students also offered their perceptions of their having learned the content, and confidence in being correct on the items. |
Lazarus et al (2012) |
Most of the students (61%) reported that using oral delivery reduced stress associated with test-taking, and/or helped them arrive at correct answers on the mathematics test, yet only 7 of the 24 students scored higher when using this accommodation. |
Students indicated that using accommodations benefited them beyond math performance score improvements (n=1) |
|
Patterson et al. (2011) |
Survey results indicated that 61% of youth and adult participants preferred to take the GED Tests via computer, and that 61% preferred to use NimbleTools rather than be tested on paper. Also, about 75% of participants indicated that it was easy to use NimbleTools. |
Students with disabilities expressed preference for using one version of an accommodation over another on the math test (n=1) |
|
Zhang et al. (2012) |
Grade 3 students with math disabilities reported a preference for using visual chunking representation on geometry assessment items, and reported that the items were easier when using visual chunking. |
Educators only (n=1) |
|
Educators indicated that using accommodations benefited students beyond math performance score improvements (n=1) |
|
Hodgson et al. (2012) |
Test administrators had views that the oral delivery accommodation, presented by test administrators, provided a range of benefits. In addition to supporting reading and providing access to tests, oral delivery can assist with focus when students have difficulty with testing endurance and motivation, and can decrease concentration if administrator’s reading pace differs with students’ pace. In comparison with other academic content tests, read-aloud provided during math tests differed in how it was implemented. For example, participants indicated that administration of read-aloud on math tests required more training and math content familiarity, in order to limit inadvertent pronunciation mistakes and variations in following guidelines across administrators. |
Students/Test-takers and Educators (n=1) |
|
Students with disabilities and their teachers indicated students’ preference for using one accommodation package over another on the mathematics tests (n=1) |
|
Flowers et al. (2011) |
Teachers and students both reported that students preferred the computer-based test condition (although the results did not support better performance in this condition) over the print format condition. |
ACCOMMODATIONS USES AND PRACTICES ON MATHEMATICS ASSESSMENTS (n=5) |
|
A common math assessment accommodation provided to students with disabilities was oral delivery (n=1) |
|
Flowers et al. (2011) |
The researchers found that this state is similar to many others in which oral delivery has been provided using human readers on state mathematics assessments as one of the most frequent accommodations offered. In comparison with other accommodations, oral delivery was used more often than accommodations such as breaks, calculator, enlarged print, and scribe, among others. |
The oral delivery accommodation on math assessments has had variations in its manner of administration (n=1) |
|
Flowers et al. (2011) |
The researchers found that there were variations in administration practices—some arranged small-group or individual space for providing oral delivery via human readers, and some provided oral delivery to students with similar reading pacing needs. Additionally, oral delivery was provided in combination with other accommodations such as alternative setting or frequent breaks, due to the circumstances of having a person read the test aloud, rather than because those other accommodations were identified in the individualized education program (IEP) plan. |
The oral delivery accommodation was implemented differently in math than in other content areas (n=1) |
|
Flowers et al. (2011) |
In comparison with other academic content tests, oral delivery provided during math tests differed in how it was implemented. For example, participants indicated that administration of oral delivery on math tests required more training and math content familiarity, in order to limit inadvertent pronunciation mistakes and variations in following guidelines across administrators. |
Common accommodations for students with visual impairments on math assessments included large print, setting-based, and extended-time (n=1) |
|
Fox (2012) |
For students with visual impairments (VI), the most commonly used accommodation in both math and reading for the three test years was large print, followed in popularity by small group, separate room (individual), and extended time. For only some students with VI, there were a few patterns of accommodations bundles in either reading or math, such as large-print and extended-time and magnification and administrator-transcription and sometimes dictated-response. Another bundle used consistently across years for some students was braille and extended-time and separate room (individual) and dictated-response and sometimes braille writer. However, from a longitudinal view of accommodations use, there were very few trends across years in the number or type of accommodations; that is, students typically might be provided specific accommodations in one year but different accommodations in another. |
This subset of students with visual impairments had unusual accommodations use patterns (n=1) |
|
Zebehazy et al. (2012) |
From among students with visual impairments who participated in the state alternate assessments in math (and reading), students with more functional vision performed better overall than students using vision for some or no tasks. Students using more vision to complete tasks also received fewer accommodations, though students with less vision sometimes did not receive accommodations as well, which may present a problem of accessibility and availability of accommodations. |
MATHEMATICS ASSESSMENT VALIDITY (n=5) |
|
Construct validity was affected by other factor/s (n=2) |
|
Cho et al. (2012) |
An accommodations package (read-aloud, frequent breaks, and separate quiet setting) supported improved scores for students with disabilities on some specific items on a state math assessment; students’ ability levels affected the degree of benefit from the accommodations package. |
Scarpati et al. (2011) |
Fourteen out of 34 items exhibited differential item functioning (DIF) when comparing scores of examinees with disabilities who used a calculator and students with disabilities who did not have any accommodations. Of these items, eight were easier for the accommodated group, and six were easier for the nonaccommodated group. Results also revealed that item difficulty and student ability level contribute to differences in performance above and beyond accommodation status. |
The accommodations did not change the math construct/s being tested (n=2) |
|
Flowers et al. (2011) |
The computer administration accommodation with text-to-speech software package (when compared with the print text format presented by human reader) did not change the academic constructs of reading, science, and mathematics on the state assessment. |
Taherbhai et al. (2012) |
At the test-level, there were no significant differences between scores on the paper and pencil and online test modes, for both math and reading; that is, the online test mode did not benefit students with learning disabilities (LD) more than the paper-based testing condition. At the item-level, some individual items in both grade levels and both content areas behaved differently between the test modes. The paper-based format benefited students with LD on only a couple of the paper-based math items, and the online format benefited students with LD on a few more of the math items, all at a moderate level of differential item functioning (DIF). However, the researchers note that the number of items showing these differences were fewer than might occur by chance, and item content analysis by experts indicated no bias by test modes, suggesting that the meaning of these results did not imply something important about the test format. |
The accommodations or modifications changed the math construct/s (n=1) |
|
Randall et al. (2011) |
Students with disabilities scored lower as a group than students without disabilities across all conditions. All students separately using the basic function calculator modification, and all students using the math resource guide modification (providing key definitions and examples as well as graphics) scored better than those taking the standard test, with no significant differences between groups across items. |
Table F-12. Findings for Studies Examining Accommodations for Reading Assessments (n=26)
Authors |
Findings |
|
READING PERFORMANCE EFFECTS (n=11) |
||
Students with Disabilities (n=6) |
||
Accommodations had mixed results on reading assessments for students with disabilities (n=2) |
||
Cawthon et al. (2012) |
Linguistic complexity had impacts on both reading and math items; its relative effect for reading items was rated as higher than that of math items, indicating that students with learning disabilities had comparatively more difficulty with reading on average. Accommodations in two categories—namely presentation and setting—were associated with differences in reading item performance for students with learning disabilities; specifically, students with disabilities using these accommodation types had lower scores than students with learning disabilities not using accommodations. However, response accommodations and timing accommodations were not associated with differences in reading performance for students with learning disabilities. There were no interaction effects of linguistic complexity and accommodation types on reading items, suggesting that the effect of linguistic complexity did not depend on the accommodations received by students with learning disabilities. |
|
Schmitt et al. (2012) |
The degree of score improvement across the accommodation conditions was not consistent for all participants. The student with the lowest comprehension skills, specifically oral fluency, demonstrated the most benefit of the three participants when using the reading pen, in both conditions. However, when using the reading pen for vocabulary definition, she mostly scored lower than when using the oral delivery-only tool setting. The other two participants’ comprehension skills actually worsened when using the reading pen than when not doing so, which the researchers attributed to those participants having difficulties manipulating the reading pen and disrupting their reading fluency. |
|
Accommodations supported improved reading performance for students with disabilities (n=2) |
||
Gregg (2012) |
The researcher reported in this literature review that extended-time was shown to support youth and adults with learning disabilities. |
|
Holmes & Silvestri (2012) |
The results of this literature review indicated that text-to-speech supported reading, benefiting comprehension, reading rate, and task persistence. The degree of benefit in some areas depended on the degree of reading disabilities, in that those with more difficulties exhibited improvements more than those with fewer difficulties. For instance, people with phonological processing challenges were aided more than others. |
|
Accommodation set supported improved reading performance for students with disabilities more than another accommodation set (n=1) |
||
Flowers et al. (2011) |
Results showed no differences in effect sizes between grade levels, suggesting that there were no differences across grade/school levels. There were differences in effect sizes between academic content, with larger effect sizes found for reading than for math or science. There were small to moderate differences between paper-and-pencil test and computer-based test conditions that tended to favor the paper-and-pencil test condition. The researchers noted that scores were generally lower in the computer-based testing condition, but that this trend may have been due to extraneous factors. DIF analyses showed that items did not favor either group more frequently. (Packages: computerized format with oral delivery accommodation via text-to-speech software vs. print text format with human reader) |
|
Accommodations did not support improved reading performance for students with disabilities (n=1) |
||
Cawthon et al. (2011) |
No significant differences were found in overall reading performance between the written English for items and items presented via American sign language (ASL). ASL exposure was largely not a significant predictor of performance. |
|
All Students (n=5) |
||
Accommodations package supported improved scores for all students in an equal manner (n=1) |
||
Feldman et al. (2011) |
Results also showed that students with disabilities performed significantly worse than students without disabilities on the test. All students performed better on reading items when given testing accommodations, and no interactions were found between groups and conditions (suggesting that students with disabilities and students without disabilities benefitted equally from accommodations). |
|
Accommodation supported improvements differentially in reading performance scores of students with disabilities compared to those of students without disabilities (n=1) |
||
Gregg & Nelson (2012) |
This meta-analysis examined nine studies, ranging from 1986 to 2006, yet empirical conclusions pertaining to extended-time drew from fewer studies. Three studies indicated that youth with learning disabilities scored significantly higher on assessments and other testing for math, reading, and writing when using extended-time than without, with medium to large effect sizes. Two studies found that youth without disabilities also scored moderately higher with accommodations, with small to large effect sizes. Two studies supported the differential boost hypothesis, indicating the benefits from extended-time were greater for youth with learning disabilities than youth without disabilities. |
|
A unique modification supported differential benefits for a subset of students with disabilities who were eligible for modified reading assessments (n=1) |
||
Kettler et al. (2011) |
Various modifications—including simplified language, removal of response option, graphic support, and reorganization of layout—were analyzed for reliability. When the modifications were examined separately, for the sets of math and reading assessment items, the modification of shortening the item stem differentially benefited students with disabilities who were identified as eligible for modified assessments. When the modifications were examined separately, for the sets of reading assessment items, the modification of adding graphics did not differentially benefit students with disabilities who were identified as eligible for modified reading assessments (in comparison to students with disabilities not eligible for modified assessments and in comparison to students without disabilities). |
|
Accommodations package supported improved scores for students with disabilities (n=1) |
||
Kim (2012) |
Students with visual impairments scored significantly better when using the read-aloud accommodation, presented by an human reader, along with other accommodations than when using other accommodations alone, on Korean reading assessment items, along with other accommodations than when using other accommodations alone. Students without disabilities scored lower when using read-aloud accommodations than when not doing so, although this difference did not reach statistical significance. |
|
Accommodation did not support improved scores for students with disabilities more than the paper assessment format (n=1) |
||
Srivastava & Gray (2012) |
Students without disabilities scored significantly higher than students with language-learning disabilities (LLD). The scores of students without disabilities were not significantly different between testing conditions. The students with LLD experienced the same pattern—no score differences between test formats. This was an unexpected result, as it was hypothesized that the computerized format with hyperlinked vocabulary definitions would increase students’ cognitive load. The researchers reviewed possible factors related to the finding, as well as the observation that students with LD did not often stop reading and review hyperlinked text. The mean passage-reading times and item response times across testing conditions did not differ significantly between students with and without LD, although students with LD tended to be somewhat slower. |
|
ACCOMMODATIONS USES AND PRACTICES ON READING ASSESSMENTS (n=7) |
||
Common accommodations for students with visual impairments on reading assessments included large print and extended-time (n=2) |
||
Fox (2012) |
For students with visual impairments (VI), the most commonly used accommodation in both math and reading for the three test years was large print, followed in popularity by small group, separate room (individual), and extended time. For only some students with VI, there were a few patterns of accommodations bundles in either reading or math, such as large-print and extended-time and magnification and administrator-transcription and sometimes dictated-response. Another bundle used consistently across years for some students was braille and extended-time and separate room (individual) and dictated-response and sometimes braille writer. However, from a longitudinal view of accommodations use, there were very few trends across years in the number or type of accommodations; that is, students typically might be provided specific accommodations in one year but different accommodations in another. |
|
Kim (2012) |
Students with visual impairments typically used the oral delivery accommodation presented by a human reader in combination with large print, braille, and extended-time on reading assessments in South Korea. |
|
The oral delivery accommodation has had variations in its manner of administration during reading assessments (n=2) |
||
Flowers et al. (2011) |
The researchers found that there were variations in administration practices—some arranged small-group or individual space for providing oral delivery via human readers, and some provided oral delivery to students with similar reading pacing needs. Additionally, oral delivery was provided in combination with other accommodations such as alternative setting or frequent breaks, due to the circumstances of having a person read the test aloud, rather than because those other accommodations were identified in the individualized education program (IEP) plan. |
|
Holmes & Silvestri (2012) |
In this literature review identifying needs of postsecondary students and the ways assistive technology (AT) is used to address them, the researchers indicated that AT for reading assessments could include software programs with functions such as text-to-speech, optical character recognition (OCR), and synthesized speech. More research attention was paid to AT studies examining impacts on reading, and little or none on writing. |
|
A common reading assessment accommodation provided to students with disabilities was oral delivery (n=1) |
||
Flowers et al. (2011) |
The researchers found that this state is similar to many others in which oral delivery has been provided using human readers on state reading assessments as one of the most frequent accommodations offered. In comparison with other accommodations, oral delivery was used more often than accommodations such as breaks, calculator, enlarged print, and scribe, among others. |
|
Common categories of reading assessment accommodations provided to youth with learning disabilities include presentation and timing (n=1) |
||
Gregg (2012) |
In this literature review, the researcher identified the following accommodations for use during reading tests: presentation—oral delivery via text-to-speech (TTS) or human reader (but qualifying that attention needs to be paid to ensuring that reading construct has not changed); timing/scheduling—extended-time, frequent breaks, unlimited time, and testing over multiple days. Only one study about read-aloud during reading testing was identified. |
|
This subset of students with visual impairments had unusual accommodations use patterns (n=1) |
||
Zebehazy et al. (2012) |
From among students with visual impairments who participated in the state alternate assessments in reading (and math), students with more functional vision performed better overall than students using vision for some or no tasks. Students using more vision to complete tasks also received fewer accommodations, though students with less vision sometimes did not receive accommodations as well, which may present a problem of accessibility and availability of accommodations. |
|
PERCEPTIONS OF ACCOMMODATIONS IN READING (n=5) |
||
Students/test-takers only (n=4) |
||
Students expressed a preference for one or more accommodations over one or more others (n=1) |
||
Kim (2012) |
Students with visual impairments expressed a preference for using oral delivery accommodation when presented by a human reader, noting that they moved more slowly through the test items when using either braille or magnification alone, and that they had difficulties with reading long text passages. Almost all students without disabilities reported that they were more comfortable not using read-aloud accommodations, noting that their reading speed was faster than the rate of read-aloud accommodation. |
|
Students indicated that using accommodations benefited them beyond performance score improvements (n=1) |
||
Feldman et al. (2011) |
Results revealed that no significant differences existed between students with disabilities and students without disabilities in motivation, positive regard, and anxiety. Students with disabilities displayed significantly lower mean scores for self-efficacy on the pretest questionnaire than students without disabilities. Finally, results indicated that accommodations had an effect on test-related thoughts and attitudes, regardless of disability status. For example, students who received accommodations showed larger increases between the pre- and post-test on measures of self-efficacy than students who did not receive accommodations. For students with disabilities, receiving accommodations appeared to increase motivation to work hard, whereas for students without disabilities this was not the case. |
|
Student perceptions were mixed about the accommodations studied (n=1) |
||
Schmitt et al. (2012) |
There seemed to be an inverse relationship between actual benefits and enjoyment of using the reading pen: the lowest-skilled participant indicated a lesser degree of satisfaction than the other two participants. |
|
Educators only (n=1) |
||
Educators recommended improvements in test administration instructions in order to ensure appropriate supports including accommodations were provided (n=1) |
||
Posey & Henderson (2012) |
Educators provided feedback in the form of suggestions for improving test administration instructions, such as consistent page numbering, as well as for improving the construction of the test, such as prompts related to changes in item types and formats. |
|
Students/Test-takers and Educators (n=1) |
||
Students with disabilities and their teachers indicated students’ preference for using one accommodation package over another on the reading tests (n=1) |
||
Flowers et al. (2011) |
Teachers and students both reported that students preferred the computer-based test condition (although the results did not support better performance in this condition) over the print format condition. |
|
READING ASSESSMENT VALIDITY (n=3) |
||
The accommodations did not change the reading construct/s being tested (n=3) |
||
Flowers et al. (2011) |
The computer administration accommodation with text-to-speech software package (when compared with the print text format presented by human reader) did not change the academic constructs of reading, science, and mathematics on the state assessment. |
|
Posey & Henderson (2012) |
There were no significant differences in reading skills assessment scores between the group of students with visual impairments and the group of students without disabilities. Put another way, the use of contracted braille for the test items permitted students with visual impairments to access the test and perform at a level commensurate with students without disabilities. |
|
Taherbhai et al. (2012) |
At the test-level, there were no significant differences between scores on the paper and pencil and online test modes, for both math and reading; that is, the online test mode did not benefit students with learning disabilities (LD) more than the paper-based testing condition. At the item-level, some individual items in both grade levels and both content areas behaved differently between the test modes. The online format benefited students with LD on a few more of the reading items, all at a moderate level of differential item functioning (DIF). However, the researchers note that the number of items showing these differences were fewer than might occur by chance, and item content analysis by experts indicated no bias by test modes, suggesting that the meaning of these results did not imply something important about the test format. |
|
Table F-13. Findings for Studies Examining Accommodations for Science Assessments (n=9)
Authors |
Findings |
|
SCIENCE PERFORMANCE EFFECTS (n=3) |
||
All Students (n=2) |
||
Enhancement supported improved science performance for all—students with disabilities as well as students without disabilities (n=1) |
||
Kettler et al. (2012) |
All students’ scores on enhanced tests averaged about 2 points higher than on the unenhanced form, and differences by participant groups were similar, indicating no differential benefits in total score for students with or without disabilities. Enhancements which seemed beneficial included shorter item stems, and enhancements that did not seem beneficial included bulleted text and simplified graphics, according to the specific items which had those enhancements. |
|
Accommodation supported improved science assessment performance of all students (n=1) |
||
Shelton (2012) |
Students using oral delivery accommodations, via audio recording, scored a higher total score than students not using read-aloud for one of the science content modules, but no difference in scores for the other science content module tests. When controlling for learning disability status, there were no score differences in any of the modules. |
|
Students with Disabilities (n=1) |
||
Accommodation set supported improved science performance for students with disabilities more than another accommodation set (n=1) |
||
Flowers et al. (2011) |
Assessment results comparisons for accommodations packages showed no differences in effect sizes between grade levels, suggesting that there were no differences across grade/school levels. There were differences in effect sizes between academic content, with larger effect sizes found for reading than for math or science. There were small to moderate differences between paper-and-pencil test and computer-based test conditions that tended to favor the paper-and-pencil test condition. The researchers noted that scores were generally lower in the computer-based testing condition, but that this trend may have been due to extraneous factors. DIF analyses showed that items did not favor either group more frequently. [Packages: computerized format with oral delivery accommodation via text-to-speech software vs. print text format with human reader] |
|
PERCEPTIONS OF ACCOMMODATIONS IN SCIENCE (n=3) |
||
Students/test-takers (n=2) |
||
Students indicated that using enhancements benefited them in terms of performance score (n=1) |
||
Kettler et al. (2012) |
The test-takers mostly indicated that the enhancements (accommodations or modifications) seemed to decrease the difficulty of testing, but when viewing specific original items and enhanced items, they indicated that each item had a similar level of difficulty. |
|
Students indicated that using accommodations benefited them beyond performance score improvements (n=1) |
||
Shelton (2012) |
Students indicated on surveys about their generally positive perceptions about the oral delivery testing condition. An example survey question asked about participants’ use of oral delivery, specifically of listening to the characters explain the problem. Most test-takers (87%) indicated that they had done so to varying degrees from very much to very little, and only 13% responded that they did not do so at all. Another survey item inquired about the degree to which the characters speaking was distracting; 34% responded that they disagreed and 22% responded that they strongly disagreed with that notion, and about 27% indicated a neutral response about distractedness. Only 17% indicated that they were distracted by the characters speaking. Students with learning disabilities tended to have a more positive perception of hearing the segments of characters speaking, and tended not to find them distracting but rather useful to form their test answers. |
|
Students/Test-takers and Educators (n=1) |
||
Students with disabilities and their teachers indicated students’ preference for using one accommodation package over another on the science tests (n=1) |
||
Flowers et al. (2011) |
Teachers and students both reported that students preferred the computer-based test condition (although the results did not support better performance in this condition) over the print format condition. |
|
ACCOMMODATIONS USES AND PRACTICES ON SCIENCE ASSESSMENTS (n=2) |
||
A common accommodation provided to students with disabilities was oral delivery (n=1) |
||
Flowers et al. (2011) |
The researchers found that this state is similar to many others in which oral delivery has been provided using human readers on state science assessments as one of the most frequent accommodations offered. In comparison with other accommodations, oral delivery was used more often than accommodations such as breaks, calculator, enlarged print, and scribe, among others. |
|
The oral delivery accommodation has had variations in its manner of administration (n=1) |
||
Flowers et al. (2011) |
The researchers found that there were variations in administration practices—some arranged small-group or individual space for providing oral delivery via human readers, and some provided oral delivery to students with similar reading pacing needs. Additionally, oral delivery was provided in combination with other accommodations such as alternative setting or frequent breaks, due to the circumstances of having a person read the test aloud, rather than because those other accommodations were identified in the individualized education program (IEP) plan. |
|
SCIENCE ASSESSMENT VALIDITY (n=1) |
||
The accommodations DID NOT change the reading construct/s being tested (n=1) |
||
Flowers et al. (2011) |
The computer administration accommodation with text-to-speech software package (when compared with the print text format presented by human reader) did not change the academic constructs of reading, science, and mathematics on the state assessment. |
|
Table F-14. Findings for Studies Examining Accommodations for Writing Assessments (n=5)
Authors |
Findings |
|
WRITING PERFORMANCE EFFECTS (n=4) |
||
Students with Disabilities (n=3) |
||
Accommodation supported improved writing performance for students with disabilities (n=2) |
||
Gregg (2012) |
The researcher noted only one study about writing performance, which indicated that extended-time was effective in supporting adult basic education students. |
|
Holmes & Silvestri (2012) |
The results of this literature review highlighted in two studies indicated that word-processing assisted writing outputs for postsecondary students, improving spelling error detection, increasing GPAs, and changed course completion to a rate similar to students without disabilities. |
|
Accommodation neither supported nor failed to support improved writing performance scores of students with disabilities (n=1) |
||
Gregg (2012) |
In this literature review, the researcher noted that word-processing has had inconclusive effects during writing testing for adult basic education students with learning disabilities. |
|
All Students (n=1) |
||
Accommodation provided differential benefits in writing performance scores of students with disabilities compared to those of students without disabilities (n=1) |
||
Gregg & Nelson (2012) |
This meta-analysis examined nine studies, ranging from 1986 to 2006, yet empirical conclusions pertaining to extended-time drew from fewer studies. Three studies indicated that youth with learning disabilities scored significantly higher on assessments and other testing for math, reading, and writing when using extended-time than without, with medium to large effect sizes. Two studies found that youth without disabilities also scored moderately higher with accommodations, with small to large effect sizes. Two studies supported the differential boost hypothesis, indicating the benefits from extended-time were greater for youth with learning disabilities than youth without disabilities. |
|
ACCOMMODATIONS USES AND PRACTICES ON WRITING ASSESSMENTS (n=1) |
||
The oral delivery accommodation has had variations in its implementation (n=1) |
||
Holmes & Silvestri (2012) |
In this literature review identifying needs of postsecondary students and the ways assistive technology (AT) is used to address them, the researchers indicated that AT for writing could include software programs with functions such as speech- or voice-recognition, word-prediction, and mind-mapping and outlining. More research attention was paid to AT studies examining impacts on reading, and little or none on writing. |
|
WRITING ASSESSMENT VALIDITY (n=1) |
||
The manner of scoring writing tests and assessments changed the reading construct/s being tested (n=1) |
||
Koutsoftas & Gray (2012) |
When comparing group mean scores of students with language learning disabilities (LLD) and students without disabilities analytically, the former scored significantly lower for many elements on narrative writing, but did so for fewer elements on expository writing. Specifically, both groups scored similarly on productivity and clausal density, which researchers attributed to the complexity of the writing prompts. In other words, the wording of the instructions or questions supported students with LLD in performing a skill better. When comparing participant groups holistically, the students with LLD scored significantly lower than the students without disabilities on all six traits. This was expected, as the combination of skill measures effectively blended the individual skill strengths and weaknesses, resulting in a lower overall score. |
|
Table F-15. Findings for Studies Examining Accommodations for English language proficiency (ELP) Assessments (n=1)
Authors |
Findings |
Common accommodations for English language learners (ELLs) with disabilities involved modifying test directions, test format, and timing (n=1) |
|
Kuti (2011) |
Students with disabilities who were English language learners (ELLs) completing the ACCESS for ELLs testing (English language proficiency assessments) used various combinations of 11 accommodations. The most commonly provided accommodations included modified test directions, modified timing, other accommodation (practices for reducing test anxiety), and modified presentation format. |
Top of Page | Table of Contents
Appendix G
Limitations and Future Research
Table G-1. Study Limitations by Researchers and Limitations Category
Note. Quotations from the article appear in italics with page number in parentheses.
Authors |
Sample Characteristics |
Test / Test Context |
Methodology |
Abedi et al. (2011) |
|
|
|
Alt & Moreno (2012) |
. . . the sample was biased toward higher functioning participants. It may be that a group of lower functioning children would have shown a significant difference in performance because even the simplicity of the vocabulary test might have been too stressful for them. (127) |
|
|
Beddow (2011) |
. . . the participants were from one grade, so results cannot necessarily be generalized across the grade span. (92) |
. . . the study used mathematics items only. . . . (92) |
. . . the lack of student response to the availability of testing accommodations was unanticipated; notwithstanding the effort to administer accommodations as authentically as possible, the decision to deliver testing accommodations to every participant in the accommodated conditions may have been preferable. (93-94) |
Bolt et al. (2011) |
Representativeness of sample in relation to population was uncertain; students represented 17 institutions of higher education. Selection criteria included that students had reading- and writing-related difficulties, and were under 30 years old. |
|
Survey was created for the study, so reliability and validity had not been established, other than to pilot and make some adjustments. Depended on student self-report, with its constraints on memory about their use of supports and their own understanding of what prevented their use of accommodations. |
Bouck et al. (2011) |
Sample size was small, but intended as such, since it was a single-subject design. |
The speech recognition system’s use with some test-takers’ voices had limited reliability. |
|
Brockelmann (2011) |
Findings not generalizable to this university or all universities, since sample was not clustered by academic department or college, etc. |
|
Clarity was needed about practice of not defining psychiatric disabilities, and researcher’s effort to permit faculty respondents to answer survey items better. |
Brown et al. (2011) |
. . . this sample is characterized by students who tended to have high average verbal comprehension abilities. Applicability to students with different levels of verbal comprehension may be limited and remains to be tested. (85) |
The Nelson-Denny Reading Test has been criticized for having a low ceiling which does not provide adequate challenge for students of stronger ability who may be required in their schooling to read and take tests involving much more complex text than is provided by the Nelson-Denny. Also, one study by Coleman, et al. found that a sample of students with and without disabilities were able to obtain scores well above chance on this test without having read the passages on which the comprehension questions are based. (85-86) |
|
Cawthon (2011) |
. . . participants served students in a variety of roles. This means that they may have different experiences with making accommodations decisions, which affect how they approach the vignette task. . . . Because we do not know the extent of a participant’s experience, such as age or years in the field, it could be that there are hidden demographics. (16) |
|
Survey tool does not permit respondents to seek clarification about questions and tasks. |
Cawthon et al. (2012) |
Sample not randomly selected nor randomly assigned; limited generalizability of findings. |
|
Used extant data set, so no randomization of factors such as item linguistic complexity or accommodations conditions were completed; also, there was no comparison group of students without learning disabilities who received accommodations; finally, could not control for learning disability types and severities. |
Cawthon et al. (2011) |
|
. . . lack of a validation measure of student proficiency in ASL or their experiences within the assessment. . . . Without this as a direct measure, we cannot fully understand the relationship between a student’s use and knowledge of ASL and the role of ASL translations in standardized assessments. (208) |
|
Cho et al. (2012) |
|
|
|
Davis (2011) |
Sample was based on convenience; limited generalizability of findings outside of a specific location in Texas. |
|
Survey had limited validity and reliability; |
Engelhard et al. (2011) |
|
|
Random assignment was not completed at the individual student level. |
Feldman et al. (2011) |
The relatively small sample, although thought to be representative of eighth graders in many urban Wisconsin schools, rendered many results statistically insignificant even when the data trends were in the direction predicted. . . . particularly relevant for interpreting the differential effect of accommodations on students’ measured self-efficacy. (86) |
|
While accommodations were provided, students’ use of them was not ascertained; as a result, on several occasions there was only a moderate difference between the nonaccommodated and the accommodated testing conditions. (86) |
Flowers et al. (2011) |
|
|
Used extant data set, so no randomization of factors such as accommodations or testing conditions were completed; therefore, a causal relationship between types of testing conditions on academic performance cannot be assumed. (10) |
Fox (2012) |
. . . the sample size of students with VI [visual impairments] was small (even when generated at the state level. This limited the statistical analyses, such as conducting Hierarchical Linear Models (HML) that could be conducted on the total VI sample and especially on the longitudinal sample since HLM requires larger sample sizes for adequate power. (66) |
|
|
Gregg (2012) |
No limitations reported by the researchers. |
||
Gregg & Nelson (2012) |
No limitations were reported by the researchers. |
||
Hodgson et al. (2012) |
No limitations were reported by the researchers. |
||
Holmes & Silvestri (2012) |
No limitations were reported by the researchers. |
||
Ihori (2012) |
. . . due to institutional barriers, the survey was not distributed to all faculty members at all institutions. (87) Sample size was small; further, higher education institutions of survey respondents were limited to Los Angeles County (not statewide); limited generalizability of findings. |
. . . the level of internal consistency found on the revised PLuS. The moderate to low levels of internal consistency on several of the revised PLuS factors is likely due to the original PLuS having been designed to assess the construct of learning disabilities while the revised PLuS adapted the original survey to measure the construct of ADHD. (88) |
|
Kettler et al. (2012) |
|
|
Students were provided multiple enhancements on pilot test, so cannot make strong claims about relative gains supported by individual enhancements. |
Kettler et al. (2011) |
Sample size was narrowed to grade 8 students only; limited generalizability of findings. |
|
. . . testing accommodations were not used. . . . in practice testing accommodations would be allowable along with modifications for the AA-MAS. (232) |
Kim (2012) |
. . . the study targeted middle school students with visual impairments who attended a special school. Not including students with visual impairments who attended public schools may be a limitation for supporting the validity of the results. (360) |
|
. . . information about each student’s previous academic achievement in the same subject (Korean Reading Comprehension) [360] could be the source for matching both groups by academic level. However, for a more exact and valid group assignment, preliminary IQ tests should be performed to factor out the chance of natural intellectual abilities distorting achievement results. (360-361) |
Koutsoftas & Gray (2012) |
|
The STWR [six-traits writing rubric] was selected for study because it is used in a number of states in the United States. . . . findings can only be generalized to schools where the same writing rubric is being used. (407) |
|
Kuti (2011) |
|
|
. . . there is no way to track the student’s actual use of the accommodation. (97) |
Lazarus et al. (2012) |
Sample size was small; limited generalizability of findings. |
. . . does not simulate a typical test-taking experience with the read aloud accommodation and may have affected the study results. (24) |
. . . self-report responses that may have been affected by social desirability bias. (24) |
Leyser et al. (2011) |
. . . possible differences between the two samples. The sample from the later study included faculty from seven colleges including a sub-sample of faculty from B.B [sic] College. The sample in the earlier study included only faculty from B. B. College. Statistical analysis revealed however, that the responses of the subgroup of B.B [sic] faculty in the later study were very similar to those of their cohorts in the other colleges. (172) |
|
. . . related to the instrument. The scale used in the later study was a modified version of the scale used earlier. It was modified based on several more recent scales, yet most items of the two scales were identical. As noted, only items included in both scales were analyzed. (172) |
Lipscomb (2012) |
Due to the participant pool being limited to three schools within a large urban school district, the results of the study will not be generalized to teachers outside of these schools. (16) |
|
Self-report surveys might permit response biases; respondents might provide inaccurate data; respondent self-selection (voluntary participation) might limit representativeness of findings. |
Lovett (2011) |
No limitations were reported by the researchers. |
||
Makeham & Lee (2012) |
No limitations were reported by the researchers. |
||
Meadows (2012) |
The attitudes of the teachers were only how the teachers felt at the time they answered the questionnaire and may not have been honest or may have had an unknown bias. (56) |
|
|
Patterson et al. (2011) |
No limitations were reported by the researchers. |
||
Phillips et al. (2012) |
. . . addresses faculty experiences and perspectives at only one institution. (342) |
|
|
Posey & Henderson (2012) |
. . . although the sample of 65 may be considered large for special education studies, it is small for studies on the development and analysis of tests. Therefore, the results cannot be generalized beyond this study. (497) |
A student may not have had experience using a particular kind of refreshable braille display that is introduced during testing. . . . a transcriber may be needed to format the text, so the information is more understandable or, for the purposes of this study, the purpose of the construct being measured in the assessment item is better |
|
Qi & Mitchell (2012) |
|
Another unique issue in ASL test adaptation is that it changes the nature of the examinees’ testing experience in that the items are presented in the everyday, face-to-face discourse mode of the classroom rather than in a denuded written form. This means that an ASL version may measure a construct that is different from what the original written test intended to measure, which creates potential threats to comparability. Valid inferences may be drawn about what students know and can do, but comparisons with performances on written tests may not be valid. (13) |
|
Randall et al. (2011) |
|
|
. . . we elected to use actual statewide experimental data as opposed to simulated data. As a consequence, the truth concerning the presence or magnitude of any DIF is unknown, which may limit/effect the generalizability of our findings. (145) |
Scarpati et al. (2011) |
No limitations were reported by the researchers. |
||
Schmitt et al. (2012) |
. . . included only three participants and in depth analyses across participants was not possible. (238) |
|
|
Schmitt et al. (2011) |
|
All procedures took place outside of the classroom, and the comprehension passages used [238] were not linked to current curricular materials. . . . Unknown are the effects of reading pens when used to complete common classroom activities (e.g., homework assignments, quizzes, tests). (238-239) |
|
Shelton (2012) |
Over sixty percent of the entire sample was from a near urban school, which limits the generalizability . . . (102) |
|
. . . one teacher did not implement correctly devastated the equality of the sample because she had a large amount of participants from an urban school with a variety of demographic variables. In order to maintain the integrity of this study, there was a loss of 328 students among all three modules for both years. Furthermore, within the sample of analyzed data, not all students or schools provided the necessary demographic variables, which in some analyses, reduced the available sample to half broadening the limit to the generalizability and possibly validity of the results. (102) |
Shinn & Ofiesh (2012) |
No limitations were reported by the researchers. |
||
Smith & Amato (2012) |
. . . the potential for inaccurate data because of |
|
. . . the potential for inaccurate data because of . . . |
Srivastava & Gray (2012) |
. . . small sample size, which resulted in lower power to detect between- and within-group differences. (433) |
. . . participants were not required to read the hyperlinked pages to answer the comprehension questions correctly. (433) |
|
Taherbhai et al. (2012) |
. . . the assignment of students to the mode of administration was not random. In such cases, the ANCOVA (as in most other statistical analyses) has an important limitation . . . (71) |
|
|
Zebehazy et al. (2012) |
|
The teachers were limited to making judgments that were based on observations of the assessment overall and on differences in students’ behavior on individual test items. (29) |
Although reliability in the identification of the accommodations was high, there is a possibility that some were over- or underreported. (29) |
Zhang et al. (2012) |
|
. . . the participants were not required to explain how they chose their answers. (175) |
. . . the single-subject design does not allow for generalization of the findings to the overall population of students with math difficulties. (175) |
Zhou et al. (2012) |
. . . given the way the survey was distributed and the lengthy questionnaire, a potential sampling bias might have occurred toward teachers of students with visual impairments who were particularly interested in assistive technology. (663) |
|
|
TOTAL |
27 |
13 |
20 |
Table G-1. Study Limitations by Researchers and Limitations Category (continued)
Note. Quotations from the article appear in italics with page number in parentheses.
Authors |
Results |
Other |
TOTAL |
||||||||
Abedi et al. (2011) |
... accessibility features may be confounded with students’ disability status. . . . however, the differential level of impact of the five latent accessibility features suggests that some of these features can clearly have more impact on the performance of students with disabilities than other features. (34) |
|
1 |
||||||||
Alt & Moreno (2012) |
|
|
1 |
||||||||
Beddow (2011) |
Assessments created for the study were not linked to proficiency standards. |
|
4 |
||||||||
Bolt et al. (2011) |
|
|
2 |
||||||||
Bouck et al. (2011) |
... the novelty effect (i.e., students enjoying VISO more because it was a new technology) may have played a role in students’ initial perceptions of VISO. However, concern about the novelty effect was minimal, as the participating students reported a high exposure to technology in their everyday life and schoolwork outside of mathematics (i.e., used a computer for accessing print) and they still enjoyed the technology at the end of the study due to the independence it provided. (12) |
|
3 |
||||||||
Brockelmann (2011) |
|
|
3 |
||||||||
Brown et al. (2011) |
|
|
2 |
||||||||
Cawthon (2011) |
|
|
4 |
||||||||
Cawthon et al. (2012) |
. . . these results were not explicitly connected to the state policies for accommodations or alternate assessments for each participant. Because this analysis was focused on teachers’ responses to hypothetical scenarios, this study was a step removed from the policy context of their daily assessment practice. It is unclear to what extent state guidelines differentially affected teachers’ responses to vignette scenarios. (16) |
. . . using vignettes to measure teacher practice . . . vignettes do not represent real experience and that without a specific student in mind, one may find it difficult to make consistent judgments about testing accommodations. (16) |
3 |
||||||||
Cawthon et al. (2011) |
. . . that the analyses were calculated on the overall LC [linguistic complexity] score, a sum that combines both scale and dichotomous sub-scores, thus weighing the overall score toward vocabulary and syntax components. (308) |
|
1 |
||||||||
Cho et al. (2012) |
The occurrences of DIF may be due in part to the accommodations, but may also be due to other differences between the groups that are not captured in the existing data. (302) |
|
1 |
||||||||
Davis (2011) |
. . . since cultures, climates, and attitudes in secondary schools differ from state to state and city to city, the findings may only be generalized to geographic locations where similar attitudes, climates, and cultures exists. (76) |
|
3 |
||||||||
Engelhard et al. (2011) |
. . . the second administration of the Criterion-Referenced Competency Test (CRCT, posttest) used the same form of the CRCT that was used as the pretest. Some of the students may have remembered items from the previous administration. Also, it is possible that student motivation may be lower for students on the posttest. (36) |
. . . no detailed qualitative information was collected regarding how the resource guides and calculators were actually used by the students. (36) |
3 |
||||||||
Feldman et al. (2011) |
. . . the results regarding self-efficacy, anxiety, motivation, and positive regard were based entirely on student self-report and the current design only examined these correlations with test performance. As is the case with all self-report measures, even with psychometrically sound instruments there is a possibility that students gave inaccurate representations of their thoughts and feelings. The present study used a technically sound although new measure of student attitudes about testing. More refinement of this measure could help to reduce error in its resulting scores. (86) |
|
3 |
||||||||
Flowers et al. (2011) |
. . . no data were collected on the amount of time that CBT students used the text reader or on the use of text readers in instruction, which affects student performance in the CBT condition. (10) |
|
2 |
||||||||
Fox (2012) |
. . . human input errors with the original data set provided by the Pennsylvania Department of Education. (66) |
|
2 |
||||||||
Gregg (2012) |
No limitations were reported by the researchers. |
0 |
|||||||||
Gregg & Nelson (2012) |
No limitations were reported by the researchers. |
0 |
|||||||||
Hodgson et al. (2012) |
No limitations were reported by the researchers. |
0 |
|||||||||
Holmes & Silvestri (2012) |
No limitations were reported by the researchers. |
0 |
|||||||||
Ihori (2012) |
. . . the possibility that despite the survey being anonymous, respondents may have responded based on social desirability, as discrimination toward students with disabilities is not considered acceptable legally or administratively. (88) |
|
3 |
||||||||
Kettler et al. (2012) |
Sets of science assessment items were not necessarily representative of state standards/requirements; results not generalizable beyond the item sets. |
|
1 |
||||||||
Kettler et al. (2011) |
|
|
2 |
||||||||
Kim (2012) |
. . . cannot be generalized because some students whose reading speed with large print or braille is fast may find audio presentation a barrier . . . (360) |
|
3 |
||||||||
Koutsoftas & Gray (2012) |
|
|
1 |
||||||||
Kuti (2011) |
. . . there is no way to track the student’s actual use of the accommodation. (97) |
The quantitative data were limited to just one state and the qualitative data were limited to the same state and one school district. Quantitative data were extant test data provided by the VDOE; therefore, the data were subject to test bias and identification of test takers both as ELLs as well as students with disabilities. (96) |
2 |
|
|||||||
Lazarus et al. (2012) |
. . . self-report responses that may have been affected by social desirability bias. (24) |
|
3 |
|
|||||||
Leyser et al. (2011) |
. . . related to the instrument. The scale used in the later study was a modified version of the scale used earlier. It was modified based on several more recent scales, yet most items of the two scales were identical. As noted, only items included in both scales were analyzed. (172) |
|
2 |
|
|||||||
Lipscomb (2012) |
Self-report surveys might permit response biases; respondents might provide inaccurate data; respondent self-selection (voluntary participation) might limit representativeness of findings. |
|
2 |
|
|||||||
Lovett (2011) |
No limitations were reported by the researchers. |
0 |
|
||||||||
Makeham & Lee (2012) |
No limitations were reported by the researchers. |
0 |
|
||||||||
Meadows (2012) |
|
|
1 |
|
|||||||
Patterson et al. (2011) |
No limitations were reported by the researchers. |
0 |
|
||||||||
Phillips et al. (2012) |
. . . the data collected are in need of validation since it is only based on self-reports that may reflect socially-desirable responses. (342) |
|
2 |
|
|||||||
Posey & Henderson (2012) |
|
|
2 |
|
|||||||
Qi & Mitchell (2012) |
The problem of standardized administration in Massachusetts, South Carolina, and Virginia has been addressed, but validity and reliability have not. When it comes to reliability, depending on the state population tested and the adaptation chosen, too few deaf and hard-of-hearing students participate in the state testing program in the same way at the same test level to obtain good estimates. And even if participation rates are high enough, no state has published reliability estimates for this subpopulation. when it comes to validity, certainly, these carefully adapted state tests have the same content validity as the written English versions, but construct validity does not have the same support. (14) . . . Worse, both the written English and the ASL-adapted versions of these state tests lack studies providing evidence of their criterion-related validity . . . Very little in the way of independent research activity has provided any evidence to fill this psychometric near vacuum for modified English or ASL-adapted state tests. (14-15) |
|
2 |
|
|||||||
Randall et al. (2011) |
|
|
1 |
|
|||||||
Scarpati et al. (2011) |
No limitations were reported by the researchers. |
0 |
|
||||||||
Schmitt et al. (2012) |
|
|
1 |
|
|||||||
Schmitt et al. (2011) |
. . . there was no reinforcement given (grades, feedback, etc.) contingent on improved performance. (239) |
|
2 |
|
|||||||
Shelton (2012) |
|
|
2 |
|
|||||||
Shinn & Ofiesh (2012) |
No limitations were reported by the researchers. |
0 |
|
||||||||
Smith & Amato (2012) |
|
|
2 |
|
|||||||
Srivastava & Gray (2012) |
|
|
2 |
|
|||||||
Taherbhai et al. (2012) |
. . . it is important to avoid placing too much emphasis on these statistically significant results, as the actual differences between the adjusted means were small as measured by their effect sizes (ES). (71) |
|
2 |
|
|||||||
Zebehazy et al. (2012) |
. . . the accommodations that were identified in the study reflect access for a particular alternate assessment—the PASA. However, many of the results may apply to other performance-based assessments with similar layouts. (29) |
|
2 |
|
|||||||
Zhang et al. (2012) |
. . . it is still unclear whether the VCR [visual chunking representation] accommodation functions as a true accommodation or as a modification in geometry testing. (175) |
|
3 |
|
|||||||
Zhou et al. (2012) |
. . . the study measured only the participants’ self-perceptions of their knowledge of and skills in assistive technology, which may not accurately reflect their actual competence in assistive technology. (663) |
|
2 |
|
|||||||
Zhou et al. (2011) |
. . . using teachers’ self-perceptions as the sole data source limited the validity of the findings. (209) |
|
2 |
|
|||||||
TOTAL |
23 |
3 |
85 |
|
|||||||
Table G-2. Future Research Directions by Researchers and Future Research Category
Note. Quotations from the article appear in italics with page number in parentheses.
Authors |
Sample Characteristics |
Test / Test Context |
Methodology |
Abedi et al. (2011) |
Future experimental research can lend support to the idea of two distinct lexical categories through field tests. By testing a non-student with disability (SWD) sample of students on both lexical A and reduced complexity lexical A features, the accuracy of this categorization can be tested. (17) |
|
|
Alt & Moreno (2012) |
|
... should investigate how familiarity with computer technology and frequency of computer use affect children’s performance on computerized tests. Furthermore, learning style may also need to be considered when determining which kind of test presentation to use with a child. If a child is a visual learner, he or she may prefer the computer, whereas an auditory learner may prefer the traditional, paper administration. (128) |
Include children with ASD of different functioning levels; the suspected result would be that the alleviation of social interaction allowed by the computer testing component can be beneficial for children who are deemed to be lower functioning. (127) |
Beddow (2011) |
. . . notwithstanding the variety of issues with administering accommodations to students who are not eligible for them, or from whom they are not desired (e.g., distracting them from performing optimally, causing frustration, etc.) the study may have benefited from delivering a specific package of accommodations to each student regardless of need or desire. (96) |
. . . while the current study provided some opportunity for students to report on their perceived ability to access the items on the field test, future researchers should consider the use of computer-based delivery systems to solicit student feedback about the items during the test itself, as well as to record the amount of time spent by the test taker on each item. (95) |
. . . the current study should be replicated with a more robust sample including a representative students at multiple grade-levels identified with, and not identified with, disabilities, as well as with ELL and LEP student populations. (96) |
Bolt et al. (2011) |
|
|
Possible variables that may affect findings, which need exploration: institution type (2 year vs. 4 year), disability category, and student level (undergraduate vs. graduate). (174) |
Bouck et al. (2011) |
|
|
... should explore the use of the VISO calculator by individuals with more significant visual impairments who rely more extensively on features other than voice input and speech output to complete mathematics problems (e.g., contrasting colors, zoom). (12) |
Brockelmann (2011) |
|
|
Factors that may predict faculty accommodation of students with psychiatric disabilities should also be explored. Examples of potential factors include (a) the number of students a faculty member instructs per semester, (b) the amount of time faculty spend arranging strategies for their students with psychiatric disabilities, (c) students’ behavior when requesting strategies, and (d) whether the professor or the student initiated the strategy. (51) |
Brown et al. (2011) |
No future research directions were reported by the researchers. |
||
Cawthon (2011) |
|
. . . may need to provide more concrete examples of test items on a math test to see if teachers make distinctions between reading skills needed to access a computational test item and a language-embedded word problem. . . . This approach echoes other calls for item-specific research that includes linguistic complexity as a factor when evaluating the validity of assessment accommodations . . . (17) |
|
Cawthon et al. (2012) |
. . . consider a different LC rating scale, or perhaps even a more global measure of item accessibility that incorporates features such as the format of the item on the page and graphical features of the item . . . (312) |
|
|
Cawthon et al. (2011) |
|
. . . could include not only “think aloud” but also indicators of eye gaze, DVD rewinding or tracking, and other attentional cues to indicate what students use as input in an ASL-accommodated assessment. This kind of micro-level analysis would be helpful in understanding if the translated ASL challenges, if they existed, were due to vocabulary, syntax, or other differences between English order and ASL order structures. (208) |
|
Cho et al. (2012) |
|
. . . this study found that non-story items were more difficult for the third and fourth grades than story items. . . . replicate this study to see whether similar patterns develop. (302) |
|
Davis (2011) |
|
[listed as itemized recommendations] |
4. Research teachers’ perceptions of accommodations “leveling the playing field” from a variety of other lenses (e.g. special education teachers, fine arts, Career Technology Education teachers, etc.) involved in the education of students with disabilities. (89) |
Engelhard et al. (2011) |
|
. . . focusing on the actual use and implementation of various assessment accommodations provides the opportunity for significant advance of our knowledge of how to increase the fairness and validity of our interpretations of student performance. (36) |
|
Feldman et al. (2011) |
. . . to examine some of the same questions posed in this study using a design that maximizes the difference between the accommodated and nonaccommodated conditions. (86) |
A study that allowed test administrators to work one-on-one with students as they took the tests might reveal more meaningful effects of the provision of testing accommodations, particularly for SWDs who may be too embarrassed to make use of these accommodations in a public setting. (86) |
|
Flowers et al. (2011) |
No future research directions were reported by the researchers. |
||
Fox (2012) |
|
. . . need to study why students with VI [visual impairments] demonstrated higher math performance than reading performance. As the students’ progress by grade level, are the lower reading scores a reflection of vocabulary deficits or splintered concepts and understanding of their world knowledge, particularly since the majority of the students with VI in Pennsylvania are low vision with various amount of usable vision. (67) |
|
Gregg (2012) |
. . . both ABE [adult basic education] learners with LD and their nondisabled peers are administered both standardized and accommodated administrations of tests or instruction. (58) |
|
|
Gregg & Nelson (2012) |
. . . in which both students with LD and typically achieving students are administered both standardized and accommodated versions of tests. This type of design is necessary to more adequately understand the impact of test accommodations in relation to the interaction and differential boost hypotheses. (136) |
|
. . . in which the test accommodations of the LD group are justified by the specific type of LD and, as much as reasonably possible, by the specific cognitive and linguistic process deficits that are associated with the specific LD. (136) |
Hodgson et al. (2012) |
No future research directions were reported by the researchers. |
||
Holmes & Silvestri (2012) |
. . . construction of methodologies based on a modern definition of LD, which identifies psychological processing deficits, such as working memory or phonological processing, as some of the causal mechanisms beneath disabilities in reading and writing . . . Until such shortcomings are addressed, it is unlikely that the assignment of AT to adults with LD will be based on much more than past practice and good will. (93) |
|
|
Ihori (2012) |
|
. . . further modify the PLuS by dividing the “Knowledge of ADHD” factor into a “Knowledge of ADHD” and a “Knowledge of Legal Protections” factor. . . . include multiple items for each factor of the revised PLuS in order to further increase the internal consistency of the measure. (93) |
. . . secure institutions that are willing to distribute surveys to all instructional faculty members. (93) |
Kettler et al. (2012) |
To further evaluate the benefit of individual types of enhancements, it would be necessary to individually manipulate each enhancement for each group and item type. (103) |
|
|
Kettler et al. (2011) |
|
. . . examine the relationship between modifications and accommodations and their effects on test scores for students with and without disabilities. (232) |
. . . our findings warrant replication with student samples from elementary and high schools where participation decisions are potentially more challenging due to a lack of previous years’ test results. (232) |
Kim (2012) |
. . . for a more exact and valid group assignment, preliminary IQ tests should be performed to factor out the chance of natural intellectual abilities distorting achievement results. (361) |
. . . experimenting with various test accommodations, such as computers with synthesized speech chips or braillers. (360) |
. . . research is needed for students with visual impairments who are integrated into inclusive schools and have the most immediate need for appropriate test accommodations. (360) . . . replications of research on read-aloud for students with visual impairments with a larger sample . . . (360) |
Koutsoftas & Gray (2012) |
|
. . . develop valid and reliable writing assessments that can be used to select intervention goals and to document incremental changes in writing skills. (407) |
. . . a larger and more diverse sample of students is required to study how different types of writing measures may be applied to different writing genres and how performance varies by genre. (407) |
Kuti (2011) |
|
. . . appropriate assessment and instruction practices for ELLs who are also deaf, blind, or who have significant cognitive disabilities . . . (98) |
|
Lazarus et al. (2012) |
|
|
|
Leyser et al. (2011) |
. . . use other procedures of data collection such as interviews with faculty, focus groups, analysis of syllabi and classroom materials and possibly observations. (172) |
|
|
Lipscomb (2012) |
. . . include performing the same quantitative researches design, however, increasing the sample size. (100) |
|
|
Lovett (2011) |
No future research directions were reported by the researchers. |
||
Makeham & Lee (2012) |
No future research directions were reported by the researchers. |
||
Meadows (2012) |
|
|
Differences were found that need to be examined further through a larger study involving more school districts in different locations. (80) |
Patterson et al. (2011) |
. . . qualitative studies should investigate why approximately 40% of test takers preferred paper-based testing and what implicit barriers might be associated with that preference. (73) |
|
. . . a broader study of candidates with disabilities who are eligible for accommodations would add to the evidence base. We need to collect and analyze more data on accommodations used in large-scale computer-based GED testing to see whether performance differs by accommodation type or disability type. We know little about the relationship between length of time available for testing and item or form completion, whether candidates use accommodations or not. (73) |
Phillips et al. (2012) |
. . . student surveys and focus group interviews with online students to determine: the extent to which students with disabilities feel comfortable requesting accommodations; why students do not disclose a disability in the online setting; if students with disabilities are aware that the university can offer accommodations for online courses; and student perceptions of what it means to contact Disability Services for Students (i.e., any potential stigma issues). (342) |
. . . to determine whether faculty, and the university in general, are providing effective supports of students and faculty around online accommodations (along with identifying specific accommodations being used), as well as what additional supports, attitudes, or behaviors are needed to ensure faculty and student success in the context of teaching and learning. (342) |
|
Posey & Henderson (2012) |
|
. . . on computer-based testing accommodations for students who are visually impaired is ongoing and offers new opportunities in testing equality. (498) |
|
Qi & Mitchell (2012) |
Regardless of whether an “interaction effect” is observed for either the modified English text or video-based ASL presentation accommodations, extensive psychometric research employing experimental designs is urgently needed for future test development in this area. . . . We urge practitioners and researchers to collaborate in the large-scale research efforts that are required to advance the development of valid, reliable, and effective assessments of academic achievement for deaf and hard-of-hearing students. (15) |
In ASL, the meaning of particular concepts can be presented by hand shapes or hand movements in ways that are not available in written English. . . . inherent to the grammar of ASL, repetition and use of space can depict a mathematical construct in a way that is awkward in English . . . Such “number cues” or “mapping cues” may potentially affect how problems are solved and, therefore, their level of difficulty . . . nearly all the research to date has investigated elementary arithmetic story problems using relatively small integer quantities, and the language used at this elementary level does not generalize to arithmetic with larger numbers, fractions, decimals, etc. As a consequence, the availability of “cues” may not persist or, worse, become misleading at later stages of learning. (13) |
|
Randall et al. (2011) |
. . . use data in which the magnitude and nature of DIF are known and can be manipulated. (145) |
|
|
Scarpati et al. (2011) |
No future research directions were reported by the researchers. |
||
Schmitt et al. (2012) |
. . . consider studying the effects of reading pens on the comprehension of actual college textbooks since reading for memorization, such as for a test, may influence how a student engages a passage (238) |
|
|
Schmitt et al. (2011) |
. . . evaluate the effects of reading pen technology on higher-stakes activities and with a reinforcement contingency for improved student performance. (239) |
|
|
Shelton (2012) |
. . . repeating this study but adding in qualitative methods could help illuminate what would help students more. Using focus groups, think alouds, and semi-structured interviews would provide researchers with greater access into students’ thought processes and understanding their perceptions. Further, investigating student trajectories through the module in tandem with interviews could help clarify how much students really know and what barriers exist for each student. (103-104) |
. . . allowing students to choose the speed of the voices of the characters or by allowing students to mouse over words in order to hear them. (103) |
|
Shinn & Ofiesh (2012) |
|
. . . to inform and improve the creation and application of accessible tests, also allowing for greater test validity. (238) |
|
Smith & Amato (2012) |
No future research directions were reported by the researchers. |
||
Srivastava & Gray (2012) |
. . . ask students how they arrived at their answers to the comprehension questions and to include a retelling task after reading each passage that could provide insight into students’ comprehension monitoring skills and the completeness of their situation model. (434) |
. . . a measure of how well students decode the reading passages would be helpful in determining definitively whether poor decoding contributes to poor comprehension. (434) |
|
Taherbhai et al. (2012) |
. . . modelling these variables [school and student variables, such as the degree of schools’ encouragement in the use of technology, student non-familiarity with computer testing] may provide some explanation of these hypothetical concerns. (71) |
|
. . . a randomized sample would have had a larger generalizability cross-over appeal than the data we have used in our analysis. (72) |
Zebehazy et al. (2012) |
The results highlight the need to continue to investigate factors that affect access to and the performance of students with visual impairments and severe cognitive disabilities on high-stakes assessments. (29) |
The results highlight the need to continue to investigate factors that affect access to and the performance of students with visual impairments and severe cognitive disabilities on high-stakes assessments. (29) |
|
Zhang et al. (2012) |
. . . the authors are conducting a large-scale study to make group comparisons regarding whether VCR results in universal performance gains for individuals with or without math difficulties or results in performance gains only for individuals with math difficulties. (175) |
|
|
Zhou et al. (2012) |
|
|
|
Zhou et al. (2011) |
. . . using qualitative methods, such as interviews or focus groups, to obtain an in-depth understanding of the attitudes of teachers of students with visual impairments toward instruction of and training in assistive technology. (208) |
|
. . . repeat this study in other states to examine whether the findings in Texas are typical across the United States. All these efforts will contribute to a clear picture of the readiness of teachers of students with visual impairments to provide instruction in assistive technology. (208) |
TOTAL |
24 |
21 |
18 |
Table G-1. Study Limitations by Researchers and Limitations Category (continued)
Note. Quotations from the article appear in italics with page number in parentheses.
Authors |
Results |
Other |
TOTAL |
Abedi et al. (2011) |
|
|
1 |
Alt & Moreno (2012) |
Future research will further our knowledge of how, precisely, computer testing may be used to our advantage. (128) |
|
3 |
Beddow (2011) |
|
|
3 |
Bolt et al. (2011) |
Second, efforts should be made to empower students to understand and advocate for their needs, and to reduce the stigma that may be attached with disability status and accommodation use. . . . Students can be taught appropriate methods for seeking out accommodations when they are needed. Furthermore, they should be taught how to stay abreast of new technological developments that may help them eliminate barriers to learning associated with their disabilities. (173-174) It would be helpful to determine whether accommodation use is related to college performance and future job success; it would be expected that students’ [sic] whose needs are appropriately accommodated would experience greater success than students with disabilities who were not. Furthermore, it may also be important to conduct longitudinal studies examining students’ accommodation use in the college environment and in their future work environments. Do students who receive accommodations in college also need accommodations in their future work environments, and if so, are they able to receive them? (174) |
First, more research is needed on how more systematic disability identification procedures can be developed and implemented so that there is consistency across secondary and postsecondary environments in students’ ability to access accommodations. Similarly, the development and use of more systematic procedures for identifying the specific accommodations an individual student should receive appears necessary. (173) |
3 |
Bouck et al. (2011) |
... should occur for longer periods of time to measure whether increased use results in better outcomes. (12) |
... include expanding the VISO calculator’s capabilities to include such features as a graphing function for algebra and switch compatibility. (12) |
3 |
Brockelmann (2011) |
|
The development of training materials and resources for faculty should be investigated. . . . any training materials or resources provided to faculty need to be validated through research prior to dissemination. A more in-depth evaluation of strategy usage and effectiveness, including supporting evidence based on student grades, would also provide a valuable contribution to the development of resource materials. (52) |
2 |
Brown et al. (2011) |
|
0 |
|
Cawthon (2011) |
|
. . . that includes an oral option only may help to clarify how a broader range of communication modes influences assessment decisions. (16) |
2 |
Cawthon et al. (2012) |
. . . expand on these findings and determine if there are differences in between three groups: students without disabilities, SLD with accommodations, and SLD without accommodations (but who would typically be assigned accommodations). The sample would need to have accommodations randomly assigned to SLD so that item difficulty results can be compared across the three groups without the potential confounds present in a “live” testing process such as the NAEP. This kind of analysis would allow for a more direct interpretation of how LC and accommodations affect student performance above and beyond difficulties they may have due to their learning disability that cannot be mitigated through altered testing procedures. (313) |
. . . could clarify how accommodations counteract LC elements that unnecessarily affect student performance. . . . Further research might focus on how SLDs are accessing items and what about specific accommodations help students demonstrate their knowledge, particularly on high LC items. (313) |
3 |
Cawthon et al. (2011) |
|
|
1 |
Cho et al. (2012) |
|
|
1 |
Davis (2011) |
|
|
2 |
Engelhard et al. (2011) |
|
|
1 |
Feldman et al. (2011) |
|
|
2 |
Flowers et al. (2011) |
|
0 |
|
Fox (2012) |
. . . continued analyses of the Pennsylvania data set could reveal how the students with VI [visual impairments] . . . performed on the 2009 PSSA [Pennsylvania System of School Assessment] reading and math assessments (i.e., in the second year of using UDA test constructs). Does their overall performance improve, become more consistent, like the results seen in 2006 and 2007, or continue to fluctuate wildly as they appeared to in the 2008 data presented here? Exploring more deeply the relationships among specific test items and overall performance would benefit educational teams in identifying and remediating critical skills and concepts in both reading and math. (67) |
|
2 |
Gregg (2012) |
. . . including detailed descriptive information about the participants with LD . . . is paramount for interpretation of . . . results. (58) |
|
2 |
Gregg & Nelson (2012) |
|
|
2 |
Hodgson et al. (2012) |
|
0 |
|
Holmes & Silvestri (2012) |
. . . no published record of research assessing the efficacy of voice recognition, word prediction, and brainstorming/mind mapping software programs for postsecondary students with LD. (90) |
|
2 |
Ihori (2012) |
. . . cross-validate faculty responses with students within the institutions being studied. (93) |
|
3 |
Kettler et al. (2012) |
|
|
2 |
Kettler et al. (2011) |
|
|
2 |
Kim (2012) |
|
|
2 |
Koutsoftas & Gray (2012) |
|
|
3 |
Kuti (2011) |
. . . include data from pretest and posttest scores on the ELP assessment to determine and compare students’ previous ELP levels. Pretest and posttest scores could then include comprehensive analysis of between group comparisons as well as within group analysis. (97) |
. . . include investigation of collaboration models, successful professional development, and examples of coordination and overlap between assessment, special education, and English language learner education. (98) |
3 |
Lazarus et al. (2012) |
. . . investigating the read aloud accommodation from the student perspective is needed to confirm the findings . . . (24) |
|
1 |
Leyser et al. (2011) |
Data obtained from faculty could be corroborated by assessing student perspectives of their college classroom experiences in the same institutions. (172) |
. . . replicated in other institutions of higher education as an ongoing assessment of changes in faculty attitudes and practices especially following faculty development activities. (172) |
3 |
Lipscomb (2012) |
. . . use of accommodations with high-stakes testing and the effect of testing accommodations on students’ self-efficacy. (99) |
. . . examine students’ perceptions on specific types of accommodations or accommodation packages. It may be that students with SLD are more accepting and appreciative of certain types of accommodations. (99) |
3 |
Lovett (2011) |
|
0 |
|
Makeham & Lee (2012) |
|
0 |
|
Meadows (2012) |
. . . address teacher knowledge about the use of specific, commonly used accommodations and how teachers perceive the effect of accommodations on student learning and student standardized test scores. (80) |
|
2 |
Patterson et al. (2011) |
. . . could study test center staff’s familiarity with technology and level of confidence with hardware and software. (72) |
. . . larger-scale study could examine the potential advantages of computer-based test administration such as wider availability of testing, faster score reporting, and reduced administrative costs. (72) |
4 |
Phillips et al. (2012) |
|
|
2 |
Posey & Henderson (2012) |
|
|
1 |
Qi & Mitchell (2012) |
|
|
2 |
Randall et al. (2011) |
|
|
1 |
Scarpati et al. (2011) |
|
0 |
|
Schmitt et al. (2012) |
|
|
2 |
Schmitt et al. (2011) |
. . . more data are necessary to evaluate the effectiveness of reading pen technology across ages of students, reading disability severity, type of passage (e.g., expository vs. narrative), and experience using assistive technology. (238) |
|
3 |
Shelton (2012) |
|
|
3 |
Shinn & Ofiesh (2012) |
|
|
1 |
Smith & Amato (2012) |
|
0 |
|
Srivastava & Gray (2012) |
|
|
2 |
Taherbhai et al. (2012) |
|
|
2 |
Zebehazy et al. (2012) |
Students who are visually impaired are rarely studied as a separate group, but the differences in performance that we found suggest that closer scrutiny is necessary if the results of assessments are going to be meaningful and useful for instruction. (29) |
|
3 |
Zhang et al. (2012) |
|
|
1 |
Zhou et al. (2012) |
|
. . . explore further what universities are currently doing to address assistive technology in their curricula. Such empirical studies must address the measurable assistive technology competencies that candidates must have vis-a-vis the expected level of mastery for these competencies and the perceptions of teachers of students with visual impairments about using assistive technology for students with multiple disabilities. (664) |
1 |
Zhou et al. (2012) |
|
. . . addresses the context of the needs of preservice teachers and the comprehensive assistive technology needs of students with visual impairments may help the field to make a more data-based argument to policy makers and administrators. (208) |
3 |
TOTAL |
17 |
10 |
|