Accommodations: Results of a Survey of Alabama Special Education TeachersSynthesis Report 81Jason R. Altman • Damien
C. Cormier • Sheryl S. Lazarus • Martha
L. Thurlow Marla Holbrook • Miriam
Byers • DaLee Chambers • Margaret Moore
• Nanette Pence November 2010 All rights reserved. Any or all portions of this document may be reproduced and distributed without prior permission, provided the source is cited as: Altman, J. R., Cormier, D. C., Lazarus, S. S., Thurlow, M. L., Holbrook, M., Byers, M., Chambers, D., Moore, M., & Pence, N. (2010). Accommodations: Results of a survey of Alabama special education teachers (Synthesis Report 81). Minneapolis, MN: University of Minnesota, National Center on Educational Outcomes. Table of Contents
Executive SummaryThis report contains the findings from a survey of 2,336 special education teachers in the state of Alabama on making and implementing decisions about accommodations. Key findings included:
A number of areas of strength were noted in the survey responses provided by this large sample of Alabama special education teachers. The special education teachers who responded to the survey demonstrated overall knowledge of accommodations use, despite the challenging items presented to them. Nevertheless, there is an evident need for professional development on making accommodations decisions and on implementing accommodations for instruction and assessment. Top of page | Table of Contents OverviewTeachers and other Individualized Education Program (IEP) team members use a variety of strategies when they make decisions about instructional and assessment accommodations. Instructional accommodations are changes and supports that enable students with disabilities to meaningfully access the curriculum during instruction (Thurlow, Thompson, & Lazarus, 2006). As stated by Nolet and McLaughlin (2005), “deciding on accommodations requires that teachers have a sound knowledge of key constructs—the facts, skills and concepts—embedded in a specific lesson or instructional unit” (p. 85). Assessment accommodations are changes in testing materials and procedures that enable students with disabilities to meaningfully participate in an assessment in a way that allows the student’s knowledge and skills to be assessed rather than the student’s disabilities (Thurlow, Elliott, & Ysseldyke, 2003; Thurlow et al. 2006). For accommodations to be successfully implemented in both settings teachers need to understand the relationship between instruction and assessment. Assessment accommodations and instructional accommodations are closely linked in that accommodations used by a student during assessment should have previously been used in instruction. In addition, teachers must also understand the role of IEPs, and the legal basis for accommodations in order to make consistent and defensible decisions. The 1997 reauthorization of the Individuals with Disabilities Education Act (IDEA) included language specific to students with disabilities, inclusion in assessment systems, and accommodations. The Elementary and Secondary Education Act of 2001 (U.S. Department of Education, 2002) reinforced and extended previous legislation, requiring the participation of all students, including students with disabilities, in statewide assessments used for accountability purposes. The 2004 reauthorization of IDEA (U.S. Department of Education, 2004) clarified the previous legislation and sought to align IDEA and ESEA requirements (Lazarus, Thurlow, Lail, & Christensen, 2009). More recent regulations have continued this clarification effort. For example, the 2007 ESEA regulations that addressed alternate assessments based on modified academic achievement standards (AA-MAS) indicated that states must “develop, disseminate information on, and promote the use of appropriate accommodations to increase the number of students with disabilities who are tested against academic achievement standards for the grade in which a student is enrolled” (U.S. Department of Education, 2007, Sec. 200.6(a) (1) (ii)(A)). Recent studies have shown that the provision of accommodations is variable across students, classrooms, and schools depending on the accommodations, educational context, and a student’s demographic characteristics (Bottsford-Miller, 2008; Cormier, Altman, Shyyan, & Thurlow, 2010; Maccini & Gagnon, 2006) and that certain accommodations are used more often than others (Cawthon, 2006; Cox, Herner, Demczyk, & Nieberding, 2006; Gibson, Haeberlie, Glover, & Witter, 2005). Finizio (2008) found that a student’s assessment accommodations more frequently mirror accommodations used for instruction than in the past. However, teachers often still are unclear on the definition and use of certain accommodations (Byrnes, 2008). According to Atchison (2008), there is a need to improve the training and resources available to teachers on accommodations and accommodations decision making. Numerous studies have found that accommodations decisions often are made inconsistently and that accommodations are administered haphazardly (see for example, Fuchs, Fuchs, Eaton, Hamlett, & Karns, 2000; Langley & Olsen, 2003; Lazarus, Thompson, & Thurlow, 2005; Rhode Island Department of Education, 2002) if they are provided at all (DeStefano, Shriner, & Lloyd, 2001; Lazarus et al., 2005; Thurlow, Lazarus, & Christensen, 2008). It is clear that teachers’ knowledge, beliefs, and decisions set the tone for how students use accommodations to access the curriculum in school and the content of a test. Many schools do not have a plan of action for accommodations decision making and use. As a result, special and general education teachers may have very different understandings of the role of accommodations—which can lead to poor decisions. Even among special education teachers, those who teach in different classroom settings—that is, general education classroom, co-teach (inclusion), resource room, self-contained classroom—may have different perceptions of the role of accommodations. This report presents the results of a survey of Alabama special education teachers. The survey was conducted to answer the following questions:
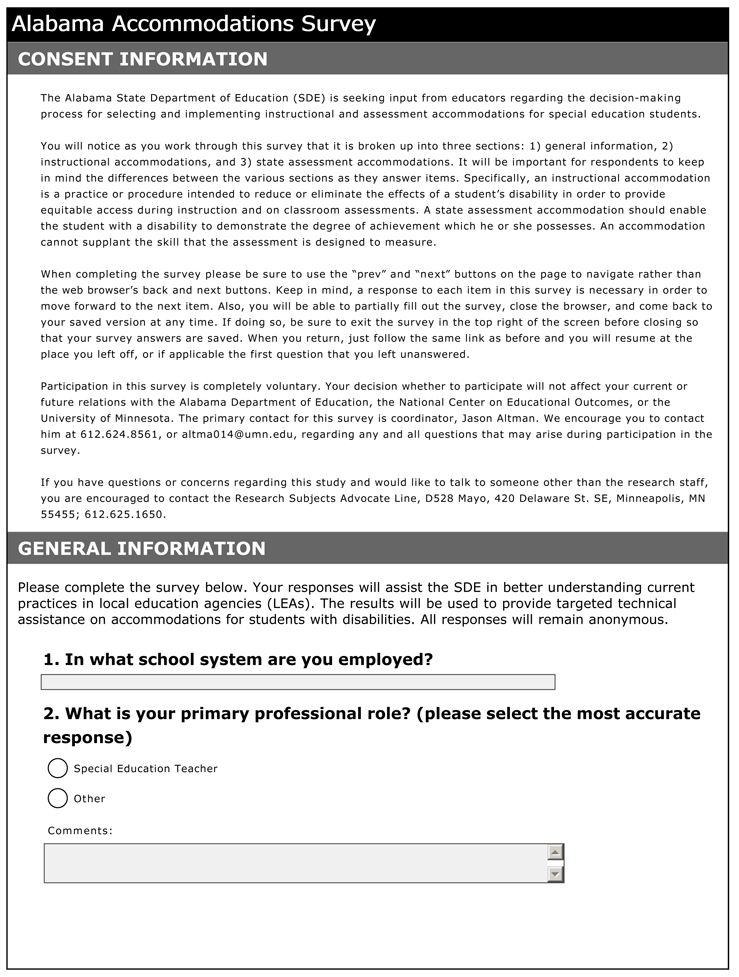
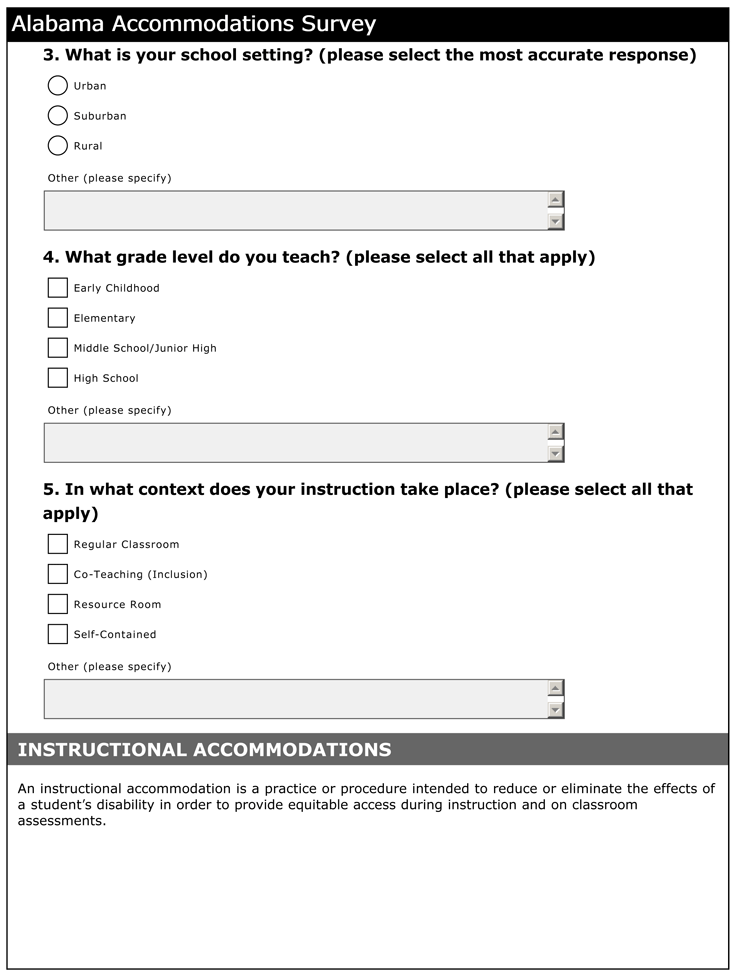
Top of page | Table of Contents ProcedureThe Alabama Department of Education, with support from the National Center on Educational Outcomes (NCEO), developed a survey of special education teachers in Alabama on the factors and considerations affecting accommodations decisions for instruction and assessment. The instrument also asked questions about test day logistics. Some of the survey questions were similar to questions in an instrument originally developed for the Education Policy Reform Research Institute (EPRRI) (Lazarus et al., 2005). The survey was piloted with a small group of special education teachers in Alabama and then revised based on information from the pilot. The final survey was administered online using the Survey Monkey tool. See Appendix A for a copy of the survey instrument. Local education agency (LEA) administrators in the state of Alabama received an email announcing the survey; the announcement included the web address for the Survey Monkey tool where the survey could be accessed. The email asked the administrators to invite special education teachers in their LEA to participate. The email was designed so that it could be forwarded to the special education teachers. Teachers completed the survey between March and May 2009. There were 2,575 respondents to the survey; 2,336 were special education teachers. Other respondents included paraprofessionals, adapted physical education teachers, and a few administrators. After the responses were compiled, contact information—including school district names— were verified by state department of education personnel to help ensure that the information was entered into the data base consistently and accurately. Responses from non-special education teachers were not included in this analysis.
Counts and percentages were tabulated
for each survey item and presented in
different formats seen in the results
section and Appendix B. The data
collected through the survey do not
allow for inferential statistics due to
the population not being randomly
sampled and both demographic (e.g.,
teaching setting and grade level) and
survey items not necessarily being
mutually exclusive. These limitations to
the data also restrict the ability to
use non-parametric methods such as
Chi-Square tests for statistically
significant differences between groups
in item responses. Thus, when
comparisons are made between groups,
descriptive results are presented and
noteworthy differences are highlighted
only if they meet an arbitrary threshold
of a 4% difference from the entire
sample’s mean percentage. This criterion
was selected because, for an item that
allows for only a single response, a 4%
difference in responding would represent
a difference of approximately 100
teachers given the aforementioned sample
size of nearly 2,500 respondents. The
mean overall percentage for each item
was used as a reference point because it
is an indicator of the central tendency
of the population of special education
teachers. Therefore, for the purposes of
this report, a deviation equal to or
greater than 4% from the overall mean of
the population is to be considered a
substantial difference between a
particular group of teachers and the
type of responding seen collectively
from teachers. Top of page | Table of Contents ResultsThe special education teachers were asked which classroom setting served as the context for the majority of their instruction. Teachers were able to select more than one option. Sixty-three percent of respondents indicated that they taught in a resource room setting for at least part of their work day (see Figure 1). Almost half were in co-teaching (inclusion) settings for at least part of the day. Fewer respondents indicated that they taught in a general education or self-contained classroom. Figure 1. Percent of Respondents Who Provide Instruction in Specific Settings
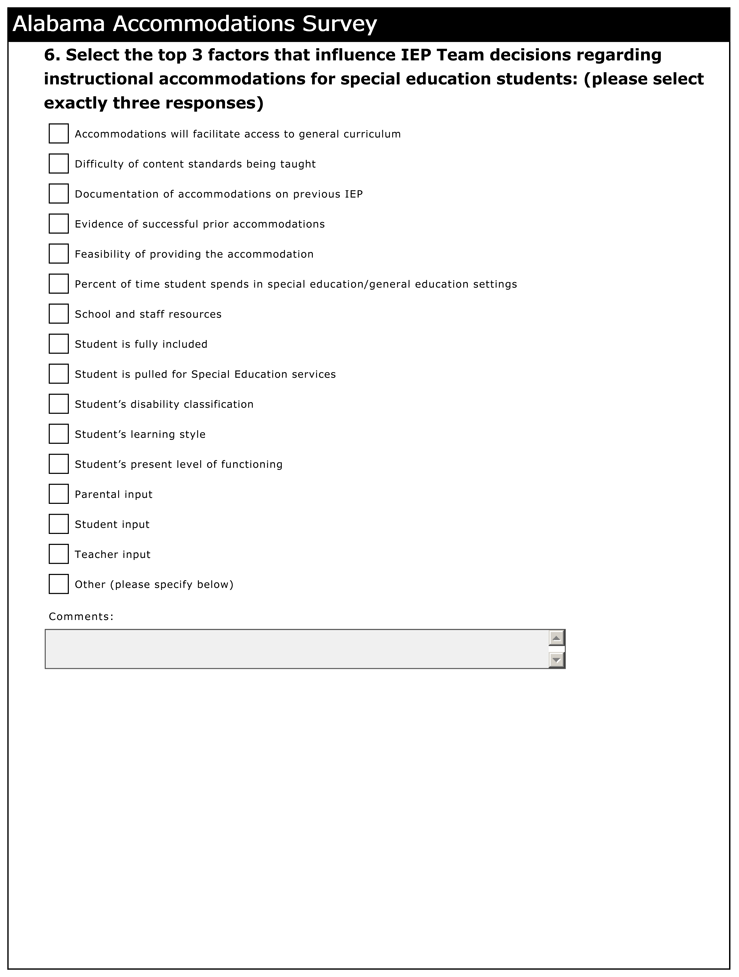
Instructional AccommodationsSpecial education teachers were asked how IEP teams at their schools determined a student’s needs for instructional accommodations. Each teacher was asked to select the three most important considerations. All responses are shown in Figure 2; thus, the percentages add to more than 100%. As shown in Figure 2, the student’s present level of functioning was selected by 57% of the respondents. Nearly half checked accommodations will facilitate access to curriculum. Other frequently selected responses included: evidence of successful prior use of accommodations, difficulty of content standards being taught, and student’s learning style. As indicated in Table B1 in Appendix B, special education teachers who taught in a self-contained setting had a substantially higher percentage of respondents selecting student’s disability classification, student’s present level of functioning, and parental input when compared to the overall mean percentage of teachers who selected these items. However, the percentage of teachers in self-contained classrooms who selected accommodations will facilitate access to curriculum was substantially less than the overall percentage of respondents selecting this item overall. Conversely, general education and co-teaching teachers selected this item 5% more than the overall mean percentage for all teachers. Figure 2. Top Factors for Decision Making on Instructional Accommodations
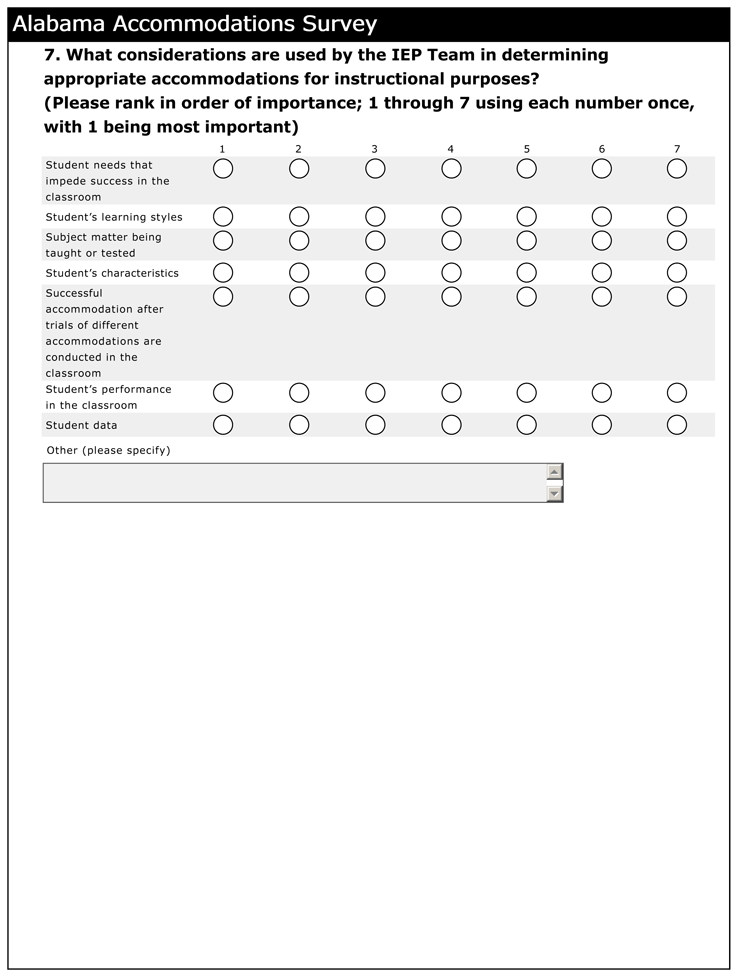
Respondents were asked to rank from 1 to 7 (with 1 being most important) the considerations used by the IEP team in determining appropriate accommodations for instructional purposes. If a respondent ranked the item 1 or 2, it was coded as “important.” As shown in Figure 3, student’s characteristics was ranked as important by 51% of the special education teachers. Thirty-four percent of the respondents ranked student’s learning styles as important, while about a quarter of the teachers ranked student data and successful classroom accommodation trials as important. The totals shown in Figure 3 do not add up to 100% because teachers could rank more than one item. Table B2 in Appendix B presents additional details about how teachers in different classroom settings responded. As indicated in Table B2, the only substantial deviation from the overall mean was in the case of respondents who taught in a self-contained setting who more frequently selected student’ s performance in the classroom than teachers in other settings. Figure 3. Considerations Reported by Respondents as Most Important in Making Instructional Accommodations Decisions
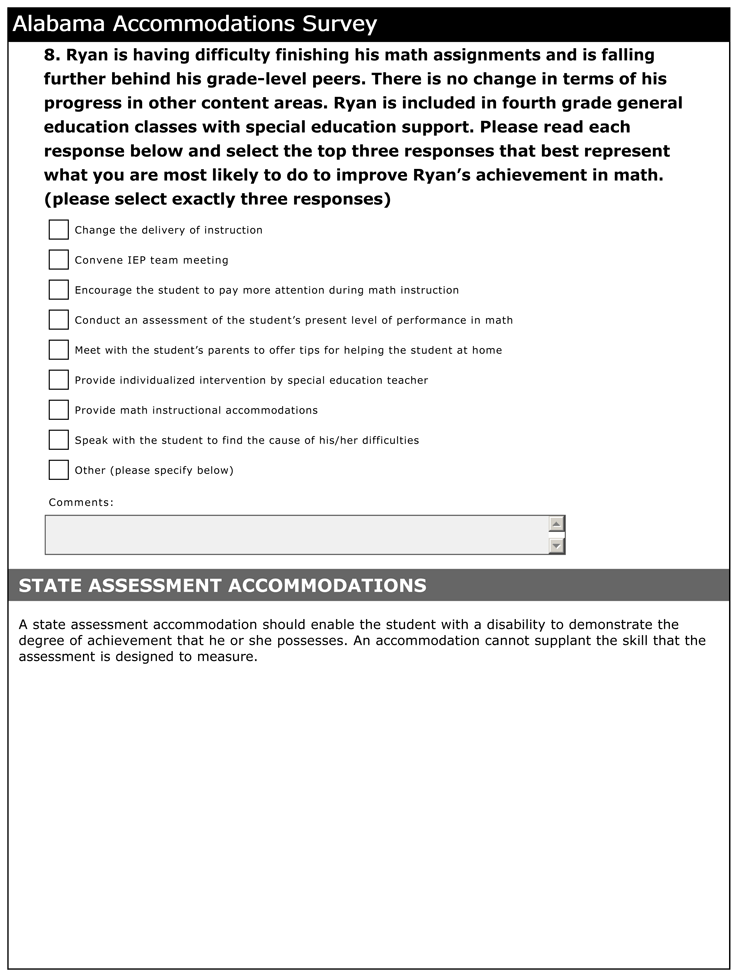
The survey included a scenario that pertained to the process that a teacher might use for a student who was having difficulty finishing math assignments and was falling behind his or her grade-level peers. Respondents were instructed to select exactly three responses that best represented what they were most likely to do in the given situation. As shown in Figure 4, at least 60 percent of the respondents opted for individualized intervention by teacher and provide math instructional accommodations. Other frequently listed responses included speak to student to find the cause of difficulties and conduct an assessment of student’s level of performance. Answer choices that were seldom marked were meet with the student’s parents and offer tips for at home and encourage student to pay more attention during instruction. As indicated in Table B3 in Appendix B, respondents who taught in a self-contained setting selected convene an IEP team meeting less frequently than teachers in other settings. Similarly, teachers in co-teaching settings selected conduct an assessment of student’s level of performance substantially less than average when compared to other settings, whereas teachers in self-contained settings selected this item substantially more than average. Another noteworthy difference was that co-teaching teachers tended to select speak with the student to find the cause of his/her difficulties more frequently than other teachers. Figure 4. Percentage of Respondents Marking Specific Actions in Response to Instructional Scenario
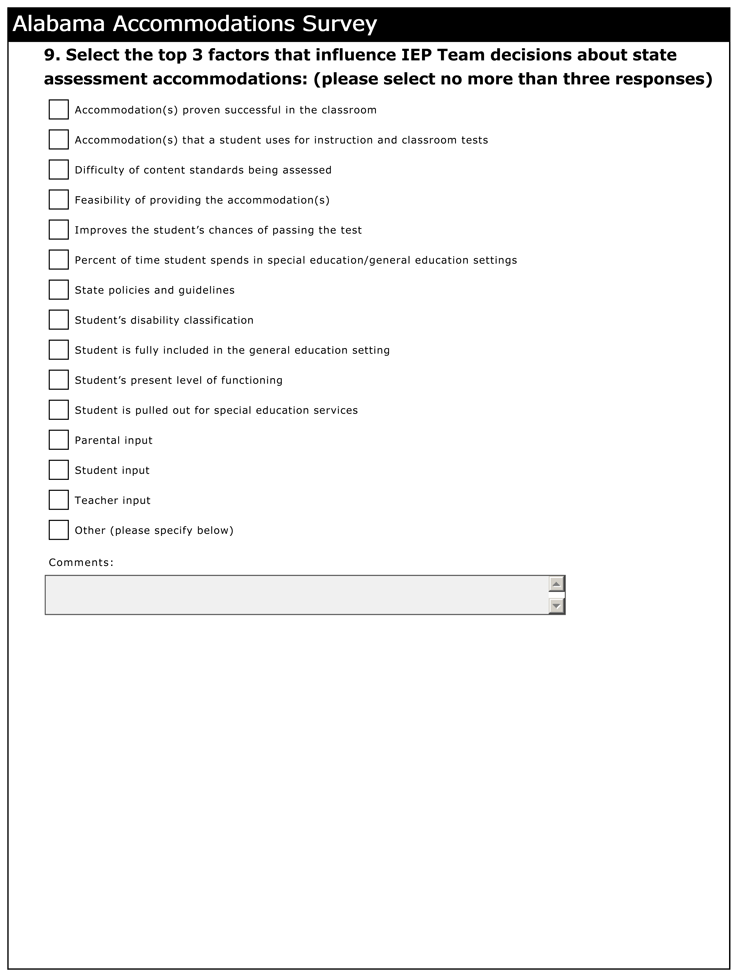
Assessment AccommodationsRespondents were asked to select three factors that influenced IEP team decisions about accommodations used on statewide assessments. As shown in Figure 5, accommodation(s) for instruction and classroom tests was selected by 62% of the special education teachers. Also, more than one in three respondents selected the following factors: accommodation(s) proven successful in class, student’s present level of functioning, and state policies and guidelines. Only 3% of the teachers considered student input to be an important factor. As indicated by Table B4 in Appendix B, respondents who taught in a self-contained setting more frequently selected student’s present level of functioning and difficulty of content standards, but selected accommodation(s) used for instruction and classroom tests substantially less than average. Teachers who taught in co-teaching (inclusion) settings more frequently selected accommodation(s) used for instruction than teachers in other settings. Figure 5. Top Factors for Decision Making on Assessment Accommodations
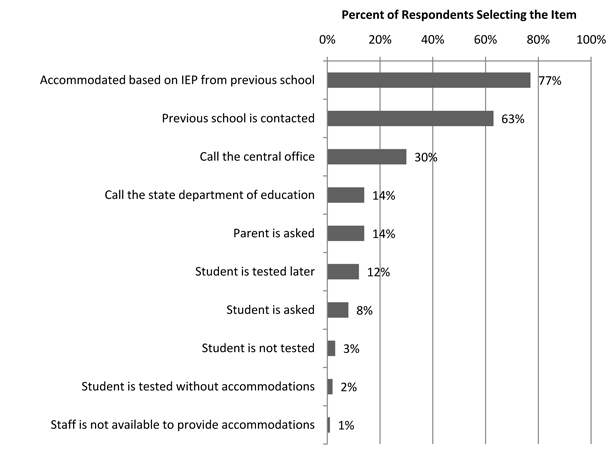
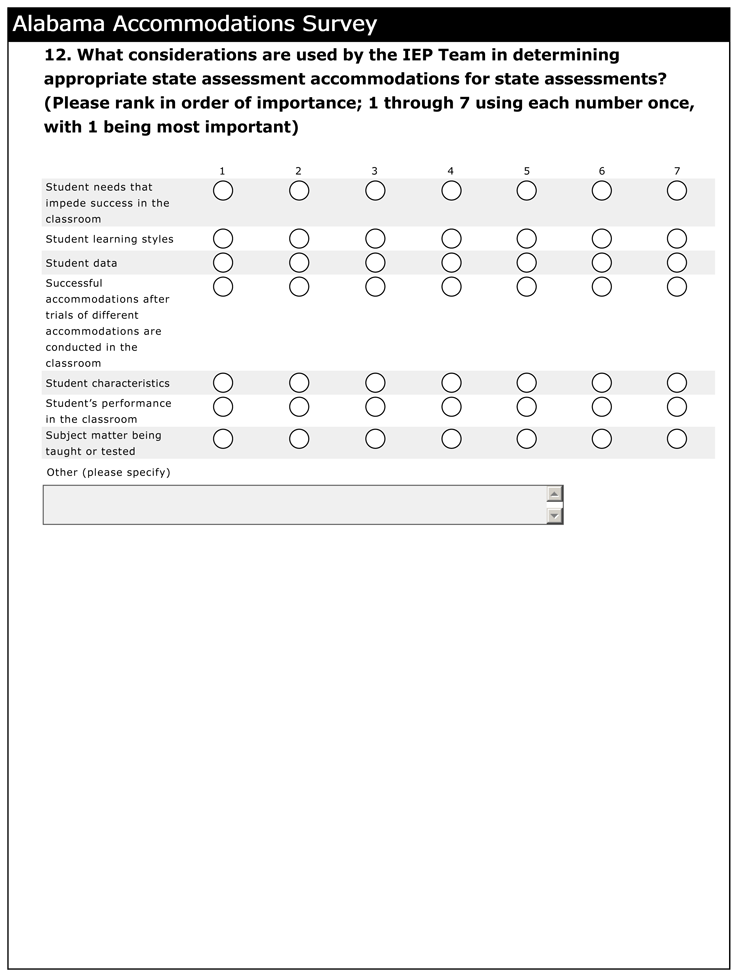
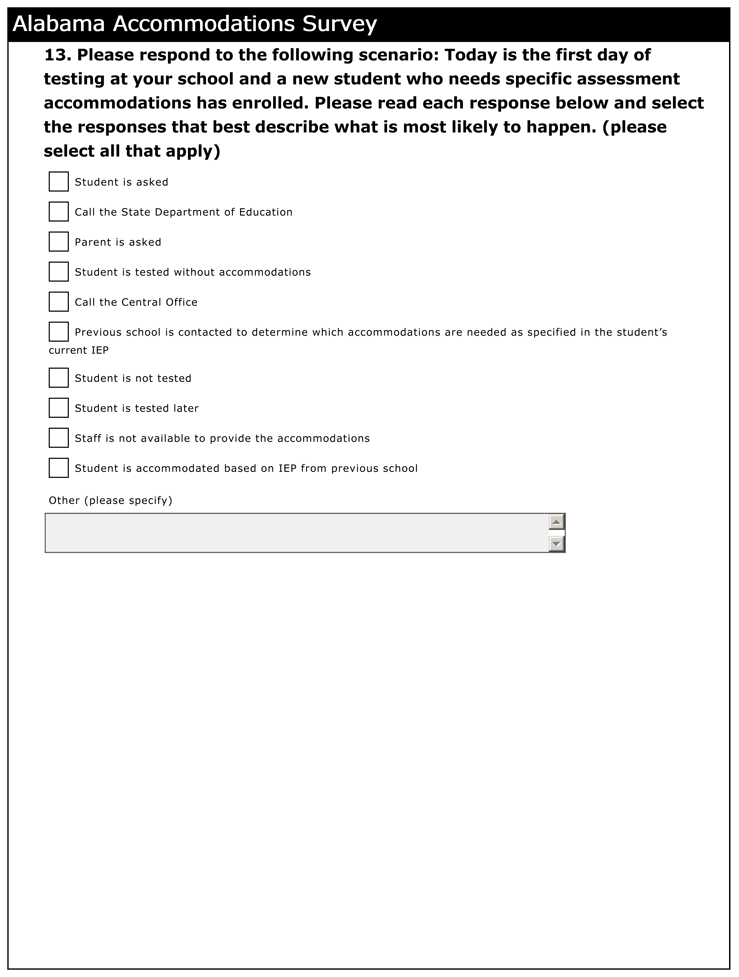
Respondents were asked to rank from 1 to 7 (with 1 being most important) the considerations used by the IEP team in determining appropriate assessment accommodations. If a respondent ranked the item 1 or 2, it was coded as “important.” As shown in Figure 6, 49% of the respondents selected successful classroom accommodation trials, and 38% selected subject matter being taught or tested, as important factors. As shown in Table B5 in Appendix B, the only substantial difference between groups and the average response rate for all items was for teachers who taught in self-contained classrooms who selected student characteristics less frequently than teachers in other settings. The questionnaire included a second scenario that pertained to the implementation of assessment accommodations. Specifically, the scenario involved a student who was new at the school and required testing accommodations. The teachers were asked how accommodations decisions would be made for this student. As shown in Figure 7 more than three-quarters of the respondents indicated that the student would typically be accommodated based on the IEP from previous school. Sixty-three percent indicated that previous school is contacted to determine which accommodations are needed. Figure 6. Considerations Reported by Respondents as Most Important in Making Assessment Accommodations Decisions
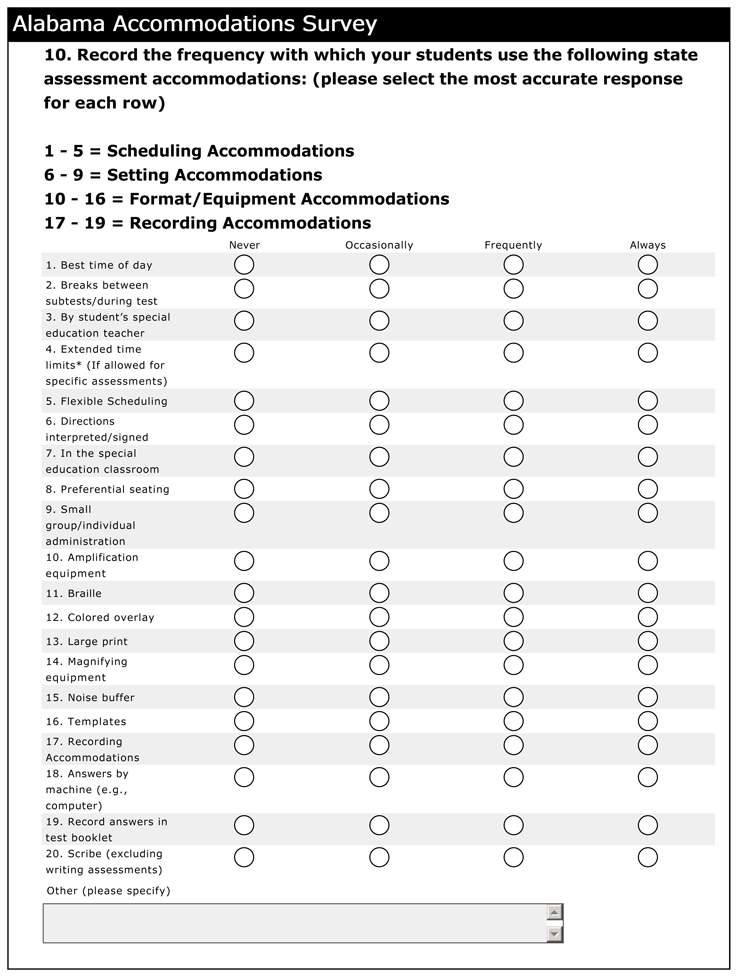
As shown in Table B6 in Appendix B, the only substantial difference between groups of teachers and the mean response rate for each item was that respondents who taught in self-contained classrooms selected call the central office less often than teachers who taught in other settings. Figure 8 lists the accommodations that the respondents indicated that their students used either always or frequently. Two-thirds of the teachers indicated that their students frequently or always had the small group/individual administration accommodation. About 50% of the teachers indicated that their students frequently or always had administration by student’s special education teacher, extended time limits and administration in the special education classroom. About 40% indicated preferential seating. Figure 7. Percent of Respondents Marking Specific Actions in Response to Assessment Scenario
Table B7 in Appendix B presents detailed information about assessment accommodations used by the teachers in different classroom settings. A number of noteworthy deviations from the mean were seen between classroom settings, particularly for teachers in self-contained classrooms. Specifically, teachers in self-contained classroom were substantially more likely to select the following accommodations: best time of day, breaks between subtests/during test, special education teacher, extended time limits, flexible scheduling, directions interpreted/signed, in the special education classroom, preferential seating, small group/individual administration, and recording accommodations. Teachers in the resource room and co-teaching settings selected less frequently than average best time of day and flexible scheduling. Additionally, teachers in co-teaching settings selected less frequently than the population average by student’s special education teacher and in the special education classroom. Respondents who were teachers in the general education classroom also selected in the special education classroom substantially less than the population average. Figure 8. Percent of Respondents’ Students Using Specific Assessment Accommodations
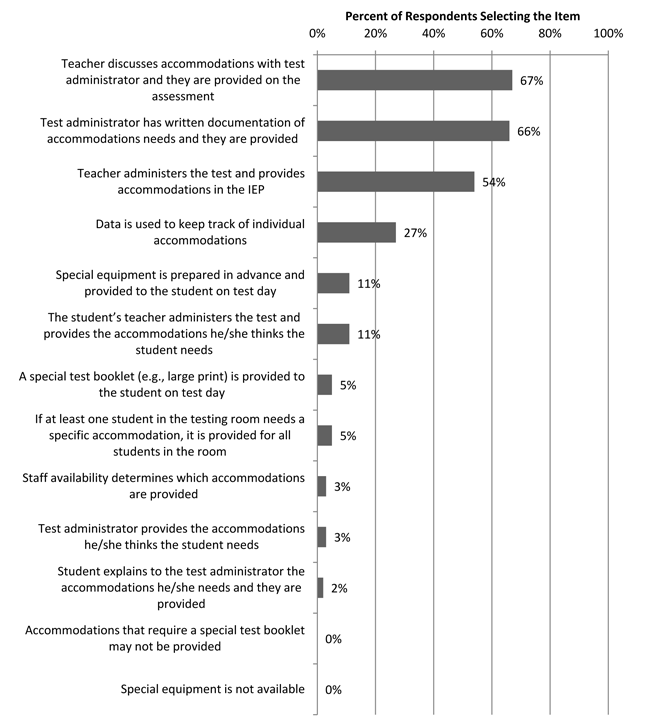
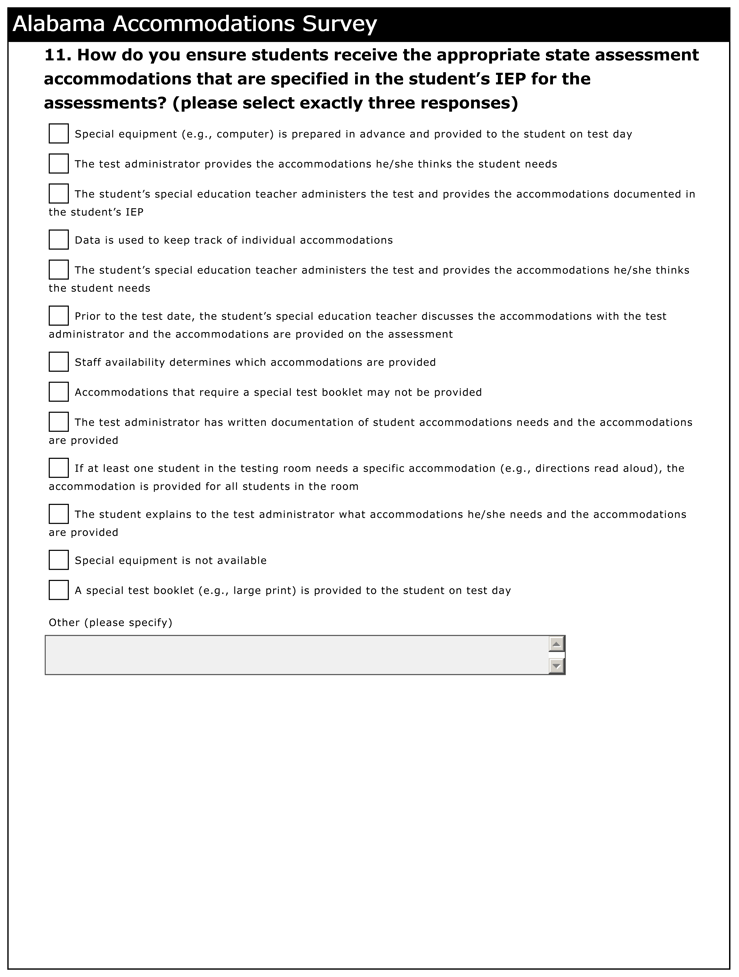
The survey asked respondents to mark the top three ways in which they ensured that students received the state assessment accommodations that are specified by the IEP. As shown in Figure 9, the responses selected by two out of three respondents were teacher discusses the accommodations with test administrator and they are provided on the assessment and test administrator has written documentation of accommodations needs and they are provided. Also more than half of the respondents indicated that the teacher administers the test and provides accommodations in the IEP. As with previous questions, because respondents made three selections, percentages sum to more than 100% in Figure 9. According to Table B8 in Appendix B, respondents who taught in self-contained classrooms more frequently selected the student’s teacher administers the test and provides the accommodations he/she thinks the student needs, but selected test administrator has written documentation of accommodations needs and they are provided and special equipment is prepared in advance and provided to the student on test day substantially less than the special education teacher population average. Conversely, teacher discusses accommodations with the test administrator and they are provided on the assessment and test administrator has written documentation of accommodations needs and they are provided were selected more substantially more frequently than average by resource room teachers and co-teaching teachers, respectively. Figure 9. Percentage of Respondents Marking How Accommodations are Implemented on Test Day
Top of page | Table of Contents DiscussionThe Alabama special education teacher survey results provide insight into how IEP teams select instructional and assessment accommodations. There was wide variation across survey respondents in the factors considered when making accommodations decisions. For example, more than 57% of the survey respondents indicated that a key criterion considered by the IEP team in the instructional accommodations process for a student was the student’s present level of functioning, whereas 28% identified the difficulty of content standards being taught as an important factor. These are generally considered to be sound criteria for IEP teams to consider (see for example, Crawford, 2007; Thurlow et al., 2006; Thurlow, Elliott, & Ysseldyke, 2003). Forty-nine percent of the special education teachers indicated that assessment accommodations decisions were based on successful classroom accommodations trials during instruction, and thirty-nine percent of special education teachers identified the subject matter being taught or tested as an important consideration. According to Elliott and Thurlow (2006), it is appropriate to try accommodations to see which work for specific students. It is a concern that only a few teachers considered student input to be an important factor. Student input about how accommodations work provides important information that can be used during the process. There may be a need for increased emphasis on the importance of state policies and federal regulations because only about one-third of the teachers indicated that they considered state policies and guidelines to be an important consideration when making assessment accommodations decisions. Teachers in self-contained classrooms were more likely to consider student’s disability classification when making instructional and assessment accommodations decisions than teachers in other settings. According to the Elementary and Secondary Education Act (ESEA) and the Individuals with Disabilities Education Act (IDEA), accommodations decisions should not be based on a student’s disability category (U.S. Department of Education, 2002, 2004). The results of this study suggest that special education teachers are knowledgeable about accommodations, but may have some gaps in their knowledge about how to effectively select and implement accommodations for instruction and assessment. Local Education Agency (LEA) personnel need training on accommodations so teachers and IEP teams will have a better understanding of the process. There may also be a need for teacher preparation programs to provide training on accommodations decision making for pre-service special education and general education teachers. Top of page | Table of Contents ReferencesAtchison, B. T. (2008). Assistive technology as an accommodation on accountability assessments: An analysis of attitudes and knowledge of special education professionals. Dissertation Abstracts International. Bottsford-Miller, N. A. (2008). A cross-sectional study of reported inconsistency in accommodation use in the classroom and standardized test setting for elementary and middle school students with disabilities. Dissertation Abstracts International, University of Minnesota. Byrnes, M. (2008). Educators’ interpretations of ambiguous accommodations. Remedial and Special Education, 29(5), 306 -315. Cawthon, S. W. (2006). National survey of accommodations and alternate assessment for students who are deaf or hard of hearing in the United States. Journal of Deaf Studies and Deaf Education, 11(3), 337 -359. Cormier, D. C., Altman, J. R., Shyyan, V., & Thurlow, M. L. (2010). A summary of the research on the effects of test accommodations: 2007-2008 (Technical Report 56). Minneapolis, MN: University of Minnesota, National Center on Educational Outcomes. Cox, M. E., Herner, J. G., Demczyk, M. J., & Nieberding, J. J. (2006). Provision of testing accommodations for students with disabilities on statewide assessments. Remedial and Special Education, 27(6), 346 -354. Crawford, L. (2007). State testing accommodations: A look at their value and validity. New York: National Center for Learning Disabilities. DeStefano, L., Shriner, J. G., & Lloyd, C. (2001). Teacher decision making in participation of students with disabilities in large-scale assessment. Exceptional Children, 68(1), 7-22. Elliott, J. L., & Thurlow, M. L. (2006). Improving test performance of students with disabilities on district and state assessments (2nd ed.). Thousand Oaks, CA: Corwin Press. Finizio, II, N. J. (2008). The relationship between instructional and assessment accommodations on student IEPs in a single urban school district. Dissertation Abstracts International, University of Massachusetts-Boston. Fuchs, L. S., Fuchs, D., Eaton, S. B., Hamlett, C., & Karns, K. (2000). Supplementing teacher judgments about test accommodations with objective data sources. School Psychology Review, 29(1), 65-85. Gibson, D., Haeberlie, F., Glover, T. A., & Witter, E. A. (2005). Use of recommended and provided testing accommodations. Assessment for Effective Intervention, 31(1), 19 -36. Langley, J., & Olsen, K. (2003). Training district and state personnel on accommodations: A study of state practices, challenges, and resources. Washington, DC: Council of Chief State School Officers. Lazarus, S. S., Thompson, S. J., & Thurlow, M. L. (2005). How students access accommodations in assessment and instruction: Results of a survey of special education teachers (Issue Brief 7). College Park, MD: University of Maryland, Educational Policy Reform Research Institute. Lazarus, S. S., Thurlow, M. L., Lail, K. E., & Christensen, L. (2009). A longitudinal analysis of state accommodations policies: Twelve years of change 1993-2005. Journal of Special Education, 43(2), 67-80. Maccini, P., & Gagnon, J. C. (2006). Mathematics instructional practices and assessment accommodations by secondary special and general educators. Exceptional Children, 72(2), 217 -234. Nolet, V., & McLaughlin, M. J. (2005). Accessing the general curriculum: Including students with disabilities in standards-based reform (2nd ed.). Thousand Oaks, CA: Corwin Press. Rhode Island Department of Education. (2002). Rhode Island assessment accommodation study: Research summary. Minneapolis, MN: University of Minnesota, National Center on Educational Outcomes. Thurlow, M. L., Elliott, J. L., & Ysseldyke, J. E. (2003). Testing students with disabilities: Practical strategies for complying with district and state requirements. Thousand Oaks, CA: Corwin Press. Thurlow, M.L., Lazarus, S. S., & Christensen, L .L. (2008). Role of assessment accommodations in accountability. Perspectives on Language and Literacy. 34(4), 17-20. Thurlow, M. L., Thompson, S. J., & Lazarus, S. S. (2006). Considerations for the administration of tests to special needs students: Accommodations, modifications, and more. S. M. Downing & T. M. Haladyna (Eds.), Handbook of test development (pp. 653-673). Mahwah, NJ: Lawrence Erlbaum. U.S. Department of Education (2002). The no child left behind act of 2001. Elementary and secondary education act of 1965. 20 U.S.C. 6301 et seq. U.S. Department of Education. (2004). Individuals with disabilities education improvement act of 2004. Washington, DC: Author. Retrieved from http://idea.ed.gov/explore/view/p/%2Croot%2Cstatute%2C U.S. Department of Education (2007). Final Rule 34 CFR Parts 200 and 300: Title I—Improving the academic achievement of the disadvantaged; Individuals with disabilities education act (IDEA). Federal Register. 72(67), Washington DC: Author. Retrieved from http://cehd.umn.edu/NCEO/2percentReg/Federal-RegApril9TwoPercent.pdf Top of page | Table of Contents Appendix ASurvey Instrument
Top of page | Table of Contents Appendix BResults Disaggregated by Classroom SettingTable B1.Top Factors for Decision Making on Instructional Accommodations, Disaggregated by Classroom Setting
Table B2. Considerations Reported by Respondents as Most Important in Making Instructional Accommodations Decisions, Disaggregated by Classroom Setting
Table B3. Percentage of Respondents Marking Specific Actions in Response to Instructional Scenario, Disaggregated by Classroom Setting
Table B4. Percentage of Respondents Selecting Top Factors for Decision Making on Assessment Accommodations, Disaggregated by Classroom Setting
Table B5. Percentage of Respondents Marking Specific Considerations Which Lead to Assessment Accommodations Decisions, Disaggregated by Classroom Setting
Table B6. Percentage of Respondents Marking Specific Actions in Response to Assessment Scenario, Disaggregated by Classroom Setting
Table B7. Percentage of Respondents Using Specific Assessment Accommodations, Disaggregated by Classroom Setting
Table B8. Percentage of Respondents Marking How Accommodations are Implemented on Test Day, Disaggregated by Classroom Setting
|


