Varied Opinions on How to Report Accommodated Test Scores: Findings Based on CTB/McGraw-Hill's Framework for Classifying Accommodations
NCEO Synthesis Report 49
Published by the National Center on Educational Outcomes
Prepared by:
John Bielinski
NCEO
Alan Sheinker
National Assessment Consultant
CTB/McGraw-Hill
Jim Ysseldyke
College of Education and Human Development
University of Minnesota
April 2003
Bielinski, J., Sheinker, A., & Ysseldyke, J. (2003). Varied opinions on how to report accommodated test scores: Findings based on CTB/McGraw-Hill's framework for classifying accommodations(Synthesis Report 49). Minneapolis, MN: University of Minnesota, National Center on Educational Outcomes. Retrieved [today's date], from the World Wide Web: http://cehd.umn.edu/NCEO/OnlinePubs/Synthesis49.html
Executive Summary
Policies intended to increase the participation of students with disabilities in state and local assessment systems have been in full force for several years. Test accommodations constitute the most frequently used alternative to increase their participation rates. Because accommodations continue to be so widely applied despite the limited amount of empirical research available demonstrating how they affect test scores, it is necessary that sound, rational decisions be made about the use of accommodated test scores.
One challenge confronting state education agencies is to determine the most appropriate way to report the test scores of those students receiving accommodations. There are three general options:
1. Report all scores in the aggregate (i.e., do not differentiate between accommodated and non-accommodated test scores)
2. Report accommodated scores separately
3. Report accommodated scores both in the aggregate as well as separately
Each option reflects different beliefs about how accommodations influence test scores.
The future of accommodations research depends, in part, on the perceived need for the research as well as continued availability of the resources to conduct such research. The opinions of the stakeholders, particularly those influencing policy on how to report scores from accommodated tests, may provide a barometer of the perceived need for further research.
The present study is a survey of the perceptions held by people familiar with policy or research on the way in which test scores are influenced by accommodations and how scores obtained under accommodated conditions are to be treated in reporting. The results show that the extent of agreement about how accommodated scores should be treated depends on the accommodation. The study also shows how deep-seated beliefs lead some respondents to consider almost no accommodation as changing the construct, whereas other respondents consider almost all accommodations as influencing the construct being measured.
Policies intended to increase the participation of students with disabilities in state and local assessment systems have been in full force for several years. Test accommodations constitute the most frequently used alternative to increase participation rates of these students. The widespread use of test accommodations has spawned a flurry of empirical studies to explore questions such as what accommodations should be used and with whom. It will be some time before answers to these questions are sufficiently refined to enable strong conclusions about the benefits and drawbacks of test accommodations. In the meantime the use of accommodations flourishes (American Council on Education, 2002; Thompson & Thurlow, 2001). Because accommodations continue to be so widely applied despite the limited amount of empirical research available demonstrating how they affect test scores (Thompson, Blount, & Thurlow, 2002), it is necessary that sound, rational decisions be made about the usability of accommodated test scores.
One challenge confronting state education agencies is to determine the most appropriate way of reporting test scores for students receiving accommodations. There are three general options:
1. Report all score in the aggregate (i.e., do not differentiate between accommodated and non-accommodated test scores)
2. Report accommodated scores separately
3. Report accommodated scores both in the aggregate as well as separately
Each option reflects different beliefs about how accommodations influence test scores. Option 1 implies that the accommodated test scores measure the same construct in the same way as non-accommodated test scores. Option 2 implies that the accommodation changes the meaning of the test score, therefore the scores must be considered separately. Option 3 implies uncertainty about how the accommodation influences test scores, if at all; the third option reflects the reality of test accommodations research – we simply do not have definitive evidence about how each accommodation or combination of accommodations influences test scores. Options 1 and 2 may represent personal biases more than definitive empirical evidence.
There is some evidence that the opinions of people who are familiar with this issue vary, even to the point that the opinions are in direct opposition. State guidelines about how to report accommodated test scores provide evidence of this. The lists of approved and non-approved accommodations in each state show that an accommodation that is approved in one state may not be approved in another state, even when the same assessment is used (Thurlow, House, Boys, Scott, Ysseldyke, 2000; Thurlow, Thompson, Lazarus, & Robey, 2002). Federal regulations that require states to report test scores for students with disabilities in the aggregate and separately, in combination with the high stakes placed on the scores, makes this reporting issue particularly salient. Furthermore, the conflict between what measurement theory regards as essential for test score comparisons and the provision that any-and-all accommodations must be made available to students with a disability compounds the issue (Heumann & Warlick, 2000), raising tensions and uncertainty.
The future of accommodations research depends, in part, on the perceived need for the research as well as continued availability of the resources to conduct such research. The opinions of the stakeholders, particularly those influencing policy on how to report scores from accommodated tests, may provide a barometer of the perceived need for further research. For instance, one would expect little perceived need if all of the people influencing policy decisions shared the same opinion on how to treat test scores obtained under non-standard conditions. On the other hand, if the opinions of this stakeholder group varied, then a need for more research, or at least more discussion of the issues, would be indicated. The extent of need for more research likely varies by the type of accommodation. Those accommodations on which there is little agreement about perceived effects on test score interpretation deserve most of our attention.
The present study is a survey of the perceptions held by people familiar with policy or research on the way in which test scores are influenced by accommodations and how scores obtained under accommodated conditions are to be treated. Rather than asking participants directly about how they believe an accommodation influences test score interpretation, the study asked participants to classify accommodations into one of three categories that can be distinguished by the degree to which accommodations influence performance using a classification scheme developed by CTB/McGraw-Hill.
In an effort to create guidelines for using test results from standardized tests administered under non-standard conditions, CTB/McGraw-Hill created a framework for classifying accommodations (CTB/McGraw-Hill, 2000). Accommodations were framed according to their expected influence on student performance, and then according to how the results should be reported. Category 1 accommodations are not expected to influence test performance in a way that would alter the characteristics of the test. According to the CTB/McGraw-Hill document, test scores for students receiving such accommodations should be interpreted as test scores from standard administrations, and these scores should be aggregated with the scores of standard administrations. According to CTB/McGraw-Hill, Category 2 accommodations are expected to have some influence on test performance, but should not alter the construct the test was designed to measure. Category 2 accommodations may boost test performance; therefore, the type of accommodation used should be considered when interpreting the test scores. Scores obtained under Category 2 accommodations can be aggregated with scores obtained under standard conditions, but the scores should also be reported separately and the number and percent of students using such accommodations should be clearly indicated along with summary statistics. Category 3 accommodations, as classified by CTB/McGraw-Hill, are expected to alter the construct that the test was designed to measure. In the absence of research demonstrating otherwise, scores obtained under Category 3 accommodations should be interpreted in light of how the accommodation is thought to influence performance. Some of the Category 3 accommodations are content specific, for example receiving the read-aloud accommodation on a reading test, or using a calculator on math computation items. Score interpretation should consider the accommodation-content combination and whether the accommodation changes what the tests were designed to measure. According to CTB/McGraw-Hill, scores from Category 3 accommodations should be reported in aggregated and disaggregated forms, and the number and percent of students using such accommodations should be clearly indicated along with summary statistics.
Using the three categories of accommodations, a survey was created in which participants were asked to assign each of 44 accommodations to one of the three categories. The categories were designed to be mutually exclusive, but they might not have been exhaustive.
Participants
Participants chosen for this study were familiar with accommodations research or state policies on the use of test accommodations. A survey was sent to each of the 50 state assessment directors, each state special education director, and to individuals who have presented research on test accommodations or have published accommodations research. One hundred and thirty surveys were mailed initially, and also re-mailed to those who had not responded to the first mailing. In all, we obtained responses from 86 individuals (66% of those sent). Of these, 63 (73%) provided a single rating for each accommodation, and 77 (89%) provided a single rating for at least 40 of the 44 accommodations.
Of the 86 respondents, 60 were state department of education personnel, either assessment directors or special education directors. Eleven respondents were involved in accommodations research or in drafting policy guidelines on the use of accommodations. The other 11 respondents were practitioners or described themselves by checking multiple categories.
Accommodations
The accommodations used in this survey were chosen to be representative of the accommodations used in practice. This list of 44 accommodations was not meant to be exhaustive. A popular classification scheme was used to cluster the accommodations and to ensure that these accommodations represented different aspects of test administration that could be accommodated (Thurlow, Ysseldyke, & Silverstein, 1993). The four categories were: (1) presentation, (2) response, (3) setting, and (4) timing. According to this scheme, accommodations can be distinguished by that aspect of the standard administration that is altered by the accommodation. For instance, presentation accommodations represent accommodations that alter the standard presentation of the test - presenting test material in Braille is a common example of a presentation accommodation. Response accommodations alter the way in which examinees respond to test items - marking the answer in the test booklet as opposed to a bubble sheet would be an example of a response accommodation. Setting accommodations usually refer to changes in the typical size of the group to which the test is administered or the location the test is taken - taking the test in a small group is an example of a setting accommodation. Timing accommodations typically refer to allowing the examinee extra time to complete the test. There were 20 presentation accommodations, 14 response accommodations, 5 setting accommodations, and 5 timing accommodations (see Appendix A).
The categories into which respondents placed each of the 44 accommodations in the CTB/McGraw-Hill list were examined by creating frequency distributions. These were plotted as bar graphs according to the four category classification scheme (presentation, response, setting, timing).
Presentation Accommodations
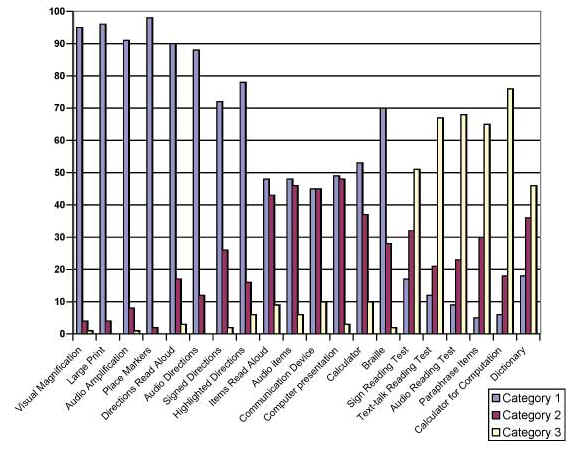
Figure 1 displays the results for the 20 presentation accommodations. As is evident in the bar graph, there was little variability in the classification of the first four presentation accommodations (visual magnification, large print, audio amplification, and place markers); most of the respondents (over 90%) chose Category 1 for these four accommodations. The next four accommodations all represent ways of presenting test directions (read aloud, audio, signed, and highlighted). At least 70% of the respondents also chose Category 1 for these accommodations. The CTB/McGraw-Hill category chosen by respondents for the remaining presentation accommodations varied much more. Most respondents classified items read aloud, audio items, communication device, and computer presentation into either Category 1 or Category 2. More than 50% of the respondents classified accommodations representing oral presentation of the reading test and providing a calculator for a math computation test as Category 3.
Figure 1. Frequency Distribution of Category Ratings for Presentation Accommodations
Response Accommodations
Figure 2 displays the results for the 14 response accommodations. More than 85% of the respondents placed responding in the test booklet, large print, using a template, and using graph paper into Category 1. There was little agreement as how to treat the response accommodations like scribes and spell checkers used when spelling was not scored. The use of a spell checker when spelling was scored was more consistently categorized by respondents into Category 3. Still, some respondents did place this accommodation into Category 2, and some placed it in Category 1.
Figure 2. Frequency Distribution of Category Ratings for Response Accommodations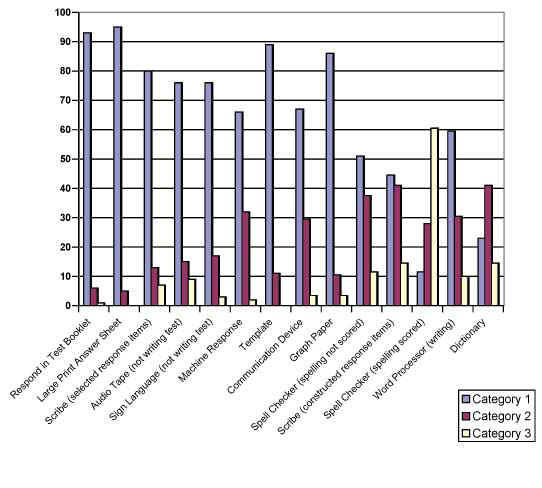
Figure 3 displays the distribution of responses to the setting accommodations. Respondents almost unanimously agreed that taking a test alone or in a small group, or the use of adaptive furniture or special lighting or acoustics did not alter the meaning of the score, and therefore could be placed in Category 1, where scores should simply be reported in the aggregate as though they are standard scores. The accommodation of taking the test at home or in a care facility received less consistent placement into Category 1. Roughly one-third of the respondents placed this accommodation into Category 2.
Figure 3. Frequency Distribution of Category Ratings for Setting Accommodations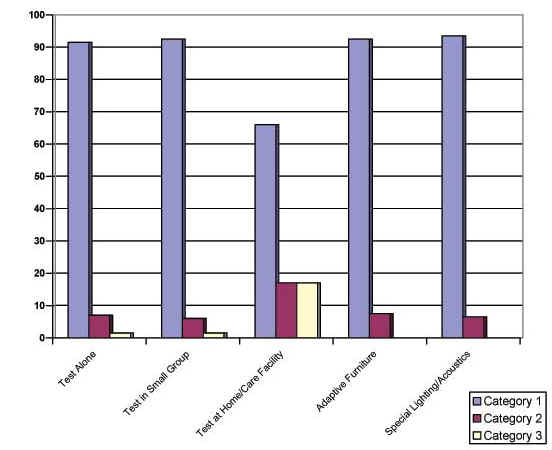
Figure 4 displays the distribution of responses to the timing accommodations. Respondents unanimously agreed that the first two accommodations (additional breaks and flexible scheduling) do not alter the meaning of test scores and therefore belong in Category 1. These represent scheduling accommodations that do not result in extra testing time. The timing accommodation of taking the test over several days, but still not resulting in extra time, showed greater variability in responses. About 55% of the respondents placed this accommodation into Category 1, 35% placed it into Category 2, and 15% placed it into Category 3. The majority of respondents placed the timing accommodations of extra time on a timed test and extra breaks on a timed test into either Category 2 or Category 3.
Figure 4. Frequency Distribution of Category Ratings for Timing Accommodations
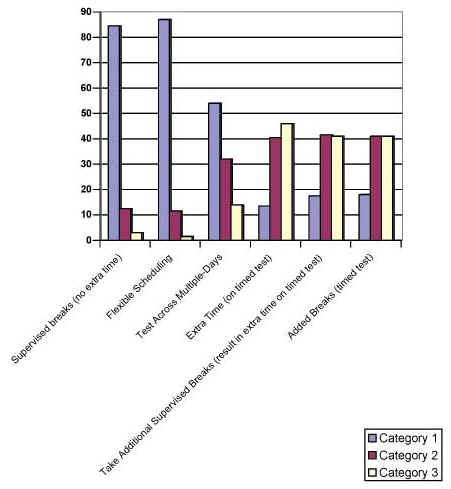
Table 1 is a count of the accommodations by level of agreement. Low agreement was defined as less than 50% of the respondents placing the accommodation into the same category, moderate agreement was defined as 50 to 89% of respondents choosing the same category, and high agreement was defined as 90% or more choosing a particular category for an accommodation. There was low agreement on 14 of the accommodations, moderate agreement on 17, and high agreement on 13 of the accommodations. Specific accommodations by level of agreement among participants can be found in Appendix B.
Table 1. The Number and Percent of Accommodations by Level of Agreement
Agreement |
Number |
Percent |
Low |
14 |
32 |
Moderate |
17 |
39 |
High |
13 |
29 |
Table 2 is a list of the accommodations in which more than 90%
of the respondents indicated that the accommodation belonged in Category 1.
Included in this list are three presentation accommodations, three response
accommodations, and four setting accommodations. None of the timing
accommodations were agreed upon by 90% of respondents as belonging to Category
1.
Table 2. Accommodations That Respondents Unanimously Agreed Belong in Category 1
Accommodation |
Percent Category 1 |
Presentation
|
95 |
|
96 |
|
92 |
Response
|
98 |
|
93 |
|
95 |
Setting
|
92 |
|
93 |
|
93 |
|
94 |
Individual Bias
The degree to which some individuals favor accommodations regardless of the type of accommodation was analyzed by examining categorizations of accommodations that alter some feature of the test directly involved in test performance and that therefore might be expected to change the construct of the test. For instance, oral presentation during a reading test is perceived by some respondents to alter what the test was intended to measure, reading skills. Six accommodations of this type were identified (see Table 3) and the percentage of respondents choosing Categories 1 or 2 calculated. Twenty-five percent of the respondents indicated that the scores obtained from using a calculator on a computation test should be treated as Category 1 or Category 2, and 58% indicated that scores obtained with extra time on a timed test should be treated as Category 1 or Category 2.
Table 3. Percent of Respondents Assigning Category 1 or 2 to Accommodations That Alter a Feature of the Test Critical to Performance
Percent Category 1 or 2 |
|
|
32 |
|
31 |
|
33 |
|
25 |
|
38 |
|
58 |
The findings in this study point to the need for further dialogue and more research on test accommodations. The opinions of those who influence policy and who are familiar with test accommodations vary too much to ignore. When one group believes that an accommodation alters the construct and thus should be treated differently, while another group believes that the accommodation maintains the integrity of the scores, there is a need for further discussion. However, it is unlikely that discussion without empirical evidence will lead to greater agreement.
Even empirical evidence may not be enough to sway opinion. This survey seems to verify that beliefs about how to treat accommodated scores run deep. The fact that nearly everyone believes that the accommodations listed in Category 1 do not affect test scores in a way that would alter the meaning of the scores suggests that the field should not devote precious resources to further empirical investigation of these.
Although there does not appear to be a single theme underlying this list of accommodations, it would appear that several of the accommodations were intended primarily for students with either a physical or a sensory disability. It is not surprising to find accommodations meant for students with physical and sensory disabilities on this list. The distinction between the disability and the purpose of the assessment is clear for students with physical and sensory disabilities. However, as Phillips (1994) pointed out, this distinction is not so clear for students with learning disabilities. The idea of accommodating students with physical disabilities resonates so well with so many of the people familiar with test accommodations that it is often used as a metaphor to illustrate the purpose of test accommodations for students with other disabilities. For example, Elliott, Kratochwill, McKevitt, Schulte, Marquart, and Mroch (1999) use the metaphor of an access ramp to illustrate how test accommodations work. Without an access ramp a student using a wheel chair would not be able to "access" the test. They argue that accommodations are a means to reduce the barrier of access skills. Access skills refer to the test-taking skills required to demonstrate what one knows and can do (e.g., attention and the ability to read). Presumably access skills, although necessary, are incidental to the construct the test was designed to measure. However, even the notion of access skills becomes murky for many accommodations. For instance, should reading math word problems be considered incidental to the construct of math problem solving?
Another accommodation that received almost unanimous assignment to Category 1 is small group administration. An accommodation is defined as an alteration to standard test administration. Each of the essential aspects of standard administration should be described in the test procedures manual. Furthermore, one would assume that all procedures essential to standard administration are in place during the field-testing. One may wonder whether group size is defined in the test procedures manuals, and whether a uniform sized group is used at every site in the field test. If the two preceding conditions are not met, one could argue that small group administration does not constitute a testing accommodation. The decision to treat small-group administration as an accommodation is particularly important because it is one of the most frequently used accommodations.
The extent of the variability in the respondents’ perceptions to this survey may simply reflect the differences in the opinions researchers have regarding the way in which the effectiveness of an accommodation is demonstrated. Much of the recent accommodations research has dealt with the extent to which an accommodation boosts test performance (Elliott, Kratochwill, McKevitt, Schulte, Marquart, & Mroch, 1999; Fuchs, Fuchs, Eaton, Hamlett, & Karns, 2000; Thompson, Blount, & Thurlow, 2002; Tindal, Helwig, & Hollenbeck, 1999). Although a performance boost may be necessary to conclude that an accommodation was effective, it is not sufficient to conclude that the accommodation was valid. Overemphasizing a test score boost may have led people less familiar with measurement theory to conclude that an accommodation is valid if it boosts performance. It might also explain why IEP teams tend to over-accommodate; IEP teams may try any accommodation that may boost performance. More research is needed to examine whether accommodated tests alter the validity of the scores. Furthermore, accommodations research on performance boost should always acknowledge that a boost does not imply that the accommodated scores are a valid measure of the construct.
The variability in the perceptions about how accommodated scores should be treated may be due in part to the lack of a sound measurement model for accommodations. The justification for accommodations is based largely on the belief that accommodations level the playing-field. What does it mean to level the playing-field? For an accommodation to level the playing-field, it must be assumed that standard testing conditions impinge on the performance of students with disabilities. Performance here is considered in the maximal sense. Test score theory posits a "true" score, which is defined as the average performance over repeated testing with the same pool of items under the same conditions. However, accommodations change those conditions; therefore, the notion of true score no longer applies. It is beyond the scope of this paper to introduce a new theoretical conceptualization of test accommodations, but it suffices to say that it may be more logical to view accommodations as a means of establishing optimal testing conditions. Regardless of precisely how accommodations are perceived, there is a need for applying a testable measurement model to this concept.
American Council on Education. (2002). GED 2001 statistical report: Who took the GED? Washington, DC: Author.
CTB/McGraw-Hill. (2000). Guidelines for using the results of standardized tests administered under nonstandard conditions. Monterey, CA: Author.
Elliott, S.N., Kratochwill, T.R., McKevitt, B, Schulte, A.G., Marquart, A., & Mroch, A. (June, 1999). Experimental analysis of the effects of testing accommodations on the scores of students with and without disabilities: Mid-project results. A paper presented at the CCSSO Large-Scale Assessment Conference, Snowbird, Utah, June, 1999.
Fuchs, L.S., Fuchs, D., Eaton, S.B., Hamlett, C., & Karns, K. (2000). Supplementing teacher judgments about test accommodations with objective data sources. School Psychology Review, 29(1), 65-85.
Heumann, J.E, & Warlick, K.R. (2000). Questions and answers about provisions in the Individuals with Disabilities Education Act Amendments of 1997 related to students with disabilities and state and district-wide assessments (Memorandum OSEP 00-24). Washington, DC: U.S. Department of Education, Office of Special Education and Rehabilitative Services.
Tindal, G., Heath, B., Hollenbeck, K., Almond, P., & Harniss, M. (1998). Accommodating students with disabilities on large-scale tests: An experimental study. Exceptional Children, 64(4), 439-451.
Thompson, S., & Thurlow, M. (2001). 2001 State special education outcomes: A report on state activities at the beginning of a new decade. Minneapolis, MN: University of Minnesota, National Center on Educational Outcomes.
Thompson, S., Blount, A., & Thurlow, M. (2002). A summary of research on the effects of test accommodations: 1999 through 2001 (Technical Report 34). Minneapolis, MN: University of Minnesota, National Center on Educational Outcomes.
Thurlow, M.L., Lazarus, S., Thompson, S., & Robey, J. (2002). 2001 state policies on assessment participation and accommodations (Synthesis Report 46). Minneapolis, MN: University of Minnesota, National Center on Educational Outcomes.
Thurlow, M., Ysseldyke, J., & Silverstein, B. (1993). Testing accommodations for students with disabilities: A review of the literature (Synthesis Report No. 4). Minneapolis, MN: University of Minnesota, National Center on Educational Outcomes.
Thurlow, M., House, A., Boys, C., Scott, D., & Ysseldyke, J. (2000). State participation and accommodation policies for students with disabilities: 1999 update (Synthesis Report 33). Minneapolis, MN: University of Minnesota, National Center on Educational Outcomes.
Thurlow, M., & Weiner, D. (2000). Non-approved accommodations: Recommendations for use and reporting (Policy Directions 11). Minneapolis, MN: University of Minnesota, National Center on Educational Outcomes.
Presentation Accommodations |
|
|
|
|
|||
|
|||
|
|||
|
|||
|
|||
|
|||
|
|||
|
|||
|
|||
|
|||
|
|||
|
|||
|
|||
|
|||
|
|||
|
|||
|
|||
|
|||
|
|||
|
|||
Response Accommodations |
|
|
|
|
|||
|
|||
|
|||
|
|||
|
|||
|
|||
|
|||
|
|||
|
|||
|
|||
|
|||
|
|||
|
|||
|
|||
Setting Accommodations |
C1 |
C2 |
C3 |
|
|||
|
|||
|
|||
|
|||
|
|||
Timing/Scheduling Accommodations |
C1 |
C2 |
C3 |
|
|||
|
|||
|
|||
|
|||
|
Level of Agreement |
||
High |
Moderate |
Low |
Presentation
|
||
Visual
magnifying |
Directions read aloud |
Stimulus material, questions
and/or answer choices read aloud |
Large-print edition |
Directions read via audio recorder |
Stimulus material, questions
and/or answer choices via audio recorder |
Audio
amplification |
Directions marked with highlighting |
Stimulus material, questions
and/or answer choices read aloud, except for reading comprehension test |
Marker to
maintain place |
Directions presented via sign language |
Communication devises (e.g.
text-talk converter) for stimulus material, except for reading comprehension
test |
Audio recording of stimulus
material etc. on reading comprehension test |
Braille |
Computer presentation of text not
otherwise available for computer presentation |
Directions, stimulus material,
questions, and/or answer choices paraphrased |
Sign language for stimulus
material etc. on reading comprehension test |
Use
calculator, except for math computation test |
Use calculator on math
computation test |
Text-talk converter on a reading
comprehension test |
|
Use
dictionary |
||
Response
|
||
Mark
responses in test booklet |
For
selected-response items, indicate responses to scribe |
Use
computer, typewriter, Braille writer to respond |
Mark
response on large-print answer document |
Record
responses on audio-recorder, except for writing test |
Indicate
response with other communication devise |
Use
template to maintain place for responding |
Use spell
checker except
with a test for which spelling will be scored |
|
Use sign
language for response, except for writing tests |
For constructed-response, dictate
response to scribe |
|
Use graph
paper to align work |
For test
in which writing will be scored, respond on word processor WITHOUT spell
check |
|
For test in which writing will be
scored, respond on word processor with spell check |
||
Use a dictionary |
||
Setting
|
||
Take test
alone with supervision |
Take test
at home or other facility away from school |
|
Take test
in small group |
||
Use
adaptive furniture |
||
Use
special lighting or acoustics |
||
Timing/Scheduling
|
||
Take
additional supervised breaks that do not result in extra time |
Take test
across multiple days (without resulting in extra time) for a test designed
to be taken in a single day |
|
Have
flexible scheduling |
||
Use extra time for a timed test |
||
Take additional supervised breaks
that result in extra time for any time test |
||