2016 Survey of States: State Activities Amid Evolving Educational PoliciesMartha Thurlow, Christopher Rogers, & Sheryl Lazarus September 2017 All rights reserved. Any or all portions of this document may be reproduced and distributed without prior permission, provided the source is cited as: Thurlow, M. L., Rogers, C., & Lazarus, S. S. (2017). 2016 survey of states: State activities amid evolving educational policies. Minneapolis, MN: University of Minnesota, National Center on Educational Outcomes. Table of Contents
The Mission of the National Center on Educational Outcomes
Top of Page | Table of Contents AcknowledgmentsState Directors of Special Education and State Directors of Assessment and their designees have responded to NCEO surveys over the years to provide a snapshot of their activities, successes, and challenges since the early 1990s. This report, which would not be possible without the support of these individuals, provides a status update on states’ success and challenges, their responses to new educational policies, and their technical assistance needs. We truly appreciate the time taken by respondents to obtain information from other areas or departments, and we hope that this collaborative effort provided an opportunity to increase awareness within and across state programs and departments. For their support, special thanks go to:
Top of Page | Table of Contents State Directors of Special Education
Top of Page | Table of Contents State Directors of Assessment
Top of Page | Table of Contents Executive SummaryThis report summarizes the fifteenth survey of states by the National Center on Educational Outcomes (NCEO) at the University of Minnesota. Results are presented for 40 of the 50 regular states and eight of the 11 unique states. The purpose of this report is to provide a snapshot of the new initiatives, trends, accomplishments, and emerging issues during a period of new education laws and initiatives. Key findings include:
States were continuing to address the need for inclusive assessments while facing new requirements for assessments and accountability systems. States also identified key areas of need for technical assistance to facilitate the successful implementation of inclusive assessments. Top of Page | Table of Contents Overview of 2016 Survey of States
Top of Page | Table of Contents Successful Practices and Recurring ChallengesFor several assessment topics, state respondents were asked to indicate whether states had developed successful practices or faced recurring challenges. Respondents rated each item as very challenging, challenging, successful, or very successful. Most regular states reported that validity of general assessment results and validity of English language proficiency (ELP) assessment results were areas of success, and many regular states reported success with assessment accessibility and accommodations (see Table 1). Assessing English learners (ELs) for accountability purposes was reported to be challenging by more regular states than reported success in this area; some states found this area to be very challenging. Unique states were mixed about the areas they experienced as successful or challenging. Still, nearly all unique states found both instructional accessibility and accommodations, and use of assistive technology for assessment activities, to be challenging. Most unique states, and many regular states, indicated that inclusion of students with disabilities in graduation tests was not applicable to them. Table 1. Successful Practices and Recurring Challenges
Note: Thirty-six regular states and seven unique states responded to this survey question. State respondents were able to select multiple responses. Top of Page | Table of Contents Every Student Succeeds Act (ESSA)The Every Student Succeeds Act (ESSA) was signed into law on December 10, 2015. Two provisions of the law were addressed in the survey: the one percent participation cap for the alternate assessment based on alternate achievement standards (AA-AAS) and state-defined alternate diplomas. We also asked about perspectives on the opportunities and challenges of ESSA for students with disabilities, ELs, and ELs with disabilities. Over sixty percent of respondents in regular and unique states indicated that they were concerned about the possibility that the one percent cap would be exceeded (see Table 2). Table 2: States Concerned about Exceeding the 1% Cap on the Alternate Assessment
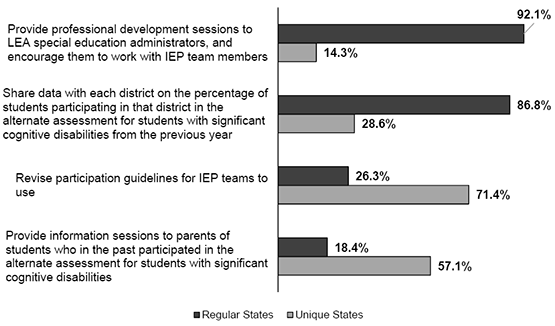
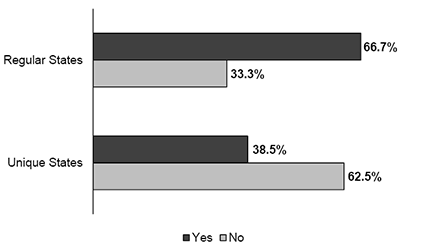
Note: Forty regular states and six unique states answered this question. Forty-six states (regular and unique) reported planning to use one or more strategies to ensure that districts do not exceed the one percent cap. Two strategies were identified by most regular states: providing professional development to district special education administrators for communicating to IEP teams, and sharing data with districts about the participation rates of students with significant cognitive disabilities in alternate assessments. Much less common among regular states were revising participation guidelines and providing information to parents of students who had participated in the alternate assessment. At least half of the unique states indicated the strategies of revising participation guidelines and providing information to parents; professional development and data sharing were much less commonly identified by unique states (see Figure 1). State-defined Alternate DiplomasESSA allows states to develop a state-defined alternate diploma that can be counted in the graduation rate used for school accountability. When asked whether the state had a state-defined alternate diploma, states indicated they were involved in a variety of activities related to the development of alternate diplomas (see Figure 2). About two-thirds of the regular states and nearly all of the unique states indicated that they were not planning to develop a state-defined alternate diploma. The regular states indicating that alternate diplomas were in various stages of development. Six states indicated they had already developed a state-defined alternate diploma, with five of these indicating that their diplomas met the ESSA requirements. One unique state indicated that it had developed an alternate diploma, Figure 1: Strategies States Plan to Use to Ensure that Districts Do Not Exceed the 1% Cap
Note: Thirty-nine regular states and seven unique state answered this question, out of the 40 regular states and eight unique states participating in the survey. Two regular states and one unique state responded “other”; these regular states indicated that they were still determining their strategies, and the unique state indicated that this question was not applicable. State respondents were able to select multiple responses. Figure 2. Status of State-Defined Alternate Diplomas for Students with Significant Cognitive Disabilities 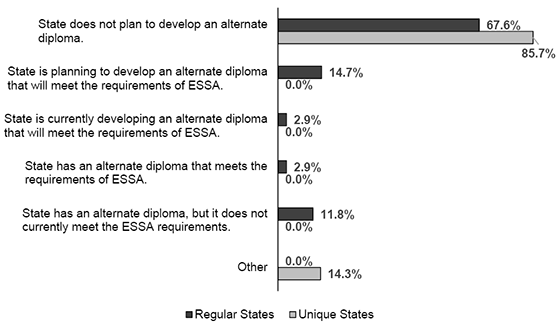
Note: Thirty-four regular states and seven unique states answered this question out of the 40 regular states and eight unique states participating in the survey. Most of the regular states and the one unique state reported that their alternate diplomas met only one ESSA requirement. Only one regular state indicated that its alternate diploma met all three requirements (see Table 3). Table 3: Number of ESSA Requirements Addressed by State-Defined Alternate Diplomas
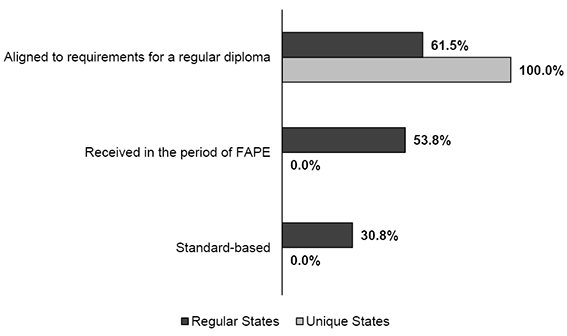
Note: Thirteen regular states answered this question. The response of one unique state that indicated it did not plan to develop an alternate diploma is not included in this table. The ESSA requirement met by the greatest number of states (eight regular states and one unique state) was alignment to requirements for a regular diploma (see Figure 3). Seven regular states had alternate diplomas that met the requirement that they were received in the period of FAPE. Four regular states indicated that their alternate diplomas were standards-based. Figure 3. ESSA Requirements Currently Addressed by State-Defined Alternate Diplomas
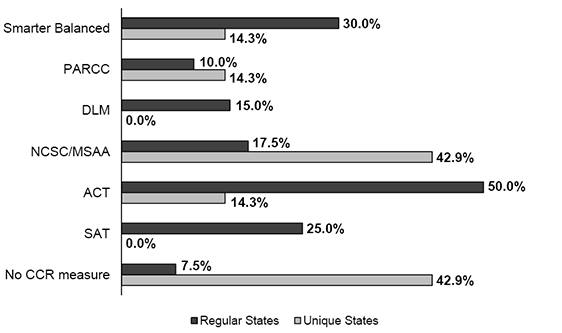
Note: Thirteen regular states and one unique state answered this question. State respondents were able to select multiple Of the states reporting alternate diplomas meeting only one requirement, five had diplomas aligned to requirements for regular diplomas, three were received in the period of FAPE, and one was standards-based. Of the regular states reporting that their alternate diplomas met two requirements, two indicated that they were standards-based and awarded within the period of FAPE; one was aligned to requirements for a regular diploma and received in the period of FAPE. States identified the biggest opportunities and challenges for students with disabilities, ELs, and ELs with disabilities resulting from ESSA. The full list of opportunities and challenges identified by states are included in Appendix A. Opportunities noted for students with disabilities focused on inclusion in general, and maintaining high expectations for learning and positive outcomes. Some states indicated the emphasis in ESSA on measuring growth. Opportunities noted for ELs included increased visibility in the accountability system, attention to EL programs, and emphasis on monitoring and supporting ELs’ progress. One state indicated improvement in exiting criteria. Opportunities for ELs with disabilities echoed those noted for the other groups, with the addition of assessment supports and other improvements in assessment providing more accurate understanding of this group of students and their outcomes. (See Table A-1 in Appendix A.) Challenges associated with ESSA for students with disabilities included the “1% cap rule” and compliance and implementation concerns. For ELs, states identified challenges in improving appropriate supports and assessments; some states also noted the expanding number of native languages for this student population. Challenges for ELs with disabilities included identification of these students, and disaggregating and interpreting their outcomes data. The alternate diploma guidelines were identified as both an opportunity and a challenge, in that they encourage students with significant cognitive disabilities to earn high school credentials, yet also challenge states’ capacity to set equitable exiting criteria. (See Table A-2 in Appendix A.) Top of Page | Table of Contents College and Career ReadinessStates indicated the assessments they used for measuring college- and career-readiness (CCR) (see Figure 4). For their regular assessment, 12 regular states and one unique state used the PARCC assessment, seven regular states and three unique states used the NCSC/MSAA, and six regular states and no unique states used the DLM assessment. Of the 21 regular states and three unique states using at least one consortium assessment, four regular states and one unique state used a combination of Smarter Balanced and NCSC/MSAA, three regular states and one unique state used PARCC and NCSC/MSAA, two regular states used PARCC and DLM, and two regular states used Smarter Balanced and DLM. Figure 4. High School Assessments of College- and Career-Readiness Used by States
Note: Forty regular states and seven unique states answered this question. State respondents were able to select multiple responses. States also reported on their use of ACT and SAT for their high school assessments. Twenty regular states and one unique state reported that they used ACT, and 10 regular states used SAT. Of these 24 regular states and one unique state, seven regular states used both the ACT and SAT. Three regular states and three unique states reported not using any CCR assessments. States providing additional comments about high school level testing of college and career readiness (21 regular states and two unique states) often indicated that their own assessments measured college and career readiness (see Table 4). Several ACT products were used: four regular states used WorkKeys; two regular states used ACT Aspire; and one regular state used the National Career Readiness Certificate (NCRC). Two unique states reported that students took entrance or placement tests used by their institutions of higher education. One regular state indicated that its CCR measurement is “to be determined.” Table 4. Othera High School CCR Assessments Reported
a Twenty-one regular states and two unique states reported “Other” CCR assessments, of the 40 regular state respondents and seven unique state respondents who answered this question. States commented on accessibility and accommodations considerations in designing and implementing their assessments (see Table 5). Of the 12 regular states responding, just over half indicated that the testing company that designed their college- and career-readiness high school assessment also developed the accessibility and accommodations policies. Two other approaches employed some form of partnership between the state and the testing company in this work. Table 5. Statea Approaches to Providing Accessibility and Accommodations on CCR Assessments Not Developed by States or Consortia
a Twelve regular states and no unique states answered this question. States indicated the alignment of their grade 3-8 assessments to college- and career-ready high school assessments. Most regular states indicated that a cross-grades standards setting was conducted or that the assessment was based on a vertical scale (see Figure 5). Unique states most often indicated that they did not know or that they used a suite of assessments available across grades. Figure 5. Alignment of Grade 3-8 Assessments to CCR High School Assessments 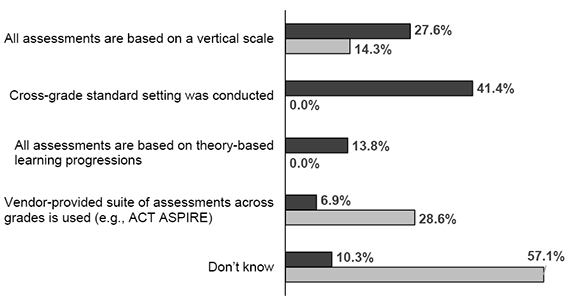 Note. Twenty-nine regular states and seven unique states answered this question. State respondents were able to select multiple responses. Top of Page | Table of Contents Participation and PerformanceIncluding students with disabilities in assessment and accountability processes draws attention to how these students participate and perform on large-scale assessments. Participation Reporting PracticesParticipation reporting practices varied across states in both 2014 and 2016 (see Table 6). More regular and unique states did not count students as participants, and students did not receive a score when they did not participate in the assessment in any way in 2016 than in 2014. More regular states in 2016 than in 2014 indicated that students attended (sat for) the assessment but did not complete enough items to earn a score. Table 6. Reporting Practices for Counting Students as Assessment Participants
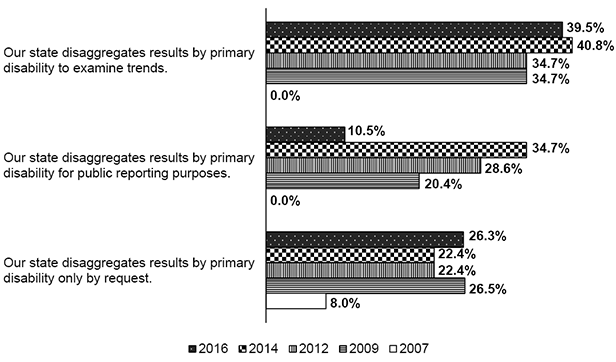
Note. In 2014, 49 regular states and eight unique states answered this question, out of the 50 regular states and eight unique states participating in the survey. In 2016, 39 regular states and eight unique states answered this question, out of the 40 regular states and eight unique states participating in the survey. Reporting Practices for Students by Disability CategoryTwenty-two of 38 responding regular states (58%) reported disaggregating assessment results by primary disability category in 2016—a decrease from the 31 of 49 states (63%) in 2014 and 28 of 49 states (57%) in 2012, but still an increase from the 10 of 49 states (20%) in 2009, and 17 of 50 (34%) states in 2007. The most frequently listed reasons states gave for disaggregating results by disability category in 2016 (see Figure 6) were to examine trends; in contrast to previous year, few states indicated that results were disaggregated for reporting purposes. More often, states indicated that they did so to respond to requests. Figure 6. Reasons for Reporting General Assessment Results by Disability Category for Regular Statesa,b,c
a Eighteen regular states reported not disaggregating results by primary disability in both 2016 and 2014. Note. Eighteen regular states reported not disaggregating results by primary disability in both 2016 and 2014. In 2016, 4 of 8 responding unique states (50%) reported disaggregating results by primary disability. This is a small increase from previous years. The most frequently listed reason for disaggregating results by disability category in 2016 (see Figure 7) was for reporting purposes. Figure 7. Reasons for Reporting General Assessment Results by Disability Category for Unique Statesa,b,c 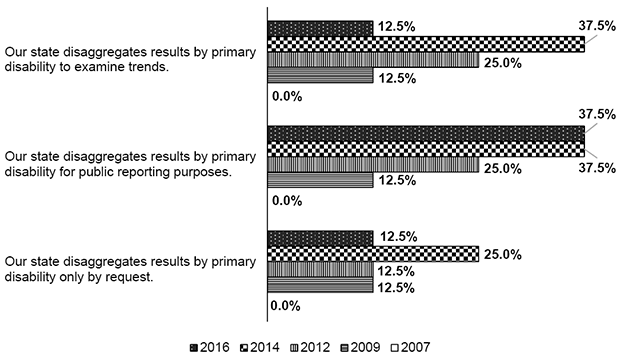 a Four unique states reported not disaggregating results by primary disability in 2016 and three unique states reported not disaggregating results by primary disability in 2014. States also reported on their practices for disaggregating results by primary disability for students participating in the state’s alternate assessment. The primary reason for doing so for regular states was to examine trends, which the primary reason for doing so for unique states was for public reporting purposes (see Figure 8). Figure 8. Reasons for Reporting Alternate Assessment Results by Disability Category for Regular and Unique States 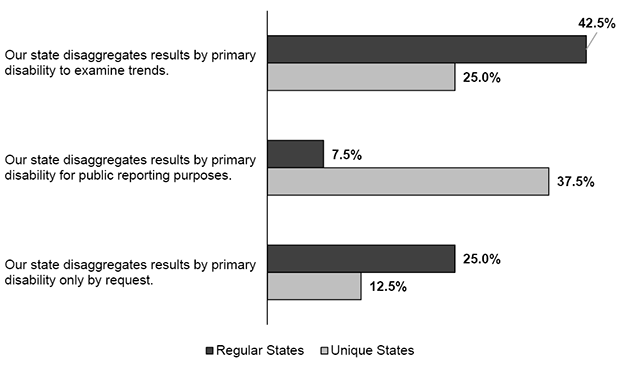 Note: Forty regular states and eight unique states answered this question. State respondents were able to select multiple responses. Top of Page | Table of Contents Accessibility and AccommodationsStates indicated the ways in which they monitored the provision and use of accessibility features and accommodations in 2016 (see Table 7). For regular states and unique states, the most frequent approach was to directly observe test administrations, including the provision of accessibility features and accommodations on test day. In regular states, the next most frequent approaches were conducting desk audits, completing online record reviews, and interviewing students, teachers, and administrators about accessibility features and accommodations. In unique states, the other approaches used were completing online record reviews, interviewing students, teachers, and administrators, and randomly sending teams into districts/schools to compare IEPs and 504 plans to what teachers say happens in class and during assessments. Table 7. Ways of Monitoring Accessibility Features and Accommodations
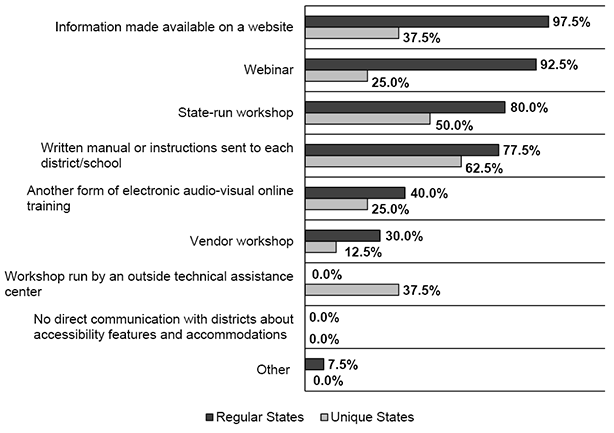
Note: Thirty-three regular states and eight unique states answered this question. State respondents were able to select multiple responses. States communicated information about accessibility features and accommodations to districts, schools, and teachers in a several ways (see Figure 9). The most frequent approaches used by regular states included making information available on the website, providing webinars, conducting workshops, and providing written manuals or instructions to each district or school. For unique states, the most frequent approaches were providing written manuals or instructions to each district or school and conducting workshops. Figure 9. Modes of Communicating Accessibility Features and Accommodations Information to Districts, Schools, and Teachers
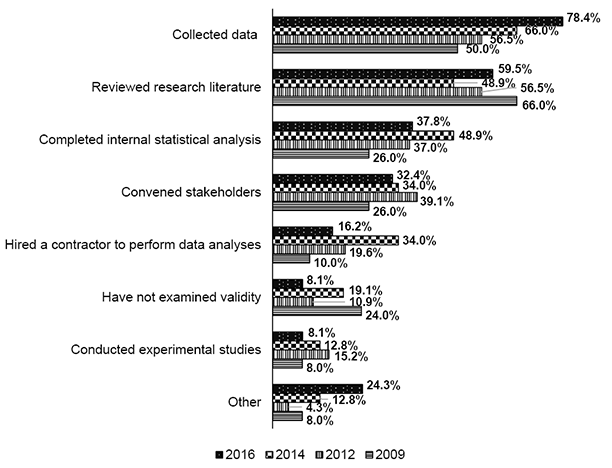
Note. Forty regular states and eight unique states answered this question. State respondents were able to select multiple responses. Regular states continued to examine the validity of the interpretation of results when accessibility features and accommodations were used during the general assessment (see Figure 10). In 2016, 29 of 37 responding states (78%) indicated that they collected data; this was an increase from the 31 of 47 responding states (66%) in 2014. Dependence on reviewing research literature in 2016 (60%) reflected a slight increase from 2012 (57%) and 2014 (49%), but a decrease from 2009 (66%). Figure 10. Ways That Regular States Examined Validity of Accessibility Features and Accommodations on General Assessmentsa,b
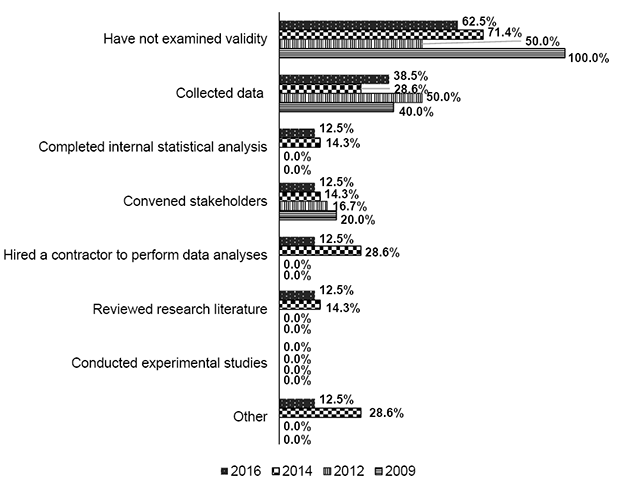
a In 2016, 37 regular states answered this question; in 2014, 47 regular states answered this question; in 2012, 46 regular states answered this question; and in 2009, 50 regular states answered this question. Unique states more often than regular states indicated that they had not examined the validity of the interpretation of results from the general assessment when accessibility features and accommodations were used (see Figure 11). In 2016, five of eight responding states (63%) indicated that they had not examined validity. Figure 11. Ways That Unique States Examined Validity of Accessibility Features and Accommodations on General Assessmentsa,b
a In 2016, eight unique states answered this question; in 2014, seven unique states answered this question; in 2012, six unique states answered this question; and in 2009, five unique states answered this question. States also provided information on the ways they examined the validity of the interpretation of results from the alternate assessment (see Figure 12). Regular states more often reviewed research literature and collected data, while unique states more often either did not examine validity or collected data. Figure 12. Ways That Regular and Unique States Examined Validity of Accessibility Features and Accommodations on the Alternate Assessment 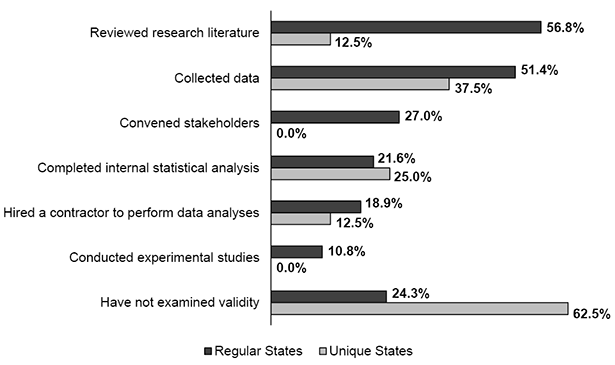 Note. Thirty-seven regular states and eight unique states answered this question. State respondents were able to select multiple responses. A majority of responding regular states (67%) indicated that they provide different accessibility features and accommodations for their general and alternate assessments. In contrast, a majority of unique states indicate that they are the same. The following are some of the ways in which states indicated that the accessibility features and accommodations were different for the two assessments:
Figure 13. Different Accessibility Features and Accommodations Provided on General and Alternate Assessments
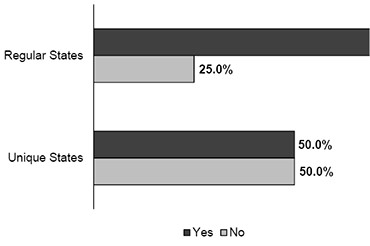
Note. Thirty-six regular states and eight unique states answered this question. States indicated whether they had a process in place for assigning accessibility features and accommodations prior to the administration of the assessment (see Figure 14). The majority of regular states (69%) indicated they had a process, while about half of the unique states did. Figure 14. Process in Place for Assigning Accessibility Features and Accommodations Prior to the Assessment
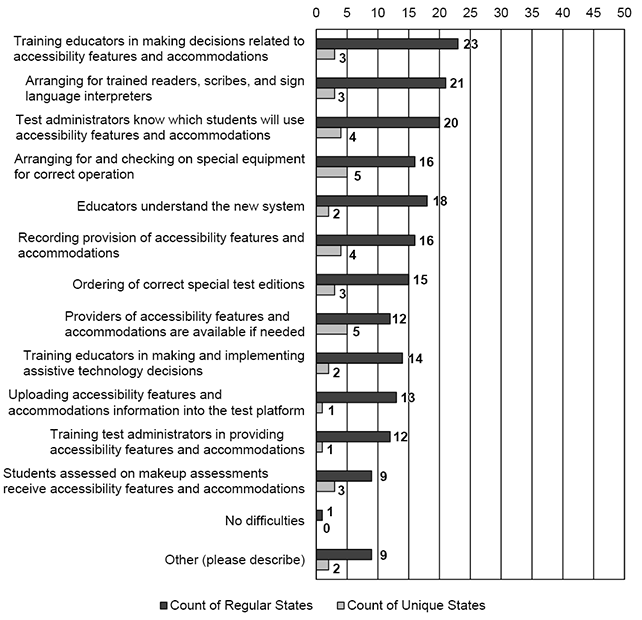
Note. Forty regular states and eight unique states answered this question. Just over half of the regular states indicated that they were transitioning to Unified English Braille (UEB) by using a braille assessments with both UEB and English Braille American Edition (EBAE) (see Figure 15). Half of the unique states indicated that they had not yet begun to plan for the transition. Figure 15. Transitioning Assessments to Unified English Braille (UEB) 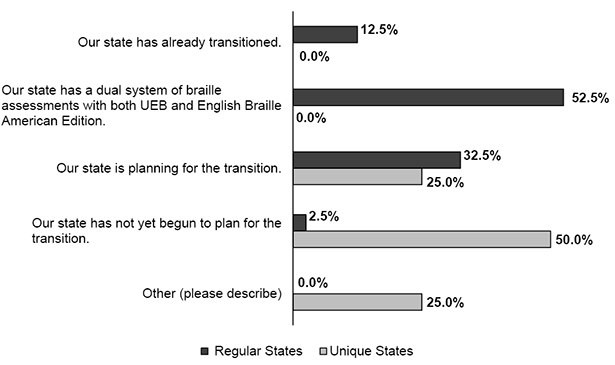 Note. Forty regular states and eight unique states answered this question. Accessibility Features and Accommodations ChallengesStates noted the challenges associated with providing accessibility features and accommodations (see Figure 16). The most frequently noted challenges by regular states were training educators in making decisions about accessibility features and accommodations; arranging for trained readers, scribes, and sign language interpreters; and having test administrators know which students are to use accessibility features and accommodations. For unique states, the most frequently noted challenges were arranging for and checking on special equipment and having providers of accessibility features and accommodations available. Challenges other than those indicated in Figure 16 included:
Figure 16. Challenges in Provision of Accessibility Features and Accommodations
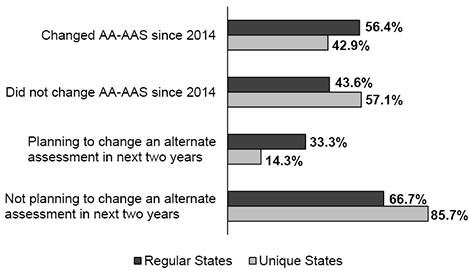
Note. Thirty-eight regular states and eight unique states answered this question. State respondents were able to select multiple responses. Top of Page | Table of Contents Alternate Assessments based on Alternate Achievement Standards (AA-AAS)Most regular and unique states do not have end-of-course alternate assessments for students with the most significant cognitive disabilities (see Figure 17). Less than 18% of regular states and less than 15% of unique states had end-of-course alternate assessments, either for some or all courses. Figure 17. End-of-Course AA-AAS for Students with the Most Significant Cognitive Disabilities 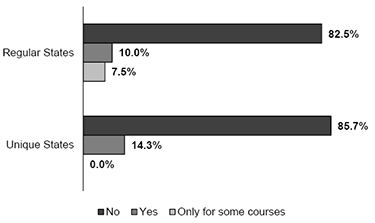 Note. Forty regular states and eight unique states answered this question. More than half of regular states and about just over 40% of unique states have made major revisions to their AA-AAS since 2014. Considerably fewer regular and unique states (33% and 14%, respectively) are planning to develop a new or revised AA-AAS in the next two years (see Figure 18). Figure 18. AA-AAS Changes
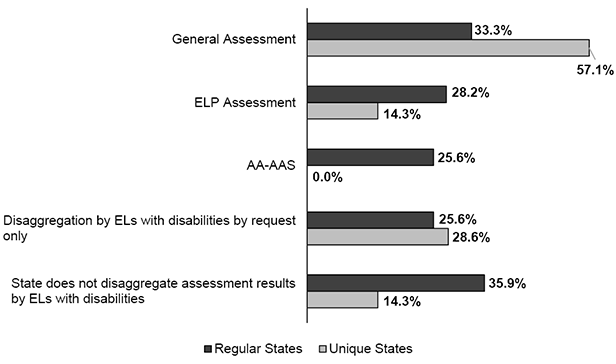
Note. Thirty-nine regular states and seven unique states answered these questions. Top of Page | Table of Contents English Learners with DisabilitiesEnglish learners (ELs) with disabilities are increasing in numbers across regular and unique states, and increased attention is being given to policies and practices for their participation in assessments. Reporting Practices for English Learners with DisabilitiesFourteen of 39 (36%) responding regular states and one of the seven (14%) responding unique states indicated that they did not disaggregate assessment results for ELs with disabilities (see Figure 19). For those regular and unique states that did, they most often indicated that they did so for the general assessment, followed by the English language proficiency (ELP) assessment and the alternate assessment (AA-AAS). Figure 19. Reporting Practices for ELs with Disabilities
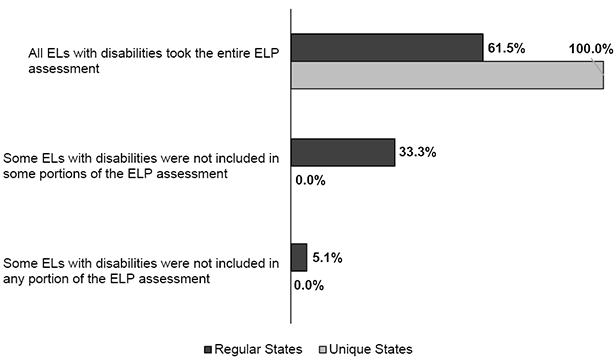
Note. Thirty-nine regular states and seven unique states answered this question. State respondents were able to select multiple responses. Just over 60% of regular states and all unique states indicated that the ELs with disabilities in their states participated in all four domains (reading, writing, speaking, listening) of the state ELP assessment. One-third of regular states reported that some ELs with disabilities were not included in some portions of the ELP assessment, and 5% indicated that some ELs with disabilities were not included in any portion of the ELP assessment (see Figure 20). Figure 20. How States Included ELs with Disabilities in ELP Assessment Results
Note. Thirty-nine regular states and five unique states answered this question; two unique states indicated that they do not administer ELP assessments, and one unique state skipped this question for the same reason. State respondents were able to select multiple responses. Accessibility and Accommodations for English Learners with DisabilitiesAccessibility features and accommodations were offered to ELs with disabilities by the majority of regular states, and under half of unique states (see Figure 21). Just over one-fourth of the regular and unique states indicated that accessibility features and accommodations were offered on some section of the ELP assessment. Some comments about accessibility features and accommodations on the ELP assessment were made by regular states; most pointed out that they used the accessibility features and accommodations provided by their test vendor. One regular state pointed out that it provides accessibility features and accommodations. Some of the unique states indicated that they did not have an ELP assessment. Figure 21. Accessibility Features and Accommodations Use on ELP Assessments 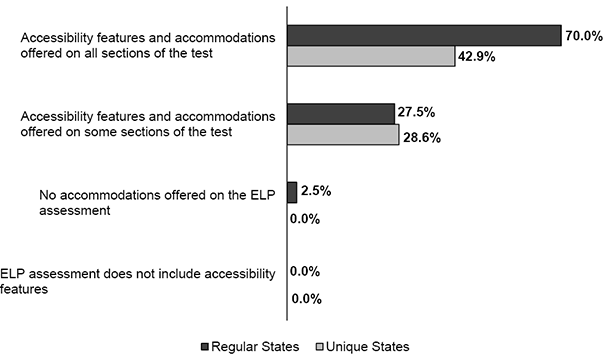
Note. Forty regular states and seven unique states answered this question. Two unique states used the comment field to report that they do not administer ELP assessments, and one unique state skipped this question for the same reason. English Learners with the Most Significant Cognitive DisabilitiesMost regular and unique states reported that ELs with the most significant cognitive disabilities participated in an alternate ELP assessment (see Figure 22). Eighteen percent of regular states and no unique states indicated that their ELs with significant cognitive disabilities participated in the same ELP assessment as all other ELs. Figure 22. ELs with the Most Significant Cognitive Disabilities Participation in ELP Assessments 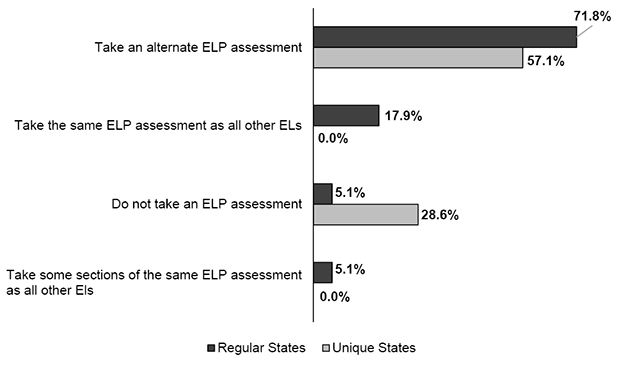 Note. Thirty-nine regular states and seven unique states answered this question. Most regular and unique states indicated that they had no plans in the next two years to develop a new or revised alternate ELP assessment (see Figure 23). Figure 23. Planning to Develop a New or Revised Alternate ELP Assessment for Students with Significant Cognitive Disabilities (in the next two years)
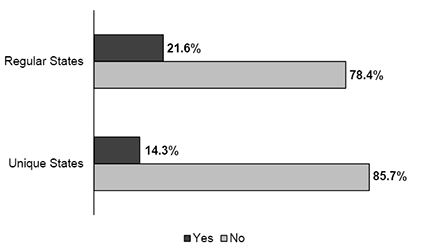
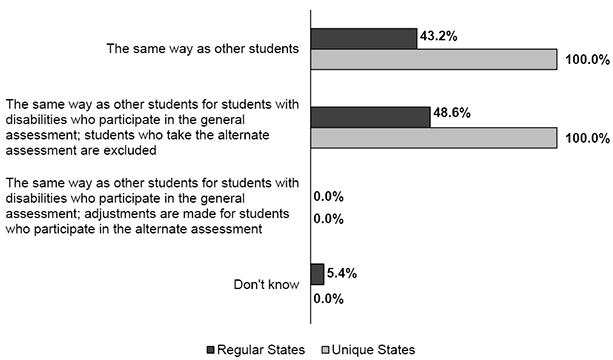
Note. Thirty-seven regular states and seven unique states answered this question. Relatively few states indicated that the exit of a student with a disability was addressed during the IEP process (see Figure 24). Over 50% percent of regular states and 80% of unique states indicated that exiting from ELs services was not addressed in the IEP process. Figure 24. Exiting from EL Services Addressed in the IEP Process 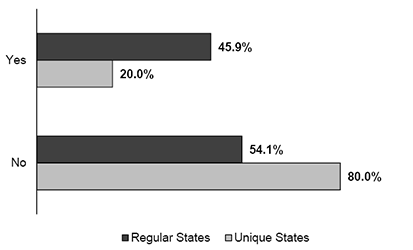 Note. Thirty-seven regular states and five unique states answered this question. Top of Page | Table of Contents Continuing Assessment IssuesSeveral assessment issues continue to face states. Among those on which states commented in 2016 were assessment audits, student performance growth, improvement plans, graduation requirements, technology, and assessment principles. Assessment AuditsNearly half of all responding regular and unique states reported that they had provided leadership to local education agencies to conduct assessment audits that inventory how many assessments are administered throughout the school year (see Figure 25). Still several respondents (in 13% of regular states and 29% of unique states) did not know whether this had occurred. Figure 25. State Provided Leadership for Local Education Agencies on Conducting Assessment Audits 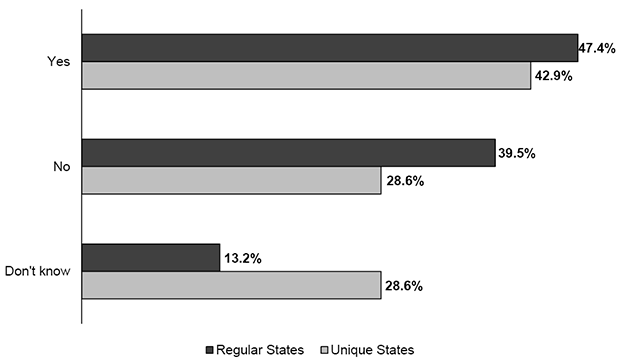 Note. Thirty-eight regular states and seven unique states answered this question. Assessment audits included consideration of students with disabilities in several ways (see Figure 26). Most often, the audits included special education assessments. Less often, the audits identified special education assessments that were duplicative or similar to assessments used for other purposes. Least often for regular states, but not unique states, the auditing team included an educator with expertise in special education. Figure 26. Assessment Audit Approaches 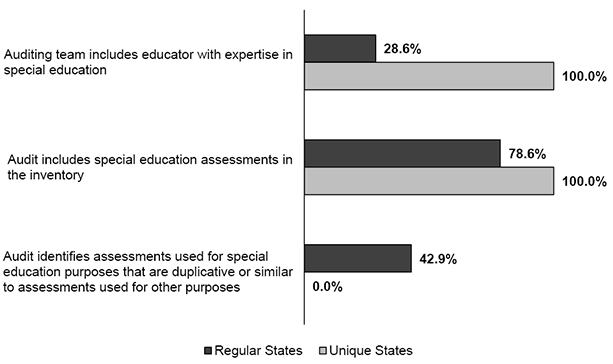 Note. Fourteen regular states and one unique state answered this question. State respondents were able to select multiple responses. Student Performance GrowthMost regular states indicated that they were using student performance growth as a measure of student achievement in 2016 (see Figure 27). In contrast, most unique states indicated that they were not using student growth. About equal percentages of regular and unique states indicated that they were developing an achievement measure that will include a growth measure. Figure 27. Use of Student Growth in Achievement Measure 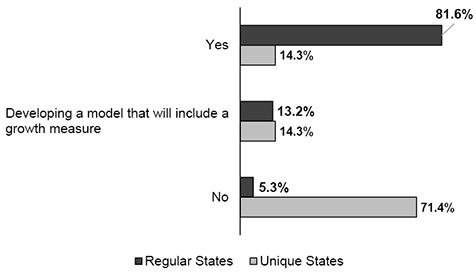 Note. Thirty-eight regular states and seven unique states answered this question. States included students with disabilities in their growth measures either in the same way as other students are included or only those in the general assessment were included and students in the alternate assessment were excluded (see Figure 28). No states (regular or unique) indicated that students in the general assessment were included in the same way as other students, but that adjustments were made for students in the alternate assessment. Figure 28. Inclusion of Students with Disabilities in State’s Growth Measure
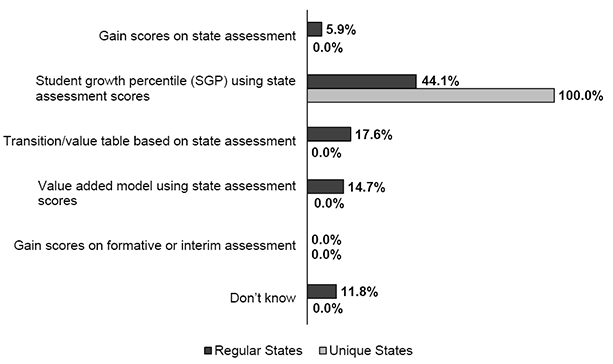
Note. Thirty-seven regular states and one unique state answered this question. Many regular states (44%) and all unique assessments indicated that they were using Student Growth Percentiles (SGP) for their assessment scores to judge improvement in student academic performance (see Figure 29). A small number of regular states were using transition or value tables, a value-added model, or gain scores to judge improvement. Figure 29. Growth Model Used to Judge Improvement in Student Academic Performance
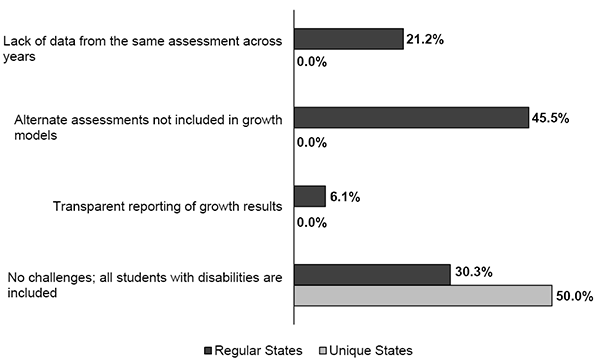
Note. Thirty-four regular states and two unique states answered this question. Among the biggest challenges to including students with disabilities in growth models for regular states were that alternate assessments were not included in growth models, followed by the lack of data from the same assessment across years (see Figure 30). For unique states, most indicated that they had no challenges with their growth models; all students with disabilities were included. Challenges other than those indicated in Figure 30 included:
Figure 30. Challenges in Including Students with Disabilities in Growth Measures
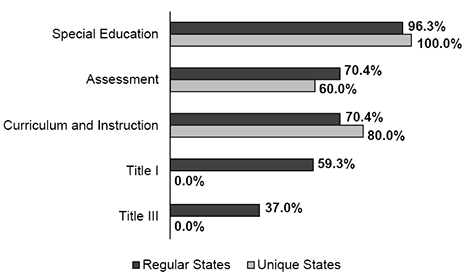
Note. Thirty-three regular states and two unique states answered this question. State respondents were able to select multiple responses. State Improvement PlansStates provided information on the measurable results for students with disabilities (the State-Identified Measurable Result–SIMR) that they were using in the improvement plans required by the Office of Special Education Programs, the State Systemic Improvement Plan (SSIP). Nearly three-quarters of responding states, both regular and unique, indicated that they were using measures of achievement (see Figure 31). Figure 31. State-Identified Measurable Result is Achievement 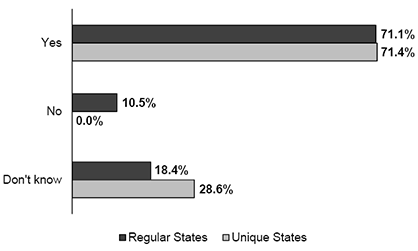 Note. Thirty-eight regular states and seven unique states answered this question. Most states indicated that in addition to special education, the offices of assessment and curriculum and instruction were included in the development, implementation, or analysis of SIMR data (see Figure 32). Just over one-third of regular states and no unique states included the Title III office. Other offices that were mentioned by states included:
Figure 32. Offices Involved in Developing, Implementing, or Analyzing SIMR Data
Note. Twenty-seven regular states and five unique states answered this question. State respondents were able to select multiple responses. Graduation RequirementsStates reported on changes that had occurred in their graduation requirements (see Figure 33). Twenty-five percent of regular states and no unique states indicated that between 2014 and 2016, their graduation requirements had changed. Among the 2016-17 changes reported by states were:
Thirty percent of regular states and no unique states indicated that they expected graduation requirements to change between 2017 and 2018. Among the expected 2017-18 changes reported by states were:
Figure 33. Changes in Graduation Requirements for Students with Disabilities 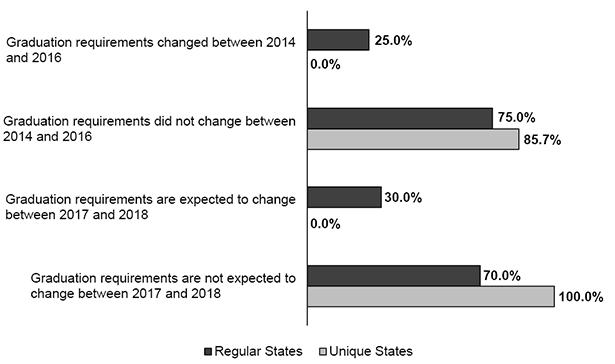 Note. Forty regular states addressed changes in graduation requirements in 2014-2016 and in 2017-2018; seven unique states addressed changes in graduation requirements for both periods of years. TechnologyStates reported on the technology-related investments they perceived to be needed to better enable students with disabilities to participate in instruction and assessments (see Figure 34). The needs identified by the most regular states were additional devices, improved bandwidth or capacity for Internet connectivity, and additional adaptive technology. The largest number of unique states identified specialized software that enables the provision of accessibility and accommodations, additional devices, improved bandwidth or capacity for Internet connectivity, and test security provisions. The other needs that were identified included:
Figure 34. Needed Technology-related Investments for Better Participation of Students with Disabilities in Instruction and Assessment 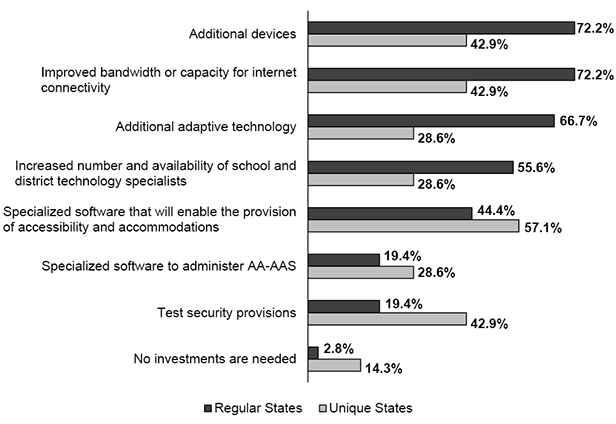 Note. Thirty-eight regular states and seven unique states answered this question. State respondents were able to select multiple responses. Assessment Guidelines, Standards, and PrinciplesStates indicated the guidelines, standards, or principles that they asked their test vendors to comply with (see Figure 35). Most states reported that they required compliance with the APA, AERA, NCME Standards for Educational and Psychological Testing, and the ATP/CCSSO Operational Best Practices for Statewide Large-scale Assessment Programs. One-third of regular states and 50% of unique states required compliance with NCEO’s Principles and Characteristics of Inclusive Assessment Systems in a Changing Assessment Landscape. Other requirements that the states noted included:
Figure 35. Collaboration with Test Vendors on Developing Assessments Compliant with Guidelines, Standards, or Principles 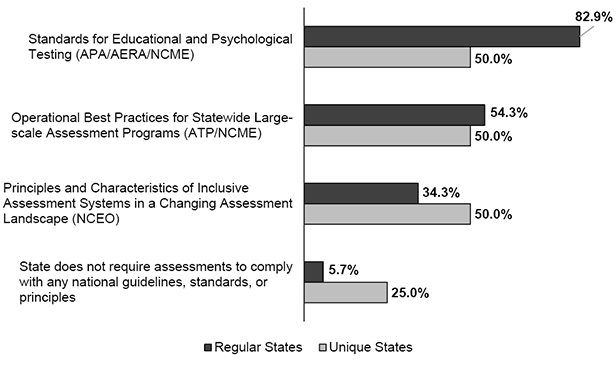 Note. Thirty-five regular states and four unique states answered this question. State respondents were able to select multiple responses. Top of Page | Table of Contents Technical Assistance NeedsSurvey respondents ranked the helpfulness of 16 types of technical assistance. The needs are listed in order of rank (from most helpful to least helpful) for regular and unique states in Table 8. The top three types of technical assistance selected by regular states were: (1) “how to” documents on accessibility and accommodations, alternate assessments, etc. available on Internet for self review; (2) conference calls on hot topics; and (3) webinars on assessment related topics. The top three types of technical assistance identified by unique states were: (1) individual consultation in the state, (2) individual consultation at meetings, and (3) assistance with data analysis. Table 8. Technical Assistance Ranked by Order of Preference
Note. Thirty-four regular states and seven unique states answered this question. Lowest rank indicated most preferred. When asked whether their rankings of technical assistance materials and strategies would be different if these materials and strategies focused on ELs and ELs with disabilities, the majority of regular states and unique states responded “No.” Those regular states that responded “Yes” provided the following reasons:
Top of Page | Table of Contents Appendix ATable A-1. Opportunities Associated with Provisions in ESSA
Table A-2. Challenges Associated with Provisions in ESSA
|
|||||||||||||||||||||||||||||||||||||||||||||||||||||||||||||||||||||||||||||||||||||||||||||||||||||||||||||||||||||||||||||||||||||||||||||||||||||||||||||||||||||||||||||||||||||||||||||||||||||||||||||||||||||||||||||||||||||||||||||||||||||||||||||||||||||||||||||||||||||||||||||||||||||||||||||||||||||||||||||||||||||||||||||||||||||||||||||||||||||||||||||||||||||||||||||||||||||||||||||||||||||||||||||||||||||||||||||||||||||||||||||||||||||||||||||||||||||||||||||||||||||||||||||||||||||||||||||||||||||||||||||||||||||||||||||||||||||||||||||||||||||||||||||||||||||||||||||||||||||||||||||||||||||||||||||