2014 Survey of States: Initiatives, Trends, and AccomplishmentsVitaliy Shyyan, Sheryl Lazarus, & Martha Thurlow September 2015 All rights reserved. Any or all portions of this document may be reproduced and distributed without prior permission, provided the source is cited as: Shyyan, V., Lazarus, S. S., & Thurlow, M. L. (2015). 2014 survey of states: Initiatives, trends, and accomplishments. Minneapolis, MN: University of Minnesota, National Center on Educational Outcomes. Table of Contents
The Mission of the National Center on Educational Outcomes
Top of Page | Table of Contents AcknowledgmentsWith the support of State Directors of Special Education and State Directors of Assessment, we are able to report on the activities of all 50 regular states and eight of 11 unique states. Because of the thoughtful and knowledgeable responses of the Directors of Special Education, Directors of Assessment, and their designees who completed the 2014 survey, we are able to highlight new initiatives, trends, accomplishments, and current and emerging issues during this important period of education reform. This report is intended to make public the trends and issues occurring in states, as well as the innovations and approaches states are employing. We are appreciative of the time taken by respondents to obtain information from other areas or departments, and we hope that this collaborative effort provided an opportunity to increase awareness within and across state programs and departments. For their support, special thanks go to:
Top of Page | Table of Contents State Directors of Special Education
Top of Page | Table of Contents State Directors of Assessment
Top of Page | Table of Contents Executive SummaryThis report summarizes the fourteenth survey of states by the National Center on Educational Outcomes (NCEO) at the University of Minnesota. Results are presented for the 50 regular states and eight of the 11 unique states. The purpose of this report is to provide a snapshot of the new initiatives, trends, accomplishments, and emerging issues during this important period of education reform as states documented the academic achievement of students with disabilities. Key findings include:
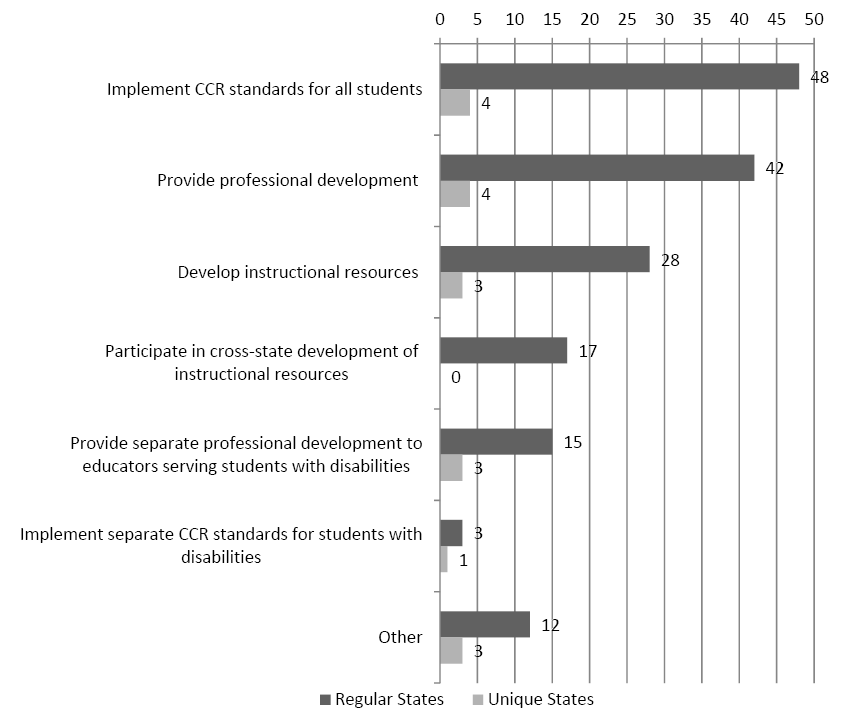
States were cognizant of the benefits of inclusive assessment and accountability systems, and continued to improve assessment design, participation, accessibility and accommodations policies, monitoring practices, and data reporting. States also identified key areas of need for technical assistance to facilitate the implementation of next generation assessments. Top of Page | Table of Contents Overview of 2014 Survey of StatesThis report highlights the fourteenth survey of states by the National Center on Educational Outcomes (NCEO). It has been conducted for more than two decades to collect information from states about the participation and performance of students with disabilities in assessments during standards-based reform. Eleven Unique States American Samoa States are transitioning to college- and career-ready (CCR) standards-driven assessments to prepare all students, including students with disabilities, English language learners (ELLs) with disabilities, and ELLs, for post-school success. Many states are collaborating through consortia of states to develop general assessments, alternate assessments based on alternate achievement standards (AA-AAS), or assessments of English language proficiency (ELP). Some states belong to more than one consortium, some to one, and some to none. As in the past, NCEO asked state directors of special education and state directors of assessment to agree on their responses to the 2014 survey. In compiling their responses, the directors sometimes elicited assistance of other individuals in the department who had the best current knowledge of the state's thinking, policies, and practices for including students with disabilities, and other students, in assessment systems and other aspects of educational reform. In many states, several people collaborated on completing NCEO's 2014 Survey of States. All fifty regular states responded to the survey. In addition, eight of 11 unique states completed the survey in 2014. Most survey responses were submitted using an online survey tool. In a few instances, Word or PDF files were provided to respondents who wished to complete the survey that way. Survey respondents reported on trends in the large-scale assessment of students with disabilities and other groups of students. Topics addressed assessment participation, assessment performance, use of accessibility tools and accommodations, alternate assessments, and other related topics. Top of Page | Table of Contents College and Career ReadinessAs states continue their transition from previous state standards to College- and Career-Ready (CCR) Standards, states sought to address the needs of students with disabilities. States were asked how they support content teachers as they help students with disabilities achieve CCR standards (see Figure 1). Most regular states reported that they supported teachers by implementing CCR standards for all students, including all students with disabilities, and many also provided professional development on CCR standards to all educators, including educators working with students with disabilities. Many unique states also reported that they implemented CCR standards for all students, and provided professional development on CCR standards to all educators. Other responses of several regular and unique states mentioned working on supports for students with the most significant cognitive disabilities. Figure 1. Ways States Support Content Teachers to Help Students With Disabilities Achieve CCR Standards
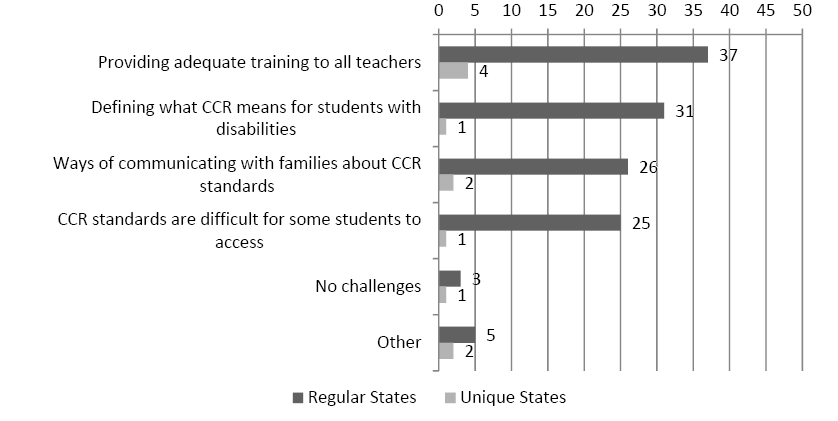
Note: Forty-eight regular and seven unique states responded to this question. State respondents were able to select multiple responses. When addressing challenges associated with implementing CCR standards for students with disabilities, many regular states (N=37) and half of the responding unique states identified challenges with providing adequate training (see Figure 2). Another challenge identified by many states was defining what CCR means for students with disabilities. About half of the regular states and two unique states also experienced challenges with communicating with families about CCR standards, and a similar number of regular states and one unique state reported that CCR standards are difficult for some students to access. Only three regular states and one unique state reported that they encountered no challenges in implementing CCR standards for students with disabilities. Figure 2. Challenges in Implementing CCR Standards for Students With Disabilities
Note: Forty-eight regular and six unique states responded to this question. State respondents were able to select multiple responses. Top of Page | Table of Contents Participation in Assessment ConsortiaIn 2014, many states were members of general, alternate, or English language proficiency (ELP) assessment consortia. States participated in a variety of consortium-led activities, including pilot tests, field tests, and special accessibility studies. This information is summarized in Table 1. Almost two-thirds of regular states reported being members of one of the two general assessment consortia. Fewer states were members of general assessment consortia in 2014 than in 2012 when most states belonged to one of the consortia. Nearly three-quarters of regular states reported membership in one of the two alternate assessment consortia. The two ELP consortia were identified by about two-thirds of regular states. For each consortium, some member states participated in pilot tests, field tests, or special accessibility studies. Several unique states reported membership in general assessment, alternate assessment, and ELP consortia. Table 1. Participation of Regular and Unique States in Assessment Consortia
1Partnership for Assessment of Readiness for College and Careers Top of Page | Table of Contents Participation and PerformanceIncluding students with disabilities in assessment and accountability processes draws greater attention to how these students participate and perform on large-scale assessments. Reporting practices for students with disabilities are of interest because they reflect how states may look at their data. Participation Reporting PracticesParticipation reporting practices varied across states in both 2012 and 2014 (see Table 2). More regular and unique states in 2014 than in 2012 did not count students as participants, and students did not receive a score, when they did not participate in the assessment in any way. Fewer regular states in 2014 than in 2012 indicated that students attended (sat for) the assessment but did not complete enough items to earn a score. Table 2. Reporting Practices for Counting Students as Assessment Participants
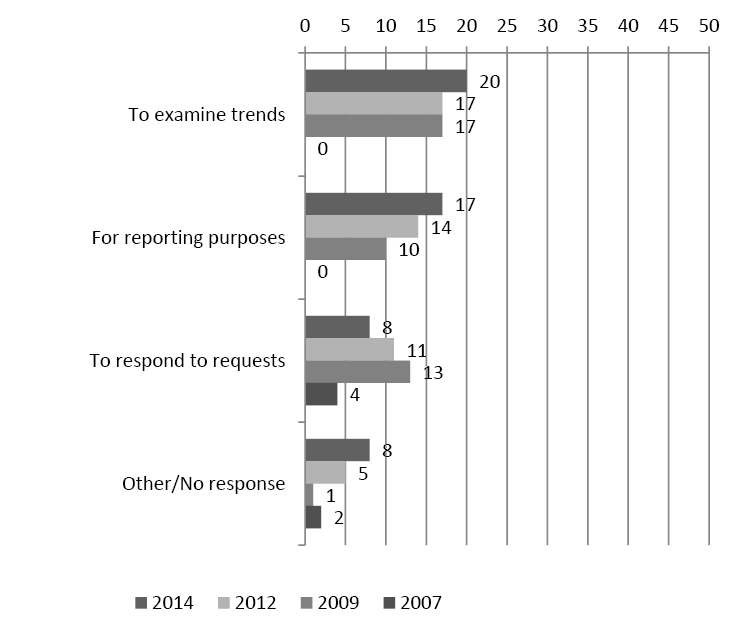
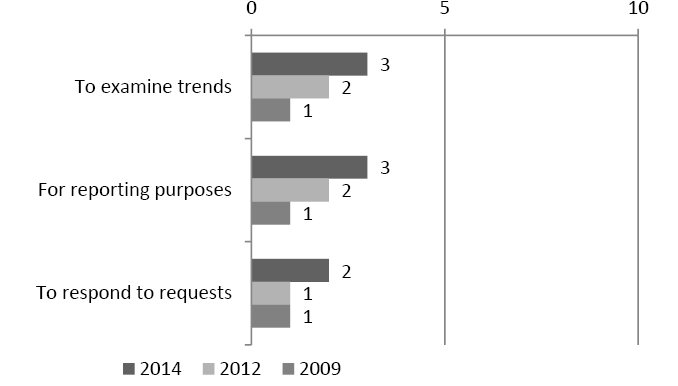
*In the 2012 survey, the "Counted as participants, and earned score counted as valid" answer choice was phrased as "Earned score is counted as valid." Nineteen regular states provided additional comments on how students with disabilities were included in assessment and accountability processes. Many comments focused on flexibility waivers and policies around reporting and calculating scores. Reporting Practices for Students by Disability CategoryThirty-one regular states reported disaggregating assessment results by primary disability category in 2014—an increase from 28 states in 2012, 10 states in 2009, and 17 states in 2007. The most frequently listed reasons states gave for disaggregating results by disability category (see Figure 3) were to examine trends and for reporting purposes. Less often, states indicated that they did so to respond to requests. Figure 3. Reasons for Reporting Assessment Results by Disability Category for Regular States*
*In 2014, 18 states reported not disaggregating results by primary disability. Several regular states provided additional comments about reasons for disaggregating by primary disability. For example:
Figure 4 summarizes the reasons given by unique states for reporting assessment results by disability category. Five unique states reported disaggregating assessment data by disability category in 2014. Similar to regular states, assessment results were reported by disability category in unique states to examine trends, for reporting purposes, and to respond to requests. Figure 4. Reasons for Reporting Assessment Results by Disability Category for Unique States*
*Three unique states reported not disaggregating results by primary disability in 2014. Top of Page | Table of Contents Accessibility and AccommodationsReforms in educational testing, and the shift to more technology-based assessment, have brought many changes in approaches to accessibility and accommodations since 2012. Greater numbers of students now have access to needed accessibility features that are built into the testing platform. For the first time, this year's Survey of States focused on both accessibility and accommodations for states' assessments. Many states and assessment consortia have adopted approaches to accessibility that included several levels. In this report, accessibility features refer to all approaches other than accommodations that used to ensure access for students with disabilities (and possibly other students). Practices Related to Accessibility and AccommodationsStates used a variety of approaches to monitor the provision of accessibility features and accommodations (see Table 3). Twenty-four regular states and seven unique states reported that they directly observed test administrations on test day, including a focus on the provision of accessibility features and accommodations. Nineteen regular states reported conducting desk audits. Thirteen regular and three unique states reported that they sent teams on a random, scheduled, or targeted basis into districts/schools to compare Individualized Education Programs (IEPs) with what teachers said happened in class and during assessment. Table 3. Ways of Monitoring Accessibility Features and Accommodations
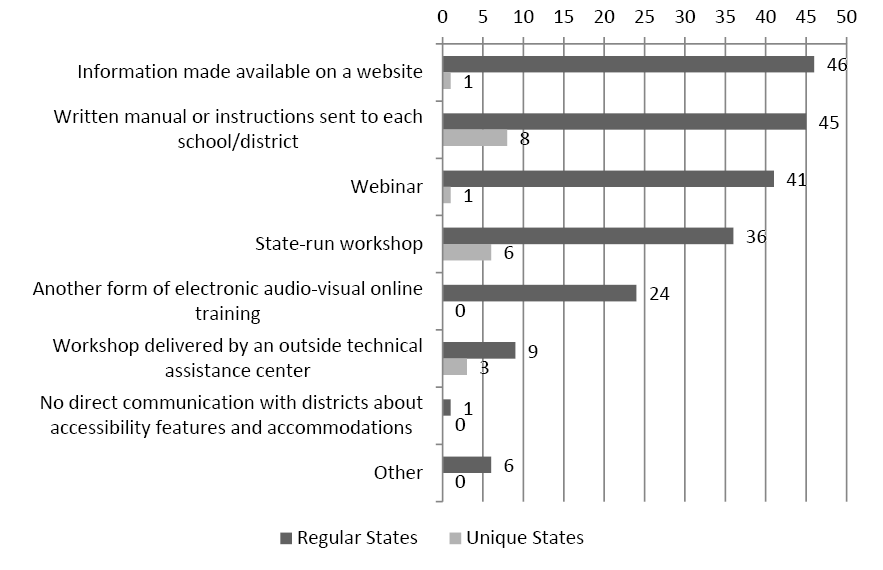
Note: Forty-five regular and eight unique states responded to this question. State respondents were able to select multiple responses. States used a variety of modes to communicate about accessibility features and accommodations to districts, schools, and teachers (see Figure 5). Most often, regular and unique states made information available on a website, by sending out information in written manuals or instructions, or by distributing information via webinars or state-run workshops. Three unique states also reported hosting a workshop delivered by an outside technical assistance center. Figure 5. Modes of Communicating Accessibility Features and Accommodations Information to Districts, Schools, and Teachers
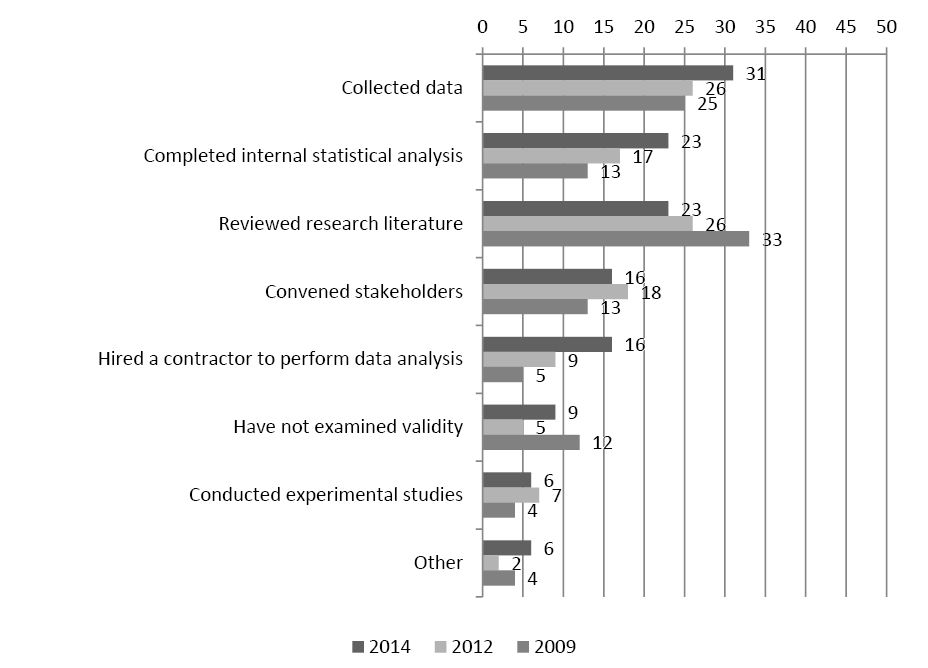
Note: Forty-nine regular and eight unique states responded to this question. State respondents were able to select multiple responses. Other modes mentioned included preliminary presentations, non-state educational agency sponsored workshops, a speaker from another state, a regional state support team network of trainers, and biweekly assessment updates e-mailed to principals and central offices. Regular states employed a variety of approaches to examine the validity of assessment results when accessibility features and accommodations were used. Figure 6 shows this information as reported in 2009, 2012, and 2014. More states in 2014 than previously studied validity using data collected during assessments and by completing internal statistical analyses. The number of states examining validity of accessibility features and accommodations by reviewing research literature decreased over the same time period. Figure 6. Ways That Regular States Examined Validity of Accessibility Features* and Accommodations
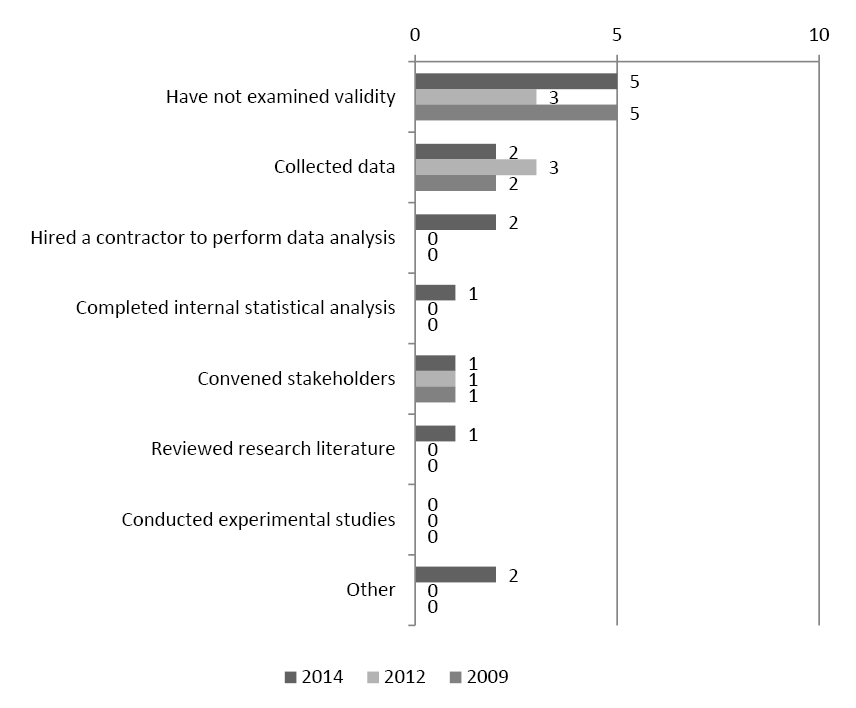
*Accessibility features, in addition to accommodations, were addressed only in the 2014 survey. In 2014 most of the unique states did not examine the validity of assessment results when accessibility features and accommodations were used (see Figure 7). Two unique states reported that they collected data and hired a contractor to analyze their validity results. Figure 7. Ways That Unique States Examined Validity of Accessibility Features* and Accommodations
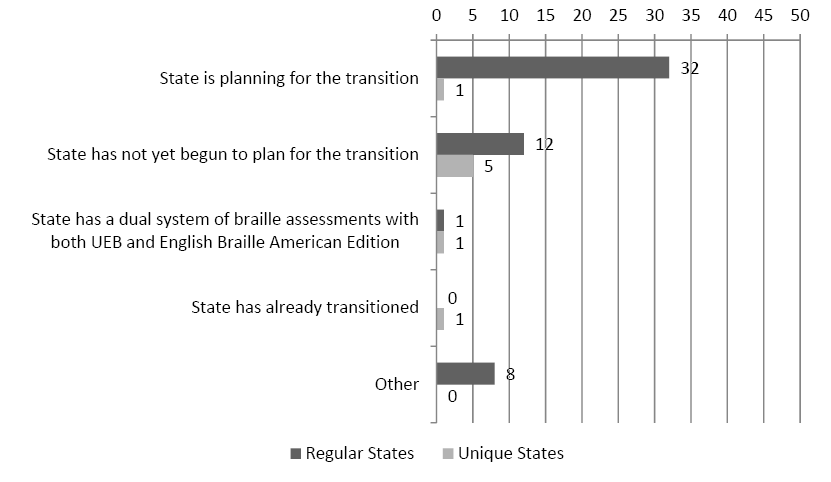
*Accessibility features, in addition to accommodations, were addressed only in the 2014 survey. Unified English Braille (UEB) was adopted by the United States for implementation in January, 2016. Thirty-two regular states and one unique state reported that they were planning the process for transitioning their assessments to UEB (see Figure 8). Twelve regular and eight unique states indicated that this transition had not yet begun. One unique state reported it had already transitioned to UEB. Figure 8. Transitioning Assessments to Unified English Braille (UEB)
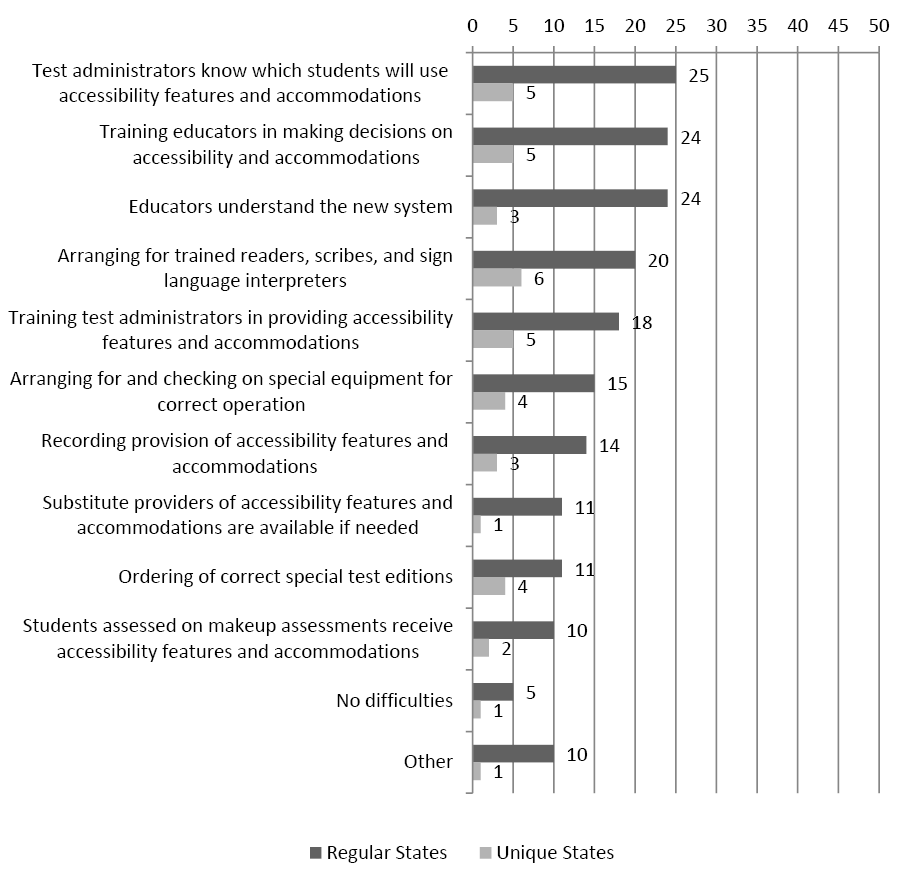
Note: Forty-five regular and eight unique states responded to this question. State respondents were limited to selecting one response option with the exception that Other could be selected to insert a comment. Difficulties Related to Accessibility Features and AccommodationsMany states commented on difficulties encountered in districts in ensuring that accessibility features and accommodations were provided on test day (Figure 9). The primary challenges reported by regular states were:
Unique states reported the following primary challenges:
Five regular states and one unique state reported that they experienced no difficulties in this area. Figure 9. Challenges in Provision of Accessibility Features and Accommodations
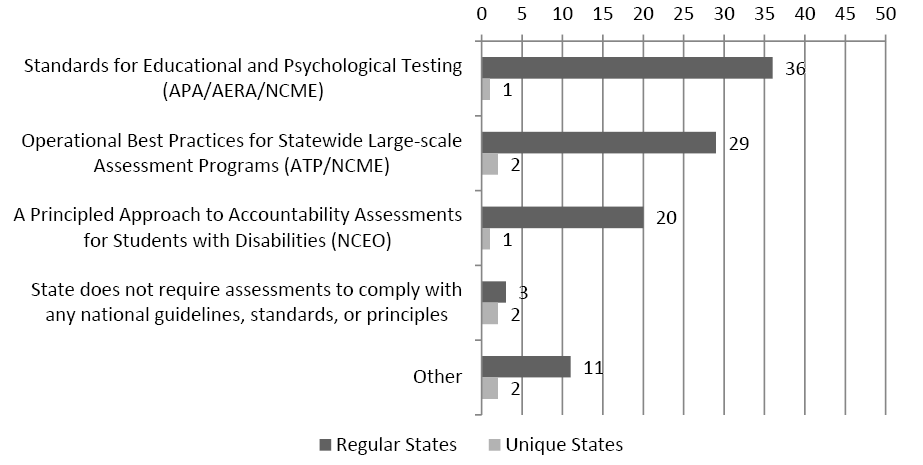
Note: Forty-one regular and seven unique states responded to this question. State respondents were able to select multiple responses. Additional challenges reported in the Other category included, for example, difficulty with braille on test day and challenges with supporting the assessment of general education students. Several states indicated that some difficulties had been resolved by extensive training or by providing guidance on resolution of potential issues. Top of Page | Table of Contents Current and Emerging IssuesStates face many current and emerging issues as they develop and implement next-generation assessments. Issues include assessment guidelines, standards, and principles that inform assessment development processes; technology and universal design components of assessments; teacher evaluation priorities; and graduation requirements. Assessment Guidelines, Standards, and PrinciplesMany states asked test vendors to develop assessments that are compliant with one or more sets of guidelines, standards, and principles (see Figure 10). Thirty-six regular states and one unique state reported asking vendors to use the Standards for Educational and Psychological Testing developed by the American Educational Research Association (AERA), the American Psychological Association (APA), and the National Council for Measurement in Education (NCME). Other commonly used guidelines, standards, and principles included the Operational Best Practices for Statewide Large-scale Assessment Programs developed by the Association of Test Publishers (ATP) and the Council of Chief State School Officers (CCSSO) and A Principled Approach to Accountability Assessments for Students with Disabilities developed by the National Center on Educational Outcomes (NCEO). Three regular and two unique states reported that their states did not require assessments to comply with any national guidelines, standards, or principles. Figure 10. Collaboration With Test Vendors on Developing Assessments Compliant With Guidelines, Standards, or Principles
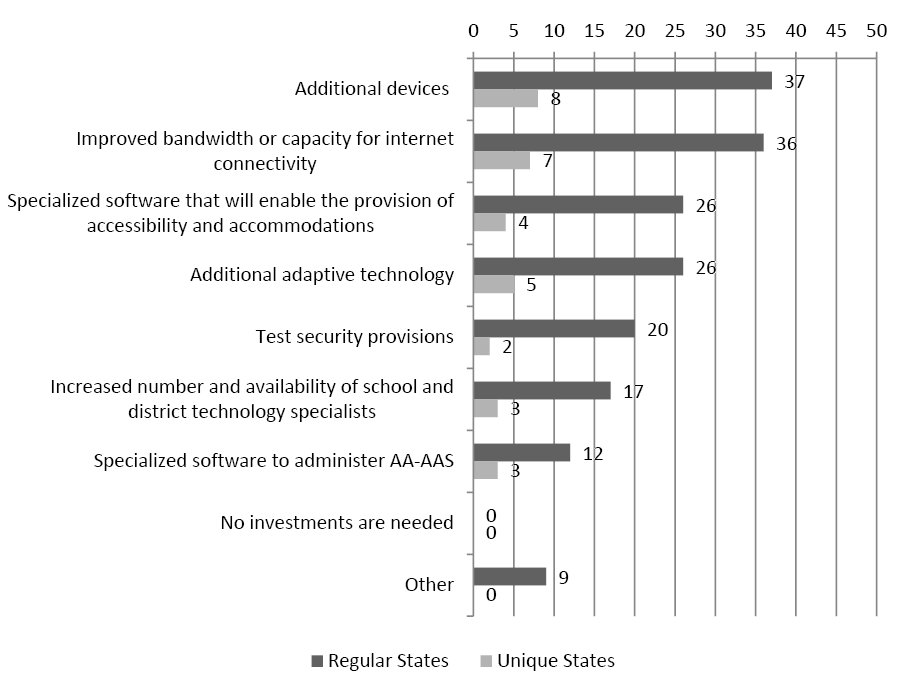
Note: Forty-three regular and four unique states responded to this question. State respondents were able to select multiple responses. Other comments included a variety of other types of guidance, such as the Americans with Disabilities Act, Web Content Accessibility Guidelines, Accessible Portable Item Protocol, and Guidelines from CCSSO's TILSA (Technical Issues in Large Scale Assessment) work. TechnologyStates indicated that there was a need for districts to make additional technology-related investments to better enable students with disabilities to participate in instruction and assessments (see Figure 11). Additional devices, such as computers and tablets, were identified as a need by the largest number of regular and unique states, followed closely by a need for improved bandwidth or capacity for Internet connectivity. About half of both regular and unique states indicated needs for specialized software for accessibility and accommodations, and additional adaptive technology. Other identified needs included, for example, computers with refreshable braille and security provisions. No regular or unique state indicated that no investments were needed for technology-related needs. Figure 11. Needed Technology-Related Investments for Better Participation of Students With Disabilities
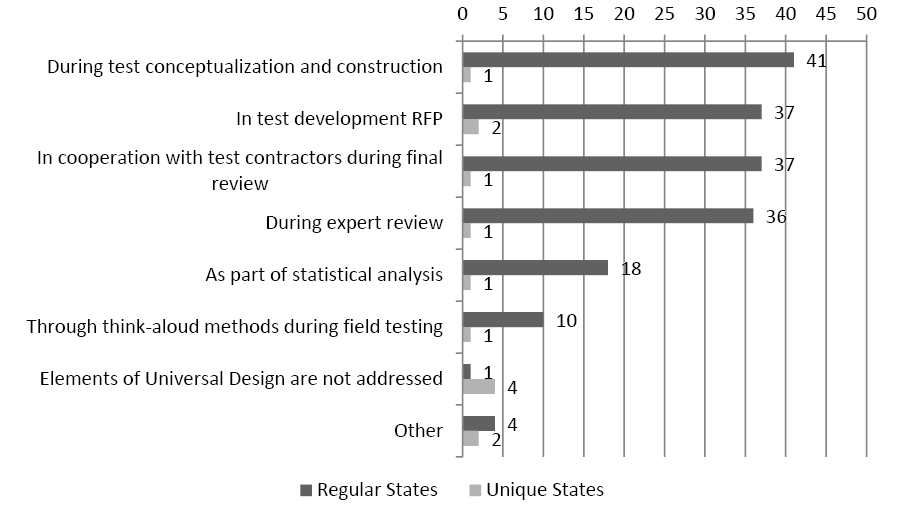
Note: Forty-five regular and eight unique states responded to this question. State respondents were able to select multiple responses. Universal DesignMore than three-quarters of the states reported that elements of Universal Design were considered during test conceptualization and construction (see Figure 12). Universal Design also was addressed in requests for proposals for test development, final reviews conducted with test contractors, and expert reviews. Several states indicated that Universal Design was addressed in Other ways including the development of custom items and via test specifications. Fifty percent of responding unique states did not address elements of Universal Design, although some unique states addressed Universal Design in some areas. Figure 12. Areas in Which Universal Design Is Addressed in the General Assessment Development Process
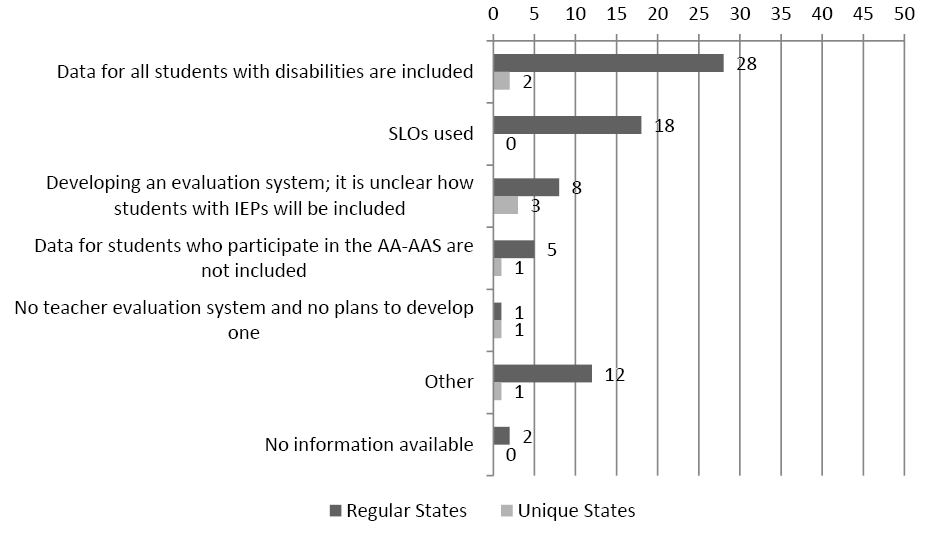
Note: Forty-six regular and six unique states responded to this question. State respondents were able to select multiple responses. Teacher EvaluationData from students with Individualized Education Programs (IEPs) were included in the teacher evaluation system for general education teachers who teach core subjects (reading, English language arts, math) in tested grades in a variety of ways (see Figure 13). More than half of the regular states and two unique states reported that data for all students with disabilities (students with IEPs and 504 plans) are included in the general education teacher evaluation system. About one-third of states used Student Learning Objectives (SLOs) to measure the performance of students with IEPs for teacher evaluation purposes. A few states indicated that they were still developing their teacher evaluation systems or did not have one. Figure 13. Inclusion of Data From Students With IEPs in the State's Evaluation System for General Education Teachers
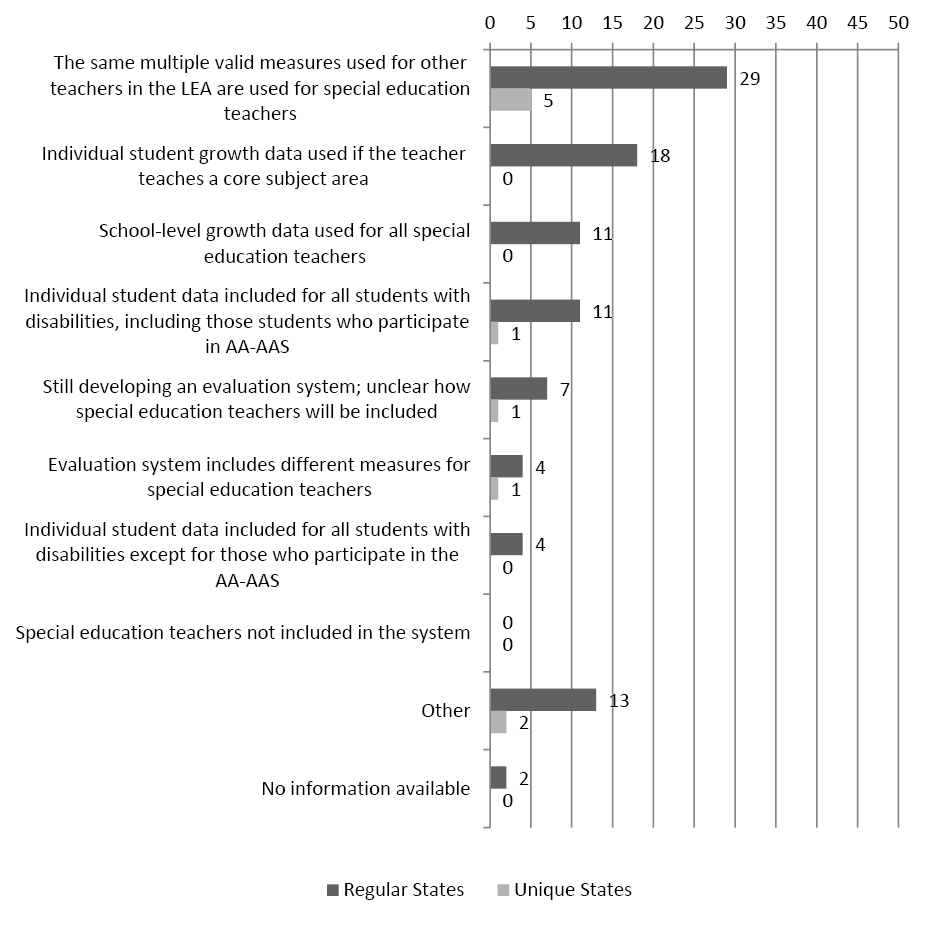
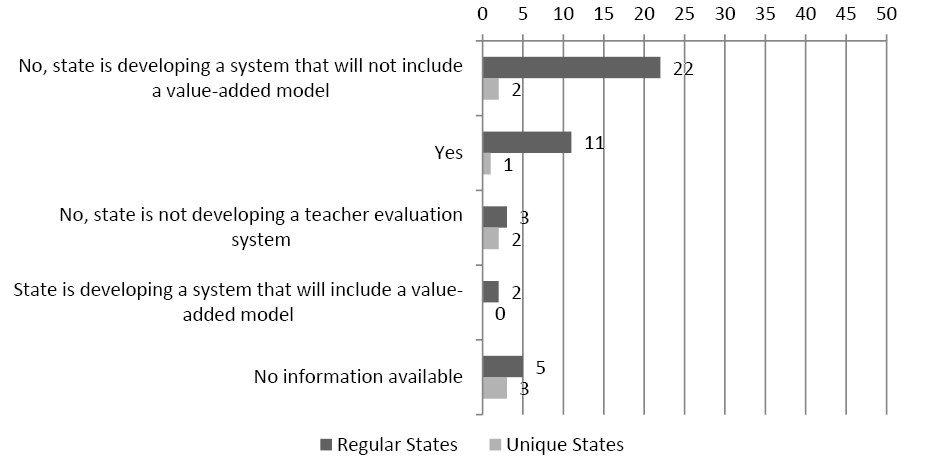
Note: Forty regular and seven unique states responded to this question. State respondents were able to select multiple responses. Most states indicated that the same multiple valid measures used for non-core subject teachers were used for special education teachers (see Figure 14). Eighteen states indicated that individual student growth data were used if the teacher taught or co-taught a core subject area in a tested grade. The use or development of a value-added model for teacher evaluation purposes was reported by 11 regular states and one unique state (see Figure 15). Twenty-two regular states and two unique states indicated that their state teacher evaluation system would not include a value-added model. Four regular states further indicated that their value-added teacher evaluation model adjusted and provided differentiated accountability for students with disabilities. Six reported that this was not the case, and one commented that the student growth component of teacher evaluation was a local joint committee decision. Figure 14. Inclusion of Special Education Teachers in the Teacher Evaluation System
Note: Forty-two regular and seven unique states responded to this question. State respondents were able to select multiple responses. Figure 15. Value-Added Model Use for Teacher Evaluation
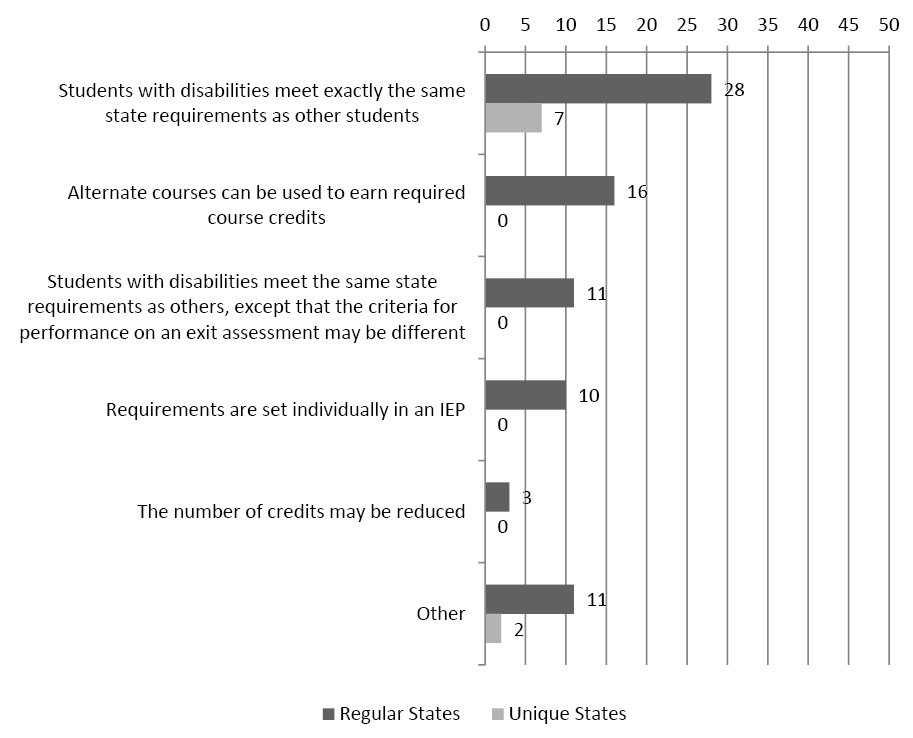
Note: Forty-three regular and eight unique states responded to this question. Graduation RequirementsMore than half of the regular states and most of the unique states indicated that the graduation requirements for earning a standard diploma were the same for students with disabilities and students without disabilities (see Figure 16). Sixteen regular states reported that students with disabilities could take alternate courses to earn required course credits, while 11 regular states reported that students with disabilities met exactly the same course requirements as other students, but that the criteria for performance on an exit assessment might be different. Ten regular states indicated that the requirements for students with disabilities were set individually in an IEP. For students with disabilities who participated in the regular assessment, but did not meet the requirements for a regular diploma, 17 regular states and three unique states reported that they issued no other end-of-school documents. Other end-of-school documents issued by states included certificates of attendance, completion, achievement, or attainment. Several regular states indicated that decisions about which graduation document a student received involved local-level decisions. Figure 16. Allowances Made for Students With Disabilities Who Participate in the Regular Assessment to Receive a Standard Diploma
Note: Forty-five regular and seven unique states responded to this question. State respondents were able to select multiple responses. States addressed the implications for Elementary and Secondary Education Act (ESEA) graduation rate accountability of students with disabilities who participated in the regular assessment and did not meet the requirements for a standard diploma. See individual state responses in the Appendix. The most frequent comments were:
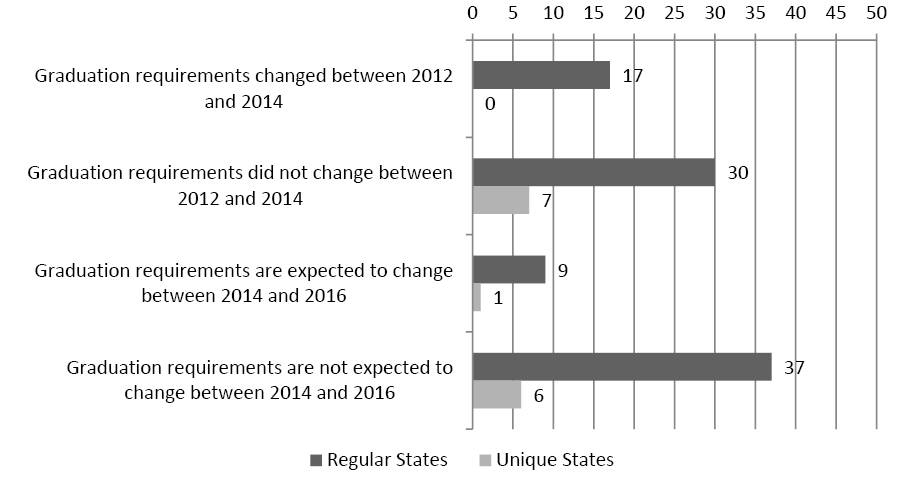
Seventeen regular states reported that graduation requirements for students with disabilities changed between 2012 and 2014, while 30 regular and seven unique states reported no such changes for the same period (see Figure 17). Nine regular states and one unique state expected changes in graduation requirements between 2014 and 2016, while 37 regular states and six unique states did not anticipate any changes. Figure 17. Changes in Graduation Requirements for Students With Disabilities
Note: Forty-seven regular states addressed changes in graduation requirements in 2012-2014, and 46 regular states addressed these changes in 2014-2016. Seven unique states addressed changes in graduation requirements for both periods of years. Top of Page | Table of Contents Successful Practices and Recurring ChallengesFor several assessment topics, state respondents were asked to indicate whether the state had developed successful practices or faced recurring challenges. Respondents rated each item as very challenging, challenging, successful, or very successful. Most states reported that validity of assessment results of students with disabilities, instructional accessibility and accommodations, and assessment accessibility and accommodations were areas of success (see Table 4). The unique states also reported that both instructional and assessment accessibility and accommodations were areas of success. The use of assistive technology for assessment activities was reported by regular states to be the most challenging area. Unique states found validity of assessment results of students with disabilities and assessment of ELLs with disabilities for accountability purposes to be challenging areas. Table 4. Successful Practices and Recurring Challenges
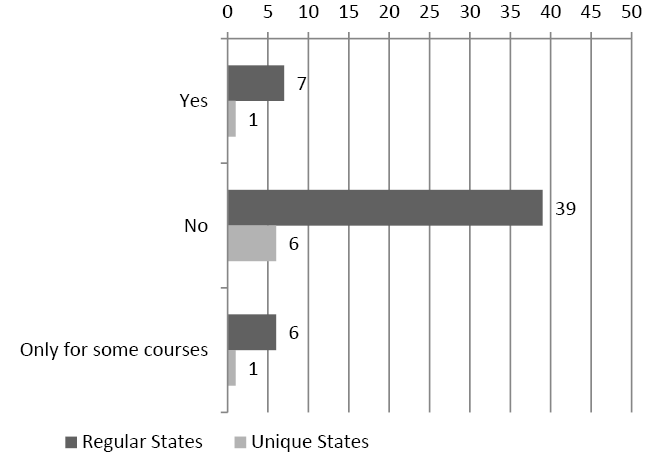
Note: Fifty regular states and eight unique states responded to this survey question. Top of Page | Table of Contents Alternate AssessmentsAlternate assessments are available for some students with disabilities. Students with the most significant cognitive disabilities participate in alternate assessments based on alternate achievement standards (AA-AAS). In the recent past, some states also offered an optional alternate assessment based on modified achievement standards (AA-MAS) for some low-performing students with disabilities, although this assessment was being phased out in 2014-2015 as students transitioned to general assessments. This section of the report highlights the information generated by survey items on the two types of alternate assessments for students with disabilities. Alternate Assessment Based on Alternate Achievement StandardsMost regular and unique states revised their alternate assessment based on alternate achievement standards (AA-AAS) between 2012 and 2014. Forty-three regular states made changes to their AA-AAS. Of these, 28 states reported making major revisions. Six responding unique states reported making major revisions to their AA-AAS. Only seven regular states and one unique state had end-of-course AA-AAS fully incorporated into their assessment system (see Figure 18). Six additional regular states and one unique state had end-of-course AA-AAS only for some courses. Figure 18. End-of-Course AA-AAS for Students With the Most Significant Cognitive Disabilities
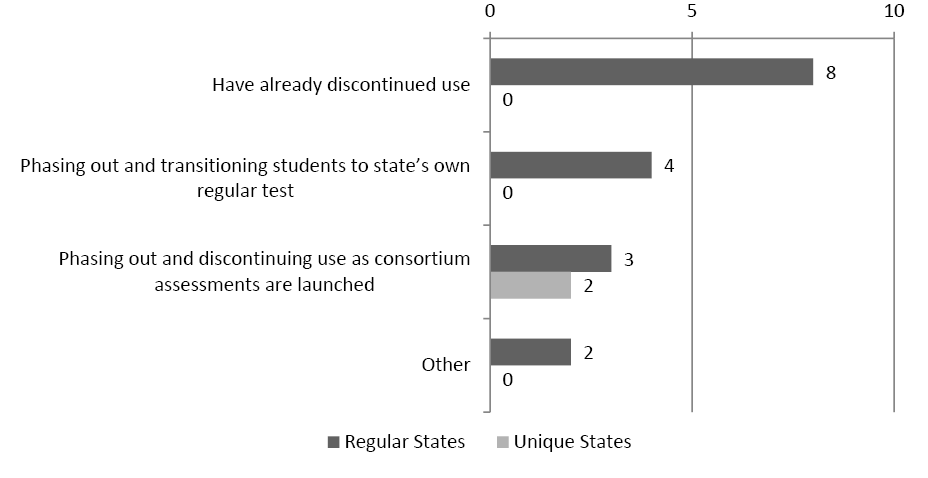
Note: Forty-six regular and seven unique states responded to this question. If AA-AAS was used only for some courses, participants were asked to list the courses. The reported courses for regular states included English language arts, mathematics, science, social studies, and biology. One unique state reported English language arts, mathematics, and science as the AA-AAS-related courses. Alternate Assessment Based on Modified Achievement StandardsFifteen regular and two unique states reported having the alternate assessment based on modified achievement standards (AA-MAS) at one time. About half of the regular states had discontinued using this assessment prior to the 2014-2015 school year (see Figure 19). Most of the remaining states were in the process of phasing it out. Figure 19. Phasing out of the AA-MAS
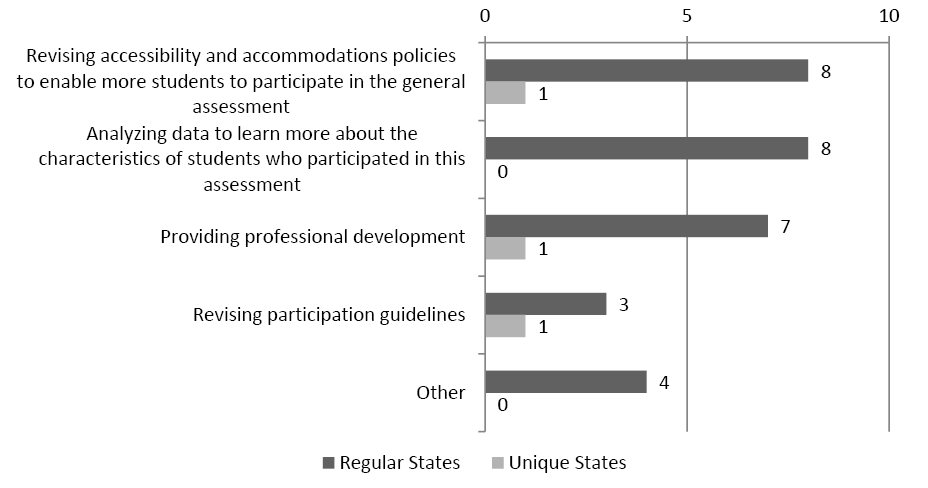
Note: Fifteen regular and two unique states responded to this question. State respondents were limited to selecting one response option, with the exception that Other could be selected to insert a comment. States' transition processes from AA-MAS to general assessments are summarized in Figure 20. Many regular states reported revising accessibility and accommodations policies to enable more students to participate in the general assessment, analyzing data to learn more about the characteristics of students who participated in AA-MAS, and providing professional development opportunities on this topic. Figure 20. Ways of Transitioning From the AA-MAS to the General Assessment
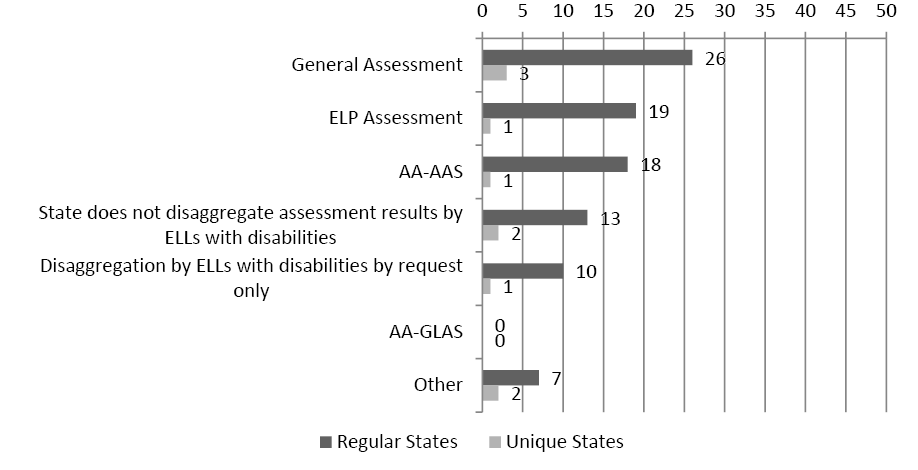
Note: Thirteen regular and two unique states responded to this question. State respondents were able to select multiple responses. Top of Page | Table of Contents English Language Learners With DisabilitiesThis section presents the information shared by states regarding their reporting practices for ELLs with disabilities, accessibility and accommodations, and participation of ELLs with the most significant cognitive disabilities in ELP assessments. Reporting Practices for English Language Learners With DisabilitiesMore than half of the regular states and several unique states reported disaggregating assessment results for ELLs with disabilities for the general assessment (see Figure 21). About one-third of the regular states disaggregated results for ELLs with disabilities for the ELP and AA-AAS. Some states disaggregated results for ELLs only upon request. Other states did not disaggregate data for this group. Some respondents addressed the regulations on including ELLs with disabilities in assessment reports. For example, several indicated that results for these students are included as long as the group size meets the state's minimum group size for reporting. Figure 21. Reporting Practices for ELLs With Disabilities
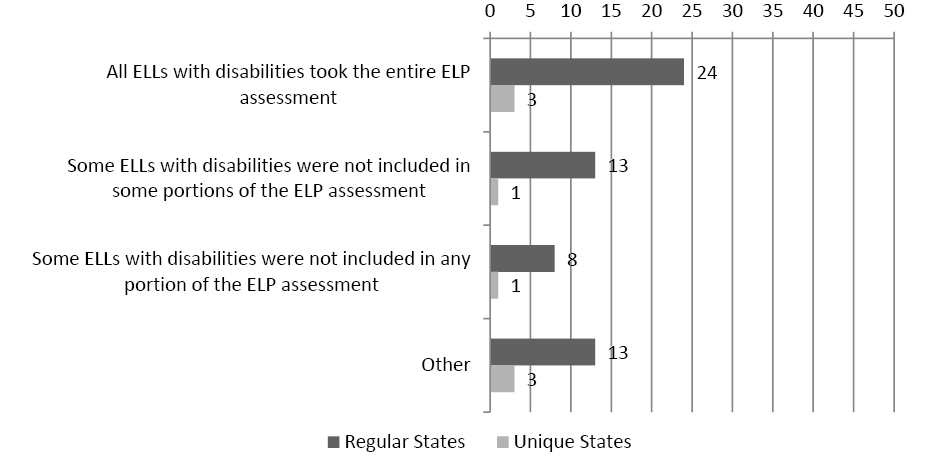
Note: Forty-six regular and six unique states responded to this question. State respondents were able to select multiple responses. In almost half of the regular states and in three of the unique states, all ELLs with disabilities took the entire ELP assessment (see Figure 22). In 13 regular states and one unique state, some ELLs with disabilities were included in some portions of the ELP assessment. In eight regular states and one unique state, some ELLs with disabilities were not included in any portion of the ELP assessment. Figure 22. How States Included ELLs With Disabilities in ELP Assessment Results
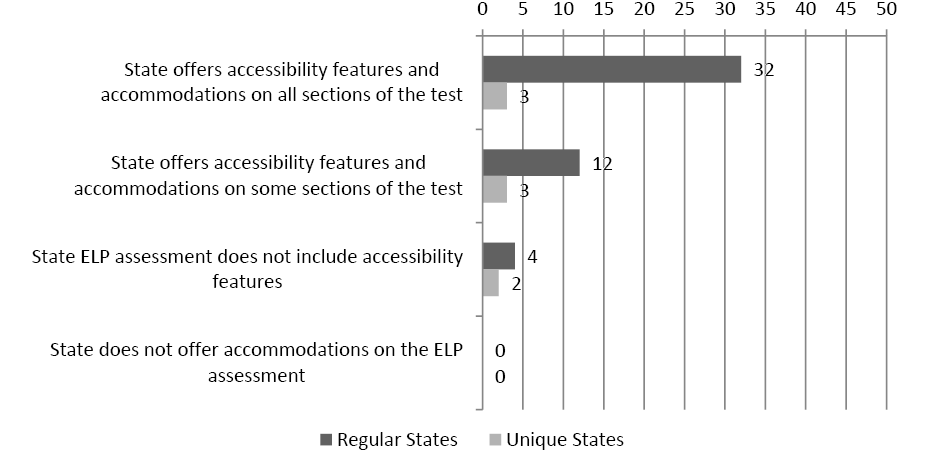
Note: Forty-five regular and five unique states responded to this question. In their comments, respondents reported that certain categories of ELLs with disabilities (ELLs who are deaf or hard of hearing, ELLs who are blind or visually impaired, and ELLs with the most significant cognitive disabilities) were not able to participate in ELP assessments partially or fully. Accessibility and Accommodations for English Language Learners With DisabilitiesAlmost two-thirds of the regular states and several unique states reported offering accessibility features and accommodations on all sections of their ELP assessments (see Figure 23). Twelve regular and three unique states reported offering accessibility features and accommodations on some sections of their ELP assessments. Four regular and two unique states reported that their ELP assessment did not include accessibility features. Figure 23. Accessibility Features and Accommodations Use on ELP Assessments
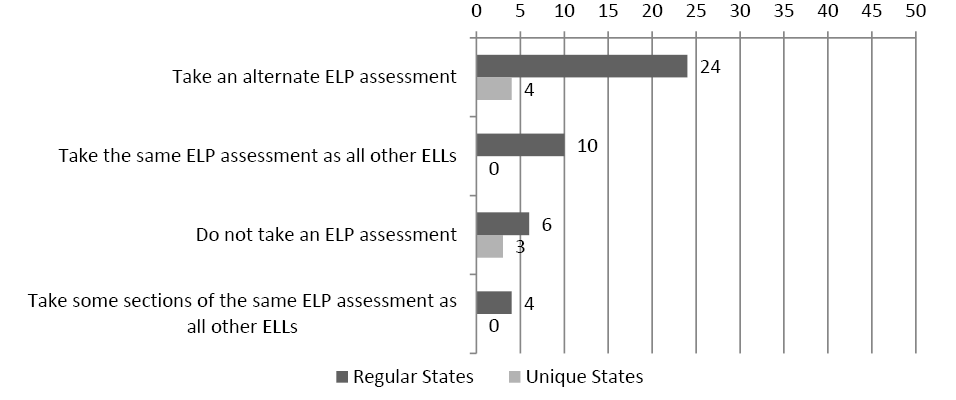
Note: Forty-six regular and seven unique states responded to this question. State respondents were able to select multiple responses. English Language Learners With the Most Significant Cognitive DisabilitiesA few states (six regular and three unique) did not require ELLs with the most significant cognitive disabilities to participate in ELP assessments. In states that required participation for this population, there was variation in how students participated in ELP assessments (see Figure 24). Twenty-four regular and four unique states required ELLs with the most significant cognitive disabilities to take an alternate ELP assessment. In 10 states, these students were required to take the same ELP assessment as all other ELLs. In four regular states, ELLs with the most significant cognitive disabilities were required to participate in some sections of the same ELP assessments as other ELLs. Figure 24. ELLs With the Most Significant Cognitive Disabilities Participation in ELP Assessments
Note: Forty-four regular and seven unique states responded to this question. Top of Page | Table of Contents Technical Assistance NeedsSurvey respondents were asked to rank 15 types of technical assistance in terms of their helpfulness. These rankings and their average scores are highlighted in Table 5. The top three types of technical assistance selected by regular states were: (1) "how to" documents on accessibility and accommodations, alternate assessments, etc. available on the Internet for self review; (2) conference calls on hot topics; and (3) webinars on assessment related topics. The top three types of technical assistance identified by unique states were: (1) individual consultation in the state; (2) assistance with data analysis; and (3) consultation and review of state materials. Table 5. Technical Assistance Ranked by Order of Preference
Note: Forty-eight regular and eight unique states responded to this question. When asked whether their rankings of technical assistance materials and strategies would be different if these materials and strategies focused on ELLs and ELLs with disabilities, the majority of regular and unique states responded "No." Those regular states that responded "Yes" provided the following reasons: ELLs were not separated at the time in state reporting; there was greater reliance on webinars and downloaded training materials in ELL instruction and assessment; ELLs with disabilities were not separated from general population of ELLs in state reporting; and there was no information on the ELLs with disabilities topic. Unique states with affirmative responses to this question reported not having ELL assessments at the time of completing the survey. They also noted the differing accommodations needs of ELLs with disabilities. Top of Page | Table of Contents Appendix: Implications of ESEA Graduation Rate AccountabilityStates were asked to explain any implications for Elementary and Secondary Education Act (ESEA) graduation rate accountability that may occur if students with disabilities who participate in the general assessment do not meet the requirements for a regular diploma. Comments From Regular States:
Comments From Unique States:
They are considered "leavers." They exit school by graduating, aging out of school, or dropping out.
|
||||||||||||||||||||||||||||||||||||||||||||||||||||||||||||||||||||||||||||||||||||||||||||||||||||||||||||||||||||||||||||||||||||||||||||||||||||||||||||||||||||||||||||||||||||||||||||||||||||||||||||||||||||||||||||||||||||||||||||||||||||||||||||||||||||||||||||||||||||||||||||||||||||||||||||||||||||||||||||||||||||||||||||||||||||||||||||||||||||||||||||||||||||||||||||||||||||||||||||||||||||||