Activities, Changes, and Challenges for Special Education 2007 Survey of States Jason Altman • Sheryl Lazarus • Martha Thurlow • Rachel Quenemoen • Marjorie Cuthbert & Damien Cormier October 2008 All rights reserved. Any or all portions of this document may be reproduced and distributed without prior permission, provided the source is cited as: Altman, J. R., Lazarus, S. L., Thurlow, M. L., Quenemoen, R. F., Cuthbert, M., & Cormier, D. C. (2008). 2007 survey of states: Activities, changes, and challenges for special education. Minneapolis, MN: University of Minnesota, National Center on Educational Outcomes. The Mission of the National Center on
Educational Outcomes The Mission of the National Center on Educational Outcomes
With the collective efforts of State Directors of Special Education, and State Directors of Assessment, we are able to report on the activities of all 50 states and 3 of 11 federally funded entities (unique states). Because of the thoughtful and knowledgeable responses of the directors of special education, directors of assessment, and their designees who completed this survey, we are able to share new initiatives, trends, accomplishments, and emerging issues during this important period of education reform. The purpose of this report is to make public the trends and issues facing states, as well as the innovations states are using to meet the demands of changing federal legislation. We appreciate the time taken by respondents to gather information from other areas or departments, and we hope that this collaborative effort provided an opportunity to increase awareness within and across state programs and departments. For their support, special thanks go to:
NCEO’s 2007 Survey of States was prepared by Jason R. Altman, Sheryl S. Lazarus, Martha L. Thurlow, Rachel F. Quenemoen, Marjorie Cuthbert, and Damien C. Cormier. State Directors of Special Education
These were the state directors of special education in August, 2007 when NCEO verified the survey.
These were the state directors of assessment in August 2007 when NCEO verified the survey. This report summarizes the eleventh survey of states by the National Center on Educational Outcomes (NCEO) at the University of Minnesota. Results are presented for all 50 states and 3 of the 11 federally funded entities (unique states). The purpose of this report is to provide a snapshot of the new initiatives, trends, accomplishments, and emerging issues during this important period of standards-based education reform as states document the academic achievement of students with disabilities. Key findings include:
Also, more than half of the states attributed positive trends in the participation and performance of students with disabilities in assessment and accountability systems to the following factors:
States continue to work on ensuring meaningful participation of students with disabilities in state assessments. Progress during the two years since the previous survey has been strong—though many challenges remain.
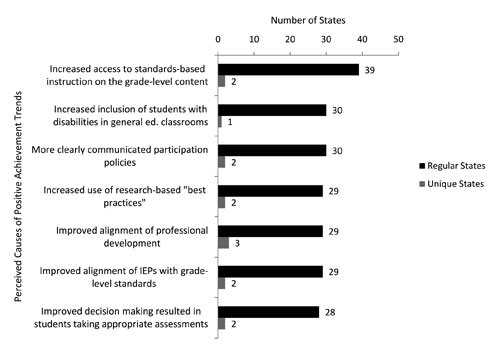
With the inclusion of students with disabilities in assessments and accountability systems, increased attention is paid to the reporting of participation and performance data. Similarly, states increasingly are attending to these data and considering ways to increase the performance of their students with disabilities. Participation Reporting Practices States include students with disabilities in their participation reports in different ways, depending on the nature of their participation. States were asked about student participation in both the 2005 and the 2007 surveys. More states reported counting students as non-participants than in the past (see Table 1). Those counted as non-participants included: students who did not participate in any way, students who sat for the assessment but did not complete it, students who used accommodations that produced invalid results, and students who tested at a lower grade level than their enrollment. Performance Trends The states identified several factors that contributed to positive changes in the percentage of students with disabilities achieving proficiency on the reading or math assessments used for accountability purposes. Factors selected by at least 28 of the states are shown in Figure 1. Selected most frequently were:
In addition, states identified these factors that increased the percentage of students with disabilities achieving proficiency:
Table 1. Reporting Practices for Counting Students as Assessment Participants
a Fewer unique states completed surveys in 2007 than completed surveys in 2005. Representatives from American Samoa, Guam, and the Commonwealth of the Northern Mariana Islands completed the 2007 survey. In 2005, the survey was completed by the Bureau of Indian Affairs, Department of Defense, Commonwealth of the Northern Mariana Islands, Micronesia, and the U.S. Virgin Islands.Figure 1. Perceived Factors Related to Positive Achievement Trends
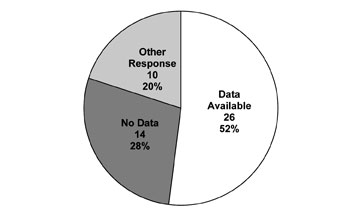
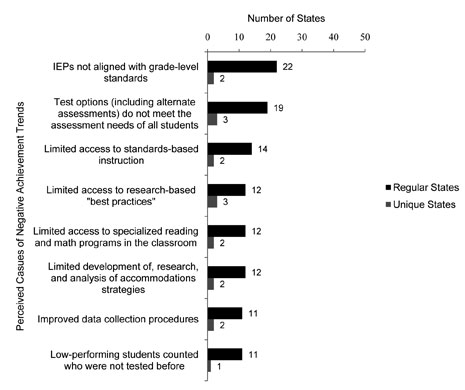
More than half of the regular states indicated that they possess data that support the perceived factors related to positive achievement trends (see Figure 2). States pointed to documents such as federally required State Performance Plans and Annual Performance Reports as well as school and district report cards containing data that supported trends. States also noted other sources of data, and named Web sites where the data were housed. States also documented
some factors that may have resulted in
negative changes—
Figure 2. Availability of State Data or Documentation that Supports Factors Related to Positive Achievement Trends
Figure 3. Perceived Factors Related to Negative Achievement Trends
Practices that Narrow the Achievement Gap In an analysis of promising practices in selected urban public school districts in Massachusetts, the Donahue Institute found that several practices supported the successful narrowing of the achievement gap between students with disabilities and students without disabilities in statewide assessments (Donahue Institute (2004). Report of research findings: Case studies and cross-case analysis of promising practices in selected urban public school districts in Massachusetts. Hadley, MA: University of Massachusetts.). States reported that the practices identified by the Donahue Institute are helpful in their states in raising the performance of students with disabilities and in bringing the performance of these students closer to that of students without disabilities (see Table 2). See individual state responses in Appendix A. Selected most frequently were:
Table 2. Practices Deemed Most Responsible for Narrowing the Achievement Gap
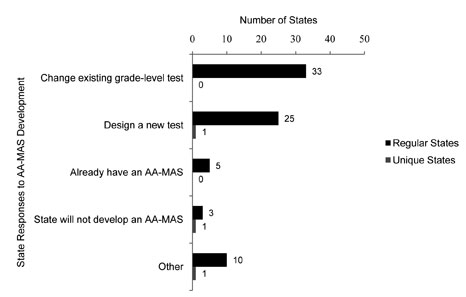
Alternate Assessments Based on Modified Academic Achievement Standards (AA-MAS) States have the option of developing alternate assessments based on modified academic achievement standards (AA-MAS). In April 2007, No Child Left Behind regulations on AA-MAS were finalized. These regulations were released after many states had completed the survey that is the basis for this report. States Considering an AA-MAS Five states already had an assessment that they believed was an AA-MAS in 2007 when they completed the survey (see Figure 4). Thirty-three regular states were considering changing an existing grade-level assessment and another twenty-five were considering developing a new assessment (there is overlap in states selecting these two responses). Some states had no plans to provide this assessment option. A state not planning to develop an AA-MAS added the comment, "The first question to be addressed is ‘Why?’ We want to make sure that we have a robust answer for this question before we proceed." Figure 4. States Considering the Development of an Alternate Assessment Based on Modified Academic Achievement Standards (AA-MAS)
Possible Characteristics of AA-MAS States are approaching the potential development of an AA-MAS in different ways. At least half of the states are considering reducing the number of total test items or the time required to complete the assessment, simplifying the vocabulary, or using shortened or fewer reading passages (see Table 3). Table 3. Assessment Characteristics Considered by States Thinking About Developing "Modified" Assessment Instruments
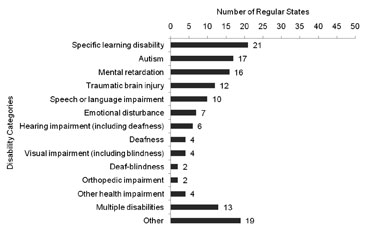
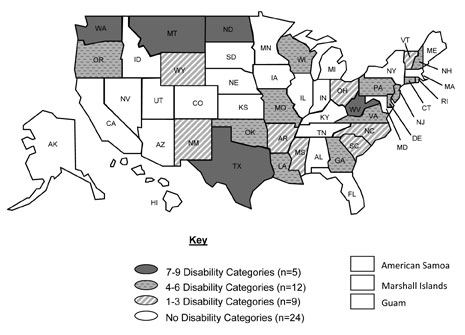
Note: States that did not respond to this question or states that do not plan to develop an AA-MAS are not included in this table. Potential AA-MAS Participants States indicated that they believe that some categories of students with disabilities may be more likely than others to participate in an alternate assessment based on modified academic achievement standards. Figure 5 shows the number of responding states (n = 40 regular states) selecting each disability category that they believe is likely to be included among participants in the AA-MAS. States were able to select as many categories as they wanted. Several states commented that the primary disability classification should not have any impact on assessment participation decision making. Overall, specific learning disabilities, autism, and mental retardation were the categories most often selected by those states that did indicate categories. States identified disability categories that they considered likely to contain students who would participate in an AA-MAS. Respondents selected from a list of disability categories (see Figure 6) and responses ranged from zero to nine disability categories selected. The most common response was between four and six disability categories. It should be noted that three states responded that they were not intending to develop this type of alternate assessment, and therefore were counted in the total number of states not selecting any of the specific disability categories listed in the survey. Also most states which responded "other," provided only a comment and did not also select from the disability categories. These states were also counted in the total number of states selecting no disability categories. Figure 5. Disability Categories of Students More Likely to Participate in an Alternate Assessment based on Modified Achievement Standards
Note: None of the unique states indicated a disability category likely to participate in an AA-MAS. Figure 6. Number of Disability Categories More Likely to Participate in an AA-MAS
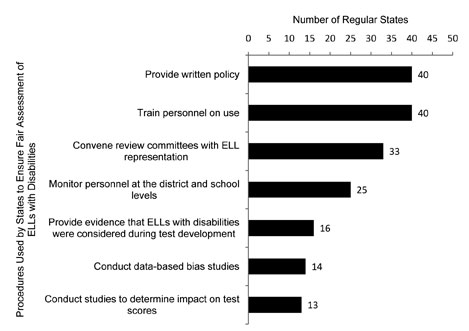
English Language Learners with Disabilities Several questions were asked on the survey to learn more about how English language learners (ELLs) with disabilities are included in state assessment systems and how results are reported for this group. Documentation Approach for ELLs with Disabilities Most states’ policies on the selection and use of accommodations and alternate assessments include information specifically about ELLs with disabilities (see Figure 7). Many states train personnel at the state, district, and school levels on the use of accommodations and alternate assessments for ELLs with disabilities and convene review committees with representation of identified subgroups. However, fewer states conduct data-based bias studies of assessment items or conduct studies to determine the appropriateness of accommodations and their impact on test scores. Individual state responses are provided in Appendix B. One respondent commented, "our state is an English-only state and ELL students, with and without disabilities, struggle with our assessment system." Figure 7. Ways States Document that Assessment Systems are Fair and Accessible for ELLs with Disabilities
Reporting Assessment Results for ELLs with Disabilities Many states do not disaggregate assessment results for ELLs with disabilities (see Table 4). Disaggregation serves purposes such as examining trends and to report on the participation or performance of the students. One state noted that it collects data on ELLs and students with disabilities, "but there is no way to merge the two . . . so in effect, the student may be disaggregated by ELL status and then again by exceptionality status." Table 4. Assessments for Which States Disaggregate Assessment Results for English Language Learners (ELLs) with Disabilities
Note: None of the unique states reported documenting or disaggregating assessment results by ELLs with disabilities. Assessment Development Practices The test development process involves development of requests for proposals, test construction, item and test review, field testing, revision, and live testing. States responded to several questions about their assessment development practices. Field Testing Items in Accommodated Formats Most states reported that they field tested potential assessment items in an accommodated format as well as in the non-accommodated format. Most states embed items that are being field tested in the annual operational or "live" testing in a variety of formats. States reported field testing extended time and test proctor or use of a scribe most often. State data for these as well as other accommodations are shown in Table 5. Table 5. Accommodated Formats that States Field Tested
Note: The Commonwealth of the Northern Mariana Islands and Guam did not field test items in accommodated formats. Universal Design States were asked how they addressed the principles or elements of universal design in the test development process for regular assessments. Many more states indicated in 2007 than in 2005 that they addressed the principles or elements of universal design in the RFP (i.e., the request for proposals) for regular assessments (see Table 6). Most states also considered universal design during test conceptualization and construction, and during the expert review process. Appendix C provides details about the implementation of universal design in individual states. Table 6. Elements of Universal Design Addressed in the Development Process for Regular Assessments
N/A = NCEO did not collect this information on the 2005 survey. States identified several "other" elements of universal design that they addressed. The other elements identified included:
Content and "Bias" Review During the test development process, there may be a content review by a team designed to ensure that the assessment measures key components, accurately measures constructs, and appropriately classifies items. In many states, the content review teams include more than one disability representative; these individuals represent a variety of disability categories (see Table 7). A few states have one person who represents all disability categories. During bias reviews, representatives from communities who may experience bias (e.g., cultural or linguistic minorities, people from diverse socioeconomic levels) examine test items for potential sources of bias. The bias review teams of 35 states included more than one disability representative and these individuals represented a variety of disability categories (see Table 7). States that indicated "other" for either content or bias review generally provided additional detail about the disability representatives and often indicated that there was variation across assessments in the disability representation. Two states noted that representation on alternate assessment committees is more prevalent than on regular assessment committees. Table 7. Representation from Disability Communities on Item Review Teams
a For example, visual disability/blindness.b For example, one person for visual impairment or blindness and one person for learning disabilities.Note: Not all states responded to both sub-questions of this item. States have made many changes to their assessment policies and practices in response to recent changes in NCLB or IDEA regulations or guidelines. Appendix D provides details on these changes. A variety of issues have emerged as states included students with disabilities in their assessment and accountability systems. States address these in many ways. Tracking Student Achievement Over Time Twenty states do not have the capacity to track individual student achievement by the use of a unique student ID number. Another 20 states use these IDs to track student achievement between levels, and 18 states use it to track achievement within levels (see Table 8). Table 8. Tracking Individual Student Academic Achievement Across Years
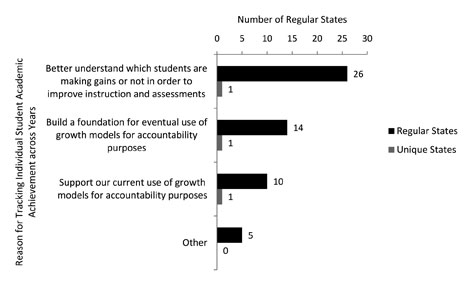
Note: Guam and the Marshall Islands indicated that they are unable to track individual student achievement. American Samoa indicated that it is able to track student achievement between levels. The states that tracked individual student achievement across years did so for different reasons (see Figure 8). The most frequently cited reason was to get a better understanding of which students are making gains (or not making gains) and why, and to improve instruction and assessments. Several states tracked student achievement to build a foundation for eventual use of growth models for accountability purposes, or to support current use of growth models. Twenty states did not track individual student achievement across years. Figure 8. Reasons States Track Individual Student Academic Achievement Across Years
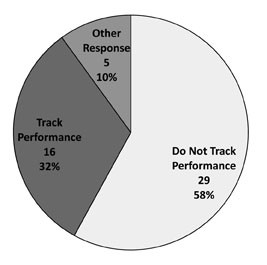
Sixteen states track the performance of students with disabilities who consistently perform poorly on the state’s regular assessment (see Figure 9). Some of the ways they track performance is by disaggregating data by subgroups and plotting the spread of their scores against those of general education students. Several states that responded "other" indicated that either they had the capacity to do the analysis but did not, or that some school districts track performance over time but that the state does not. Figure 9. States that Track Achievement of Poor Performers Over Time
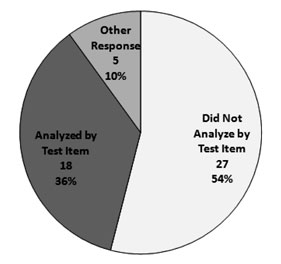
Analyzing Assessment Performance by Test Items Eighteen states analyzed state assessment performance of students with disabilities by test item (through such techniques as differential item functioning—DIF). Some states responded "other" and indicated that this type of analysis was done for some assessments or by some school districts in the state, but not at the state department of education (see Figure 10). Figure 10. Analysis by Test Item of State Assessment Performance of Students with Disabilities
Disaggregating Data by Primary Disability Category According to survey responses from both 2005 and 2007, fewer states appear to be disaggregating assessment results by primary disability category in 2007 than in 2005 (see Table 9). One state said that due to low "n" sizes it keeps this information internal. Two states indicated "other," and said that the information was downloadable and available on the state department of education Web site. Table 9. Disaggregation by Primary Disability Category
N/A = NCEO did not collect this information on the 2005 survey. Note: None of the unique states that responded to the survey indicated that they disaggregated assessment results by primary disability category.
Alternate Assessments Based on Grade-Level Achievement Standards Eight states indicated that they had an alternate assessment based on grade-level achievement standards during the 2006-07 school year (see Table 10). Accommodations Use and Policy Wide variations exist in how states record assessment accommodations actually used on test day (see Table 11). In both the 2005 and 2007 surveys, more than half of the states indicated they have a place on test documents to record the specific accommodations used by a student for the regular assessment. A few states also indicated that they record accommodations used on alternate assessments, though most states reported that they either do not allow accommodations on alternate assessments or the alternate assessment of interest is not offered. Appendix E provides individual state responses on the recording of assessment accommodations. Table 10. States Indicating They Have an Alternate Assessment based on Grade-Level Achievement Standards (AA-GLAS)
Table 11. Number of States that Record Accommodations ACTUALLY Used on Test Day, by Assessment
a The total number of responses adds up to greater than 50 for the regular assessment because it is possible for states to record accommodations in more than one way.Note: American Samoa, Guam, and Commonwealth of the Northern Mariana Islands record accommodations by specific accommodations for the regular assessment. States use a variety of strategies to reduce the number of invalid test results. As seen in Table 12, some states provide information to instructors and teachers through written direction, workshops, and training about how students who use modifications/non-standard accommodations will be counted. Table 12. State Approaches to Reducing Invalid Test Results
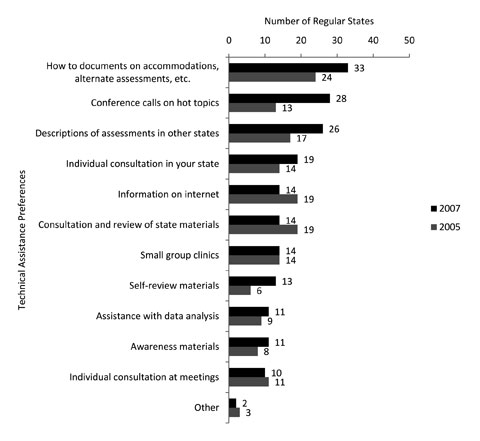
Note: One regular state did not respond to this question. Preferred Forms of Technical Assistance The forms of technical assistance that are preferred by states are shown in Figure 11. Approaches that states preferred in 2007 included "how to" documents, conference calls on hot topics, and descriptions of assessments in other states. Fewer states in 2007 than in 2005 selected consultation and review of state materials or information on the Internet. Figure 11. Technical Assistance Preferences of States
Practices Deemed Most Responsible for Narrowing the Achievement Gap
Ways States Document that Assessment Systems are Fair and Accessible for ELLs with Disabilities
Elements of Universal Design Addressed in the Development Process of Regular Assessments
Changes to State Assessment Policies or Practices in Response to Recent Changes in NCLB or IDEA Regulations or Guidelines
States that Record Accommodations ACTUALLY Used on Test Day
|
|||||||||||||||||||||||||||||||||||||||||||||||||||||||||||||||||||||||||||||||||||||||||||||||||||||||||||||||||||||||||||||||||||||||||||||||||||||||||||||||||||||||||||||||||||||||||||||||||||||||||||||||||||||||||||||||||||||||||||||||||||||||||||||||||||||||||||||||||||||||||||||||||||||||||||||||||||||||||||||||||||||||||||||||||||||||||||||||||||||||||||||||||||||||||||||||||||||||||||||||||||||||||||||||||||||||||||||||||||||||||||||||||||||||||||||||||||||||||||||||||||||||||||||||||||||||||||||||||||||||||||||||||||||||||||||||||||||||||||||||||||||||||||||||||||||||||||||||||||||||||||||||||||||||||||||||||||||||||||||||||||||||||||||||||||||||||||||||||||||||||||||||||||||||||||||||||||||||||||||||||||||||||||||||||||||||||||||||||||||||||||||||||||||||||||||||||||||||||||||||||||||||||||||||||||||||||||||||||||||||||||||||||||||||||||||||||||||||||||||||||||||||||||||||||||||||||||||||||||||||||||||||||||||||||||||||||||||||||||||||||||||||||||||||||||||||||||||||||||||||