Christopher M. Rogers, Virginia A. Ressa, Martha L. Thurlow, and Sheryl S. Lazarus
September 2022
All rights reserved. Any or all portions of this document may be reproduced and distributed without prior permission, provided the source is cited as:
Rogers, C. M., Ressa, V. A., Thurlow, M. L., & Lazarus, S. S. (2022). A summary of the research on the effects of K–12 test accommodations: 2020 (NCEO Report 436). National Center on Educational Outcomes.
Academic research on assessment accommodations continues to be relevant and important for students with disabilities and for those setting accommodations policies at the state level. Several critical areas are pertinent in current investigations, including the effects of different types and forms of accommodations on student performance, educators’ and students’ knowledge and perceptions of accommodations, educators’ accommodations implementation practices, and students’ accommodations use factors. Findings from these investigations provide valuable information for policymakers. The research also highlights important emerging issues including the role of technology in facilitating accessibility for students with disabilities through built-in accommodations and in considering needed practices for applying technologies.
The studies presented in this report provide an update to the state of the research on testing accommodations. The National Center on Educational Outcomes (NCEO) has covered research published since 1999. In this report, we summarize the research published in 2020, with 11 research studies addressing testing accommodations in the U.S. K–12 education system.
Purpose of research: The research published in 2020 addressed several purposes related to accommodations, most commonly effects, students’ and teachers’ perceptions, and use and implementation issues. The chief purpose of most studies was to investigate the effects of testing accommodations on the assessment performance of students with or without disabilities, or of both student groups. Over four-fifths of the studies each had additional purposes, the majority of which converged on the topics of perceptions, preferences, and use of accommodations, with five dissertations providing research summaries on specific accommodations.
Research design: The accommodations research in 2020 featured descriptive quantitative and quasi-experimental designs in more than half of the studies reviewed. Other research designs were employed in one study each: correlation/prediction, experimental, longitudinal, and descriptive qualitative. Most studies used data collected by the studies’ researchers. Only three studies out of the 11 analyzed data from secondary data sources. Data collection methods included tests, observations, surveys, course grades, focus group protocols, and interviews.
Types of assessments, content areas:Several types of assessments were employed to investigate student performance. Academic tests developed by professionals or researchers not involved with the study provided data for four studies. Data from criterion-referenced academic achievement measures were examined in three studies, and state criterion-referenced assessment data were used in three studies. One study applied a norm-referenced academic achievement measure. Most of the 2020 studies focused on accommodations in academic content areas. Among the 10 relevant studies, 70 percent analyzed mathematics performance scores, half incorporated reading scores, and 10 percent examined science scores; 30 percent included data from more than one content area.
Participants:Most participants across the studies were K–12 students. More than half of the studies had student participants from more than one school level: three studies in elementary and middle schools, two studies in middle and high schools, and one study with all three levels. Educators were respondents, interviewees, or discussants in five studies. Sample sizes ranged between 3 and 193,692 participants, with the majority including 21–371 participants.
Disability categories: Participants’ disability categories varied. Students with emotional-behavioral disabilities and students with autism were each participants in about one-quarter of the studies. Participants with intellectual disabilities were represented in about one-fifth of the studies. Students with attention problems, health impairments, learning disabilities, physical disabilities, or visual impairments each were participants in less than one-tenth of the studies. Over half of the studies included students without disabilities, while over one-quarter did not specify the categories of participants’ disabilities.
Accommodations:A variety of accommodation types were included in the 2020 research studies. Presentation accommodations comprised over three-fifths of the categories studied. Equipment and response accommodations were each inspected in over half of the studies, while scheduling accommodations were addressed in nearly half of the studies. A majority of the studies featured accommodations that employed technology, such as electronic administration, speech-to-text software, text-to-speech devices or software, electronic response systems, and virtual manipulatives. Text-to-speech devices/software was the most-studied individual accommodation. Most of the studies published in 2020 were investigations of more than one accommodation type.
Findings: Close to three quarters of the studies from 2020 reported on the effects of accommodations on assessment performance. Over one-third of the studies reporting effects of accommodations discussed extended time. Over one-third included electronic administration. One-quarter of the studies provided findings on oral delivery through text-to-speech software and one-quarter included manipulatives. Over one-third reported effects of aggregated sets of accommodations, and over one-third reported effects of single accommodations. Less than half of these studies showed only benefits for students with disabilities when using accommodations. Some studies provided mixed or complex results for students with disabilities using assessment accommodations; that is, some but not all participants drew benefits from the accommodations, or some but not all accommodations were beneficial, or scores in some but not all academic content areas were significantly affected. Very few studies indicated that students had no significant difference in performance when making use of supportive accessibility features or accommodations when compared with traditional assessment formats.
More than half of the studies reported findings on perceptions or preferences for accommodations. Half of these perceptions studies reported only educators’ perceptions and only one study reported only students’ perceptions. One-third of these studies reported both student and educator views. Educators’ perceptions were primarily positive, yet at least some educators in nearly all relevant studies offered concerns or critiques of accommodations conditions. Students’ perceptions about accommodations were also primarily positive when comparing accommodated and non-accommodated assessments and student participants also offered constructive feedback on their experiences. Less than one-fifth of all studies reported on accommodation practices and use; half of these reported on patterns of accommodation use across student populations and the other half on educators’ accommodation implementation practices. A pair of studies from 2020 reported findings on the comparison of performance on test items using different analysis methods of differential item functioning (DIF).
Access to assessments for students with disabilities is supported through the use of accommodations. With accommodations, students with disabilities, including English learners with disabilities, are better able to show their academic knowledge and skills. Accommodations also enable these students to participate in state assessments, as required by the Individuals with Disabilities Education Act (IDEA) of 2004 and by the 2015 reauthorization of the Elementary and Secondary Education Act (ESEA). Accommodations are changes in materials and procedures that do not compromise the validity of assessment results and interpretations of those results. Evidence is needed to ensure that validity is not negatively affected. It is also important to examine perceptions of accommodations and implementation issues because these influence whether accommodations are used appropriately. Research conducted on accommodations can provide states with information useful for policy on accommodations.
To synthesize accommodations research efforts completed across the years, the National Center on Educational Outcomes (NCEO) has published a series of reports on accommodations research. The time periods included 1999–2001 (Thompson et al., 2002), 2002–2004 (Johnstone et al., 2006), 2005–2006 (Zenisky & Sireci, 2007), 2007–2008 (Cormier et al., 2010), 2009–2010 (Rogers et al., 2012), 2011–2012 (Rogers et al., 2014), 2013–2014 (Rogers et al., 2016), 2015–2016 (Rogers et al., 2019), 2017 (Rogers et al., 2020), 2018 (Rogers et al., 2021), and 2019 (Rogers et al., 2022). The report summarizing the 2017 empirical studies narrowed the focus to K–12 research within the United States.
The purpose of this report is to present a synthesis of the research on test accommodations for U.S. elementary and secondary students (K–12) published in 2020. The academic literature described here incorporates empirical studies of performance comparability, as well as investigations into accommodations use, implementation practices, and perceptions of the nature and effectiveness of accommodations. Reporting the findings of recent research studies was the collective goal of these analyses.
Similar to the process used in NCEO’s past accommodations research syntheses, a number of sources were accessed to complete the review of the K–12 accommodations research published in 2020. Specifically, five research databases were consulted: Educational Resources Information Center (ERIC), PsycINFO, Academic Search Premier, Dissertations and Theses Global, and Educational Abstracts. To help affirm the thoroughness of our searches, we used the Web search engine Google Scholar to locate additional research, if any. In addition, a hand-search of at least 50 journals was completed in efforts to ensure that no qualifying study was missed. A list of hand-searched journals is available on the NCEO website (https://nceo.info/Resources/bibliographies/accommodations/methods-for-identifying).
Online archives of several organizations also were searched for relevant publications. These organizations included Behavioral Research and Teaching (BRT) at the University of Oregon (https://www.brtprojects.org/publications/), the College Board Research Library (http://research.collegeboard.org), the National Center for Research on Evaluation, Standards, and Student Testing (CRESST; http://cresst.org/education/), and the Wisconsin Center for Educational Research (WCER; https://www.wcer.wisc.edu/publications).
The initial search was completed in December, 2020. A second search was completed in March, 2021, to ensure that all articles published in 2020 were found and included in this review. Within each of these research databases and publications archives, we used a sequence of search terms. Terms searched for this review were:
Many of these search terms were used as delimiters when searches yielded large pools of documents found to be irrelevant to the searches.
The research documents from these searches were then considered for inclusion in this summary report using several criteria:
These limitations do not necessarily apply to NCEO’s Accommodations for Students with Disabilities Bibliography, which is an online database (https://nceo.info/Resources/bibliographies/accommodations/bibliography). The online Bibliography will continue to include research in non-U.S. settings. Postsecondary accommodations research will also continue to be included, and many literature reviews of various kinds have been and will continue to be featured in the database as well.
To reflect the wide range of accommodations research in the K–12 system that was published in 2020, the studies were examined and summarized on the following features: (a) publication type, (b) purposes of research, (c) research design and data collection source, (d) assessment or data collection focus, (e) characteristics of the independent and dependent variables under study, and (f) comparability of findings between and among studies with similar features.
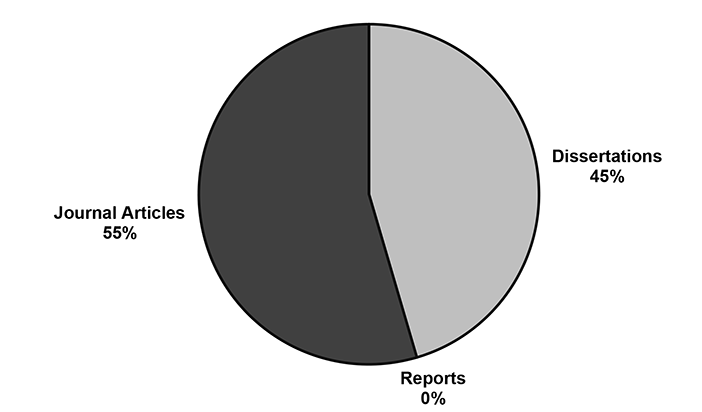
Eleven studies were published in 2020. Figure 1 shows that the studies were split between journal articles (n=6) and dissertations (n=5), with slightly more of the studies appearing in journals. This is a significant difference from the studies from 2019: 10 of 11 studies were journal articles and just one was a dissertation. None of the 2020 studies was a professional report conducted by any research organization or entity (e.g., Wisconsin Center for Education Research). Coincidentally, the number of studies published on accommodations in K–12 domestic context has been 11 for three years in a row (2018, 2019, and 2020). A significant trend had been an increase in journal articles (from four in 2015 to 10 in 2019) but that pattern came to an end this year when the number of journal articles decreased to six. A trend that continues is the lack of any published studies from research organizations since 2015. The six journal articles in this year’s review represent five journals, with one journal having published two of the studies. Appendix A includes a table displaying each study’s publication type.
Figure 1. Percentage of Accommodations Studies by Publication Type in 2020
The K–12 accommodations research published in 2020 had several purposes. Table 1 displays the “primary purpose” of each of the 11 studies reviewed. Table 2 presents the primary and additional purposes of each study. Most (n=9) of the studies reviewed had more than one purpose. The “primary purpose” was identified based on the narrative description of research questions, title of the work, or the first-mentioned purpose in the text.
Table 1. Primary Purpose of K–12 Studies in 2020
| Purpose | Number of Studies |
Percent of Studies |
|---|---|---|
| Compare scores | 8 | 73% |
| only students with disabilities (4 studies; 36% of studies) | ||
| only students without disabilities (1 studies; 9% of studies) | ||
| both students with and without disabilities (3 studies; 27% of studies) | ||
| Compare test items across assessment formats | 2 | 18% |
| Study/compare perceptions and preferences | 1 | 9% |
| Report on implementation practices and accommodations use | 0 | 0% |
| Discuss issues related to test accommodations | 0 | 0% |
| Summarize research on test accommodations | 0 | 0% |
Of the 11 studies reviewed from 2020, the primary purpose of eight studies was to compare scores for detecting the effects of accommodations on test performance. This includes four studies whose primary purpose was to analyze the effects of accommodations on the performance of only students with disabilities. Three other studies looked at the effects of accommodations on the performance of students with and without disabilities. One study did not indicate any student disabilities in the research description. Of the remaining three studies, one focused on the perceptions of students and teachers about accommodations and two on test item differences due to test formats.
Almost all of the K–12 research studies on accommodations in 2020 (n=9) had multiple purposes, as shown in Table 2. The most frequent study purpose identified was to analyze the effects of accommodations through comparing performance data of students with disabilities between testing conditions (n=4). Some of the studies considered the performance of both students with and without disabilities (n=3) and a single study looked only at students without disabilities (n=1). Thus, 73% or 8 out of 11 studies sought to compare the performance of accommodated and non-accommodated students.
For more than half of the studies, studying or comparing teacher and student perceptions about the use of accommodations was identified as a purpose (n=6). A significant secondary purpose of the 2020 studies was to summarize research on test accommodations (n=5). The purposes of the remainder of the studies reviewed included reporting on implementation of accommodations, comparing test items across formats, and discussing issues related to accommodations.
Table 2. All Purposes of K–12 Studies in 2020
| Purpose | Number of Studies | Percent of Studies |
|---|---|---|
| Compare scores | 8 | 73% |
| only students with disabilities (4 studies; 36% of studies) | ||
| only students without disabilities (1 study; 9% of studies) | ||
| both students with and without disabilities (3 studies; 27% of studies) | ||
| Study/compare perceptions and preferences | 6 | 55% |
| Report on implementation practices and accommodations use | 2 | 18% |
| Compare test items across assessment formats | 2 | 18% |
| Discuss issues related to test accommodations | 2 | 18% |
| Summarize research on test accommodations | 5 | 45% |
Note. Nine of 11 studies had more than one purpose; therefore, numbers total more than the 11 studies represented, and percents total more than 100.
Appendix B presents more details on the purposes of the 2020 studies reviewed. Almost all (nine of the 11 studies) in this review had multiple purposes, in comparison to the 2019 review that identified five of 11 studies as having multiple purposes (Rogers et al., 2022). One study (Spurlock) had four identified purposes, with the primary purpose being to report on implementation practices and the use of accommodations. That study also compared student performance data, discussed perceptions of educators, and provided a review of related research literature. Similarly, the other studies’ additional purposes were most often related to discussing student and educator perspectives of accommodations and the review of related research literature.
Descriptive quantitative and quasi-experimental designs were the two most frequent accommodations research designs published in 2020, together comprising more than one-half of the 11 K–12 studies (see Table 3; Appendix A presents research designs and data collection sources for individual studies). All other research designs (i.e., correlation/prediction, experimental, longitudinal, and descriptive qualitative) were used by just one study; all of these used a primary data set. This is a change from studies published in 2019, which had experimental research (along with quasi-experimental) as one of the top two most frequent research designs.
For the most part, the researchers of studies published in 2020 gathered the data themselves. Only three of the 11 studies (27%) used data from a secondary data source, and these studies also used a primary data source. The percentage of studies using secondary data sources in 2020 was similar to the percentage of studies using secondary data sources in previous years (e.g., Rogers et al., 2020, 2021).
Table 3. Research Type and Data Collection Source for K–12 Studies in 2020
| Research Type | Primary Source | Secondary Source | Total |
|---|---|---|---|
| Descriptive quantitative | 1 | 3 | 4 |
| Quasi-experimental | 3 | 0 | 3 |
| Correlation/Prediction | 1 | 0 | 1 |
| Experimental | 1 | 0 | 1 |
| Longitudinal | 1 | 0 | 1 |
| Descriptive qualitative | 1 | 0 | 1 |
| Totals | 8 | 3 | 11 |
The 2020 research we analyzed employed the methods shown in Figure 2 to collect study data. Nearly all of the studies (n=10) used performance data acquired through academic content testing. In some studies (e.g., Goodwin et al.), tests were administered as part of the study, while in others (e.g., Traficante), extant academic data sources were used. Surveys supplied data for over one-third of the 11 studies, including surveys or questionnaires for teachers and for students to complete. Two studies (Goodwin et al.; Hott & Brigham) sought survey data only from students, one study (Jimenez & Besaw) engaged only a teacher as a survey respondent, and one study (Lam et al.) gathered survey responses from both students and educators. Observations were also data sources in a plurality (36%) of studies in 2020. Only one study (Shobe) performed individual interviews, one study (Spurlock) employed a focus group protocol, and one study (Traficante) gathered course grades. Six studies (55%) reported using more than one method or tool to gather data. The most common combination of collection methods was observations, surveys, and tests (n=4, 36%). See Appendix A for additional details about each study’s data collection methods.
Figure 2. Data Collection Methods Used in K–12 Studies in 2020
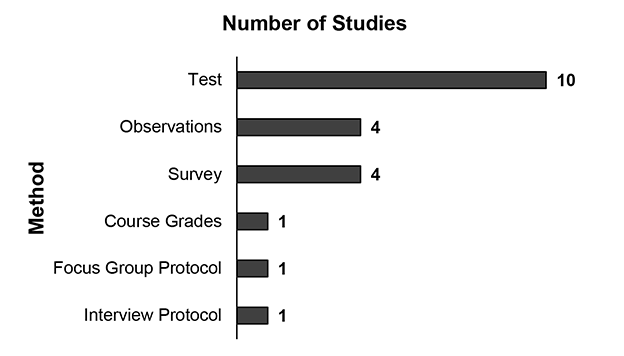
Note. Of the 11 studies reviewed for this report, four each reported using three data collection methods and two each reported using two data collection methods. Thus, the number of methods in this figure totals more than 11.
All of the studies published in 2020 used some type of data collection instrument (see Table 4). The terms used in Table 4 are defined as follows:
All of the instruments were placed into seven categories:
Table 4. Data Collection Instrument Types for K–12 Studies in 2020
| Instrument Type | Number of Studiesb |
Percent of Studiesb |
|---|---|---|
| Non-academic protocols or surveys developed by study author/s | 6 | 55% |
| Surveys or academic tests developed by professionals or researchers using sources outside of current study | 4 | 36% |
| State criterion-referenced academic assessments | 3 | 27% |
| Non-state criterion referenced academic assessments | 3 | 27% |
| Norm-referenced academic achievement measures | 1 | 9% |
| Norm-referenced cognitive ability measures | 1 | 9% |
| Othera | 1 | 9% |
a Other: see Appendix C, Table C-1 for specific information in Traficante, 2020.
b Seven studies (64%) used more than one type of instrument; therefore, numbers total more than the 11 studies represented, and percents total more than 100.
Non-academic protocols developed by the authors of the studies were used in a majority of studies from 2020. This was the most commonly-used type of instrument. Surveys frequently provided social validity data. Four studies gathered survey responses: questionnaires with rating scales for student participants on their experiences with the accommodations during the studies (Hott & Brigham), preferences between test versions (Goodwin et al., Lam et al.), and teacher participants’ perceptions and evaluations of accommodations (Jimenez & Besaw). Several observation routines and tools were applied in four studies from 2020: informal documentation of student test-taking behaviors (Lam et al.), descriptions of video recordings of testing sessions (Goodwin et al.), on-task testing behaviors (Hott & Brigham), and off-task behaviors (Jimenez & Besaw). It is noteworthy that the same four studies used both surveys and observation protocols.
Four studies employed surveys or academic tests developed by researchers or other education professionals using sources outside of the study. An example of a survey employed in studies in 2020 was the Usage Rating Profile-Assessment (URP-A; Chafouleas et al., 2012), used by Lam and colleagues. An example of an academic test was assembled by Goodwin and colleagues, drawing a reading passage and reading comprehension questions from the National Assessment of Educational Progress (NAEP); the study authors, who were content specialists, also designed additional test items with multiple-choice, true/false, and constructed response types.
State criterion-referenced assessments were used in three studies in 2020 (Traficante; Witmer & Roschmann a, b). State tests were from Michigan (Witmer & Roschmann a, b) and from North Carolina (Traficante). Five criterion-referenced academic achievement measures were used in four studies. Two studies (Lam et al.; Goodwin et al.) implemented versions of the reading Measures of Academic Progress (MAP; Northwest Evaluation Association, 2014, 2015, respectively). A national sample from the 2013 administration of the grades 4 and 8 National Assessment of Educational Progress (NAEP) in mathematics and reading was analyzed (Tam), and the Common Assessment (CA; Mastery Connect, 2020) in math was used as a pre- and post-test (Spurlock). Lam and colleagues also examined scores from the Woodcock-Johnson, 3rd edition, Passage Comprehension subtest (WJ-III; Woodcock et al., 2001). One norm-referenced academic achievement measure, the Nelson-Denny Reading Test (NDRT; Fishco, 2019) was employed for identifying language development and comprehension, as well as reading rate (Aceti). A norm-referenced measure of cognition—the Woodcock-Johnson Tests of Cognitive Abilities, 4th Edition (WJ-IV COG; McGrew et al., 2014)—was used to identify the cognitive processing speed of participants (Aceti). Approximately 64 percent of all studies (n=7) used instrumentation of more than one kind. We present a complete listing of the instruments used in each of the studies in Table C-1 in Appendix C, including the related studies or other sources for these instruments, when available.
Nine of the studies published in 2020 focused on accommodations used in specific academic content areas. Shobe did not identify a specific content area.
As shown in Table 5, mathematics was the most commonly studied content area for studies from 2020. Table 5 also provides the findings for the two previous years (2018—Rogers et al., 2021; 2019—Rogers et al., 2022). In all three years, mathematics was the most common content area for accommodations research. (See Appendix C, Table C-2 for details about 2020 study content areas.)
Table 5. Academic Content Area Assessed in K–12 Studies across Three Reports
| Content Area Assesseda | 2018 | 2019 | 2020 |
|---|---|---|---|
| Mathematics | 7 (78%) | 5 (50%) | 7 (70%) |
| Reading | 1 (11%) | 4 (40%) | 5 (50%) |
| Science | 1 (11%) | 1 (10%) | 1 (10%) |
| Writing | 0 (0%) | 1 (10%) | 0 (0%) |
| Other language arts | 1 (11%) | 2 (20%) | 0 (0%) |
| Cognitive skills | 0 (0%) | 1 (10%) | 1 (10%) |
| Multiple contentc | 2 (22%) | 4 (40%) | 3 (30%) |
| Total (of Relevant Studies)b | 9 | 10 | 10 |
a Studies in all three years included studies that addressed more than one content area (i.e., two content areas, three content areas), so the percentages for each year total more than 100.
b These totals were less than all studies analyzed from these years; in 2020, one study (Shobe, 2020) did not address a specific content area.
In the research published in 2020, just three of the studies included more than one content area. Traficante included three content areas (math, reading, and science). Tam included math and reading. Aceti addressed reading and cognitive skills. None of the studies published in 2020 addressed writing, other language arts, or social studies.
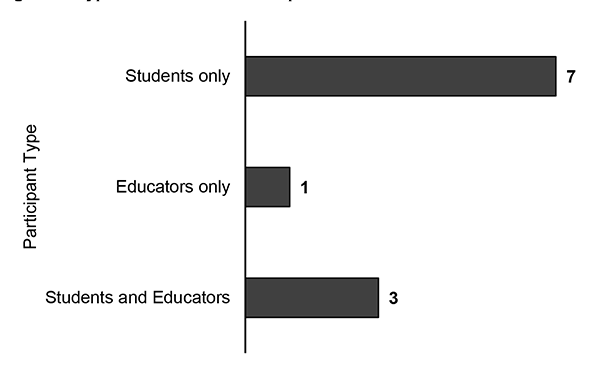
The studies in this review of accommodations research from 2020 included students, educators, or both students and educators as participants, as shown in Figure 3 and Appendix D. Nearly two-thirds of the studies included students only (n=7, 64%) and just one study included educators only (n=1, 9%). Three studies—approximately 27 percent—included both students and educators. No studies included parents as study participants.
Figure 3. Types of Research Participants for K–12 Studies in 2020
In 2020, six studies (Hott & Brigham; Jimenez & Besaw; Lam et al.; Traficante; Witmer & Roschmann a, b) specified the disabilities of the students included in their participant samples (see Appendix D). The disability type was not specified in three studies (Aceti; Spurlock; Tam). One study (Goodwin et al.) included only students without disabilities. Jimenez and Besaw, Lam and colleagues, and Spurlock included educator perspectives as a component of their studies through a social validity survey, a feasibility and utility survey, and teacher reflections and interviews.
For the 10 studies in 2020 that included K–12 students, the size and composition of the participant groups are shown in Table 6. See Appendix D for additional details about each study’s participants. In this set of reviewed studies, student participant groups varied from a sample size of just two participants (Jimenez & Besaw), to 193,692 students (Tam). The two most common student group sizes were between 10 and 99 participants (n=3) and between 100 and 9,999 participants (n=3). The two studies by Witmer and Roschmann using extant data sets had 1,000–99,999 participants each. Table 6 shows that students with disabilities comprised 25-49% (Aceti, 2020; Traficante; Witmer & Roschmann a, b) or 75–100% (Hott & Brigham; Jimenez & Besaw; Lam et al.; Tam) of study samples, with four studies in each range. Within each range, there was a variability of sample sizes.
Four studies (Aceti; Traficante; Witmer & Roschmann a, b) compared performance of students with and without disabilities. An additional study (Spurlock) examined the classwide performance of inclusion classes, consisting of students with and without disabilities, provided with specific instructional and classroom assessment accommodations but did not report the specific numbers of students with disabilities in the classes and their performance. One study (Goodwin et al.) did not include any students identified with disabilities. Shobe (2020) was not represented in Table 6, because only educators were included as participants in that study.
Table 6. Student Participant Sample Sizes and Ratio of K–12 Students with Disabilities in 2020
| Number of Student Participants by Study |
Number of Studies by Proportion of Sample Comprising Students with Disabilities |
||||
|---|---|---|---|---|---|
| 0–24% | 25–49% | 50–74% | 75–100% | Total | |
| 1–9 | 1 | 0 | 0 | 1 | 2 |
| 10–49 | 0 | 1 | 0 | 2 | 3 |
| 50–99 | 0 | 0 | 0 | 0 | 0 |
| 100–999 | 1 | 1 | 0 | 0 | 2 |
| 1,000–99,999 | 0 | 2 | 0 | 0 | 2 |
| 100,000–200,000 | 0 | 0 | 0 | 1 | 1 |
| Total | 2 | 4 | 0 | 4 | |
Note. Ten stud ies provided data on the numbers of student participants with and without disabilities.
This review of accommodations research identified 10 studies that included students at the elementary, middle, or high school levels (Table 7; see Appendix D for students’ specific grade levels when available). A majority of studies with student participants included multiple education or schooling levels (n=6), and one of these had participants at all school levels (Lam et al.). Two studies (Jimenez & Besaw; Spurlock) included students in just one school level; however, Jimenez and Besaw did not report the students’ actual grade levels, but only their ages (8 and 9); the students attended a self-contained classroom working on extended content standards.
The studies trended toward including participants in the elementary and middle grades, with seven studies at the elementary level (64%) and six at the middle school level (55%), including the six studies each composed of participants from more than one school level—elementary-middle, middle-high school, or elementary-middle-high school. Four studies (Aceti, Hott & Brigham, Lam et al., Traficante) included student participants at the high school level (36%), with three of these studies incorporating students at the earlier grade levels: middle school in two studies, elementary and middle school in one study. Only one study (Aceti) focused solely on high school students. Ten of the 11 studies had student participants, three studies (Jimenez & Besaw; Lam et al.; Spurlock) had both students and educators as participants, and one study (Shobe) had only educators as participants.
Table 7. School Level of Research Participants for K–12 Studies in 2020
| School Level of All Participants | Number of Studies | Percent of Studies |
|---|---|---|
| Elementary school (K–5) | 7 | 64% |
| Middle school (6–8) | 6 | 55% |
| High school (9–12) | 4 | 36% |
| Not specified | 1 | 9% |
Note. Six studies (55%) had participants in more than one schooling level; therefore, the numbers total more than the 11 studies represented, and percents total more than 100.
The accommodations research published in 2020 examined students with a range of disability categories (see Appendix D for individual study details). As Table 8 shows, the studies included students from eight disability categories. The largest proportion of the 11 studies focused on student participants with emotional-behavioral disabilities (n=3, 27%) and autism (n=3, 27%). Intellectual disabilities appeared in 18% of studies. Other disability categories each appeared in 9% of the studies. Three studies (Aceti; Spurlock; Tam) did not specify the disability categories represented by the participating students. Additionally, four studies included educator participants, for which disability type was “not applicable.” Of these four studies, three (Hott & Brigham; Jimenez & Besaw; Lam et al.) also had participants who were students with disabilities, and one study (Shobe) did not include student participants. Six studies (55%) included students without disabilities, five for comparison-related purposes. One study (Goodwin) did not include any students with disabilities.
Only one study (Lam et al.) from 2020 included students with hearing impairments, in which reliability and validity of student scores between paper-pencil and electronic testing modalities were investigated. Participants with attention problems, learning disabilities, physical disabilities, and visual impairments were only featured in one study (Traficante), which also included students with autism, emotional behavioral disabilities, and intellectual disabilities. The study investigated the links connecting special education disability categories and mental health diagnoses—as well as accommodations use—with students’ course grades and standardized test performance over time. In the one study that included no students with disabilities, Goodwin (2020) explored student performance and behaviors when presented with reading passages electronically and on paper.
Table 8. Disabilities Reported for Research Participants for K–12 Studies in 2020
| Disabilities of Research Participants | Number of Studies | Percent of Studies |
|---|---|---|
| Emotional behavioral disabilities | 3 | 27% |
| Autism | 3 | 27% |
| Intellectual disabilities | 2 | 18% |
| Attention problems | 1 | 9% |
| Hearing impairment (including deafness) | 1 | 9% |
| Learning disabilities | 1 | 9% |
| Physical disabilities | 1 | 9% |
| Visual impairment (including blindness) | 1 | 9% |
| No disability | 6 | 55% |
| Not specified | 3 | 27% |
| Not applicablea | 4 | 37% |
Note. Several studies had participants who fell into various disability categories or other designations; therefore, the numbers in this figure total more than the 11 studies represented, and percents total more than 100.
a These studies included educators; educators’ disability status was not deemed relevant in these studies.
Appendix D provides study-level details on disability categories, noting that two studies in this review included student participants from more than one disability category. The Jimenez and Besaw (2020) study included two students identified with autism and an intellectual disability. The study by Traficante (2020) investigated the links between special education categories or mental health diagnoses, accommodations use, and student grades and standardized test scores over more than one year.
The research studies published in 2020 are summarized in Table 9 according to the categories of accommodations being studied. Presentation was the most commonly investigated accommodation category, with seven studies addressing accommodations in that category. Equipment/materials and response accommodations were examined next most frequently, in six studies each. Five studies examined timing/scheduling accommodations, and one study addressed the category of setting accommodations.
Table 9. Accommodation Categories for K–12 Studies in 2020
| Accommodations Category | Number of Studiesa |
|---|---|
| Presentation | 7 |
| Equipment/Materials | 6 |
| Response | 6 |
| Timing/Scheduling | 5 |
| Setting | 1 |
a Eight studies investigated accommodations from more than one category; therefore, the numbers in this table total more than the 11 studies represented.
Figure 4 shows the specific accommodations investigated in the studies published in 2020. Details on the accommodations examined in each of the 11 studies published in 2020 are provided in Appendix E, Table E-1. Several of the accommodations listed in that table are categorized as “Other” in Figure 4 because they were examined in just one study (e.g., cueing, calculation chart, specialized setting).
Figure 4. Specific Accommodations for K–12 Studies in 2020

Note. Six studies each examined the separate impacts of more than one accommodation; therefore, the total exceeds the number of studies represented (11).
* Oral delivery includes live/in-person and recorded human voice.
** Other includes single accommodations addressed in just one study.
The most frequently examined presentation accommodation in the studies published in 2020 was text-to-speech device/software, with four studies (Tam; Traficante; Witmer & Roschmann, a, b). (See Appendix E, Table E-2 for studies of presentation accommodations.) Text-to-speech was always studied with other accommodations. Electronic administration—which comprises presentation, equipment/materials, and response accommodations categories—was the next most frequently investigated presentation accommodation, with three studies (Goodwin et al.; Lam et al.; Shobe). All three electronic administration studies addressed different aggregated sets of accommodative tools offered through their electronic or computer-based platforms. Two studies published in 2020 examined oral delivery, defined broadly to include live/in-person and recorded human voice. Witmer and Roschmann (a, b) examined both versions of oral delivery in their studies, along with several other accommodations. Other presentation accommodations represented in just one study (Traficante) were clarifying directions, cueing, and reinforcement.
In addition to electronic administration, other frequently studied equipment/materials accommodations in 2020 published research (see Appendix E, Table E-3) were dictionary/keyword list/word bank (Goodwin et al.; Spurlock; Traficante). Goodwin and colleagues examined a dictionary accommodation combined with electronic administration in an aggregated set of accommodations. Spurlock examined keyword lists along with multiplication charts, and Traficante included a word bank along with numerous other accommodations. Technological aids were examined in two studies (Shobe; Traficante). Only Jimenez and Besaw studied the equipment/materials accommodation of manipulatives (virtual).
Response accommodations were investigated in six studies (see Appendix E, Table E-4). Three of these were the previously mentioned electronic administration accommodation (Goodwin et al.; Lam et al.; Shobe). Other response accommodations were investigated in one study each—calculation chart (Spurlock), communication system involving response cards and response system (Hott & Brigham), dictated response (Traficante), mark answer in test booklet (Traficante), and word processing for a writing assessment (Traficante).
Timing/scheduling accommodations (see Appendix E, Table E-5) examined in a total of five studies published in 2020 included extended time in three studies (Aceti; Tam; Traficante) and multiple days in two studies (Witmer & Roschmann a, b). Breaks during testing was a timing/scheduling accommodation examined in just one study (Traficante). All of these, except for the Aceti study, addressed additional accommodations along with timing/scheduling accommodations.
One study from 2020 examined a setting accommodation: Traficante included separate setting (see Appendix E, Table E-6) among numerous other accommodations in that dissertation study.
As indicated, most of the 11 studies (n=8) included accommodations from more than one category. Of those, one study (Traficante) included accommodations from each of five accommodations types. Three studies (Goodwin et al.; Lam et al.; Shobe) included accommodations from each of three accommodations types, and four studies (Tam; Spurlock; Witmer & Roschmann a, b) included accommodations from each of two accommodations types.
The findings of the studies on accommodations published in 2020 are summarized here according to their attributes. These findings were consistent with the stated purposes and focuses of the studies. The findings included sets of research about specific accommodations, such as text-to-speech software. Two studies examined impacts of aggregated sets of accommodations sometimes called “bundles” during assessments; an additional study (Shobe) explored educators’ perspectives on the implementation of a new computer-delivered assessment incorporating several unspecified accommodative features. We also present findings on the impact of other accommodations examined in only one study—such as virtual manipulatives or math operations charts (see Appendix F). This section includes findings on the perceptions of accommodations, including those from student test-takers and from educators. This section also includes descriptions of implementation conditions as well as patterns of use for various accommodations. Finally, included here are findings from more than one study pertaining to individual assessment item analysis. In Appendix F, we report findings from individual studies.
Of the research published in 2020, eight studies investigated the effects of accommodations on student assessment performance (see Appendix F for details about each study). In all, these studies comprised analyses of the effects of several accommodations including extended time (3 studies), electronic administration (3 studies), oral delivery (2 studies), and manipulatives (2 studies). This summary of findings on the impact of accommodations during assessments is organized by type of accommodation and includes some studies more than once when they reported on the separate effects of more than one accommodation. See Appendix F for findings on effects of accommodations addressed in only one study each.
Three studies (Aceti, 2020; Tam, 2020; Traficante, 2020) inspected the effects of extended time, one of the most frequently requested and used accommodations (Aceti, 2020), on the performance of K–12 students with and without disabilities. In a study of the performance of high school students with and without disabilities on a reading comprehension assessment, Aceti (2020) found that the preponderance of expected benefits of extended time were not demonstrated. Aceti looked for correlations between slower reading rate and use of extended time, and between slower cognitive processing speed and extended time, hypothesizing that extended time would result in an improvement in student performance on standardized reading measures. However, the only positive correlation identified was between slower cognitive processing speed and extended time on a vocabulary subtest, indicating that student participants with slower cognitive processing speeds might have benefited from extended time on vocabulary subtests. Extended time was also included by a study (Tam, 2020) on the individual effects of three accommodations on NAEP reading and math performance of students with disabilities in grades 4 and 8. Tam’s (2020) study showed that grade 4 students with disabilities who used extended time performed significantly better in both math and reading than those who did not use the accommodation. However, grade 8 students with disabilities did not score significantly differently whether using extended time or not. Tam’s findings indicated that extended time was more beneficial for elementary students as compared to middle and high school students. In a study (Traficante, 2020) of the effects of accommodations on the performance of students with disabilities in grades 6–12, the separate effects of several accommodations including extended time were reported. Traficante (2020) found that extended time was linked with lower math scores in grade 6 and lower science scores in grade 8.
Three studies (Goodwin et al., 2020; Hott & Brigham, 2020; Lam et al., 2020) examined the effects of accommodations available through electronic administration. Goodwin and colleagues (2020) investigated the effects of supportive tools embedded into electronic administration of reading assessments for students in grades 5–8 with no identified disabilities, finding specific results for the use of highlighting electronically and on paper. The researchers found that students used highlighting tools differently electronically and on paper, highlighting 2.5 times more frequently on paper than electronically. However, the quantity of paper highlights was negatively correlated to student performance. Instead, higher reading comprehension performance was linked to digital highlighting. In another study (Hott & Brigham, 2020), researchers examined the math performance of high school students with emotional and behavioral disorders using three response options: traditional paper and pencil and hand raising; physical response cards or whiteboards; and an electronic interactive response system often referred to as “clickers.” This quasi-experimental study found that math task performance scores, on-task behavior, and participation all increased significantly using the response card condition and the electronic response system condition in comparison to traditional hand-raising responding. Of the two non-traditional communication options, response cards (e.g., whiteboards) resulted in significantly better performance than did the digital response system. Lam and colleagues (2020) also compared student performance on assessments administered electronically and using a traditional paper-and-pencil mode; students who are Deaf or have hearing impairments were given curriculum-based measures (CBMs) on reading comprehension (maze) and on word recognition (Silent Reading Fluency/SRF). Results showed that student performance on the maze assessment did not vary based on the mode of administration. However, there was a statistically significant difference in student performance on the SRF assessment, with better student performance on the paper-and-pencil administration. These mixed results were deemed inconclusive.
Research published in 2020 on the effects of accommodations included two studies (Tam; Traficante) that provided findings for oral delivery provided through text-to-speech software. Tam (2020) found that students with disabilities in grades 4 and 8 who used text-to-speech oral delivery for the entire math assessment, not just delivery of test instructions, scored significantly higher than those who did not. Additionally, Tam found that students with disabilities in both grades 4 and 8 who used partial text-to-speech oral delivery—that is, oral delivery of test instructions and question items, but not of reading passages—scored significantly higher in reading than those who did not. The positive effects of using text-to-speech oral delivery were more pronounced on math performance for students with disabilities in both grades 4 and 8. When comparing effects by grade level, the benefits were more significant for grade 4 students in both math and reading as compared to grade 8 students. Though not the main focus in Traficante (2020), the analysis of a national sample of NAEP data revealed that oral delivery via text-to-speech software was not significantly predictive of higher assessment scores in math, reading, or science for students with disabilities in grades 6–12.
We identified separate reportable findings on the impact of 14 accommodations that were each addressed by just one study. Effects of these 14 accommodations were examined in six studies:
Findings for these accommodations are reported in Appendix F.
Six studies (Goodwin et al.; Hott & Brigham; Jimenez & Besaw; Lam et al.; Shobe; Spurlock) provided findings on perceptions about accommodations. Three studies (Jimenez & Besaw; Shobe; Spurlock) reported only on educators’ views, and one study (Goodwin et al.) described only students’ perceptions. Two studies (Hott & Brigham; Lam et al.) presented findings on perceptions of both students and educators.
In total, five studies (Hott & Brigham; Jimenez & Besaw; Lam et al.; Shobe; Spurlock) provided information on educators’ impressions of accommodations, with all five studies detailing positive perceptions. Hott and Brigham found that educators—including two special education teachers and two paraprofessionals—reported mostly positively oriented impressions and observations regarding the response tools. Further, educators noted that students seemed to enjoy giving digital responses most, yet the response cards were most effective from the educators’ perspectives (Hott & Brigham). Through an educator survey, Jimenez and Besaw learned that virtual manipulatives had been effective in addressing academic, attention, and sensory needs; further, the accommodation was deemed cost- and time-effective and easy to implement (Jimenez & Besaw). Lam and colleagues found that surveyed teachers indicated that using the curriculum-based measures (CBMs), including those with e-based accommodations, was feasible given typical time and resource constraints in their settings. Shobe concluded, from interviews with educators from three Oregon school districts, that the new assessment system developed with the Smarter Balanced Assessment Consortium (SBAC) was more accessible for students with disabilities than previous computer-delivered standardized assessments. These Oregon educators commented that the technology-embedded accommodations addressed the accessibility needs of students who had difficulties such as distractibility, test anxiety, and limited perseverance on academic tasks. In addition, teachers noted that the text-to-speech accommodation with the features of rate and volume adjustments addressed individual needs and preferences, and provided for independent use by test-takers, and the color contrast feature permitting adjustment of the screen’s background color offered specialized support for students with disabilities including students with dyslexia (Shobe). Spurlock reported that most math teachers expressed positive views of their inclusion classroom experiences, including team-teaching and providing accommodations, noting that their providing accommodations to students with disabilities led them to reflect on ways to support other students performing below grade level (Spurlock).
Four of the five studies with teacher perception findings identified some negative aspects of the relevant accommodations. One of the four educators from Hott and Brigham’s study indicated that the presence of the response tools on students’ desks became sources of distraction for students, especially in contrast to their absence during the traditional responding phase of the study. As a group, teacher participants (from Lam et al.) were only slightly supportive of employing CBMs, including those with e-based accommodations, with their students (Lam et al.). In Spurlock’s focus group, teachers expressed concern about students’ social-emotional well-being as demonstrated by their observations that students using accommodations received negative attention. Shobe’s educator interview data mentioned that the speech-to-text tool was not working properly, requiring staff support to submit student responses that were transcribed by the software; another educator noted that the predictive text feature was not particularly beneficial.
Students expressed positive opinions about accommodations in three studies (Goodwin et al.; Hott & Brigham; Lam et al.). Although many of their findings related to comparisons between different test conditions, Lam and colleagues noted that 89 percent or more of Deaf and hard-of-hearing students rated five of the six accommodative features in the electronic test format positively on helpfulness; in contrast, nearly half of student participants indicated that the on-screen timer was not helpful. In comparison to the accommodated conditions, a relatively small proportion of student participants indicated liking the traditional or unaccommodated conditions. The smallest proportion of student participants (24%) preferred reading text on paper, in comparison to reading in a digital format (37%); a plurality of students (39%) indicated that they had no preference between the digital and paper formats (Goodwin et al.). Students with emotional-behavioral disabilities spent a low degree of time on-task (about 50%) when completing test items with the typical paper format of test delivery and traditional item responding—perhaps demonstrating low enthusiasm; in comparison, students spent about 75 percent of time on-task when using the response accommodations, and many students indicated that the accommodations were fun (Hott & Brigham). Very few students with hearing impairments including deafness liked or preferred either the reading comprehension test or the word recognition test in the standard paper format, according to the rating survey (Lam et al.). In another comparison, most of the student participants with hearing impairments (62%) preferred the electronic test format for the maze curriculum-based measure (CBM) measuring reading comprehension, yet fewer (43%) preferred the e-based format for the silent reading fluency (SRF) measure. Many students expressed no preference (Lam et al.).
In two studies (Goodwin et al.; Hott & Brigham), students indicated preferences between different versions of an accommodation. Highlighting by students was observed to occur more than twice as much—that is, about 2.5 times as many words were highlighted—when reading on paper versus reading the digital test format (Goodwin et al.). Further, student preferences between the digital and paper formats were not substantially linked to the degree to which they used highlighting or other tools when testing in each format (Goodwin et al.). For communicating quiz answers, the response system using electronic signaling was strongly preferred over raising the low-tech response cards (Hott & Brigham). Students reported that they remained on-task more successfully with the electronic response system than with the response cards (Hott & Brigham).
In nearly all of the six studies—except for Shobe—perceptions formed only part of the study purposes, serving as a social validity check or contextual data source from either students or educators, along with the analyses of test performance effects for the accommodations examined. In contrast, Shobe primarily reported on perceptions in inquiring about educators’ experiences with technology-enhanced assessments with embedded accommodations.
Two studies (Traficante, 2020; Spurlock, 2020) had findings related to accommodations use and implementation issues, respectively. Traficante described patterns of accommodations use across a student population, while Spurlock provided information about educators’ accommodations implementation practices.
Traficante (2020) examined an extant data set from a suburban charter school in the southeastern United States (North Carolina), comparing student course grades and performance on state mandated assessments over time in relation to accommodations received, disability type, and the presence of mental health diagnoses according to DSM V (American Psychiatric Association, 2013). These correlations were explored in naturalistic school settings for special education students in grades 6–12 and across academic subjects and school contexts—general classroom, self-contained, or resource classrooms. The prevalence of several individual instructional and assessment accommodations was identified. Assessment accommodation use frequency included separate test setting, 90%; extended time, 80%; oral delivery (“read aloud”), 32%;, pencil and paper testing in a digital testing environment, 31%; breaks during testing, 15%; dictated response, 7%; and test checklists, 5%. Additional patterns of accommodation use by students in various disability categories and with various mental health conditions were reported.
In addition to findings in Spurlock (2020) on the effects of accommodations and teacher perceptions of accommodations, teachers provided information about effective implementation of accommodations and effective instruction for students with disabilities in the inclusive classroom, encompassing both student factors and system factors. Student factors included students’ distractibility, grasping the curriculum at the pace of their peers without disabilities, behavioral issues, individual needs, skill maintenance, and the impact of reading difficulties on math skills and progress. Teachers were also concerned about students’ social-emotional well-being as demonstrated by their observations that students using accommodations received negative attention. System factors emphasized a lack of training on effective inclusion and the misalignment between accommodations provided in the classroom and on classroom assessments and those allowed on state standardized tests.
Two studies conducted item analyses of existing state assessments. Witmer and Roschmann (2020a) examined measurement comparability of accommodated tests for students with autism, and Witmer and Roschmann (2020b) examined measurement comparability for students with emotional impairments. In both studies, the researchers employed differential item functioning (DIF) analyses to detect potential item bias for students taking the tests with accommodations compared to students taking the tests without accommodations. In both studies, the researchers completed multiple data analyses: (1) comparing focal students (students with autism or emotional impairments) taking accommodated tests to a non-accommodated reference group of students without disabilities, and (2) comparing focal students taking tests without accommodations to a non-accommodated reference group of students without disabilities. Both studies found only a small percentage of items showing DIF; there was no clear pattern of items favoring the focal or reference group. Information about the item analysis findings of Witmer and Roschmann (2020a, b) are provided in Appendix F.
The body of research into various aspects of assessment accommodations has continued to grow substantially in the U.S. elementary and secondary school system as well as at the postsecondary level and throughout the world in other nations’ educational systems. The NCEO accommodations research report series, since the report on studies from 2017 (Rogers et al., 2020), has provided snapshots of empirical accommodations research in the U.S. K–12 education setting published within single years. Even with the narrowed focus, this NCEO report series has demonstrated an apparently persistent pattern of locating about a dozen studies per year. The three previous reports (Rogers et al., 2020, 2021, 2022) collectively identified a total of 36 studies from across 2017, 2018, and 2019. The current report, fourth in the series, has continued to evidence this trend, with 11 studies examined from 2020. For additional details on academic test accommodations in those other contexts, see NCEO’s Accommodations for Students with Disabilities Bibliography: Database https://nceo.info/Resources/bibliographies/accommodations/bibliography.
The purpose pursued in the largest proportion (over 70%) of studies in 2020 was examining assessment performance scores for the potential impact of accommodations. Further, more than three quarters of all studies addressed more than one purpose in their research designs. Accommodations research studies from 2020—similar to studies from previous years examined in reports by NCEO—have continued most frequently to investigate accommodations provided during mathematics and reading assessments. Math received more research attention than reading in 2020, extending this trend from previous years. Less frequently, accommodations offered during science assessments were studied in 10 percent of studies in 2020, a similar proportion as noted on reports on research from 2018 and 2019. However, writing and other English language arts were not the academic content in any of the studies from 2020, which is atypical in comparison to study summaries for 2019 or 2018. A plurality of studies (30%) from 2020 drew test data from more than one content area.
Another observable trend in contextual variables pertains to educational level: at least half of the U.S. K–12 research compiled by NCEO from 2020—as well as from 2019, 2018, and 2017—included middle school students. In contrast to the contextual trends of content area and schooling level observed across more than one study year (addressed in the accommodations research report series), student participants’ disability categories were different for studies from 2020. Students with emotional-behavioral disabilities and students with autism together were participant populations for about half of the studies described. Other disability categories receiving attention in some studies were hearing impairments including deafness, intellectual disabilities, learning disabilities, physical or mobility disabilities, and visual impairments. Three studies reported data for the population of students with disabilities as a whole, without specifying disability categories for participants.
Researchers have continued to explore a number of considerations related to assessment accessibility features and accommodations. Researchers have incorporated various ways of investigating assessment accessibility, frequently designing complex data-gathering regimens in order to discover different kinds of knowledge, toward different research purposes and making different types of findings. For example, many studies from 2020 simultaneously calculated the effects of accommodations on assessment scores and asked student test-takers about their perceptions of accommodations, or sought the insight of teachers and other educators about accommodations implementation matters. Technology also has maintained an important role in expanding the possibilities of supportive mechanisms being made available to students in order to access, and potentially to perform to their ability on, accountability assessments, and to achieve academic success.
(References in the report to studies that were part of the 2020 accommodations research analysis are not included in this list. They are in the separate list titled 2020 K–12 Accommodation References.)
American Psychiatric Association. (2013). Diagnostic and statistical manual of mental disorders (5th ed.).
Chafouleas, S. M., Miller, F. G., Briesch, A. M., Neugebauer, S. R., & Riley-Tillman, T. C. (2012). Usage rating profile – assessment. University of Connecticut.
Cormier, D. C., Altman, J., Shyyan, V., & Thurlow, M. L. (2010). A summary of the research on the effects of test accommodations: 2007–2008 (Technical Report 56). National Center on Educational Outcomes.
EdCheckUp, L. L. C., & Children’s Educational Services. (2005). Computer software and database.
EdSurge. (2020). MasteryConnect overview. https://www.edsurge.com/product-reviews/masteryconnect
Fishco, V. V. (2019). Nelson-Denny reading test: Examiner’s manual, Forms I and J. PRO-ED, Inc.
Hammill, D. D., Wiederholt, J. L., & Allen, E. A. (2006). TOSCRF: Test of silent contextual reading fluency, examiner’s manual. PRO-ED, Inc.
Johnstone, C. J., Altman, J., Thurlow, M. L., & Thompson, S. J. (2006). A summary of the research on the effects of test accommodations: 2002 through 2004 (Technical Report 45). National Center on Educational Outcomes.
McGrew, K. S., LaForte, E. M., & Schrank, F. A. (2014). Technical manual. Woodcock Johnson IV. Riverside.
McAnally, P. L., & Rose, S. (2012). Reading milestones placement and monitoring: RMPM manual. PRO-ED, Inc.
Northwest Evaluation Association. (2015). NWEA FAQs. https://www.nwea.org/content/uploads/2015/12/2015-MAP- Norms-FAQ-NOV15.pdf
Northwest Evaluation Association. (2014). Measures of academic progress: An introduction to MAP computer adaptive interim assessment.
Rogers, C. M., Christian, E. M., & Thurlow, M. L. (2012). A summary of the research on the effects of test accommodations: 2009–2010 (Technical Report 65). National Center on Educational Outcomes.
Rogers, C. M., Lazarus, S. S., & Thurlow, M. L. (2014). A summary of the research on the effects of test accommodations, 2011–2012 (Synthesis Report 94). National Center on Educational Outcomes.
Rogers, C. M., Lazarus, S. S., & Thurlow, M. L. (2016). A summary of the research on the effects of test accommodations: 2013–2014 (NCEO Report 402). National Center on Educational Outcomes.
Rogers, C. M., Lazarus, S. S., & Thurlow, M. L. (2021). A summary of the research on the effects of K–12 test accommodations: 2018 (NCEO Report 423). National Center on Educational Outcomes.
Rogers, C. M., Lazarus, S. S., Thurlow, M. L., & Liu, K. K. (2020). A summary of the research on the effects of K–12 test accommodations: 2017 (NCEO Report 418). National Center on Educational Outcomes.
Rogers, C. M., Thurlow, M. L., Lazarus, S. S., & Liu, K. K. (2019). A summary of the research on the effects of test accommodations: 2015–2016 (NCEO Report 412). National Center on Educational Outcomes.
Rogers, C. M., Thurlow, M. L., Lazarus, S. S., Ressa, V. A., & Swadek, G. S. (2022). A summary of the research on the effects of K–12 test accommodations: 2019 (NCEO Report 433). National Center on Educational Outcomes.
Thompson, S., Blount, A., & Thurlow, M. (2002). A summary of the research on the effects of test accommodations: 1999 through 2001 (Technical Report 34). National Center on Educational Outcomes.
Woodcock, R. W., McGrew, K. S., & Mather, N. (2001). Woodcock-Johnson III. Riverside.
Zenisky, A. L., & Sireci, S. G. (2007). A summary of the research on the effects of test accommodations: 2005–2006 (Technical Report 47). National Center on Educational Outcomes.
Aceti, B. J. (2020). An investigation into the relationships between reading rate, processing speed, and extended time [Doctoral dissertation, Rutgers, The State University of New Jersey]. Rutgers University Community Repository (RUcore). https://doi.org/10.7282/t3-n09n-rx58
Goodwin, A. P., Cho, S. J., Reynolds, D., Brady, K., & Salas, J. (2020). Digital versus paper reading processes and links to comprehension for middle school students. American Educational Research Journal, 57(4), 1837–1867. https://doi.org/10.3102/0002831219890300
Hott, B. L., & Brigham, F. (2020). Effects of response options on the mathematics performance of secondary students with emotional or behavioral disorders. Exceptionality, 28(1), 1–15. https://doi.org/10.1080/09362835.2018.1480950
Jimenez, B. A., & Besaw, J. (2020). Building early numeracy through virtual manipulatives for students with intellectual disability and autism. Education and Training in Autism and Developmental Disabilities, 55(1), 28–44. http://www.daddcec.com/etadd.html
Lam, E. A., Rose, S., & McMaster, K. L. (2020). Technical characteristics of curriculum-based measurement with students who are deaf. Journal of Deaf Studies and Deaf Education, 25(3), 318–333. https://doi.org/10.1093/deafed/enaa003
Shobe, R. E. (2020). Striving for the ideal: Technology’s role in creating accessible tests for students with disabilities (Publication No. 28027579) [Doctoral dissertation, Pepperdine University]. ProQuest Dissertations and Theses Global.
Spurlock, C. D. (2020). The impact of class accommodations for inclusion students on common core aligned math assessments (Publication No. 28022417) [Doctoral dissertation, Trevecca Nazarene University]. ProQuest Dissertations and Theses Global.
Tam, I. (2020). The effect of the read-aloud and extended time accommodations on NAEP fourth and eighth grade reading and mathematics for students with disabilities (Publication No. 28024248) [Doctoral dissertation, St. John’s University]. ProQuest Dissertations and Theses Global.
Traficante, A. L. (2020). Predicting middle and high school students with disabilities’ change in grades and state test performance associated with their accommodations (Publication No. 27949942) [Doctoral dissertation, North Carolina State University]. ProQuest Dissertations and Theses Global.
Witmer, S. E., & Roschmann, S. (2020a). An examination of measurement comparability for a school accountability test among accommodated and non-accommodated students with autism. Education and Training in Autism and Developmental Disabilities, 55(2), 173–184. http://www.daddcec.com/etadd.html
Witmer, S. E., & Roschmann, S. (2020b). Exploring measurement comparability of accommodated math tests for students with emotional impairments. Measurement and Evaluation in Counseling and Development, 53(4), 249–263. https://doi.org/10.1080/07481756.2020.1735205
| Authors | Publication Type | Research Type | Research Design | Data Collection Source | Collection Instrument |
|---|---|---|---|---|---|
| Aceti | Dissertation | Quantitative | Quasi-experimental | Primary | Test |
| Goodwin et al. | Journal Article | Quantitative | Descriptive Quantitative | Primary | Observations, Survey, Test |
| Hott & Brigham | Journal Article | Quantitative | Quasi-experimental | Primary | Observations, Survey, Test |
| Jimenez & Besaw | Journal Article | Quantitative | Experimental | Primary | Test, Survey |
| Lam et al. | Journal Article | Mixed | Correlation/Prediction | Primary | Observations, Survey, Test |
| Shobe | Dissertation | Qualitative | Descriptive Qualitative | Primary | Interview Protocol |
| Spurlock | Dissertation | Mixed | Quasi-experimental | Primary | Focus Group Protocol, Test |
| Tam | Dissertation | Quantitative | Descriptive Quantitative | Secondary | Test |
| Traficante | Dissertation | Quantitative | Longitudinal | Primary | Course Grades, Test |
| Witmer & Roschmann (a) | Journal Article | Quantitative | Descriptive Quantitative | Secondary | Test |
| Witmer & Roschmann (b) | Journal Article | Quantitative | Descriptive Quantitative | Secondary | Test |
| Authors | Stated Research Purpose | Effects (SwD) |
Effects (non) |
Effects (both) |
Implementation/ Use |
Perceptions | Test Items | Issues | Research |
|---|---|---|---|---|---|---|---|---|---|
| Aceti | Investigate the effects of extended time for stu-dents with disabilities compared to students with-out disabilities. Summarize research on extended time in relation to cognitive processing speed and reading rate. | P | X | ||||||
| Goodwin et al. | Investigate the effects of digital and paper as-sessment administration on reading behaviors (highlighting and annotating) and reading com-prehension. Inquire about how reader prefer-ences related to reading behaviors (highlighting and annotating). Discuss issues of prior content knowledge, grade level, and demographics. | P | X | X | |||||
| Hott & Brigham | Investigate the effects of response tools (tradi-tional responding, response cards, and electronic response systems) on mathematics perfor-mance, on-task behavior, and response rates for students with emotional-behavioral disabilities (EBD). | P | X | ||||||
| Jimenez & Besaw | Investigate the effects of a multi-component set of accommodations (story-based virtual manipu-latives, graphic organizers, and systematic in-struction) on numeracy skills for students with severe intellectual disabilities, including autism. Inquire about educators’ perspectives on effec-tiveness and application of virtual manipulatives. | P | X | ||||||
| Lam et al. | Investigate the effects of electronic versus pa-per-pencil administration on two curriculum-based measures (CBMs) in reading—maze and silent reading fluency (SRF)—for students who are Deaf or have a hearing impairment. Inquire about students’ perceptions of accessibility fea-tures provided electronically. Discuss issues in-cluding test-retest reliability of CBMs for students who have hearing impairments (including deaf-ness), and criterion alignment between SRF and reading achievement tests. | P | X | X | |||||
| Shobe | Inquire about the experiences of educators who support students with disabilities when taking large-scale summative assessments as well as educators' perceptions of test accessibility for students with disabilities. Summarize research on the use of large-scale standardized assessments for accountability, the barriers faced by students with disabilities, and the use of technology to support test accessibility. | P | X | ||||||
| Spurlock | Investigate the effects on the performance of inclusion students on Common Core mathemat-ics instruction and assessments when employing given accommodations (key words and multipli-cation charts). Inquire about the perspectives of mathematics educators regarding effectively in-cluding and accommodating students with disabil-ities in Common Core mathematics instruction and assessment. Report on the implementation of accommodations during math instruction and assessment. Summarize research on the effec-tiveness of accommodations to improve accessi-bility of assessments for students with disabili-ties. | P | X | X | X | ||||
| Tam | Investigate the effects on, and potential to boost, the performance of students with disabilities on NAEP reading and mathematics assessments when receiving/not receiving read-aloud and ex-tended time testing accommodations. Summa-rize research on the implementation of read-aloud and extended time accommodations during reading and math assessments. | P | X | ||||||
| Traficante | Investigate the effects of students' disability cat-egories, mental health diagnoses and accommo-dations on course grades and achievement test performance over time, with the grades and per-formance of their peers without disabilities. Re-port on accommodations use patterns for stu-dents with disabilities in general, and with specific disabilities and mental health conditions, during instruction and state assessments. Summarize research on the use of accommodations to im-prove outcomes for students with disabilities. | P | X | X | |||||
| Witmer & Roschmann (a) | Analyze extant item-level score data for differen-tial item functioning (DIF), using more than one model of analysis, related to disability character-istics. Investigate the effects on performance for accommodated and non-accommodated stu-dents with autism and students without disabili-ties. | . | P | ||||||
| Witmer & Roschmann (b) | Analyze extant item-level score data for differen-tial item functioning (DIF), using more than one model of analysis, related to disability character-istics. Investigate the effects on performance for accommodated and non-accommodated stu-dents with emotional disability characteristics and students without disabilities. | P |
KEY for Appendix B
| Effects [SwD] | Compare effects of accommodations on assessment scores [only students with disabilities] |
| Effects [non] | Compare effects of accommodations on assessment scores [only students without disabilities] |
| Effects [both] | Compare effects of accommodations on assessment scores [both students with and without disabilities] |
| Implementation/Use | Report on implementation practices and accommodations use |
| Perceptions | Study/compare perceptions and preferences about use |
| Test Items | Compare test items across assessment formats |
| Issues | Discuss issues related to test accommodations |
| Research | Summarize research on test accommodations |
| P | Primary Purpose |
| X | Other Purpose |
Table C-1. Instrument Types and Specific Instruments Used, and Their Sources
| Authors | Instrument Types and Description/s | Number of Types |
|---|---|---|
| Aceti | Norm-ref Ach: The Nelson-Denny Reading Test (NDRT; Fishco, 2019) was used to measure vocabulary (language development) and comprehension, as well as reading rate. The parallel forms, Forms I and J, were each administered to all participants, to gather performance scores with standard time and extended time conditions. The NDRT provides norms for standard and extended time scores. Norm-ref Ability: The Woodcock-Johnson Tests of Cognitive Abilities, 4th Edition (WJ-IV COG; McGrew et al., 2014), Cognitive Processing Speed Cluster included the Letter Pattern Matching test and the Pair Cancellation test. |
2 |
| Goodwin et al. | Author (observations): Participants’ testing behaviors were observed and videos were captured, and their uses of paper and digital highlighting, annotations, and dictionaries were recorded. Author (survey): Survey on student participants’ preferences regarding reading information in digital formats, paper formats, or both; completed at the beginning of the study. Researcher (test): Pre-test, 10 items, of previous content knowledge (on women’s suffrage). Using a reading passage and reading comprehension questions from the National Assessment of Educational Progress (NAEP), the study authors, who were content specialists, also designed additional test items seeking multiple-choice, true/false, and open responses. |
2 |
| Hott & Brigham | Author (observations): Observations of student behavior were gathered using a momentary time sampling procedure, providing time on-task calculations. Author (survey): Educator and student satisfaction data, for social validity, were collected after the last quiz was administered. Researcher (test): In collaboration with a special education teacher, mathematics teachers, and the authors, unit quizzes on content standards were developed. Student participation was calculated from the number of question responses and the number of correct responses by students. |
2 |
| Jimenez & Besaw | Author (observations and survey): Engagement was observed and measured based on whether the student displayed a threshold number of off-task behaviors within test sessions. Teacher reported rating scale on value, impact, and likelihood of implementing accommodation, yielding social validity data. Researcher (test): Early numeracy skills were documented based on the accuracy of student participant responses in individual sessions for five questions each of a series of test-like tasks—set making, non-standard measurement, and patterning—for baseline, intervention, and generalization phases. |
2 |
| Lam et al. | Author (observations and survey): Study authors’ informal observations of students during the test sessions were documented. Surveys for teachers and students (created by the study authors) using rating scale questions were collected on participants’ study experiences of the feasibility and utility of the curriculum-based measures and students’ preferences between test versions and perceptions about the degree of helpfulness of accommodations during the electronic version of the test. Researcher (survey and test): Teacher survey items included the Usage Rating Profile-Assessment (URP-A; Chafouleas, Miller, Briesch, Neugehauer, & Riley-Tillman, 2012) which consists of 28 items divided into “factors” called: accessibility, understanding, home-school collaboration, feasibility, system climate, and system support. The curriculum-based measures were constructed with maze reading passages adapted by the study authors from an online source (Edcheckup LLC & Children’s Educational Services, 2005). The silent reading fluency tasks were constructed with reading passages from two sources: Test of Silent Contextual Reading Fluency: 2nd Edition (TOSCRF-2; Hammill, Wiederfholt, & Allen, 2006) and the Reading Milestones Placement and Monitoring assessment (RMPM, McAnally & Rose, 2012). Crit-ref Ach: Spring 2015 reading scores on the Measures of Academic Progress (MAP e-based adaptive assessment; Northwest Evaluation Association, 2014), and Woodcock-Johnson, 3rd edition, Passage Comprehension subtest (WJ-III; Woodcock, McGrew, & Mather, 2001) |
3 |
| Shobe | Author (interview protocol): Semi-structured series of interview questions, including demographic and work experience items, and knowledge and perceptions about accommodations. | 1 |
| Spurlock | Author (focus group protocol): Series of open-ended group discussion questions, seeking the perspectives of the teachers (who taught the student participants) including teachers’ reflections on student use of accommodations during state math assessments and in their math classrooms. Crit-ref Ach: Student participants’ mathematics scores, Fall pre-test and Winter post-test Common Assessment (CA; Mastery Connect, 2020), given during the 2019–2020 school year. (Aligned with the TNReady math assessment, Tennessee.) |
2 |
| Tam | Crit-ref Ach: Extant score data from a national sample of the 2013 administration of the National Assessment of Educational Progress (NAEP) at grade 4 and grade 8 in mathematics and reading. | 1 |
| Traficante | State Test: Extant score data from the 2017–2018 administration of North Carolina’s end-of-grade (EOG) assessments in grades 6, 7, 8, 9, 10, and 11 in mathematics, reading, and science (from one school district). Other (Grades): Academic report card grades in mathematics, reading, and science for student participants in grades 6, 7, 8, 9, 10, and 11. |
2 |
| Witmer & Roschmann (a) | State Test: Extant score data from the 2012 administration of Michigan’s grades 4 and 7 mathematics test. | 1 |
| Witmer & Roschmann (b) | State Test: Extant score data from the 2012 administration of Michigan’s grades 4 and 5 mathematics test. | 1 |
KEY for Table C-1
| Instrument Types | Type Abbreviations | Number of Studies |
|---|---|---|
| Non-Academic Protocols or Surveys Developed by Study Author/s | Author Survey/Interview/Protocol | 6 |
| Surveys or Academic Tests Developed by Professionals or Researchers through Work Outside of Current Study | Researcher Test | 4 |
| Criterion-referenced Academic Achievement Measures | Crit-ref Ach | 4 |
| State Criterion-referenced Assessment | State Test | 3 |
| Norm-referenced Academic Achievement Measures | Norm-ref Ach | 1 |
| Norm-referenced Cognitive Ability Measures | Norm-ref Ability | 1 |
| Other | Other | 1 |
Table C-2. Content Areas Assessed
| Authors | Math | Reading | Writing | Other LA | Science | Social Studies | Cognitive Skills | N |
|---|---|---|---|---|---|---|---|---|
| Aceti | • | • | 2 | |||||
| Goodwin et al. | • | 1 | ||||||
| Hott & Brigham | • | 1 | ||||||
| Jimenez & Besaw | • | 1 | ||||||
| Lam et al. | • | 1 | ||||||
| Spurlock | • | 1 | ||||||
| Tam | • | • | 2 | |||||
| Traficante | • | • | • | 3 | ||||
| Witmer & Roschmann (a) | • | 1 | ||||||
| Witmer & Roschmann (b) | • | 1 | ||||||
| TOTAL | 7 | 5 | 0 | 0 | 1 | 0 | 1 |
| Authors | Unit of Analysis |
Sample Sizea |
Percent of Student Sample with Disabilities |
Grade or Education Level |
Disability Categories Included in Sample |
|---|---|---|---|---|---|
| Aceti | Students | 21 | 33% | Grades 9, 10, 11, 12 | Not specified; None |
| Goodwin et al. | Students | 371 | 0% | Grades 5, 6, 7, 8 | None |
| Hott & Brigham | Students; Educators | 33 | 100% | Grades 8, 9, 10, 11 | EBD |
| Jimenez & Besaw | Students; Educator | 2; 1 | 100% | Early Elementary | A, ID; N/A |
| Lam et al. | Students; Educators | 40; 21 | 100% | Grades 2–12 | HI; N/A |
| Shobe | Educators | 3 | N/A | Not specifiedc | N/A |
| Spurlock | Students, Educators | 162; 11 | N/Sb | Grades 3, 4, 5 | Not specified; None; N/A |
| Tam | Students | 193,692 | 100% | Grades 4, 8 | Not specified |
| Traficante | Students | 320 | 33% | Grades 6–12 | AP, A, EBD, ID, LD, PD, VI; None |
| Witmer & Roschmann (a) | Students | 3,160 | 37% | Grades 4, 7 | A; None |
| Witmer & Roschmann (b) | Students | 3,239 | 38% | Grades 4, 5 | EBD; None |
a Sample sizes of students and educators were reported separately.
b N/S: Spurlock did not specify the numbers of students with and without disabilities, and did not use comparison groups of student with and without disabilities; instead, it compared performance of student participants provided and not provided accommodation at the classroom level.
c Not specified: Shobe did not report the grade or school levels at which educators worked.
KEY for Appendix D
A=Autism
AP=Attention Problem
EBD=Emotional/Behavioral Disability
HI=Hearing Impairment/Deafness
ID=Intellectual Disability
LD=Learning Disability
PD=Physical Disability
S/L=Speech/Language Impairment
TBI=Traumatic Brain Injury
VI=Visual Impairment/Blindness
None=Students without Disabilities
Not Specified=Students with Disabilities, No Categories Reported
N/A=No Student Participants
Table E-1. All Accommodations by Study
| Author/s | Accommodation/s |
|---|---|
| Aceti | Extended time |
| Goodwin et al. | Aggregated set: Electronic administration, with Dictionary and Highlighting by student |
| Hott & Brigham | Response cards (including whiteboards); Electronic response systems (including “clicker”) |
| Jimenez & Besaw | Virtual manipulatives |
| Lam et al. | Aggregated set: Electronic administration, with a set of six accommodative features: visually demonstrated directions, text movement during response, response feedback, student removal of response options, progress bar, and time countdown clock |
| Shobe | Aggregated set: Electronic administration; Technological aid |
| Spurlock | Keyword lists (similar to dictionary); Multiplication charts (Calculation charts) |
| Tam | Extended time; Text-to-speech device/software |
| Traficante | Breaks during testing; Clarify directions; Cueing; Dictated response (scribe); Extended time; Mark answer in test booklet; Reinforcement; Specialized setting; Technological aid; Text-to-speech device/software; Word processing (for writing), copies of teacher notes, modified tests, paper and pencil testing, graphic organizer, word bank, teacher rubrics, test checklist |
| Witmer & Roschmann (a) | Multiple day; Oral delivery, live/in-person; Oral delivery, recorded human voice; Text-to-speech device/software |
| Witmer & Roschmann (b) | Multiple day; Oral delivery, live/in-person; Text-to-speech device/ software |
Table E-2. Presentation Accommodations Itemized by Study
| Author/s | Text-to-speech device/software | Electronic administration | Oral delivery, live/ in-person | Clarify directions | Cueing | Highlighting by student | Oral delivery, recorded human voice | Reinforcement | N |
|---|---|---|---|---|---|---|---|---|---|
| Goodwin et al. | • | • | 1 | ||||||
| Lam et al. | • | • | 2 | ||||||
| Shobe | • | 1 | |||||||
| Tam | • | 1 | |||||||
| Traficante | • | • | • | • | 4 | ||||
| Witmer & Roschmann (a) | • | • | • | 3 | |||||
| Witmer & Roschmann (b) | • | • | 2 | ||||||
| TOTAL studies (of 7) | 4 | 3 | 2 | 1 | 1 | 1 | 1 | 1 |
Table E-3. Equipment Accommodations Itemized by Study
| Author/s | Electronic administration |
Dictionary | Technological aid |
Manipulatives (virtual) |
N |
|---|---|---|---|---|---|
| Goodwin et al. | • | • | 2 | ||
| Jimenez & Besaw | • | 1 | |||
| Lam et al. | • | 1 | |||
| Shobe | • | • | 2 | ||
| Spurlock | •a | 1 | |||
| Traficante | •b | • | 2 | ||
| TOTAL studies (of 6) | 3 | 3 | 2 | 1 |
a Keyword List
b Word Bank
Table E-4. Response Accommodations Itemized by Study
| Author/s | Electronic administration |
Calculation chart (static) |
Communication system |
Dictated response |
Mark answer in test booklet |
Word processing (for writing) |
N |
|---|---|---|---|---|---|---|---|
| Goodwin et al. | • | 1 | |||||
| Hott & Brigham | •a | 1 | |||||
| Lam et al. | • | 1 | |||||
| Shobe | • | 1 | |||||
| Spurlock | • | 1 | |||||
| Traficante | • | • | • | 3 | |||
| TOTAL studies (of 6) | 3 | 1 | 1 | 1 | 1 | 1 |
a Response cards and response system.
Table E-5. Scheduling Accommodations Itemized by Study
| Author/s | Extended time | Multiple day | Breaks during testing | N |
|---|---|---|---|---|
| Aceti | • | 1 | ||
| Tam | • | 1 | ||
| Traficante | • | • | 2 | |
| Witmer & Roschmann (a) | • | 1 | ||
| Witmer & Roschmann (b) | • | 1 | ||
| TOTAL studies (of 5) | 3 | 2 | 1 |
Table E-6. Setting Accommodations Itemized by Study
| Author/s | Separate setting | N |
|---|---|---|
| Traficante | • | 1 |
| TOTAL studies (of 1) | 1 |
| Authors | Findings Statement | Effects | Perceptions | Implement/Use | Test Items |
Content |
|---|---|---|---|---|---|---|
| Aceti | The expected benefits from extended time for students with difficulties with reading rate and cognitive processing speed were not demonstrated. The reading comprehension performance of high school students with and without disabilities was not associated with using extended time, and no relationship was shown between cognitive processing speed and reading rate. However, there seemed to be links between reading rate and recognizing words during testing. Further, the researcher indicated that extended time differentially benefited students with slower processing speeds on vocabulary testing. | X | R, Cog | |||
| Goodwin et al. | Student participants in grades 5–8 with no identified disabilities tended to use highlighting differently between paper and digital reading formats, and the relative benefits of highlighting for comprehension performance were different. Specifically, participants highlighted almost 2.5 times more frequently on paper than when using a digital highlighting tool; however, the higher quantity of paper highlights was negatively correlated to student performance. When considering students’ preferences between reading paper or digital formats, or both, there were no links of preferred formats and frequency of using paper or digital highlighting. Higher reading comprehension performance was linked to digital highlighting, but no relationship was shown between comprehension and use of these tools: paper highlighting, digital highlighting, and online dictionary. The researchers suggested that highlighting can support active engagement with the text and constructive processing of the content. | X | X | R | ||
| Holt & Brigham | Math task performance scores, on-task behavior, and participation of students with emotional-behavioral disabilities increased significantly using the response card condition and the response system condition in comparison to traditional paper-and-pencil responding. Of the two communication options, response cards resulted in significantly better performance than did the digital response system. Nearly all students indicated positive experiences when using response cards and the response system, and students preferred using the response system over the response cards, reporting that they stayed on-task more successfully with the response system. Educators reported mixed feelings about the response tools: statements included that students seemed to enjoy giving digital responses most, yet the response cards were most effective; another indicated that the response tools were distracting in comparison to traditional responding. | X | X | M | ||
| Jimenez & Besaw | Participating students’ performance data demonstrated a prompt response and increasing trend upon implementation of virtual manipulatives for the early math skills of set making, non-standard measurement, and patterns. Students also increased in engagement toward task completion when using virtual manipulatives. Students were able to generalize math skills across other math contexts. The educator survey yielded that virtual manipulatives have been effective in addressing academic, attention, and sensory needs; further, the accommodation was deemed cost- and time-effective and easy to implement. | X | X | M | ||
| Lam et al. | Performance of students with hearing impairments, including deafness, was not significantly different on the “maze” curriculum-based measure (CBM) for reading comprehension between the paper-pencil and electronic administration conditions. Student participants scored higher on paper-pencil than on electronic form of the silent reading fluency (SRF) measure of word recognition. Student survey results indicated that most students (62%) preferred the e-based test format for CBM, and that fewer (43%) preferred electronic format for SRF; many students expressed no preference, and very few preferred the paper-pencil format. Five of the six accommodation features were rated positively by 89% or more of the students. Teacher survey results indicated that using was feasible given typical time and resource constraints in their settings. Teachers expressed lukewarm feelings about employing CBMs with their students. Researchers noted several issues with electronic formats and asserted the need for students to be well practiced with electronically based assessments to derive performance benefits. Issues discussed included the relatively stable test-retest reliability of CBMs and potential for distinctions between CBMs and standardized large-scale assessments, indicating potential for criterion-based validity implications. | X | X | R | ||
| Shobe | Analysis of interviews with educators yielded themes describing accommodations designed into Oregon’s computer-delivered state assessments on English language arts and mathematics. Educators in three districts characterized the new set of assessments as an improvement over previous computer-delivered standardized assessments in the degree to which they were accessible to students with disabilities. They identified strengths and concerns about specific accommodations. Text-to-speech and color contrast were perceived positively, while some concerns were expressed about speech-to-text and its predictive text feature. Educators indicated that the test’s accommodations did not seem simple and intuitive but rather required students to have developed skills with technology; of concern was that these technology tools might not be in elementary students’ test-taking experience. | X | N/A | |||
| Spurlock | Inclusive team-taught math classes with similar Fall test performance scores were paired, and classrooms were assigned to either receive or not receive the accommodations of keyword lists and multiplication charts during instruction, and multiplication charts during classroom math assessments. Students in classrooms receiving these accommodations showed significantly higher mean performance (by about 20%) on the Spring achievement test than students in classrooms not receiving accommodations. Analyses of focus group data, including teachers’ reflections, yielded that most teachers expressed positive views of team-teaching and providing accommodations. Teachers reported that providing accommodations also helped them think about how to support other populations performing below grade level. Teachers’ concerns about effective implementation of accommodations (and effective instruction for students with disabilities in the inclusive classroom) pertained to both student factors (e.g., student distractibility, behavioral issues) and system factors (e.g., lack of training on effective inclusion). Teachers were also concerned about negative attention towards students using accommodations. | X | X | X | M | |
| Tam | This set of analyses of a very large extant national dataset of math and reading scores from students with a range of disabilities yielded broad patterns regarding the correlational links to accommodation use, of extended time and oral delivery via text-to-speech computer-simulated voice, in matched-sample comparisons to students with disabilities not using each accommodation. As a group, grade 4 students with disabilities who used extended time performed significantly better in both math and reading than those who did not use the accommodation. Grade 8 students with disabilities did not score significantly differently whether using extended time or not. Students with disabilities in both grades 4 and 8 who used text-to-speech oral delivery scored significantly higher in math than those who did not. Students with disabilities in both grades 4 and 8 who used partial text-to-speech oral delivery—that is, oral delivery of test instructions and question items, but not of reading passages—scored significantly higher in reading than those who did not. Further, the relative benefit of using text-to-speech was more pronounced for the mean math assessment scores at both grade levels, and was more pronounced for grade 4 students in both math and reading than for grade 8 students as a group. | X | M, R | |||
| Traficante | For students with various disabilities who received accommodations, although they tended to achieve lower than average initial math and reading course grades, their grades increased to higher than average over time. However, students with disabilities—including students with mental health impairments—who received accommodations tended to persist in significantly lower than average math and reading scores on state assessments. Further analysis of potential effects of specific accommodations during state assessments yielded that extended time was linked with lower math scores in grade 6, and with lower science scores in grade 8, and that oral delivery was not significantly predictive of higher assessment scores in math, reading, or science. For the school population of special education students in grades 6–12, the prevalence of several individual instructional and assessment accommodations were reported; assessment accommodations included separate test setting (90%), extended time (80%), read aloud (32%), pencil and paper testing in a digital testing environment (31%), breaks during testing (15%), dictated response (7%), and test checklists (5%). Further information on assignment of individual accommodations for the students with various mental health diagnoses and disability categories was also reported. | X | X | M, R, S | ||
| Witmer & Roschmann (a) | Differential Item Functioning (DIF) analysis results indicated no systematic performance differences on math test content or item features for any group of students, whether students with or without disabilities, in either grade 4 or grade 7. Put another way, despite some items (5–8%) functioning differently to a small degree on average for some student groups, any overall performance effects were not substantial. The math test, with few and small exceptions, primarily measured the same academic content at the same difficulty level for students with autism and students without disabilities. Item-level comparisons for students with autism receiving or not receiving accommodations found that slightly more test items had small yet significant differences in item functioning for non-accommodated students with autism in comparison to fewer test items functioning differently for students with autism who used accommodations. The implications are that the accommodations did not problematically affect the academic content being assessed in a systematic manner for accommodated and non-accommodated students with autism. | X | M | |||
| Witmer & Roschmann (b) | Differential Item Functioning (DIF) analysis results showed no systematic differences based on math test content or item features for any group of students, whether students with or without disabilities, in either grade 4 or grade 5. To be clear, a small number of test items were shown to uniformly function differentially for students by group, yet the overall effects were weak. The implications are that the math test, with some exceptions, generally measured the same academic content at the same difficulty level for students with emotional impairments and students without disabilities. Item-level comparisons for students with emotional impairments receiving or not receiving accommodations found no systematic differences in item functioning, indicating that the accommodations did not negatively affect (i.e., interfere with) measuring academic content. The researchers noted the limited information about the specific assessment accommodations provided, and commented that accommodations specifically identified to address the needs of students with emotional impairments ought to be examined for their potential to decrease accessibility barriers during standardized assessments. | X | M | |||
| TOTAL | 8 | 6 | 2 | 2 |
KEY for Appendix F
| Effects | Investigate effects of accommodations on assessment scores |
|---|---|
| Implement/Use | Report on implementation practices and accommodations use |
| Perceptions | Inquire about perceptions and preferences about use |
| Test Items | Compare test items across assessment formats |
| Content | Academic content area |
| M | Mathematics |
| R | Reading |
| S | Science |
| Cog | Norm-referenced cognitive skills assessment (i.e., IQ test) |