Overview
The Individuals with Disabilities Education Act (IDEA) of 2004 requires all states receiving funding to report assessment data for students with disabilities. The Elementary and Secondary Education Act (ESEA) further requires states to report assessment data on reading, mathematics, and science to the federal government for all students and student subgroups. The ESEA also requires that states report these data to the general public, and typically states have used state report cards, state assessment reports, or customized data reports generated on state education websites to fulfill this requirement (Albus et al., 2014).
The National Center on Educational Outcomes conducts these annual reports primarily to see whether states are reporting assessment data for students with disabilities “to the public with the same frequency and in the same detail as it reports on the assessment of nondisabled children,” as required by IDEA (Wiley et al., 2005). We include other topics in our annual reporting both for historical continuity and to address new areas of importance in public reporting. For example, in addition to our initial focus to summarize the extent of reporting of data for students with disabilities, we added summaries on students with disabilities who were also English learners. We also continue to summarize differences in performance between students with Individualized Education Programs (IEPs) and their peers, and to describe longitudinal biannual average gaps for reading and math. Additionally, we describe the public reporting of students with disabilities who use accommodations. Finally, we have expanded the data we summarize for English learners with disabilities by also summarizing the extent to which states publicly report participation and performance data on general and alternate versions of English language proficiency (ELP) assessments. We note that these summaries only include assessment data for these assessments rather than information about how states may report these results in combination with other indicators, growth indices, or state formulas used for Title III.
With this report for the 2018–19 school year, we have reached the 22nd year that the National Center on Educational Outcomes (NCEO) has analyzed states’ public reporting of assessment data for students with disabilities. Over these years, we have seen fluctuations in the number of regular and unique states (N=61) reporting state-level disaggregated data for students with disabilities. For example, in the last two years, from 2016–17 to 2017–18, there has been a small drop in the number of states reporting participation and performance for students with disabilities, dropping from 33 to 30 states (Albus et al., 2020). The highest number reporting these data was 53 states back in 2010–11 (Albus & Thurlow, 2013). To compare across more years, from 2002–03 to 2006–07, there had been between 35 and 39 states reporting these data (Albus et al., 2009; Klein et al., 2006; Thurlow et al., 2008; Thurlow & Wiley, 2004; Thurlow et al., 2003; Wiley et al., 2005; VanGetson & Thurlow, 2007). There have been similar variations for the number of states publicly reporting alternate assessment data, with a high of 52 states in 2012–13 (Albus et al., 2015) and a low of 36 states in 2006–07 and 2007–08 (Albus et al., 2009; Thurlow et al., 2008).
Method
From January to February of 2020, staff searched for 2018–19 school year assessment reports on state department of education websites. We include the 50 “regular” states and the 11 “unique” states in our search. The 11 unique states are American Samoa, Bureau of Indian Education, Commonwealth of Northern Mariana Islands, District of Columbia, Federated States of Micronesia, Guam, Palau, Puerto Rico, Republic of the Marshall Islands, U.S. Department of Defense Education Activities, and the U.S. Virgin Islands.
Types of Reports Collected
The participation and performance data were found in various types of reports, including state assessment reports, state report cards, customized report generators, and other report formats. Reports submitted for federal accountability purposes (e.g., Annual Performance Report [APR]), are not included in this analysis, as our focus is on reporting for the general public.
Types of Assessment Data Collected
Staff collected information on the participation and performance of students with and without disabilities, and of English learners with disabilities for all state administered assessments. Specifically, we collected participation and performance data for all general and alternate assessments in reading/ELA, math, and science for these student groups, including assessments used for Title I accountability and those that were not. States differ in the assessments they give, with some states only giving assessments that meet Title I requirements and others giving assessments for other purposes, such as for a state’s own accountability or for graduation. Further, some states may have dual-purpose assessments. In addition to collecting the assessment data, we also track the states’ purposes for the different assessments and summarize the variety of ways in which states report these data. Definitions of the different types of state assessments are given below:
General assessment: Any assessment intended for students without disabilities and most students with disabilities that is designed to measure content area performance for Title I accountability or for exit or diploma purposes. General assessments may include end-of-course assessments for states that have them.
Alternate assessments based on alternate academic achievement standards (AA-AAAS): Any assessment intended for a very small percentage of students with disabilities who have the most significant cognitive disabilities. It is used to measure content area performance for Title I accountability or for exit or diploma purposes. AA-AAAS may include end-of-course assessments for states that have them.
ELP assessment: This assessment measures English language proficiency. It is administered to students who are identified as English learners.
Alternate ELP assessment: This ELP assessment is intended for a very small percentage of English learners with disabilities who have the most significant cognitive disabilities. It is used to measure English language proficiency.
One state reported data for an alternate based on grade-level achievement standards. We provide only basic information on how it reported those data.
Other Data Collected
We also searched for English language proficiency (ELP) assessment data and information on accommodated students. For ELP assessment data, we only include those reports that provide participation or performance information on the assessment (e.g., number assessed, percent proficient, etc.). We did not count the use of these data when they were only a contributing factor in other indicators or state formulas as used for Title III.
Verifying Data Collected
Using the collected data, staff prepared summary tables for each state. These tables were sent to state directors of assessment and special education for verification in July 2020, with an extension for some states that needed more time. Twenty-eight regular states and no unique states responded to the verification request. After the verification was completed, any additional information on whether and how states reported assessment participation and performance that met our criteria (e.g., for the general audience rather than for the APR report) was included in their state summary. See Appendix A for a sample of the email sent to states requesting verification and a sample of state summary tables used in the verification process.
Over time, changes to policies for reporting data to the U.S. Department of Education, as well as adjustments in our own criteria, which narrowed after 2004–05, likely have affected the numbers of states counted as reporting on the general assessment and AA-AAAS across years. Since 2004–05, posted APR data required by the Office of Special Education Programs (OSEP) were not counted as publicly reported data in our reports on public reporting because these data were not necessarily reported with the same frequency and detail as public reporting for all students (see Thurlow et al., 2008).
Results
The results for this report are organized in six sections. The first section describes the extent of state reporting of participation and performance data for students with disabilities and English learners with disabilities in general and alternate content assessments in reading/ELA, math, and science. In this section, we summarize state reporting of general assessments used for Title I accountability purposes as well as state assessments not used for Title I. The second section describes state approaches for reporting participation on general assessments. The third section describes state approaches for reporting performance on general assessments. The fourth section presents performance data for students with disabilities, along with their peers, on general assessments at the elementary, middle, and high school levels for reading/ELA and math. It includes average achievement gaps for 2018–19 and biannually from 2014–15. The fifth section summarizes states’ public reporting of accommodated participation and performance data for students with disabilities, and the final section describes states’ public reporting of data for English learners with disabilities on general ELP assessments and alternate ELP assessments for English learners with the most significant cognitive disabilities.
How States Reported Participation and Performance Data
General Assessment Data for Students with Disabilities
In Figure 1, 66 percent (N=40) of the 61 regular and unique states reported participation and performance for students with disabilities for all general state reading/ELA, math, and science assessments used for Title I. Eighteen percent (N=11) reported participation and performance for some of these general assessments, and 3 percent (N=2) reported performance only. Thirteen percent (N=8) had no publicly reported data. For details, see Table B-1 in Appendix B.
Figure 1. Extent of Reporting General Assessment Data for Students with Disabilities Used for Title I [N=61]
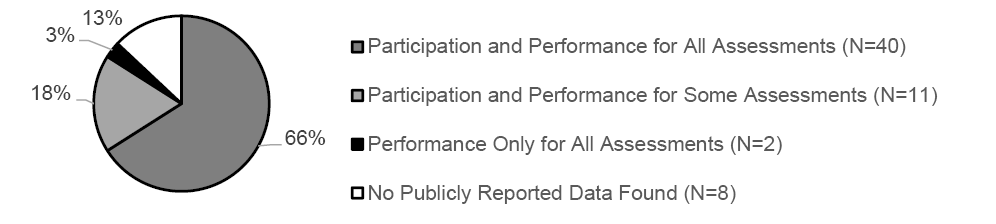
A few unique states either had no information found, or did not have general assessments used for Title I because they are not held to ESEA requirements. These states would not be held to the requirement to publicly report data for students with disabilities because they had not reported data for other students.
Figure 2 shows the extent to which the 50 regular states and 11 unique states reported participation and performance for students with disabilities on general reading/ELA, math, and science assessments used for Title I. The map shows that all of the regular states reported at least some participation or performance data for students with disabilities, with a majority of them reporting both participation and performance for all of these assessments. For details, see Table B-1 in Appendix B.
Figure 2. Regular and Unique States Reporting Disaggregated Participation or Performance Data for Students with Disabilities on General State Reading/ELA, Math, and Science Assessments Used for Title I, 2018–19
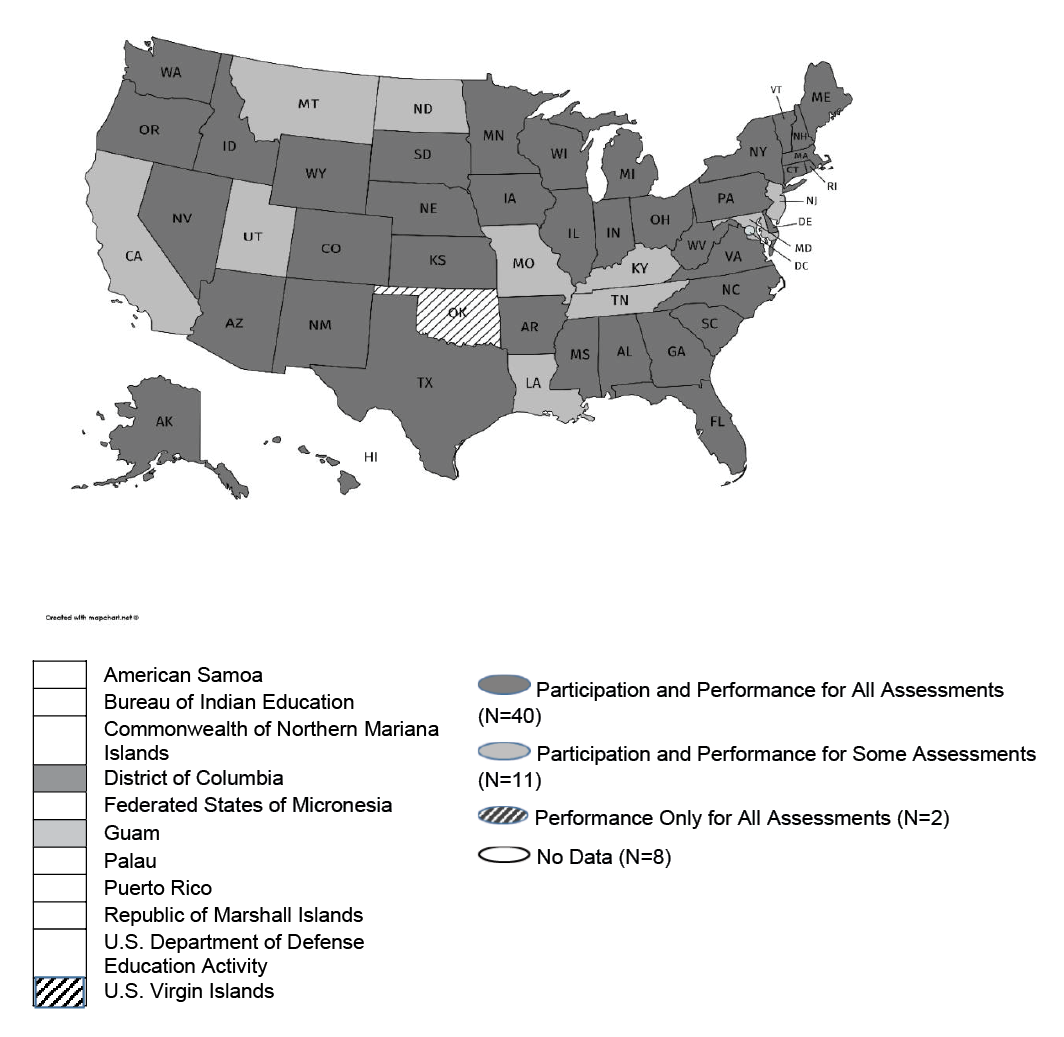
Notes. The figure does not include state APR data. A broad definition was used to determine whether a state had data. States were included if they had any data reported for the assessment (regardless of whether it was across all grades, by grade range, or for specific grades).
Not all state assessments in reading/ELA, math, and science are used for Title I. Some states administer assessments in these content areas for other purposes, such as graduation or state accountability. Of the 61 states, 47 had general assessments used only for Title I, and 14 states had general assessments in these content areas for other purposes. Figure 3 shows that among the 14 states, five reported participation and performance data for all tests, and nine did not publicly report data.
Figure 3. Extent of Reporting General Assessment Data for Students with Disabilities Not Used for Title I [N=61]
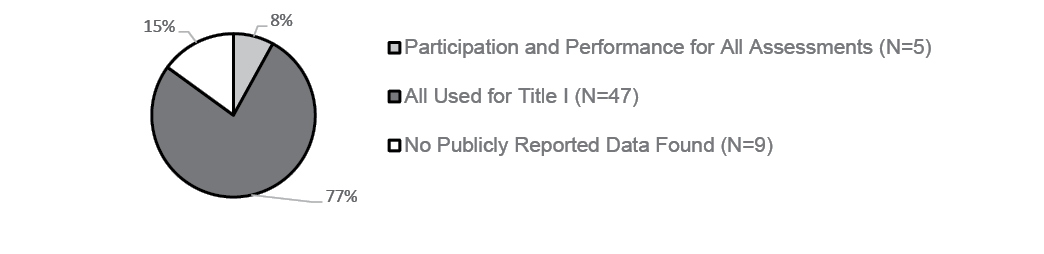
Figure 4 presents the same information as in Figure 3 but shows how individual states publicly reported participation and performance for these assessments. For details, see Table B-2 in Appendix B.
Twenty-six states had general assessments in content areas other than reading/ELA, math, and science (e.g., social studies). Of these states, 12 reported participation and performance for all of the assessments, two reported participation and performance for some of these assessments, two reported performance only for some or all assessments, and 10 states did not disaggregate these data for students with disabilities. For details, see Table B-3 in Appendix B.
Figure 4. States Reporting Disaggregated Participation or Performance Data for Students with Disabilities on General Reading/ELA, Math, and Science Assessments Not Used for Title I, 2018–19
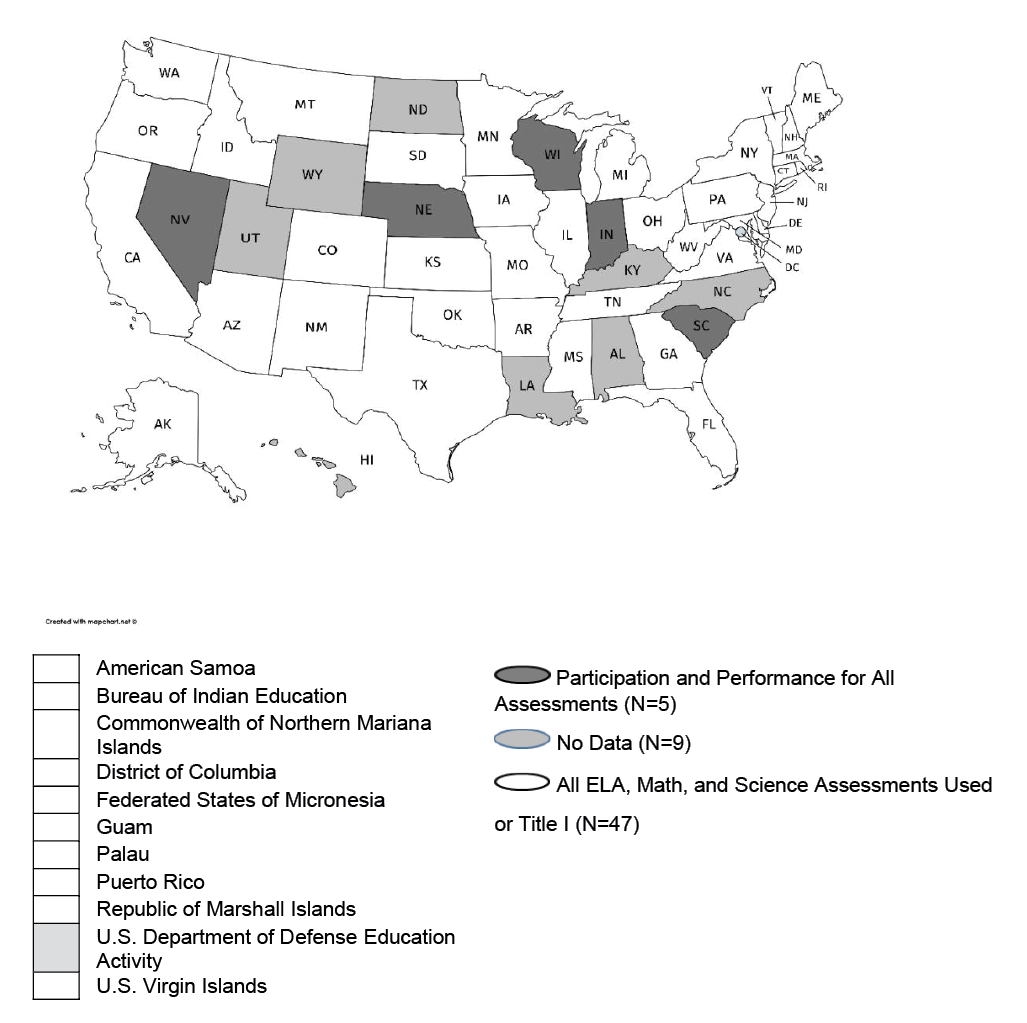
Note: States were included if they had any data reported for the assessment (regardless of whether it was across all grades, by grade range, or for specific grades).
Alternate Assessment Based on Alternate Academic Achievement Standards (AA-AAAS) Data for Students with the Most Significant Cognitive Disabilities
This section presents the extent of states’ public reporting of participation and performance for students with the most significant cognitive disabilities on alternate reading/ELA, math, and science assessments used for Title I. Figure 5 shows that 37 states, or 60 percent, reported both participation and performance data for all of these assessments. Six states (10%) reported these data for some, one state (2%) reported participation only, and two states (3%) reported performance only. Fifteen states (25%) had no publicly reported AA-AAAS data found. Of the states with no public data, a few unique states either had no information found about having an AA-AAAS or did not use the AA-AAAS for Title I (see Appendix B, Table B-4).
Figure 5. Extent of Reporting of AA-AAAS Used for Title I [N=61]
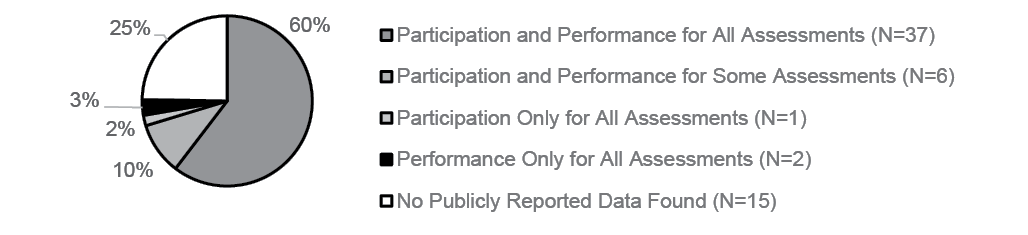
Figure 6 presents the same information as in Figure 5 by state, but shows how individual states publicly reported participation and performance for reading/ELA, math, and science AA-AAAS used for Title I. For details, see Table B-2 in Appendix B. The map shows that all but five regular states reported some type of data for students taking AA-AAAS, with 36 regular states and one unique state reporting both participation and performance on these assessments. For details, see Table B-4 in Appendix B.
Most states do not administer AA-AAAS in content areas other than reading/ELA, math, and science. However, of the nine states that did administer additional AA-AAAS, all nine states administered AA-AAAS related to social studies content. Six of these states reported participation and performance, and three states did not publicly report data. For details, see Table B-5 in Appendix B.
Figure 6. States Reporting Participation or Performance Data for Students with the Most Significant Cognitive Disabilities on Reading/ELA, Math, and Science AA-AAAS Used for Title I, 2018–19
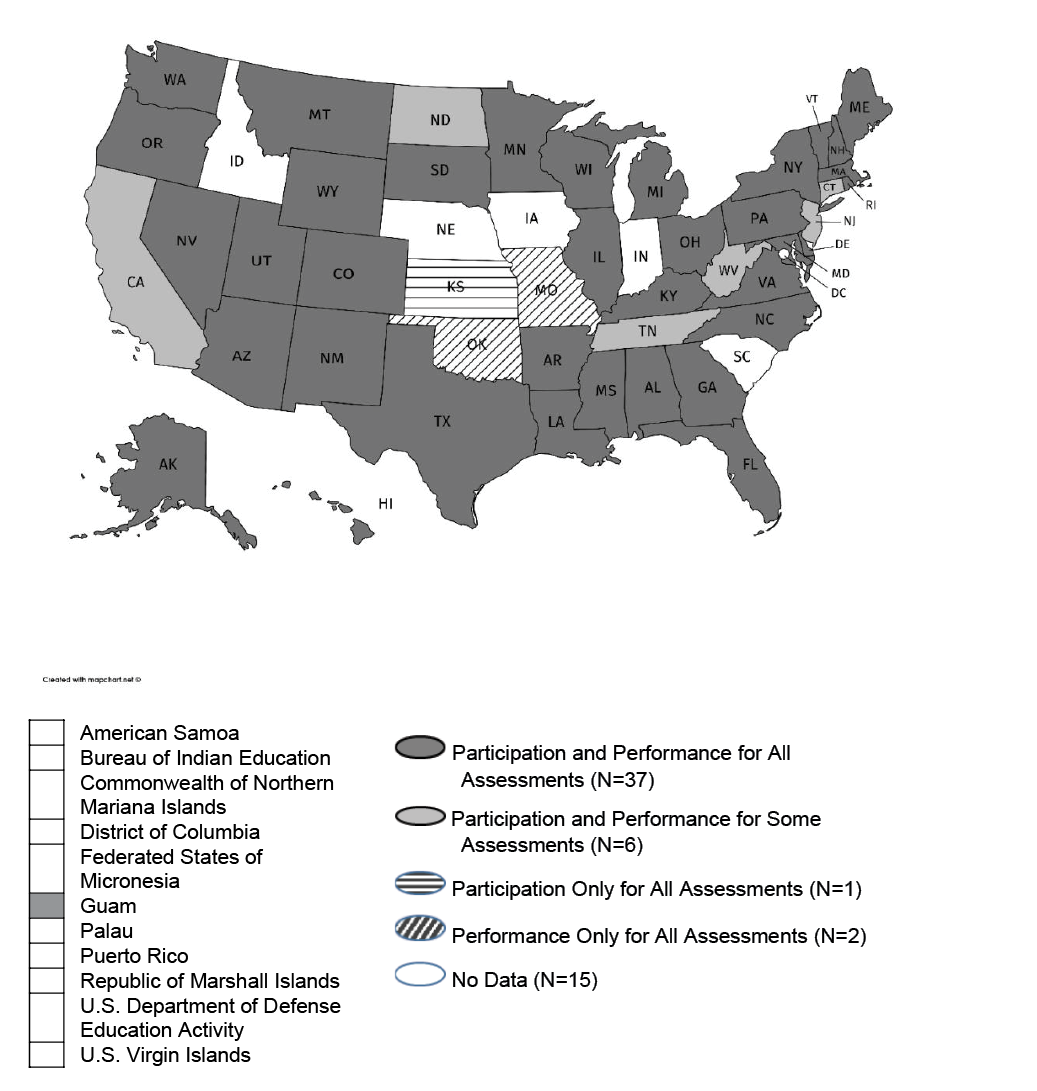
Note: The figure does not include state APR data. A broad definition was used to determine whether a state had data. States were included if they had any data reported for the assessment (regardless of whether it was across all grades, by grade range, or for specific grades).
General Assessment Data for English Learners with Disabilities
Most English learners with disabilities are assessed using general assessments, with or without accommodations. This section presents data on the extent to which states reported data for English learners with disabilities on general reading/ELA, math, and science assessments used for Title I. Figure 7 shows that just five states reported data for English learners with disabilities on these assessments, with three states reporting participation and performance for all assessments and two states reporting these data for some assessments. Fifty-six of the 61 regular and unique states, or 92% of all states, did not report participation or performance for English learners with disabilities on these assessments.
Figure 7. Extent of States Reporting Data for English Learners with Disabilities on General Reading/ELA, Math, and Science Assessments Used for Title I [N=61]
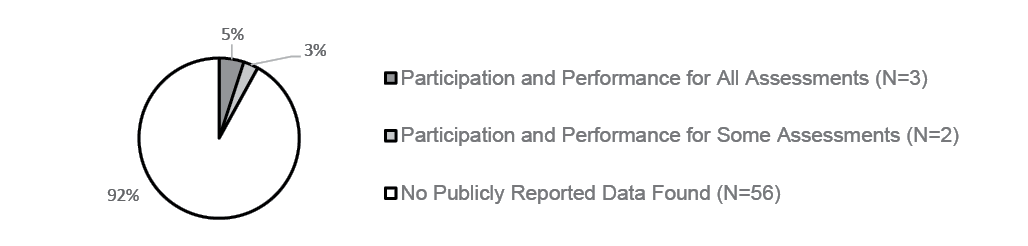
Figure 8 presents the same information as in Figure 7, but shows how individual states publicly reported participation and performance for reading/ELA, math, and science AA-AAAS used for Title I. It shows that all five that reported data for English learners with disabilities were regular states. For details, see Table B-6 in Appendix B.
Figure 8. States Reporting Disaggregated Participation and Performance Data for English Learners with Disabilities on General Reading/ELA, Math, and Science Assessments Used for Title I, 2018–19
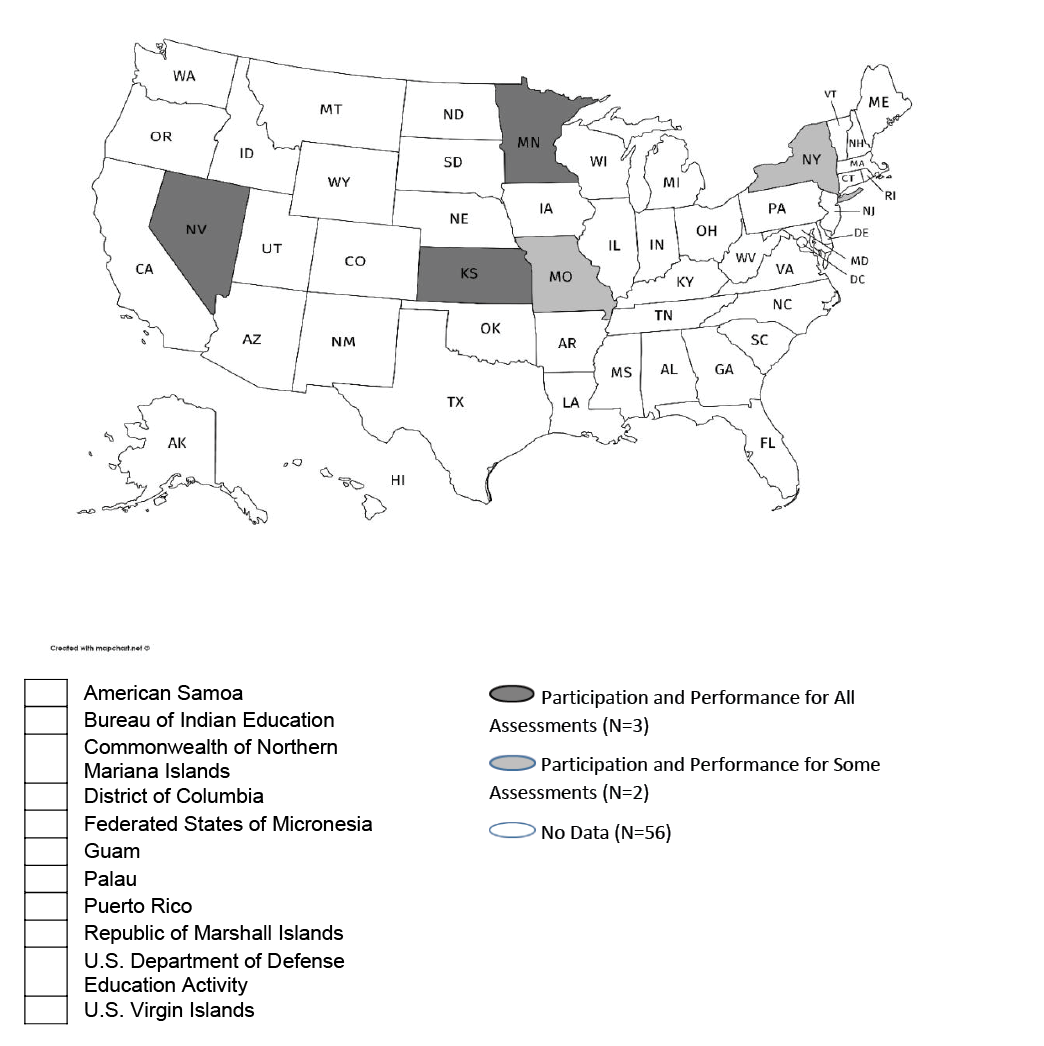
Note: The figure does not include state APR data. A broad definition was used to determine whether a state had data. States were included if they had any data reported for the assessment (regardless of whether it was across all grades, by grade range, or for specific grades).
Of the 14 states that had general assessments in reading/ELA, math, or science not used for Title I, just one reported participation and performance for English learners with disabilities, and the remaining thirteen did not publicly report these data (see Table B-7 in Appendix B for more details).
For states that had general assessments for content areas related to social studies (N=26), none of the total 61 states publicly reported data for English learners with disabilities. For details, see Table B-8 in Appendix B.
Alternate Assessment Reporting for English Learners with the Most Significant Cognitive Disabilities
Figure 9 shows that 11 states, or 18% of states, publicly reported participation and performance data on all reading/ELA, math, and science AA-AAAS for English learners with disabilities. Two states reported these data for some of these assessments, one state reported participation only, and two states reported performance only. Forty-five states (74%) did not publicly report data for English learners with the most significant cognitive disabilities on these assessments.
Figure 9. Extent of States Reporting AA-AAAS Data for English Learners with the Most Significant Cognitive Disabilities for Title I [N=61]
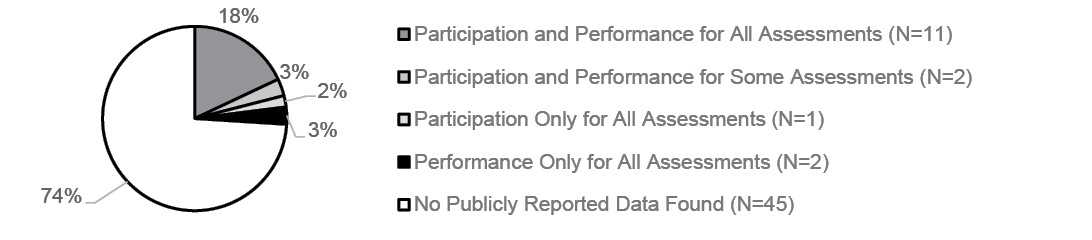
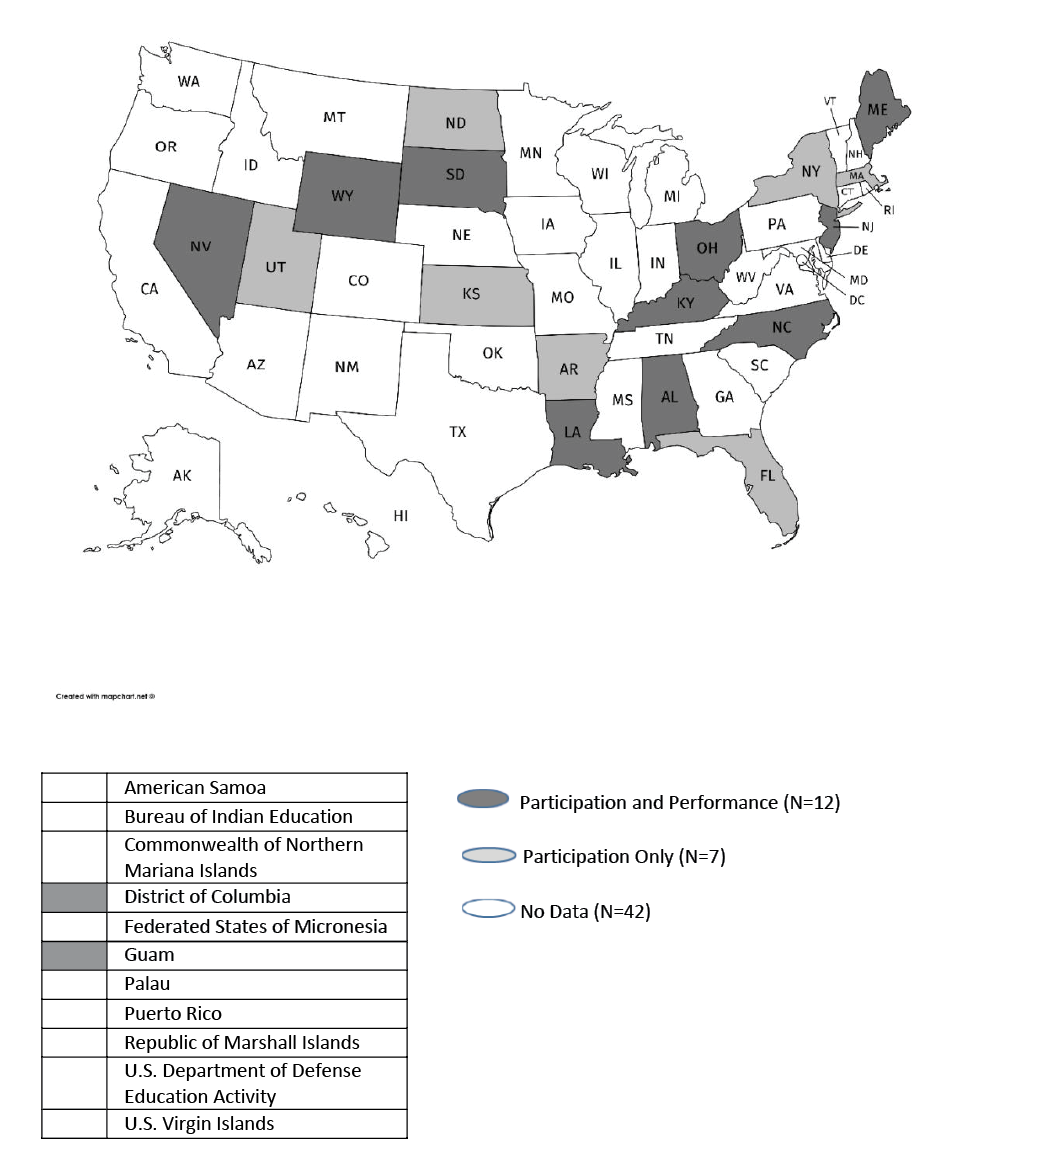
Figure 10 shows the same data as in Figure 9, by state. Of all 61 states, a total of 16 regular states reported participation, performance, or both for English learners with the most significant cognitive disabilities on all reading/ELA, math, and science AA-AAAS used for Title I. Eleven of these reported participation and performance. For details, see Table B-9 in Appendix B.
Figure 10. English Learners with the Most Significant Cognitive Disabilities on Reading/ELA, Math, and Science AA-AAAS Used for Title I, 2018–19
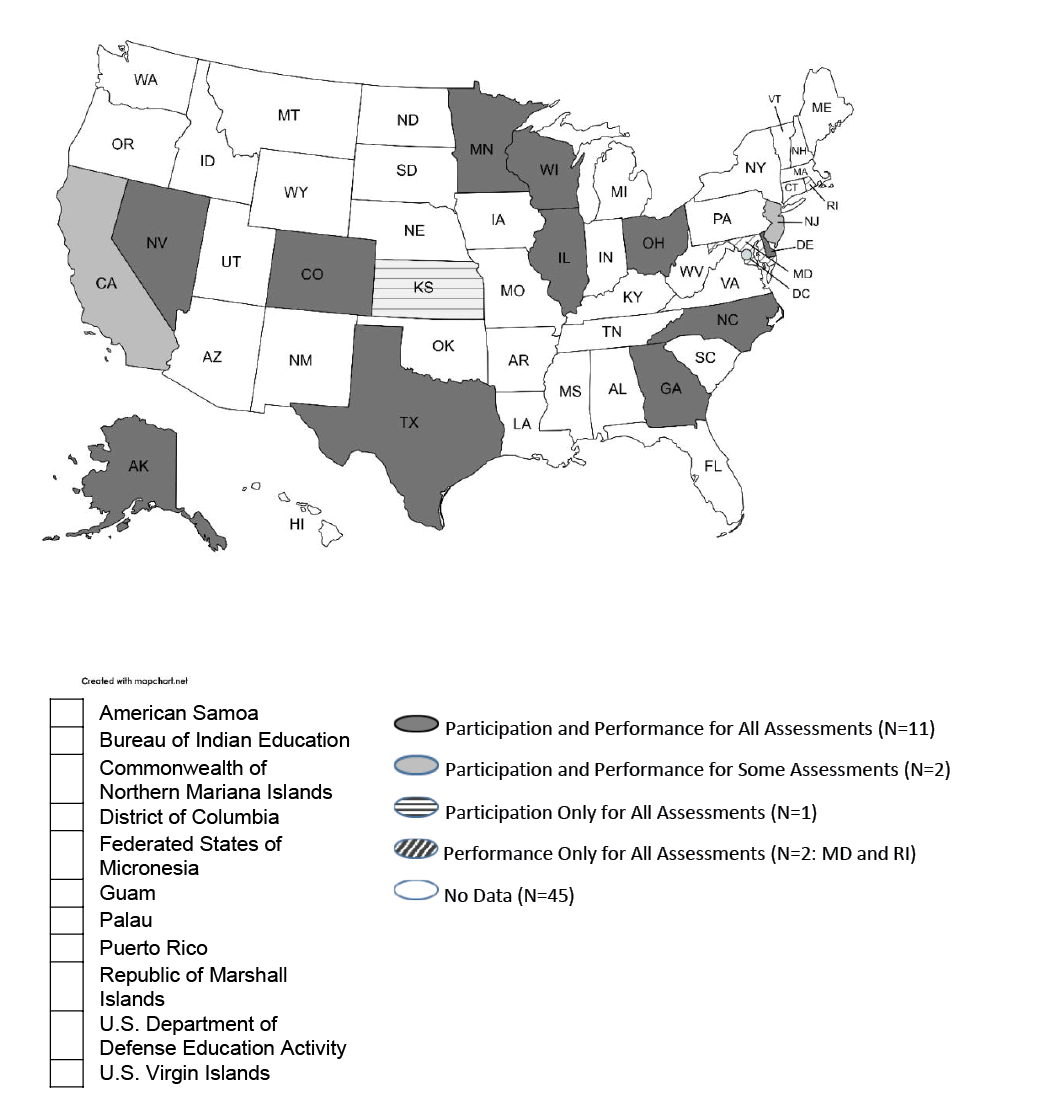
Of the nine states that had additional AA-AAAS in content areas other than reading/ELA, math, and science, five reported participation and performance for all assessments for ELs with disabilities, and four did not. See Table B-10 in Appendix B for details.
Alternate Assessment Based on Grade-Level Achievement Standards (AA-GLAS) Data for Students with Disabilities and English Learners with Disabilities
In 2018–19, one state (Massachusetts) continued to administer an alternate assessment based on grade level achievement standards (AA-GLAS). This state reported participation and performance data for students with disabilities but did not report these same data for English learners with disabilities. For details see Table B-11 in Appendix B.
Participation and Performance Reporting Approaches on General Assessments
Participation Reporting Approaches
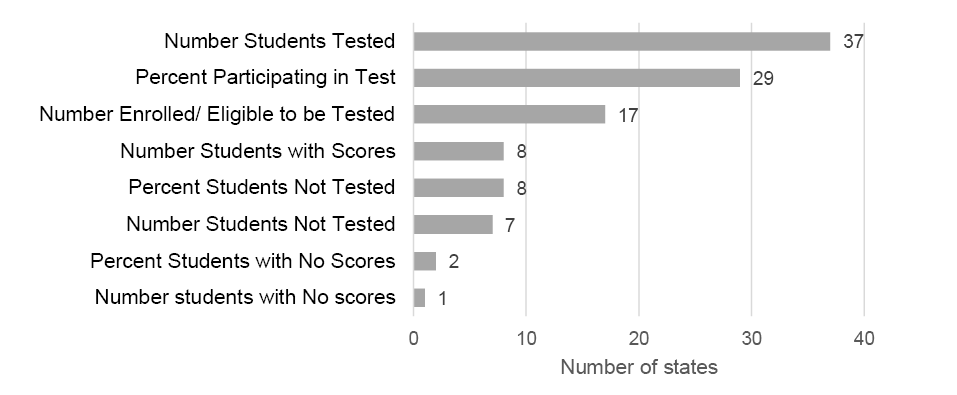
This section describes how states reported participation data. Figure 11 shows the approaches the 50 states used (of the total 61 regular and unique states) that reported participation data. Most states reported in multiple ways, so the total of the categories below does not equal 50. Thirty-seven states publicly reported the number of students tested, and 29 states reported the percent of students participating in general assessments used for Title I. Seventeen states reported the number of students enrolled or eligible to be tested in similar proximity to other participation data presented for assessments. Eight states each reported the percent of students not tested and the number of students with scores. Seven states reported the number not tested. Only two states reported the percent of students with no scores, and one state reported the number of students with no scores. Figure 11 includes data for states that used any method of reporting participation data (i.e., by grade and test, by merging grades and tests, by grades with tests merged, and by test with grades merged). Also, some states note that “number tested” in their reports actually means “number with scores,” but we count the language actually used in state reports. For additional details see Table B-12 in Appendix B. For details about AA-AAAS participation, see Table B-13 in Appendix B.
Figure 11. States Reporting Participation by Students with Disabilities for General Assessments Used for Title I in 2018–19
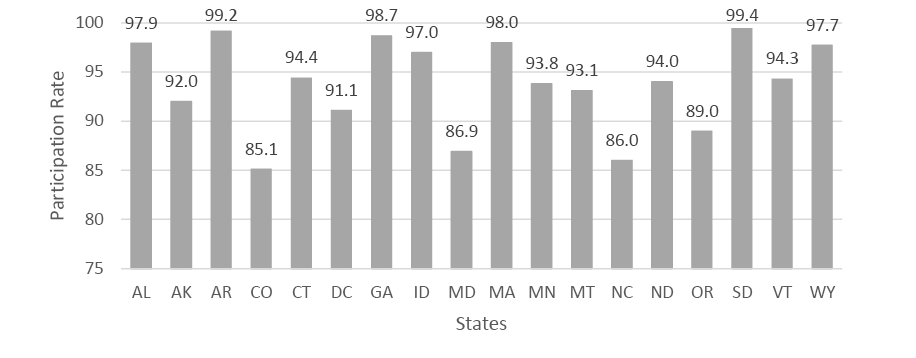
We include, as in previous reports, a figure showing how many states report participation rates for grade eight mathematics for those states that reported rates in a comparable manner (e.g., by grade and test). Figure 12 shows that 18 states, out of the 50 with participation information, reported participation rates using an approach that could be compared (e.g., does not include rates of entire population or rates reported by accommodated status). See Appendix Table B-14 for the state abbreviation key.
Figure 12. Percentages of Students with Disabilities Participating in Middle School General Math Assessments in Those States with Reported Participation Rates by Grade in 2018–19
Performance Reporting Approaches on General Assessments
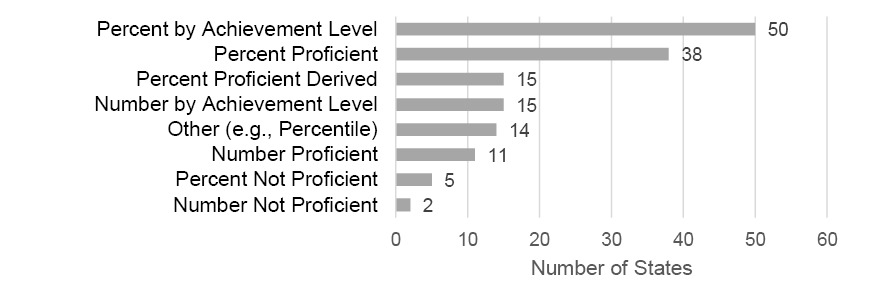
Performance data are also reported in a variety of ways, such as the number or percent of students in each achievement level, percent proficient or not proficient, etc. In more recent years, states have reported using state specific indices or growth targets. As these are often not as transparent in meaning as “percent proficient” on a test, these data are included in our “Other” reporting category, along with other lesser used data, such as average scale score or percentile rank. Fifty-two states reported performance data in at least one category. Figure 13 shows that the most common way states reported performance data was by percent by achievement level (N=50), with all but one regular state reporting this and one unique state reporting this. The next most common way to report was percent proficient (N=38). Fifteen states were counted as “percent proficient derived.” This means we used the reported percent by achievement level data to derive total percent proficient. The “other” category (N=14) includes states that reported scaled scores, percentiles, growth indices, or other types of scores. This figure includes data from states that used any method of reporting performance data (i.e., by grade and test, by merging grades and tests, by grade with tests merged, and by test with grades merged). Also, states could be counted in more than one category, so the number across types of data reported does not total 52 states. For additional details see Table B-15 in Appendix B. For details about AA-AAAS performance, see Table B-16 in the same Appendix.
Figure 13. Number of States Reporting Performance in Different Ways for Students with Disabilities in General Assessments Used for Title I, 2018–19
Selected Results of General Assessment Performance for Students with Disabilities
This section focuses on general assessment performance data for reading/ELA and math, comparing the percentage of students with disabilities who were proficient to those of their peers without disabilities. It only includes states that reported data by grade in three representative levels of elementary, middle, and high school (e.g., Grade 4, Grade 8, and high school). Figures 14 to 19 show the differences in percent proficient between students with IEPs and their peers by state. A solid line represents the difference, or gap, between the student groups. States vary in their reporting of peer groups. Some states define peers as students without IEPs and other states include students with IEPs for “all students.” In the figures, these differences are noted on the horizontal axis as “A” for all students and “O” for students without IEPs. Some states may include students with 504 plans in their composition of a peer group without IEPs. We note these peer group differences because it may affect the interpretation of the achievement gaps shown.
Elementary School
Figures 14 and 15 show the elementary performance gaps for reading/ELA and math. For example, Figure 14 indicates that in New Mexico 5% of its students with IEPs assessed in the general reading assessment were proficient, whereas 30% of all students (A in the figure) were proficient. This results in a 25 percentage-point difference between the two groups. In Tennessee, 10% of its students with IEPs assessed in grade 4 were proficient in reading/ELA, compared to 38% of students without IEPs (O in the figure). This results in a 28 percentage-point difference. Overall, in reading/ELA, the smallest gap was 20 percentage points, and the largest gap was 51 percentage points. For elementary math, in Figure 15, the gaps ranged from 20 percentage points to 53 percentage points.
Figure 14. Percent Proficient for Elementary Reading/ELA in States That Reported Data by Grade [N=38]
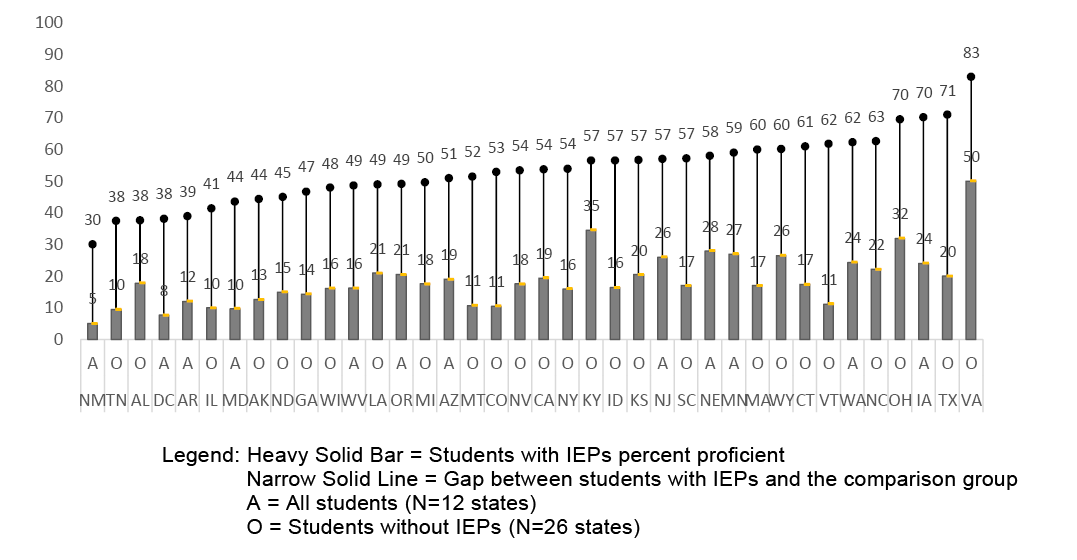
Note: 38 of 61 states (including unique states) reported data by grade; 23 states had no data or no data by grade.
Figure 15. Percent Proficient for Elementary Math in States That Reported Data by Grade [N=38]
Note: 38 of 61 states (including unique states) reported data by grade; 23 states had no data or no data by grade.
Middle School
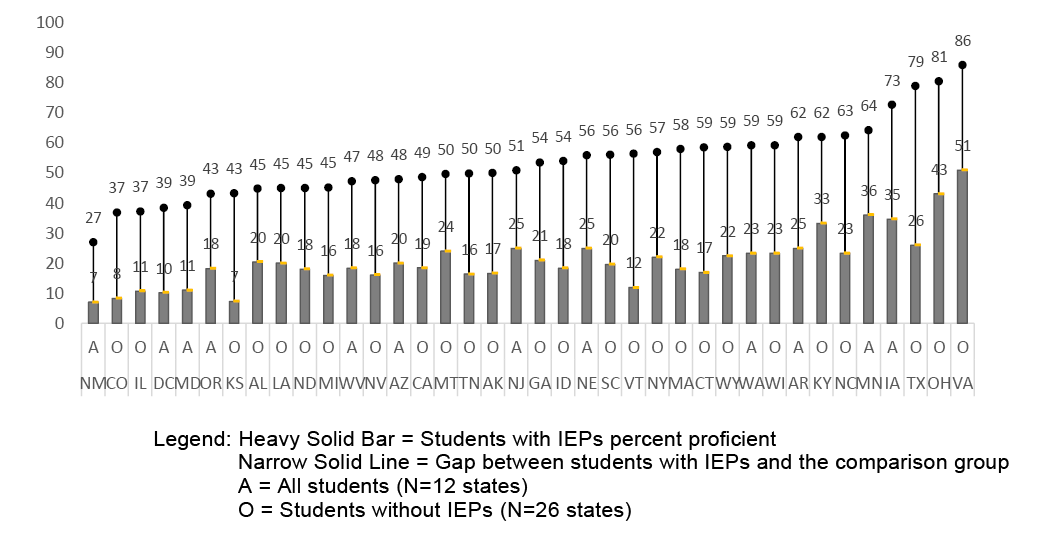
Figures 16 and 17 illustrate the performance gaps for middle school reading/ELA and math. As with the elementary grade graphs, the following figures show a range of gaps in performance between students with IEPs and their peers for the two content areas. In Figure 16, the middle school reading gaps ranged from 13 percentage points to 55 percentage points. In Figure 17, for math, the gaps ranged from 10 percentage points to 47 percentage points.
Figure 16. Percent Proficient for Middle School Reading/ELA in States That Report Data by Grade [N=37]
Note: 37 of 61 states (including unique states) reported data by grade; 24 states had no data or no data by grade.
Figure 17. Percent Proficient Middle School Math in States That Reported Data by Grade [N=37]
Note: 37 of 61 states (including unique states) reported data by grade; 24 states had no data or no data by grade.
High School
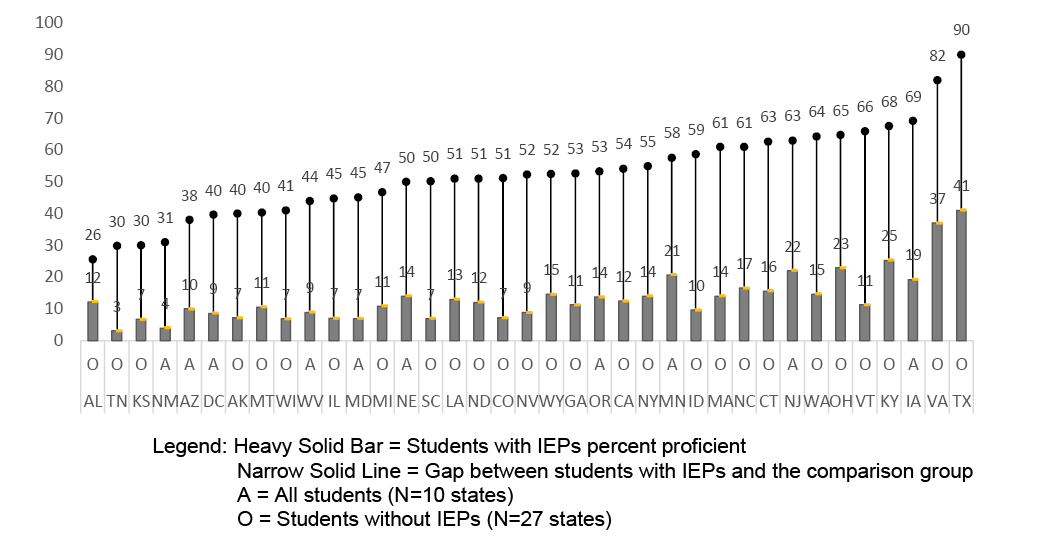
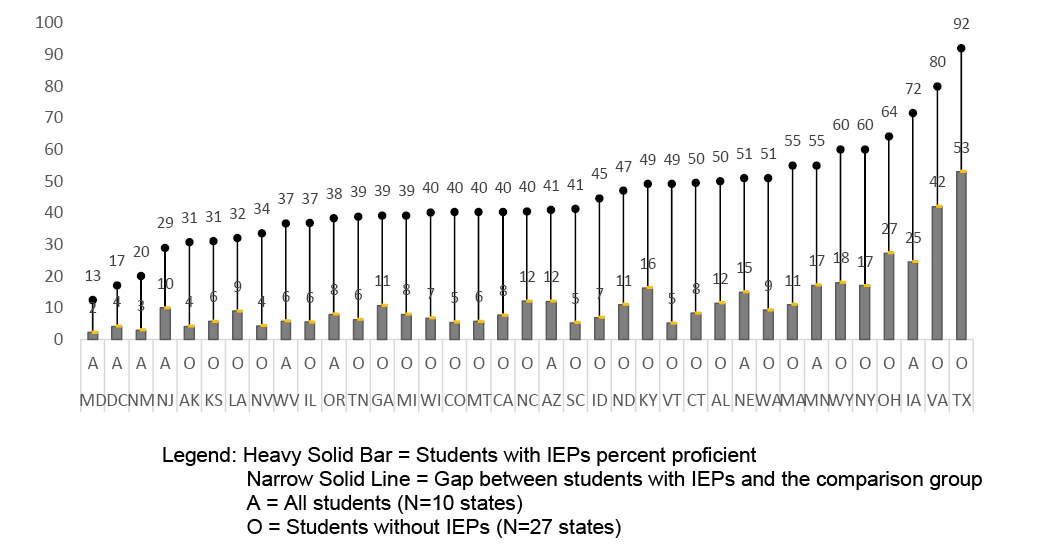
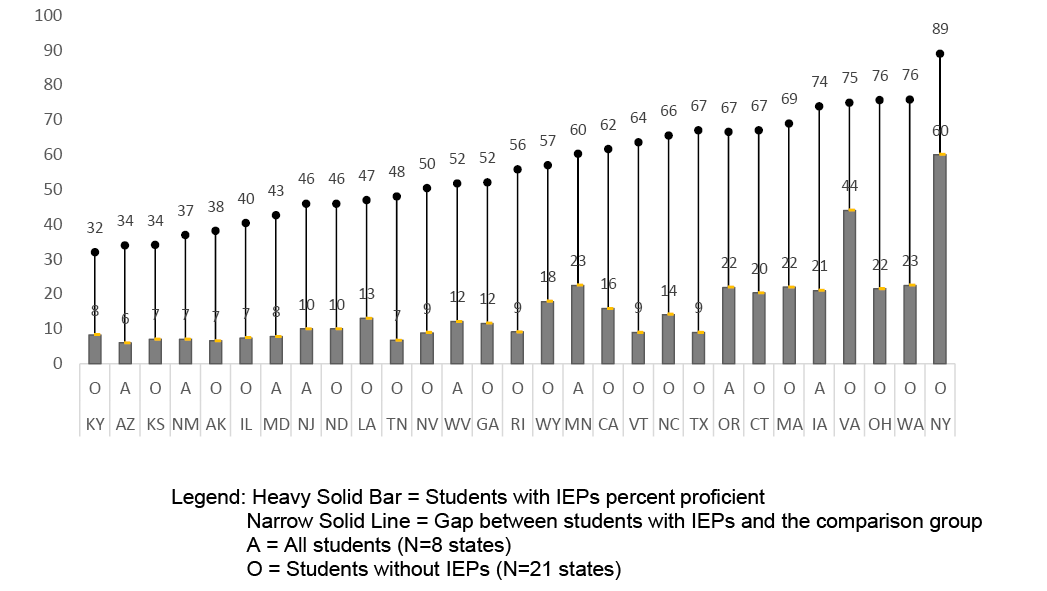
Figures 18 and 19 show the gaps for high school reading/ELA and math. Grade 10 was used for math, but when states do not report a grade 10 math test, the end-of-course test in algebra is used, as historically this has been the most commonly found math test across states after middle school. Figure 18 shows that reading/ELA gaps range from 24 percentage points to 58 percentage points. Figure 19, for math, shows gaps ranging from 7 percentage points to 61 percentage points.
Figure 18. Percent Proficient for High School Reading/ELA in States that Report Data by Grade [N=29]
Note: 29 of 61 states (including unique states) reported data by grade; 32 states had no data or no data by grade.
Figure 19. Percent Proficient for High School Math in States that Report Data by Grade [N=27]
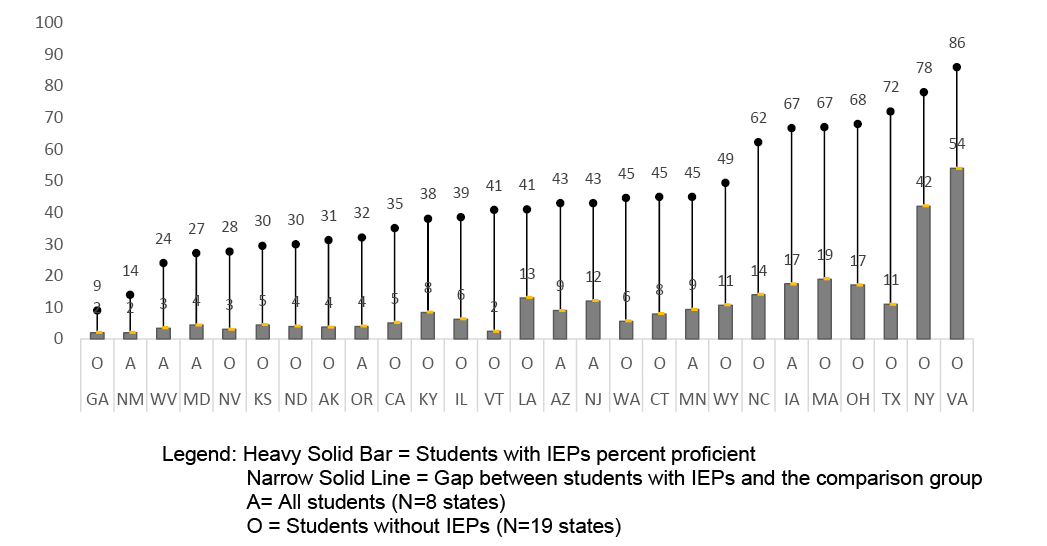
Note: 27 of 61 states (including unique states) reported data by grade; 34 states had no data or no data by grade.
Summaries of Average Gaps for Students With and Without IEPs by Content Area and School Level
Average achievement gaps presented in this section are based on the achievement gaps in publicly reported data for students with IEPs and the comparison peer group used by each state. Table 1 presents the average gaps biannually from 2014–15 to 2018–19. These peer groups are either “All” students that include students with disabilities, or students without disabilities according to individual state reporting practices. States with data across all three select biannual years from 2014–15 and 2018–19 were included in calculating the average gaps for reading/ELA and math by each grade level. If states did not have data for grades 4, 8, or 10, one grade below was used; one grade above was used if data were reported neither for the identified grade nor one grade below. These grades are used to represent elementary, middle, and high school. There are limitations to this analysis in that the number of states with data often fluctuates and the assessments a state uses may change over time. Further, some states in prior years reported performance for alternate assessments based on modified achievement standards (AA-MAS).
As shown in Table 1, the number of states with data varied between 19 and 31 depending on the content area and grade. Across reading/ELA and math, the gaps for the elementary grades were slightly lower than corresponding content area gaps in middle or high school grades. However, the gaps for math were generally smaller across grades and years compared to reading/ELA. The 2018–19 year of data had the highest average gaps for all content areas and grades.
Table 1. Average Gaps for Students with IEPs and Comparison Peer Group on General Assessments: Biannually for Select Years
| Grade Ranges | Number of States | Average Gaps for All States with Data
Reporting by Grade |
||
|---|---|---|---|---|
| 2014–15 | 2016–17 | 2018–19 | ||
| Elementary School Reading/ELA | 31 | 31 | 32 | 35 |
| Middle School Reading/ELA | 30 | 37 | 39 | 40 |
| High School Reading/ELA | 20 | 35 | 36 | 42 |
| Elementary School Math | 31 | 28 | 30 | 32 |
| Middle School Math | 30 | 30 | 30 | 33 |
| High School Math | 19 | 30 | 29 | 36 |
Accommodations Data for Students with Disabilities
Figure 20 summarizes the number of regular and unique states (N=61) that publicly reported participation or performance data for students with IEPs receiving accommodations on the general assessments for 2018–19. Nineteen states reported some type of accommodations data, with 12 states reporting the number receiving accommodations and their performance and seven states reporting only the number receiving accommodations. See Appendix B-17 for specific state information shown in Figure 20.
Figure 20. States Reporting Students with Disabilities Receiving Accommodations, 2018–19
Public Reporting on English Language Proficiency (ELP) Assessments
This section summarizes the public reporting of state level data for ELP and alternate ELP assessments for English learners with the most significant cognitive disabilities. Students in the latter group generally participate in state AA-AAAS for assessing the content areas included in Title I. Figure 21 shows that of the 50 states and District of Columbia, 28 states reported participation or performance data for English learners on ELP assessments, 14 states reported for English learners with disabilities on ELP assessments, and eight states reported for English learners with significant cognitive disabilities on alternate ELP assessments.
Figure 21. 2018–19 Number of States Reporting Data on ELP Assessments in Public Reporting
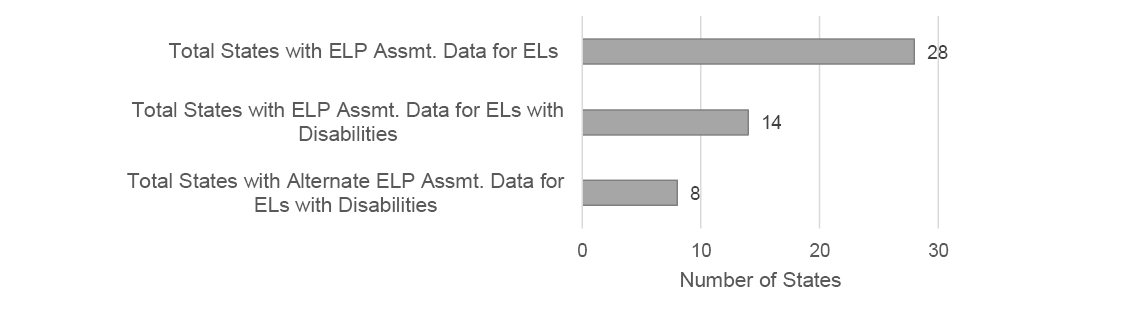
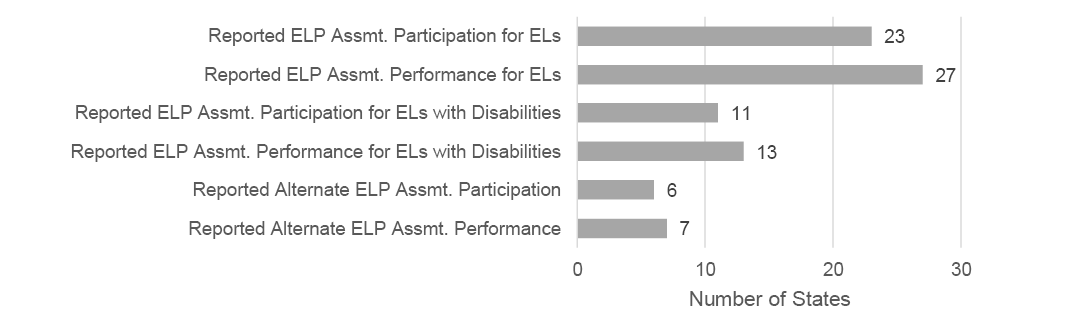
Figure 22 shows the number of states that publicly reported participation and performance specifically for the regular ELP assessment, for English learners and English learners with disabilities, and for the alternate ELP assessments for English learners with significant cognitive disabilities. For English learners who take regular ELP assessments, 23 states reported participation and 27 states reported performance. For English learners with disabilities who take regular ELP assessments, 11 states reported participation and 13 states reported performance. For English learners with significant cognitive disabilities who take alternate ELP assessments, six states reported participation and seven states reported performance. Often, the states that report these data allow users to choose to disaggregate by English learners with disabilities, but the data are not presented for confidentiality reasons due to the small numbers of students. If a state offers the option to choose these data, we count it as having data even if the data are not viewable due to the small numbers. See Appendix B-18 for details by state for Figures 21 and 22.
Figure 22. 2018–19 Number of States Reporting Participation or Performance for ELP Assessments in Public Reporting
Summary and Conclusions
Extent of Public Reporting for Students with Disabilities
Forty states, of the 61 regular and unique states, reported participation and performance of students with disabilities for all general assessments in reading/ELA, math, and science used for Title I accountability purposes in 2018–19. Eleven states reported these data for some assessments, and two reported performance only for all tests. Thirty-seven states reported participation and performance data for all AA-AAAS. Of the 14 states with general reading/ELA, math, and science assessments not used for Title I, only five states reported participation and performance; nine reported no data.
Extent of Public Reporting for English Learners with Disabilities
The number of states that reported participation and performance data for English learners with disabilities on all general assessments increased to three states, with two additional states reporting participation and performance for some of their general assessments. For the AA-AAAS, 11 states reported participation and performance data for English learners with disabilities on all assessments, two reported these data for some of their AA-AAAS, one reported participation only, and two reported performance only. One state reported participation and performance for English learners with disabilities on general reading/ELA, math, or science assessments not used for Title I accountability, showing a change from none the previous years.
How Data Are Reported
The most common approaches for communicating student participation and performance on general assessments and AA-AAAS have not changed, although the number of states using the two most common approaches increased slightly since the previous report. The most common way to report participation for regular and unique states on general assessments was number tested (N=50) followed by percent of students tested (N=38). Because states use different methods to report (e.g., merging assessments, grades), the numerators and denominators used to report participation and performance data continue to vary significantly across states.
As in our previous reports, we included a figure showing the middle school math participation rates reported across states. For the 2018–19 school year, 29 states reported participation rates, but only 18 reported in a way that could be compared (e.g., not merged grades or split by accommodation status). These participation rates ranged from 85.1 percent to 99.4 percent.
Differences in Performance
Differences in the percentage of students with and without IEPs scoring proficient on content assessments in reading/ELA and math persist. As in past reports, we looked at the 2018–19 performance data for elementary, middle, and high school grade levels as well as a longitudinal look at biannual average gaps in performance for these same grades and content areas. Only states that had data by grade and content area for all select biannual years were included in the gap analysis. Compared to previous years’ analyses, the trend holds that elementary grades have had slightly smaller gaps for both reading/ELA and math than middle and high school. However, the gaps for math were generally smaller across grades and years compared to reading/ELA gaps. The 2018–19 year of data had higher average gaps for all content areas and grades compared to 2014–15 or 2016–17.
Other Reporting
There was an increase over the previous year (i.e., 2017–18) in the reporting on students with disabilities who use accommodations, with 19 states publicly reporting either participation or performance data for students receiving accommodations on state assessments. Twelve reported both the number using accommodations and performance, and seven states reported only the number using accommodations. Forty-two states did not publicly report these data.
There was also an increase over the previous year (i.e., 2017–18) in the states reporting data for regular and alternate assessments of ELP. Of the regular 50 states and the District of Columbia, 28 states reported participation or performance for English learners on regular ELP assessments, compared to 13 states in 2017–18. Twice as many states (14 states) reported these data for English learners with disabilities in 2018–19 compared with 2017–18. For alternate ELP assessments intended for English learners with the most significant cognitive disabilities, eight states reported these data, up from four states in 2017–18.
Recommendations for Reporting
The following are recommendations to states for public reporting of disaggregated data for students with disabilities:
- Report participation and performance results for each assessment, content area, and grade level. This includes reporting alternate assessments separately from the general assessment where confidentiality of students is not jeopardized and describing what assessments are included when data are merged.
- Label preliminary and final data clearly with dates posted.
- Report number of students with disabilities receiving accommodations.
- Report participation percentages, disaggregated by grade.
- Provide reports in a format that is user-friendly for the general public rather than relying on technical reports or reports for federal audiences to be the sole type of public reporting of data for students with disabilities.
- If report cards disaggregate data by local education agencies, also aggregate those subgroups at the state level.
- Make data accessible by doing the following: attending to the usability of formats to view data (e.g., functionality of elements when screen is enlarged); noting any known issues with browsers in accessing formats or, ideally, resolving those issues; easing the ability of users to find most current information within the website; and using clear language and labeling. Also avoid requiring a log-in code to access otherwise public data if confidentiality of individual students is not jeopardized.
- For states with customized report generators, ensure that comparable data are available in easily exportable formats. Report content should be accessible for all users of state websites, including users with disabilities.
References
Albus, D. A., Lazarus, S. S., & Thurlow, M. L. (2020). 2017–2018
Publicly reported assessment results for students with disabilities
and English learners with disabilities (NCEO Report
419). National Center on Educational Outcomes.
https://nceo.umn.edu/docs/OnlinePubs/NCEOReport419.pdf
Albus, D. A., Liu, K. K., Thurlow, M. L., & Lazarus, S. S. (2019). 2016–17 Publicly reported assessment results for students with disabilities and ELs with disabilities (NCEO Report 411). National Center on Educational Outcomes. https://nceo.umn.edu/docs/OnlinePubs/NCEOReport411.pdf
Albus, D., Lazarus, S. S., & Thurlow, M. L. (2014). 2011–12 Publicly reported assessment results for students with disabilities and ELLs with disabilities (Technical Report 69). National Center on Educational Outcomes. https://nceo.umn.edu/docs/onlinePubs/Tech69/TechnicalReport69.pdf
Albus, D., Lazarus, S. S., & Thurlow, M. L. (2015). 2012–13 Publicly reported assessment results for students with disabilities and ELLs with disabilities (Technical Report 70). National Center on Educational Outcomes. https://nceo.umn.edu/docs/onlinePubs/Tech70/TechnicalReport70.pdf
Albus, D., Thurlow, M., & Bremer, C. (2009). Achieving transparency in the public
reporting of 2006–2007
assessment results
(Technical Report 53). National
Center on Educational Outcomes.
https://nceo.umn.edu/docs/onlinePubs/Tech53/TechnicalReport53.pdf
Klein, J. A., Wiley, H. I., & Thurlow, M.
L. (2006). Uneven transparency:
NCLB tests take precedence in
public assessment
reporting for
students with
disabilities
(Technical Report 43). National
Center on Educational Outcomes.
https://rtc3.umn.edu/docs/OnlinePubs/TechReport43.pdf
Thurlow, M., Bremer, C.,
& Albus, D. (2008).
Good news
bad news
in disaggregated
subgroup reporting to the public
on 2005–2006 assessment results
(Technical Report 52). National Center on Educational Outcomes.
https://rtc3.umn.edu/docs/OnlinePubs/Tech52/Technical52.pdf
Thurlow, M. L., & Wiley, H. I. (2004).
Almost there in public reporting
of assessment results for students
with disabilities
(Technical Report 39). National Center on
Educational Outcomes.
https://rtc3.umn.edu/docs/OnlinePubs/TechReport39.pdf
Thurlow, M. L., Wiley,
H. I., & Bielinski,
J. (2003). Going
public: What
2000–2001 reports
tell us about
the performance
of students
with disabilities
(Technical Report 35). National
Center on Educational Outcomes.
https://rtc3.umn.edu/docs/OnlinePubs/TechReport35.pdf
VanGetson, G. R., & Thurlow, M. L. (2007). Nearing
the target in disaggregated subgroup reporting to the public on
2004–2005 assessment results(Technical Report 46).
National Center on Educational Outcomes.
https://rtc3.umn.edu/docs/OnlinePubs/Tech46/TechReport46.pdf
Wiley, H. I., Thurlow, M. L., & Klein, J. A. (2005). Steady progress: State public reporting practices for students with disabilities after the first year of NCLB (2002–2003) (Technical Report 40). National Center on Educational Outcomes. https://rtc3.umn.edu/docs/OnlinePubs/TechReport40.pdf
Appendix A
The National Center on Educational Outcomes is examining states’ public reports for the 2018–2019 school year assessment results. Our goal is to:
(a) identify all components of each state’s testing system;
(b) determine whether each state reports disaggregated test results for students with disabilities and English language learners (ELs) with disabilities; and
(c) describe the way participation and performance information is presented.
As in previous years, we are looking at assessment department reports and the equivalent of report cards used for Title I.
We have reviewed your Web site for this information and have enclosed tables summarizing that review. Please verify all included information. Specifically, please return the tables that we have attached, noting your changes to them. Also, if there is additional publicly reported information available for your state, please provide us with the public document and/or website that contains the information. Address your responses to Deb Albus via email.
If you have any questions about our request, please email Deb Albus. Please respond by July 1, 2020.
Thank you for taking the time to provide this information.
Sheryl Lazarus, Director NCEO
Deb Albus, Research Fellow, NCEO
1. Reporting in State Assessments Summary
Please check the information below for accuracy and make edits as needed.
| Assessments | Content Area by Grade | Disaggregated Data | Used for Title I |
|||
|---|---|---|---|---|---|---|
| Special Education | ELs with Disabilities | |||||
| Partici- pation |
Perform- ance |
Partici- pation |
Perform- ance |
|||
| Scantron | ELA, Math (3–8, HS), Science (5, 7, HS) |
Yes | Yes | No | No | Yes |
| The ACT College Readiness Test |
English, Math, Reading, Science with Writing (11) |
No | No | No | No | No |
| Alabama Alternate Assessment |
Reading, Math (3–8, 10), Science (5, 7, 10) |
Yes | Yes | No | No | Yes |
2. Reporting on Students with Disabilities
How was participation and performance reported on the Title I assessments (general and alternate based on alternate academic achievement standards (AA-AAAS))?
The table presents descriptive data categories. If your state uses “number tested” in report tables, but it actually reflects “Number of students with scores” among total tested, you may explain this below the table. We know certain data categories could be used to derive other categories below, but we are counting which categories states use. Percent proficient derived is an exception. If a state reports percent by achievement level that can be used to sum for total percent proficient, we do count this, but in its own category indicating the user needs to derive, or compute, this. If percent proficient did not need to be derived, will be “No.”
Please review the table and make edits as needed. If data are merged, an M is placed in the general and alternate columns.
| For Title I Assessments: | Participation | Performance | |||
|---|---|---|---|---|---|
| Participation | General | AA-AAAS | Performance | General | AA-AAAS |
| Number Enrolled/ Eligible to be Tested | No | No | Percent Proficient | Yes | Yes |
| Number of Students Tested | No | No | OR Percent Proficient Derived | No | No |
| Number of Students Not Tested | No | No | Percent Not Proficient | No | No |
| Percent Participating in Test | Yes | Yes | Number Proficient | No | No |
| Percent of Students Not Tested | No | No | Number Not Proficient | No | No |
| Number of Students with Scores | No | No | Number by Achievement Level | No | No |
| Number of Students with No scores | No | No | Percent by Achievement Level | Yes | Yes |
| Percent of Students with No Scores | No | No | Other (e.g., percentile rank) | No | No |
3. Accommodated Status Reporting
Did your state report accommodated status data for any population?
Please review the table and edit as needed. For edits, please note the report name and provide a link if different from below.
| List assessment and describe reporting | Reported Participation? | Reported Performance? | |
|---|---|---|---|
| On what assessment(s)? | Has number tested for students with IEPs for regular and alternate with and without accommodations with performance in achievement levels and all category percent proficient. | Yes | Yes |
Report
name/Link to report/attach:
Proficiency/Proficiency - 2018–2019 Assessment Data for Students with
IEPs https://www.alsde.edu/dept/erc/Support/2018–2019%20Proficiency%20and%20Participation%20Data%20of%20Students%20with%20IEPs.xlsx
Participation and Performance Data for Students with Disabilities in English Language Proficiency (ELP) Assessments
Please review the following table for accuracy and make edits as needed. If edits require adding an alternate ELP assessment, please use the additional placeholder row for this information, as we count it separately.
4. Disaggregated Data for the English Language Proficiency Assessment(s)
| ELPA Name | Grade | Reports Data for
All English Learners |
Disaggregated
Data for ELs with Disabilities |
||
|---|---|---|---|---|---|
| Participation | Performance | Participation | Performance | ||
| ACCESS 2.0 | K-12 | No | No | No | No |
| [Alternate ELP Assessment] |
|||||
Appendix B
Data Tables
Table B-1. Disaggregated Special Education Data on General Assessments Used for Title I: Reading/English Language Arts, Math, and Science
| State | Test | Subject Areas/ Grade | Partici-pation | Perfom-ance | Part. and Perf. All Tests | Part. and Perf. Some Tests | Perf. Only All Tests | No Publicly Reported Data Found |
|---|---|---|---|---|---|---|---|---|
| Regular States | Reporting Summary | |||||||
| Alabama | Scantron | ELA, Math (3–8, HS), Science (5, 7, HS) | Yes | Yes | Yes | |||
| Alaska | PEAKS | ELA, Math (3–10) | Yes | Yes | Yes | |||
| Alaska Science Assessment |
Science (4, 8, 10) | Yes | Yes | |||||
| Arizona | AZMerit | ELA, Math (3–8), HS: English (9–11,) Algebra I-II, Geometry |
Yes | Yes | Yes | |||
| AIMS Science | Science (4, 8, HS) | Yes | Yes | |||||
| Arkansas | ACT Aspire | English, Reading, Math, Science, and Writing (3–10) |
Yes | Yes | Yes | |||
| California | Smarter Balanced | ELA, Math (3–8, 11) | Yes | Yes | Yes | |||
| CAST | Science (5, 8, once in HS, field testing) | No | No | |||||
| Colorado | CMAS | ELA/Literacy, Math (3–8), HS: Algebra I, Geometry, Integrated Math I-II |
Yes | Yes | Yes | |||
| CMAS | Science (5, 8, HS) | Yes | Yes | |||||
| Connecticut | Smarter Balanced | ELA, Math (3–8) | Yes | Yes | Yes | |
|
|
| NGSS Science | Science (5, 8, 11) | Yes | Yes | |||||
| Connecticut SAT School Day |
Evidenced Based Reading, Writing, Math (11) |
Yes | Yes | |||||
| Delaware | Smarter Balanced | ELA, Math (3–8) | Yes | Yes | Yes | |||
| SAT School Day | ELA, Essay, Math, Science (HS) | Yes | Yes | |||||
| Florida | FSA | ELA, Math (3–10) | Yes | Yes | Yes | |||
| FSA EoC Assessments | EoC: Algebra I, Geometry, Biology I | Yes | Yes | |||||
| Statewide Science Assessment | Science (5, 8) | Yes | Yes | |||||
| Georgia | Georgia Milestones | ELA, Math (3–8), Science (5, 8, HS), HS (EoC): 9th Literature and Composition, American Literature and Composition, Coordinate Algebra, Algebra I, Geometry, Analytic Geometry, Physical Science, Biology |
Yes | Yes | Yes | |||
| Hawaii | Smarter Balanced | ELA, Math (3–8, 11) | Yes | Yes | Yes | |||
| HSA Science | Science (4, 8) | Yes | Yes | |||||
| EoC | Biology I (HS) | Yes | Yes | |||||
| KAEO | Hawaiian Language Arts, Math (3–8), Science (4, 8) |
Yes | Yes | |||||
| Idaho | ISAT | ELA, Math, (3–8, HS), Science (5, 7, HS) |
Yes | Yes | Yes | |||
| Illinois | PARCC | ELA, Math (3–8) | Yes | Yes | Yes | |
|
|
| SAT | ELA, Math (HS) | Yes | Yes | |||||
| ISA | Science (5, 8, 10) | Yes | Yes | |||||
| Indiana | ISTEP+ | Reading, Math (3–8, 10) | Yes | Yes | Yes | |||
| ISTEP+ | Science (4,6) | Yes | Yes | |||||
| ILearn | Biology | Yes | Yes | |||||
| Iowa | ISASP | Reading, Math (3–8, 11) | Yes | Yes | Yes | |||
| ISASP Science | Science (5, 8, 11) | Yes | Yes | |||||
| Kansas | General Assessment | ELA, Math, (3–8, 10), Science (5, 8, 11) |
Yes | Yes | Yes | |||
| Kentucky | K-PREP | Reading, Math, (3–8, 11), Science (4,7, 11), Writing (5,6,8,11) | Yes | Yes | Yes | |||
| EoC | EoC: English II, Algebra II, Biology |
No | No | |||||
| Louisiana | LEAP 2025 | English, Math, Science (3–12) | Yes | Yes | Yes | |||
| EoC | English I-III & Algebra I & Geometry & US History |
No | Yes | |||||
| Maine | eMPowerME | Reading, Writing, Language, Math (3–8) |
Yes | Yes | Yes | |
||
| SAT School Day | Math, ELA (HS) | Yes | Yes | |||||
| MEA Science | Science (5, 8, HS) | Yes | Yes | |||||
| Maryland | MCAP | ELA, Math (3–8) | Yes | Yes | Yes | |||
| MCAP | Science (5, 8) | Yes | Yes | |||||
| MCAP EoC | EoC: English, Algebra I-II, Science field testing |
No | No | |||||
| Massachusetts | Next Generation MCAS Tests |
ELA, Math (3–8, 10) | Yes | Yes | Yes | |||
| STE MCAS Tests | Science and Technology/ Engineering (5, 8, 9 or 10) |
Yes | Yes | |||||
| Michigan | M-STEP | ELA, Math (3 to 8, 11), Science (5, 8, 11) |
Yes | Yes | Yes | |||
| SAT with Essay | ELA, Math (11) | Yes | Yes | |||||
| Minnesota | MCA III | Reading (3 to 8, 10), Math (3 to 8, 11), Science (5, 8, HS) |
Yes | Yes | Yes | |||
| Mississippi | MAAP | ELA, Math (3–8, EoC) | Yes | Yes | Yes | |||
| Science Tests | Science (5, 8) | Yes | Yes | |||||
| SATP2 | EoC: Biology I | Yes | Yes | |||||
| Missouri | MAP | ELA, Math (3–8), Science (field testing, no data) |
No | Yes | Yes | |||
| EoC | English I-II, Algebra I-II | Yes | Yes | |||||
| EoC | Biology, Physical Science | No | No | |||||
| Montana | Smarter Balanced | ELA, Math (3–8) | Yes | Yes | Yes | |||
| ACT Plan Writing | ELA, Math, Science, STEM, Writing (11) |
No | Yes | |||||
| CRT Science | Science (4, 8, 10) | Yes | Yes | |||||
| Nebraska | NSCAS | ELA, Math, (3–8, 11), Science (5,8,11) | Yes | Yes | Yes | |||
| Nevada | SBAC & Science | Reading, Math (3–8, 10), Science (5,8, 10) |
Yes | Yes | Yes | |||
| New Hampshire | NH SAS | ELA, Math (3–8), Science (5, 8, 11) |
Yes | Yes | Yes | |||
| SAT School Day | ELA, Math (11) | Yes | Yes | |||||
| New Jersey | PARCC | ELA, Math (3–8) | Yes | Yes | Yes | |||
| NJSLA-S | Science (5, 8, 11) | No | No | |||||
| EoC | ELA (9–11), EoC: Algebra I-II, Geometry |
Yes | Yes | |||||
| New Mexico | PARCC | ELA, Math (3–8, 10, 11) | Yes | Yes | Yes | |||
| SBA | Science (4, 7, 10, 11) | Yes | Yes | |||||
| SBA Spanish | Spanish Reading (4, 7, 10-11) | Yes | Yes | |||||
| New York | Elementary/Intermed- iate Tests |
ELA, Math (3–8) Science (4, 8) |
Yes | Yes | Yes | |||
| Regents Exams Academic |
EoC: ELA, Algebra I-II, Geometry |
Yes | Yes | |||||
| Regents Exams School Quality |
EoC: Living Environment, Physical Setting: Physics, Chemistry, Earth Science |
Yes | Yes | |||||
| North Carolina | EOG Test | Reading, Math (3–8), Science (5, 8) |
Yes | Yes | Yes | |||
| EOC Test | EOC: NC Math I, Biology, English II, NC Math 3 |
Yes | Yes | |||||
| North Dakota | NDSA | Reading, Math (3–8, 10) | Yes | Yes | Yes | |||
| NDSA Science | Science (4, 8, 11) | No | No | |||||
| ACT May be used instead |
English, Reading, Math, Science (11) |
Yes | Yes | |||||
| Ohio | OST | Math, Reading (3–8), Science (5, 8) |
Yes | Yes | Yes | |||
| EoC Exams | EoC: Algebra I, Geometry, Integrated Math I-II, Biology, English I- II |
Yes | Yes | |||||
| Oklahoma | OSTP 3–8 | ELA, Math, (3–8), Science (5, 8) | No | Yes | Yes | |||
| High School OSTP |
Science (11) | No | Yes | |||||
| ACT or SAT | ELA, Math (11) | No | Yes | |||||
| Oregon | Oregon’s Summa- tive Assessments |
ELA, Math (3–8, 11) | Yes | Yes | Yes | |||
| Oregon’s Science Summative Assessment |
Science (5, 8, 11) | Yes | Yes | |||||
| Pennsylvania | PSSA | ELA, Math (3–8), Science (4, 8) | Yes | Yes | Yes | |||
| Keystone Exam | Literature, Algebra, Biology (11) | Yes | Yes | |||||
| Rhode Island | RICAS | ELA, Math (3–8) | Yes | Yes | Yes | |||
| SAT | ELA, Math (11) | Yes | Yes | |||||
| RI NGSA | Science (5, 8, 11) | Yes | Yes | |||||
| South Carolina | SCPASS | Science (4,8) | Yes | Yes | Yes | |||
| SC READY | ELA, Math (3–8) | Yes | Yes | |||||
| EoCEP (graded A-F) |
EoC: Algebra I, Biology I, English I, Reading, Writing |
Yes | Yes | |||||
| South Dakota | South Dakota ELA Assessment and South Dakota Math Assessment |
ELA and Math. (3–8, 11) | Yes | Yes | Yes | |||
| South Dakota Science Assess- ment |
Science (5, 8, 11) | Yes | Yes | |||||
| Tennessee | TNReady | ELA, Math, (3–8) | Yes | Yes | Yes | |||
| TNReady | Science (5–8, HS) | No | No | |||||
| EoC | EoC: Algebra l-ll, Integrated Math l-lll, English I-II |
Yes | Yes | |||||
| EoC | Biology | No | No | |||||
| ACT or SAT | Cohort: English, Math, Reading, Science, Composite |
No | No | |||||
| Texas | STAAR with Spanish version |
Math, Reading (3–8), Writing (4, 7), Science (5, 8), Spanish version (3–5) |
Yes | Yes | Yes | |||
| STAAR EoC | EoC: English I, Reading, Writing, Algebra I, Biology |
Yes | Yes | |||||
| Utah | RISE | ELA, Math (3–8) Science (4–8) | Yes | Yes | Yes | |||
| Utah Aspire Plus | ELA, Math, Science (9–10) | No | Yes | |||||
| Vermont | Smarter Balanced | ELA, Math (3–9) | Yes | Yes | Yes | |||
| Vermont Science Assessment | Science (5, 8, 11) | Yes | Yes | |||||
| Virginia | SOL | Reading, Math (3–8), Science (5, 8), Writing (8) |
Yes | Yes | Yes | |||
| EoC SOL Test | EoC: Reading, Writing, Algebra I-II, Geometry, Biology, Earth Science, Chemistry |
Yes | Yes | |||||
| Washington | Smarter Balanced | ELA, Math (3–8, 11) | Yes | Yes | Yes | |||
| WCAS | Science (5, 8, 11) | Yes | Yes | |||||
| West Virginia | WVGSA | ELA/Literacy, Math (3–8) | Yes | Yes | Yes | |||
| WVGSA Science | Science (5, 8, 11) | Yes | Yes | |||||
| SAT School Day | Reading, Math, Writing, Essay, Science (11) |
Yes | Yes | |||||
| Wisconsin | Wisconsin Forward | ELA, Math (3–8), Science (4, 8) | Yes | Yes | Yes | |||
| ACT | English, Reading, Math, Science, Writing (11) |
Yes | Yes | |||||
| Wyoming | WY-TOPP | Reading, Math (3–8,11), Science (4, 8, 11) |
Yes | Yes | Yes | |||
| Total Regular States (N=50) | 39 | 10 | 1 | 0 | ||||
| Unique States | Reporting Summary | |||||||
| American Samoa | SBA | Reading (3, 5, 7, 10), Math (3, 5, 7, 10) |
No | No | Yes | |||
| ACT | English, Reading, Math, Science (11, 12) |
No | No | |||||
| Bureau of Indian Education |
Individual state assessments | 3-HS: By State: ELA, Reading, Math, Science |
No | No | Yes | |||
| Commonwealth of Northern Mariana Islands |
ACT ASPIRE | English, Writing, Reading, Math, Science (3–10) |
No | No | Yes | |||
| District of Columbia | PARCC | ELA, Math (3–8), HS: ELA I-II, Algebra I-II, Geometry, Integrated Math |
Yes | Yes | Yes | |||
| DC Science | Science (5, 8, HS) | Yes | Yes | |||||
| Federated States of Micronesia |
NMCT | Reading (6, 8, 10), Math (4, 6, 8, 10) |
No | No | Yes | |||
| Guam | ACT ASPIRE | English, Math, Reading (3–10) | Yes | Yes | Yes | |||
| SBA | Algebra I-II, Geometry, Science (1–8) 9 to 12: Biology, Anatomy and Physiology, Chemistry, Physical Science, Algebra I-II, Geometry |
No | No | |||||
| Palau | No Information | Yes | ||||||
| Puerto Rico | Academic Achievement Test | Spanish, English, Math (3–8, 11), Science (4, 8, 11) |
No | No | Yes | |||
| Republic of Marshall Islands |
MISAT | English Reading, Math, Marshallese Reading, Science (3, 6, 8, 10, 12) |
No | No | Yes | |||
| U.S. Department of Defense Education Activity |
No Title I Assessment |
Yes | ||||||
| U.S. Virgin Islands | Smarter Balanced | ELA, Math (3–8, 11) | No | Yes | Yes | |||
| Total Unique States (N=11) | 1 | 1 | 1 | 8 | ||||
| Total Regular and Unique States (N=61) | 40 | 11 | 2 | 8 | ||||
| Percent of All States | 66% | 18% | 3% | 13% | ||||
Table B-2. Reporting for Students with Disabilities on General Assessments Not Used for Title I: Reading/English Language Arts, Math, and Science
| State | Test | Subject Areas/Grade | Partici-pation | Perform-ance | All Used for Title I | Part. and Perf. All Tests | No Publicly Reported Data Found |
|---|---|---|---|---|---|---|---|
| Regular States | Reporting Summary | ||||||
| Alabama | ACT College Readiness Test | English, Reading, Math, Science with Writing (11) | No | No | Yes | ||
| Alaska | None | - | - | Yes | |||
| Arizona | None | - | - | Yes | |||
| Arkansas | None | - | - | Yes | |||
| California | None | - | - | Yes | |||
| Colorado | None | - | - | Yes | |||
| Connecticut | None | - | - | Yes | |||
| Delaware | None | - | - | Yes | |||
| Florida | None | - | - | Yes | |||
| Georgia | None | - | - | Yes | |||
| Hawaii | EoC | EoC: Algebra I-II | No | No | Yes | ||
| Idaho | None | - | - | Yes | |||
| Illinois | None | - | - | Yes | |||
| Indiana | IREAD-3 | Reading (3) | Yes | Yes | Yes | ||
| Iowa | None | - | - | Yes | |||
| Kansas | None | - | - | Yes | |||
| Kentucky | ACT | English, Reading, Math, Science (11) | No | No | Yes | ||
| Louisiana | ACT | English, Reading, Math, Science (12) | No | No | Yes | ||
| Maine | None | - | - | Yes | |||
| Maryland | None | - | - | Yes | |||
| Massachusetts | None | - | - | Yes | |||
| Michigan | None | - | - | Yes | |||
| Minnesota | None | - | - | Yes | |||
| Mississippi | None | - | - | Yes | |||
| Missouri | None | - | - | Yes | |||
| Montana | None | - | - | Yes | |||
| Nebraska | ACT | ELA, Math, Science (11) | Yes | Yes | Yes | ||
| Nevada | ACT | Math, Reading, Science, Writing (11) | Yes | Yes | Yes | ||
| New Hampshire | None | - | - | Yes | |||
| New Jersey | None | - | - | Yes | |||
| New Mexico | None | - | - | Yes | |||
| New York | None | - | - | Yes | |||
| North Carolina | ELA Reading Test | Reading (3) | No | No | Yes | ||
| North Dakota | ACT Workkeys | Applied Math (11) | No | No | Yes | ||
| Ohio | None | - | - | Yes | |||
| Oklahoma | None | - | - | Yes | |||
| Oregon | None | - | - | Yes | |||
| Pennsylvania | None | |
- | - | Yes | ||
| Rhode Island | None | - | - | Yes | |||
| South Carolina | ACT Work Keys | Reading for Information, Applied Math (3rd yr HS) | Yes | Yes | Yes | ||
| South Dakota | None | - | - | Yes | |||
| Tennessee | None | - | - | Yes | |||
| Texas | None | - | - | Yes | |||
| Utah | K3 Reading Competency | Reading (K-3) Note: has grade 3, so included. | No | No | Yes | ||
| Vermont | None | - | - | Yes | |||
| Virginia | None | - | - | Yes | |||
| Washington | None | - | - | Yes | |||
| West Virginia | None | - | - | Yes | |||
| Wisconsin | ACT Aspire | English, Reading, Math, Science, Writing (9, 10) | Yes | Yes | Yes | ||
| Wyoming | ACT or Workkeys | English, Math, Reading, Writing, Science (11, 12) | No | No | Yes | ||
| Total Regular States (N=50) | 37 | 5 | 8 | ||||
| Unique States | Reporting Summary | ||||||
| American Samoa | None | - | - | Yes | |||
| Bureau of Indian Education | Assessments by state | By state | - | - | No info. | ||
| Commonwealth of Northern Mariana Islands | None | - | - | Yes | |
||
| District of Columbia | None | - | - | Yes | |||
| Federated States of Micronesia | None | - | - | Yes | |||
| Guam | None | - | - | Yes | |||
| Palau | No information | - | - | No Info. | |||
| Puerto Rico | None | - | - | Yes | |||
| Republic of Marshall Islands | None | - | - | Yes | |||
| U.S. Department of Defense Education Activity | CCRS Summative Assessment | ELA (6–8, 10), Math (3–6), EoC: Algebra I-II, Geometry | No | No | Yes | ||
| PSAT 8–9, PSAT/NMSQT | Reading, Writing/ Language, Math (8–9, 10, 11) | No | No | ||||
| U.S. Virgin Islands | None | - | - | Yes | |||
| Total Unique States (N=11) | 10 | 0 | 1 | ||||
| Total Regular and Unique States (N=61) | 47 | 5 | 9 | ||||
| Percent of All States | 77% | 8% | 15% | ||||
Table B-3. Disaggregated Special Education Data for General Assessments: Other Content Assessments
| State | Test | Subject Areas/ Grade | Partici-pation | Perform-ance | All Used for Title I | Part. and Perf. All Tests | Part. and Perf. Some Tests | Perf. Only Some or All Tests | No Publicly Reported Data Found |
|---|---|---|---|---|---|---|---|---|---|
| Regular States | Reporting Summary | ||||||||
| Alabama | None | - | - | Yes | |||||
| Alaska | None | - | - | Yes | |||||
| Arizona | None | - | - | Yes | |||||
| Arkansas | None | - | - | Yes | |||||
| California | CAASPP (Spanish STS) | Spanish ELA (2–11) | No | No | Yes | ||||
| Colorado | CMAS | Social Studies (4, 7) | Yes | Yes | Yes | ||||
| CLAS | Spanish ELA (3, 4) | No | No | ||||||
| Connecticut | None | - | - | Yes | |||||
| Delaware | SAT School Day | Social Studies (HS) | No | No | Yes | ||||
| Florida | FSA EoC Assessments | EoC; US History or Civics | No | Yes | Yes | ||||
| Georgia | Georgia Milestones | Social Studies (5, 8, HS), EoC: US History/ Economics | Yes | Yes | Yes | ||||
| Hawaii | None | - | - | Yes | |||||
| Idaho | None | - | - | Yes | |||||
| Illinois | None | - | - | Yes | |||||
| Indiana | ISTEP+ | Social Studies (5, 7) | Yes | Yes | Yes | ||||
| ILearn | EoC: US Government | Yes | Yes | ||||||
| Iowa | None | - | - | Yes | |||||
| Kansas | None | - | - | Yes | |||||
| Kentucky | K-PREP and EoC | Social Studies (5, 8), EoC: History | Yes | Yes | Yes | ||||
| Louisiana | LEAP 2025 | Social Studies (unclear grades) | Yes | Yes | Yes | ||||
| EoC | US History | No | Yes | ||||||
| Maine | None | - | - | Yes | |||||
| Maryland | HSA | EoC: Data Analysis, Government | Yes | Yes | Yes | ||||
| Massachusetts | None | - | - | Yes | |||||
| Michigan | M-Step | Social Studies (5, 8, 11) | Yes | Yes | Yes | ||||
| Minnesota | None | - | - | Yes | |||||
| Mississippi | SATP2 | EoC: US History | No | Yes | Yes | ||||
| Missouri | EoC Assessments | EoC: American History, Government | No | No | Yes | ||||
| Montana | None | - | - | Yes | |||||
| Nebraska | None | - | - | Yes | |||||
| Nevada | None | - | - | Yes | |||||
| New Hampshire | None | - | - | Yes | |||||
| New Jersey | None | - | - | Yes | |||||
| New Mexico | None | - | - | Yes | |||||
| New York | Regents Exams School Quality | EoC: US History and Government, Transitional Exam in Global History and Geography, New Frame-work Global History & Geography II | Yes | Yes | Yes | ||||
| North Carolina | None | - | - | Yes | |||||
| North Dakota | ACT Workkeys | Graphic Literacy, Work-place Documents (11) | No | No | Yes | ||||
| Ohio | Ohio EoC Exams | EoC: American US History, American Government | Yes | Yes | Yes | ||||
| Oklahoma | High School OSTP | US History (11) | No | No | Yes | ||||
| Oregon | Performance Task System | Social Studies (5, 8, 11) | No | No | Yes | ||||
| Pennsylvania | None | - | - | Yes | |||||
| Rhode Island | None | - | - | Yes | |||||
| South Carolina | ACT Work Keys | Locating Information, Essential Soft Skills (3rd yr HS) | Yes | Yes | Yes | ||||
| SCPASS | Social Studies (5, 7) | Yes | Yes | ||||||
| EoCEP | EoC: US History and the Constitution | Yes | Yes | ||||||
| South Dakota | None | - | - | Yes | |||||
| Tennessee | EoC | EoC: US History, Geography | Yes | Yes | Yes | ||||
| TCAP | Social Studies (6, 8) | Yes | Yes | ||||||
| Texas | STAAR | Social Studies (8) | Yes | Yes | Yes | ||||
| STAAR EoC | EoC: US History | Yes | Yes | ||||||
| Utah | None | - | - | Yes | |||||
| Vermont | None | - | - | Yes | |||||
| Virginia | EoC SOL Test | EoC: Virginia and US History, World Geo-graphy, World History I-II | Yes | Yes | Yes | |
|||
| Content Specific SOL History Test | Upper elementary or middle school: Virginia Studies, Civics and Economics | Yes | Yes | ||||||
| Washington | None | - | - | Yes | |||||
| West Virginia | None | - | - | Yes | |||||
| Wisconsin | Wisconsin Forward | Social Studies (4, 8, 10) | Yes | Yes | Yes | ||||
| Wyoming | None | - | - | Yes | |||||
| Total Regular States (N=50) | 28 | 12 | 2 | 2 | 6 | ||||
| Unique States | Reporting Summary | ||||||||
| American Samoa | None | - | - | Yes | |||||
| Bureau of Indian Education | Assessments by state | By state | - | - | No info. | ||||
| Commonwealth of Northern Mariana Islands | SBA | Chamorro and Carolinian Language Heritage Studies (4, 6, 8, 9 to 12) | No | No | |
|
Yes | ||
| EoC | EoC: NMI History | No | No | ||||||
| District of Columbia | None | - | - | Yes | |||||
| Federated States of Micronesia | None | - | - | Yes | |||||
| Guam | SBA | US Government, US History, World History, Guam History, and Geography | No | No | Yes | ||||
| Palau | No information | - | - | No Info. | |||||
| Puerto Rico | None | - | - | Yes | |||||
| Republic of Marshall Islands | MISAT | Social Studies (8) | No | No | Yes | ||||
| U.S. Department of Defense Education Activity | Social Studies | Social Studies (3–12) | No | No | Yes | ||||
| U.S. Virgin Islands | None | - | - | Yes | |||||
| Total Unique States (N=11) | 7 | 0 | 0 | 0 | 4 | ||||
| Total Regular and Unique States (N=61) | 35 | 12 | 2 | 2 | 10 | ||||
| Percent of All States (Note: 99% due to rounding) | 57% | 20% | 3% | 3% | 16% | ||||
Table B-4. Disaggregated Special Education Data for AA-AAAS: Reading/ELA, Math, and Science
| State | Test | Subject Areas/ Grade | Partici-pation | Perform-ance | Partic. and Perf. All Tests | Partic. and Perf. Some Tests | Part. Only All Tests | Perf. Only All Tests | No Publicly Reported Data Found |
|---|---|---|---|---|---|---|---|---|---|
| Regular States | Reporting Summary | ||||||||
| Alabama | Alabama Alternate Assessment | Reading, Math (3–8, 10), Science (5, 7, 10) | Yes | Yes | Yes | ||||
| Alaska | DLM | ELA and Math (3–10), Science (4, 8, 10) | Yes | Yes | Yes | ||||
| Arizona | MSAA, AIMS-A Science | ELA, Math (3–8, 11), Science (4, 8, 10) | Yes | Yes | Yes | ||||
| Arkansas | DLM | ELA, Math, Science (3–10) | Yes | Yes | Yes | ||||
| California | CAA | ELA, Math (3–8, 11) | Yes | Yes | Yes | ||||
| CAA Science | Science (5, 8, once in HS, field testing) | No | No | ||||||
| Colorado | CoAlt | ELA, Math (3–11) | Yes | Yes | Yes | ||||
| CoAlt Science | Science (5, 8, HS) | Yes | Yes | ||||||
| Connecticut | CTAA | ELA, Math (3–8, 11) | Yes | Yes | Yes | ||||
| CTAS | Science (5, 8, 11 field testing) | No | No | ||||||
| Delaware | DeSSA-Alt | Reading, Math (3–8, 11), Science (5, 8, 10, 11) | Yes | Yes | Yes | ||||
| Florida | FSAA with Datafolio Tier | ELA (3–10), Math (3–8), Science (3, 5, 8), EoC: Algebra I, Geometry, Biology | Yes | Yes | Yes | ||||
| Georgia | Alternate Assessment | ELA, Math (K, 3–8, HS), Science (5, 8, HS) | Yes | Yes | Yes | |
|||
| Hawaii | HSA – Alt | ELA, Math (3–8, 11), Science (4, 8, 11) | Yes | Yes | Yes | ||||
| Idaho | IDAA | ELA, Math, (3–8, HS), Science (5, 7, 10) | No | No | Yes | ||||
| Illinois | DLM | ELA, Math (3–8, 11) | Yes | Yes | Yes | ||||
| DLM Science | Science (5, 8, 11) | Yes | Yes | ||||||
| Indiana | ISTAR | ELA, Math (3–8, 10), Science (4, 7) | No | No | Yes | ||||
| Iowa | IAA | Reading, Math (3–8, 11) | No | No | Yes | ||||
| IAA Science | Science (5, 8, 11) | No | No | ||||||
| Kansas | DLM | ELA, Math (3–8, 10), Science (5, 8, 11) | Yes | No | Yes | ||||
| Kentucky | Alternate K-PREP | Reading (3–9), Math (3–8,10), Writing (4, 5, 6, 8, 10, 11), Science (4, 7, 11) | Yes | Yes | Yes | ||||
| Louisiana | LEAP Connect | Reading, Math (3–11), Science (4, 8, 11) | Yes | Yes | Yes | ||||
| Maine | MSAA, PAAP Science | ELA/Literacy, Math (3–8, HS), Science (5, 8, HS) | Yes | Yes | Yes | ||||
| Maryland | MCAP Alternate | Math, Reading, (3–8, 11), Science (5, 8, 11) | Yes | Yes | Yes | ||||
| Massachusetts | MCAS-Alt | ELA, Math (3–8, 10), Science and Technology/ Engineering (5, 8, 9, or 10) | Yes | Yes | Yes | ||||
| Michigan | MI-Access Functional Independence | ELA, Math, (3–8, 11), Science (4, 7, 11) | Yes | Yes | Yes | ||||
| MI-Access Supported Independence | ELA, Math (3–8, 11), Science (4, 7, 11) | Yes | Yes | ||||||
| MI-Access Participation | ELA, Math (3–8, 11), Science (4, 7, 11) | Yes | Yes | ||||||
| Minnesota | MTAS III | Reading, Math (3–8, HS), Science (5, 8, HS) | Yes | Yes | Yes | ||||
| Mississippi | DLM | ELA, Math (3–8, HS), Science (5, 8, HS) | Yes | Yes | Yes | ||||
| Missouri | MAPA | ELA (3–8, 11) Math (3–8, 10), Science (5, 8, 11) | No | Yes | Yes | ||||
| Montana | MSAA | ELA, Math (3–8, 10) | Yes | Yes | Yes | ||||
| CRT Alternate | Science (4, 8, 10) | Yes | Yes | ||||||
| Nebraska | NESA-M and NESA-AAM | ELA, Math (3–8, 11), Science (5,8,11) | No | No | Yes | ||||
| Nevada | NAA | ELA, Math (3–8, 11), Science (5, 8, 10) | Yes | Yes | Yes | ||||
| New Hampshire | DLM | Reading, Math (3–8, 11), Science (5, 8, 11) | Yes | Yes | Yes | ||||
| New Jersey | DLM | ELA, Math (3–8, 11) | Yes | Yes | Yes | ||||
| APA | Science (5, 8, 11) | No | No | ||||||
| New Mexico | NMAPA | ELA, Math (3–8, 10, 11), Science (4, 7, 11) | Yes | Yes | Yes | ||||
| New York | NYSAA | ELA, Math (3–8, HS), Science (4, 8, HS) | Yes | Yes | Yes | ||||
| North Carolina | NCEXTEND1 | Reading, Math (3–8), Science (5, 8), 10: Math I, Biology, English II | Yes | Yes | Yes | ||||
| North Dakota | DLM | Reading/Language Arts, Math (3–8, HS) | Yes | Yes | Yes | ||||
| NDAA Science | Science (4, 8, 11) | No | No | ||||||
| Ohio | AASCD | ELA, Math (3–8), Science (5, 8) | Yes | Yes | Yes | ||||
| OHS-AASCD | ELA II, Math II, Geometry, Biology (HS) | Yes | Yes | ||||||
| Oklahoma | OAAP | ELA, Math (3–8, HS), Science (5, 8) | No | Yes | Yes | ||||
| Oregon | Oregon Extended Assessment | Reading, Math (3–8, 11), Science (5, 8, 11) | Yes | Yes | Yes | ||||
| Pennsylvania | PASA | ELA, Math (3–8, 11), Science (4, 8, 11) | Yes | Yes | Yes | ||||
| Rhode Island | DLM | ELA, Math (3–8, 11), Science (5, 8, 11) | Yes | Yes | Yes | ||||
| South Carolina | NCSC | ELA, Math (3–8, 11) | No | No | Yes | ||||
| SC-ALT | Science (4, 6, 8, 11), HS: Biology I, English I, Algebra I | No | No | ||||||
| South Dakota | South Dakota ELA and Math Alternate Assessments | ELA, Math (3–8, 11) | Yes | Yes | Yes | ||||
| SDSA-Alt | Science (5, 8, 11) | Yes | Yes | ||||||
| Tennessee | MSAA | ELA, Math (3–8, 11) | Yes | Yes | Yes | ||||
| TCAP-Alt | Science (3–8), Biology (10) | No | No | ||||||
| Texas | STAARALT 2 | Math, Reading (3–8), Writing (4, 7), Science (5, 8) | Yes | Yes | Yes | ||||
| STAARALT2 EoC | EoC: English I-II, Algebra I, Biology | Yes | Yes | ||||||
| Utah | DLM | ELA, Math (3–11) | Yes | Yes | Yes | ||||
| UAA | Science (4–11) | Yes | Yes | ||||||
| Vermont | VTALT | ELA, Math (3–11) | Yes | Yes | Yes | ||||
| VTALT | Science (5, 8, 11) | Yes | Yes | ||||||
| Virginia | VAAP | Reading, Math, Science, Writing (3–8, HS) | Yes | Yes | Yes | ||||
| Washington | WA-AIM | ELA, Math (3–8, 11), Science (5, 8, 11) | Yes | Yes | Yes | ||||
| West Virginia | WVASA – DLM | Reading, Math (3–8, HS) | Yes | Yes | Yes | ||||
| WVASA Science | Science (5, 8, 11) | No | No | ||||||
| Wisconsin | DLM | ELA, Math (3–11), Science (4, 8–11) | Yes | Yes | Yes | ||||
| Wyoming | WY-ALT | ELA, Math (3–8, HS), Science (4, 8, 9 to 11) | Yes | Yes | Yes | ||||
| Total Regular States (N=50) | 36 | 6 | 1 | 2 | 5 | ||||
| Unique States | Reporting Summary | ||||||||
| American Samoa | Alternate Assessment | Reading, Math (3–8, 10) | No | No | Yes | ||||
| Bureau of Indian Education | Alternates by State | By state | No | No | Yes | ||||
| Commonwealth of Northern Mariana Islands | MSAA | ELA, Math (3–8, 11) | No | No | Yes | ||||
| District of Columbia | MSAA | ELA, Math (3–8, HS) | No | No | Yes | ||||
| DC Science Alternate | Science (5, 8, HS) | No | No | ||||||
| Federated States of Micronesia | No Title I alternate assessment | - | - | Yes | |||||
| Guam | NCSC and DoE Alternate | ELA, Math (3–8, 11), and DoE Alternate in ELA, Math (9, 10) | Yes | Yes | Yes | ||||
| Palau | No Information | No | No | Yes | |||||
| Puerto Rico | Puerto Rico Alternate Assessment | Spanish, English, Math (3–8, 11), Science (4, 8, 11) | No | No | Yes | ||||
| Republic of Marshall Islands | No Title I alternate assessment | - | - | Yes | |||||
| U.S. Department of Defense Education Activity | No Title I alternate assessment | Reading/Language Arts, Math, Science (3–12) These Not Used for Title I | - | - | Yes | ||||
| U.S. Virgin Islands | MSAA | ELA, Math (3–8, 11) | No | No | Yes | ||||
| Total Unique States (N=11) | 1 | 0 | 0 | 0 | 10 | ||||
| Total Regular and Unique States (N=61) | 37 | 6 | 1 | 2 | 15 | ||||
| Percent of All States (Note: 101% due to rounding) | 61% | 10% | 2% | 3% | 25% | ||||
Table B-5 Disaggregated Special Education Data for AA-AAAS: Other Content Areas
| State | Test | Subject Areas/Grades | Partici-pation | Perform-ance | Part. and Perf. All Tests | No Publicly Reported Data Found |
|---|---|---|---|---|---|---|
| Regular States | Reporting Summary | |||||
| Colorado | CoAlt | Social Studies (4, 7) | Yes | Yes | Yes | |
| Florida | FSAA with Datafolio Tier | Social Studies (often 7th) EOC: Civics |
No | No | Yes | |
| Georgia | Alternate Assessment | Social Studies (4, 8, HS) | Yes | Yes | Yes | |
| Indiana | ISTAR | Social Studies (4, 7) | No | No | Yes | |
| Kentucky | Alternate K-PREP | Social Studies (5, 8) | Yes | Yes | Yes | |
| Ohio | HS-AASCD | American US History (HS) | Yes | Yes | Yes | |
| South Carolina | SC-ALT | Social Studies (5, 7), EoC: US History and the Constitution | No | No | Yes | |
| Texas | STAARALT2, EoC | Social Studies (8), EoC: US History | Yes | Yes | Yes | |
| Wisconsin | DLM | Social Studies (4, 8, 10) | Yes | Yes | Yes | |
| Total Regular States (N=9) | 6 | 3 | ||||
| Unique States | ||||||
| Total Unique States (N=0) | 0 | 0 | ||||
| Total Regular and Unique States (N=9) | 6 | 3 | ||||
| Percent of All States with Other Content | 67% | 33% | ||||
Table B-6. Disaggregated ELs in Special Education Data on General Assessments Used for Title I: Reading/English Language Arts, Math, and Science
| State | Test | Subject Areas/ Grade | Partici-pation | Perfom-ance | Part. and Perf. All Tests | Part. and Perf. Some Tests | No Publicly Reported Data Found |
|---|---|---|---|---|---|---|---|
| Regular States | Reporting Summary | ||||||
| Alabama | Scantron | ELA, Math (3–8, HS), Science (5, 7, HS) | No | No | Yes | ||
| Alaska | PEAKS | ELA, Math (3–10) | No | No | Yes | ||
| Alaska Science Assessment | Science (4, 8, 10) | No | No | ||||
| Arizona | AZMerit | ELA, Math (3–8), HS: English (9–11), Algebra I-II, Geometry | No | No | Yes | ||
| AIMS Science | Science (4, 8, HS) | No | No | ||||
| Arkansas | ACT Aspire | English, Reading, Math, Science, and Writing (3–10) | No | No | Yes | ||
| California | Smarter Balanced | ELA, Math (3–8, 11) | No | No | Yes | ||
| CAST | Science (5, 8, once in HS, field testing) | No | No | ||||
| Colorado | CMAS | ELA/ Literacy, Math (3–8), HS: Algebra I, Geometry, Integrated Math I-II | No | No | Yes | ||
| CMAS | Science (4, 5, 7, 8, HS) | No | No | ||||
| Connecticut | Smarter Balanced | ELA, Math (3–8) | No | No | Yes | ||
| NGSS Science | Science (5, 8, 11) | No | No | ||||
| Connecticut SAT School Day | Evidenced Based Reading, Writing, Math (11) | No | No | ||||
| Delaware | Smarter Balanced | ELA, Math (3–8) | No | No | Yes | ||
| SAT School Day | ELA, Essay, Math, Science (HS) | No | No | ||||
| Florida | FSA | ELA, Math (3–10) | No | No | Yes | ||
| FSA EoC Assessments | EoC: Algebra I, Geometry, Biology I | No | No | ||||
| Statewide Science Assessment | Science (5, 8) | No | No | ||||
| Georgia | Georgia Milestones | ELA, Math (3–8), Science (5, 8, HS), HS (EoC): 9th Literature and Composition, American Literature and Composition, Coordinate Algebra, Algebra I, Geometry, Analytic Geometry, Physical Science, Biology | No | No | Yes | ||
| Hawaii | Smarter Balanced | ELA, Math (3–8, 11) | No | No | Yes | ||
| HSA Science | Science (4, 8) | No | No | ||||
| EoC | Biology I (HS) | No | No | ||||
| KAEO | Hawaiian Language Arts, Math (3–8), Science (4, 8) | No | No | ||||
| Idaho | ISAT | ELA, Math (3–8, HS), Science (5, 7, HS) | No | No | Yes | ||
| Illinois | PARCC | ELA, Math (3–8) | No | No | |
Yes | |
| SAT | ELA, Math (HS) | No | No | ||||
| ISA | Science (5, 8, 10) | No | No | ||||
| Indiana | ISTEP+ | Reading, Math (3–8, 10) | No | No | Yes | ||
| ISTEP+ | Science (4, 6) | No | No | ||||
| ILearn | EoC: Biology | No | No | ||||
| Iowa | ISASP | Reading, Math (3–8, 11) | No | No | Yes | ||
| ISASP Science | Science (5, 8, 11) | No | No | ||||
| Kansas | General Assessment | ELA, Math, (3–8, 10), Science (5, 8, 11) | Yes | Yes | Yes | ||
| Kentucky | K-PREP | Reading, Math (3–8, 11), Science (4, 7, 11), Writing (5, 6, 8, 11) | No | No | Yes | ||
| EoC | EoC: English II, Algebra II, Biology | No | No | ||||
| Louisiana | LEAP 2025 | English, Math, Science (3–12) | No | No | Yes | ||
| EoC | English I-III & Algebra 1 & Geometry | No | No | ||||
| Maine | eMPowerME | Reading, Writing, Language, Math (3–8) | No | No | Yes | ||
| MEA Science | Science (5, 8, HS) | No | No | ||||
| SAT School Day | Math, ELA (HS) | No | No | ||||
| Maryland | MCAP | ELA, Math (3–8) | No | No | Yes | ||
| MCAP | Science (5, 8) | No | No | ||||
| MCAP EoC | EoC: English, Algebra I-II, Science field testing | No | No | ||||
| Massachusetts | Next Generation MCAS Tests | ELA, Math (3–8) | No | No | Yes | ||
| STE MCAS Tests | Science and Technology/ Engineering (5, 8, 9 or 10) | No | No | ||||
| Michigan | M-STEP | ELA, Math (3–8, 11), Science (5, 8, 11) | No | No | Yes | ||
| SAT with Essay | ELA, Math (11) | No | No | ||||
| Minnesota | MCA III | Reading (3–8, 10), Math (3–8, 11), Science (5, 8, HS) | Yes | Yes | Yes | ||
| Mississippi | MAAP | ELA, Math (3–8, EoC) | No | No | Yes | ||
| Science Tests | Science (5, 8) | No | No | ||||
| SATP2 | EoC: Biology I | No | No | ||||
| Missouri | MAP | ELA, Math (3–8), Science (field testing, no data) | No | No | Yes | |
|
| EoC | English I-II, Algebra I-II | Yes | Yes | ||||
| EoC | Biology, Physical Science | No | No | ||||
| Montana | Smarter Balanced | ELA, Math (3–8) | No | No | Yes | ||
| ACT Plan Writing | ELA, Math, Science, STEM, Writing (11) | No | No | ||||
| CRT Science | Science (4, 8, 10) | No | No | ||||
| Nebraska | NSCSA | ELA, Math (3–8, 11), Science (5, 8, 11) | No | No | Yes | ||
| Nevada | SBAC & Science | Reading, Math (3–8, 10), Science (5, 8, 10) | Yes | Yes | Yes | ||
| New Hampshire | NH SAS | ELA, Math (3–8), Science (5, 8, 11) | No | No | Yes | ||
| SAT School Day | ELA, Math (11) | No | No | ||||
| New Jersey | PARCC | ELA, Math (3–8) | No | No | |
Yes | |
| NJSLA-S | Science (5, 8, 11) | No | No | ||||
| EoC | ELA (9–11), EoC: Algebra I-II, Geometry | No | No | ||||
| New Mexico | PARCC | ELA, Math (3–8, 10, 11) | No | No | Yes | ||
| SBA | Science (4, 7, 10, 11) | No | No | ||||
| SBA Spanish | Spanish Reading (4, 7, 10–11) | No | No | ||||
| New York | Elementary/ Intermediate Tests | ELA, Math (3–8), Science (4,8) Note: Science not reported for this subgroup | Yes | Yes | Yes | ||
| Regents Exams Academic | EoC: ELA, Algebra I-II, Geometry | No | No | ||||
| Regents Exams School Quality | EoC: Living Environment, Physical Setting: Physics, Chemistry, Earth Science | No | No | ||||
| North Carolina | EOG Test | Reading, Math (3–8), Science (5, 8) | No | No | Yes | ||
| EOC Test | EOC: NC Math I, Biology, English II, NC Math 3 | No | No | ||||
| North Dakota | NDSA | Reading, Math (3–8, 10) | No | No | Yes | ||
| NDSA Science | Science (4, 8, 11) | No | No | ||||
| ACT May be used instead | English, Reading, Math, Science (11) | No | No | ||||
| Ohio | OST | Math, Reading (3–8), Science (5, 8) | No | No | Yes | ||
| EoC Exams | EoC: Algebra I, Geometry, Integrated Math I-II, Biology, English I-II | No | No | ||||
| Oklahoma | OSTP 3–8 | ELA, Math, (3–8), Science (5, 8) | No | No | Yes | ||
| High School OSTP | Science (11) | No | No | ||||
| ACT or SAT | ELA, Math (11) | No | No | ||||
| Oregon | Oregon’s Summative Assessments | ELA, Math (3–8, 11) | No | No | Yes | ||
| Oregon Science Summative Assessment | Science (5, 8, 11) | No | No | ||||
| Pennsylvania | PSSA | ELA, Math (3–8), Science (4, 8) | No | No | Yes | ||
| Keystone Exam | Literature, Algebra, Biology (11) | No | No | ||||
| Rhode Island | RICAS | ELA, Math (3–8) | No | No | Yes | ||
| SAT | ELA, Math (11) | No | No | ||||
| RI NGSA | Science (5, 8, 11) | No | No | ||||
| South Carolina | SCPASS | Science (4, 8) | No | No | Yes | ||
| SC READY | ELA, Math (3–8) | No | No | ||||
| EoCEP (graded A-F) | EoC: Algebra I, Biology I, English I, Reading, Writing | No | No | ||||
| South Dakota | South Dakota ELA Assessment and South Dakota Math Assessment | ELA and Math. (3–8, 11) | No | No | Yes | ||
| South Dakota Science Assessment | Science (5, 8, 11) | No | No | ||||
| Tennessee | TCAP | ELA, Math (3–8), Science (5–8, HS) | No | No | Yes | ||
| EoC | EoC: Algebra l-ll, Integrated Math l-lll, English I-II, Biology | No | No | ||||
| ACT or SAT | Cohort: English, Math, Reading, Science, Composite | No | No | ||||
| Texas | STAAR with Spanish version | Math, Reading, (3–8), Writing (4, 7), Science (5, 8), Spanish version (3–5) | No | No | Yes | ||
| STAAR EoC | EoC: English I, Reading, Writing, Algebra I, Biology | No | No | ||||
| Utah | RISE | ELA, Math, (3–8) Science (4–8) | No | No | Yes | ||
| Utah Aspire Plus | ELA, Math, Science (9–10) | No | No | ||||
| Vermont | Smarter Balanced | ELA, Math (3–9) | No | No | Yes | ||
| Vermont Science Assessment | Science (5, 8, 11) | No | No | ||||
| Virginia | SOL | Reading, Math (3–8), Science (5, 8), Writing (8) | No | No | Yes | ||
| EoC SOL Test | EoC: Reading, Writing, Algebra I-II, Geometry, Biology, Earth Science, Chemistry | No | No | ||||
| Washington | Smarter Balanced | ELA, Math (3–8, 11) | No | No | Yes | ||
| WCAS | Science (5, 8, 11) | No | No | ||||
| West Virginia | WVGSA | ELA/Literacy, Math (3–8) | No | No | Yes | ||
| WVGSA Science | Science (5, 8, 11) | No | No | ||||
| SAT School Day | Reading, Math, Writing, Essay, Science (11) | No | No | ||||
| Wisconsin | Wisconsin Forward | ELA, Math (3–8), Science (4, 8) | No | No | Yes | ||
| ACT | English, Reading, Math, Science, Writing (11) | No | No | ||||
| Wyoming | WY-TOPP | Reading, Math (3–8, 11), Science (4, 8, 11) | No | No | Yes | ||
| Total Regular States (N=50) | 3 | 2 | 45 | ||||
| Unique States | Reporting Summary | ||||||
| American Samoa | SBA | Reading (3, 5, 7, 10), Math (3, 5, 7, 10) | No | No | Yes | ||
| ACT | English, Reading, Math, Science (11, 12) | No | No | ||||
| Bureau of Indian Education | Assessments by state | By State | No | No | Yes | ||
| Commonwealth of Northern Mariana Islands | ACT ASPIRE | English, Writing, Reading, Math, Science (3–10) | No | No | Yes | ||
| District of Columbia | PARCC | ELA, Math (3–8), HS: ELA I-II, Algebra I-II, Geometry, Integrated Math | No | No | Yes | ||
| DC Science | Science (5, 8, HS) | No | No | ||||
| Federated States of Micronesia | NMCT | Reading (6, 8, 10), Math (4, 6, 8, 10) | No | No | Yes | ||
| Guam | ACT ASPIRE | English, Math, Reading (3–10) | No | No | Yes | ||
| SBA | Algebra I-II, Geometry, Science (1–8), 9–12: Biology, Anatomy and Physiology, Chemistry, Physical Science, Algebra I-II, Geometry | No | No | ||||
| Palau | No Information | No | No | Yes | |||
| Puerto Rico | Academic Achievement Test | Spanish, English, Math (3–8, 11), Science (4, 8, 11) | No | No | Yes | ||
| Republic of Marshall Islands | MISAT | English Reading, Marshallese Reading, Math, Science (3, 6, 8, 10, 12) | No | No | Yes | ||
| U.S Department of Defense Education Activity | No Title I Assessment | No | No | Yes | |||
| U.S. Virgin Islands | Smarter Balanced | ELA, Math (3–8, 11) | No | No | Yes | ||
| Total Unique States (N=11) | 0 | 0 | 11 | ||||
| Total Regular and Unique States (N=61) | 3 | 2 | 56 | ||||
| Percent of All States | 5% | 3% | 92% | ||||
Table B-7. Disaggregated ELs in Special Education Data on General Assessments Not Used for Title I: Reading/English Language Arts, Math, and Science
| State | Test | Subject Areas/ Grade | Partici-pation | Perform-ance | All Used for Title I | Part. and Perf. All Tests | No Publicly Reported Data Found |
|---|---|---|---|---|---|---|---|
| Regular States | Reporting Summary | ||||||
| Alabama | ACT | English, Reading, Math, Science with Writing (11) | No | No | Yes | ||
| Alaska | None | - | - | Yes | |||
| Arizona | None | - | - | Yes | |||
| Arkansas | None | - | - | Yes | |||
| California | None | - | - | Yes | |||
| Colorado | None | - | - | Yes | |||
| Connecticut | None | - | - | Yes | |||
| Delaware | None | - | - | Yes | |||
| Florida | None | - | - | Yes | |||
| Georgia | None | - | - | Yes | |||
| Hawaii | EoC | EoC: Algebra I-II | No | No | Yes | ||
| Idaho | None | - | - | Yes | |||
| Illinois | None | - | - | Yes | |||
| Indiana | IREAD-3 | Reading (3) | No | No | Yes | ||
| Iowa | None | - | - | Yes | |||
| Kansas | None | - | - | Yes | |||
| Kentucky | ACT | English, Reading, Math, Science (11) | No | No | Yes | ||
| Louisiana | ACT | English, Reading, Math, Science (12) | No | No | Yes | ||
| Maine | None | - | - | Yes | |||
| Maryland | None | - | - | Yes | |||
| Massachusetts | None | - | - | Yes | |||
| Michigan | None | - | - | Yes | |||
| Minnesota | None | - | - | Yes | |||
| Mississippi | None | - | - | Yes | |||
| Missouri | None | - | - | Yes | |||
| Montana | None | - | - | Yes | |||
| Nebraska | ACT | ELA, Math, Science (11) | No | No | Yes | ||
| Nevada | ACT | Math, Reading, Science, Writing (11) | Yes | Yes | Yes | ||
| New Hampshire | None | - | - | Yes | |||
| New Jersey | None | - | - | Yes | |||
| New Mexico | None | - | - | Yes | |||
| New York | None | - | - | Yes | |||
| North Carolina | ELA Reading Test | Reading (3) | No | No | Yes | ||
| North Dakota | ACT Work Keys | Applied Math (11) | No | No | Yes | ||
| Ohio | None | - | - | Yes | |||
| Oklahoma | None | - | - | Yes | |||
| Oregon | None | - | - | Yes | |||
| Pennsylvania | None | |
- | - | Yes | ||
| Rhode Island | None | - | - | Yes | |||
| South Carolina | ACT Work Keys | Reading for Information, Applied Math (3rd yr HS) | No | No | Yes | ||
| South Dakota | None | - | - | Yes | |||
| Tennessee | None | - | - | Yes | |||
| Texas | None | - | - | Yes | |||
| Utah | K3 Reading Competency | Reading (K-3) Note: Has grade 3, so included. | No | No | Yes | ||
| Vermont | None | - | - | Yes | |||
| Virginia | None | - | - | Yes | |||
| Washington | None | - | - | Yes | |||
| West Virginia | None | - | - | Yes | |||
| Wisconsin | ACT Aspire | English, Reading, Math, Science, Writing (9, 10) | No | No | Yes | ||
| Wyoming | ACT or Workkeys | English, Math, Reading, Writing, Science (11, 12) | No | No | Yes | ||
| Total Regular States (N=50 | 37 | 1 | 12 | ||||
| Unique States | Reporting Summary | ||||||
| American Samoa | None | - | - | Yes | |||
| Bureau of Indian Education | Assessments by state | By state | - | - | No Info. | ||
| Commonwealth of Northern Mariana Islands | None | - | - | Yes | |
||
| District of Columbia | None | - | - | Yes | |||
| Federated States of Micronesia | None | - | - | Yes | |||
| Guam | None | - | - | Yes | |||
| Palau | No information | - | - | No Info. | |||
| Puerto Rico | None | - | - | Yes | |||
| Republic of Marshall Islands | None | - | - | Yes | |||
| U.S. Department of Defense Education Activity | CCRS Summative Assessment | ELA (6–8, 10), Math (3–6), EoC: Algebra I-II, Geometry | No | No | Yes | ||
| PSAT 8–9, PSAT/ NMSQT | Reading, Writing/ Language, Math (8–9, 10, 11) | No | No | ||||
| U.S. Virgin Islands | None | - | - | Yes | |||
| Total Unique States (N=11) | 10 | 0 | 1 | ||||
| Total Regular and Unique States (N=61) | 47 | 1 | 13 | ||||
| Percent of All States | 77% | 2% | 21% | ||||
Table B-8. Disaggregated ELs in Special Education Data for General Assessments: Other Content Assessments
| State | Test | Subject Areas/ Grade | Partici-pation | Perform-ance | All Used for Title I | No Publicly Reported Data Found |
|---|---|---|---|---|---|---|
| Regular States | Reporting Summary | |||||
| Alabama | None | - | - | Yes | ||
| Alaska | None | - | - | Yes | ||
| Arizona | None | - | - | Yes | ||
| Arkansas | None | - | - | Yes | ||
| California | CAASPP (Spanish STS) | Spanish ELA (2–11) | No | No | Yes | |
| Colorado | CMAS | Social Studies (4, 7) | No | No | Yes | |
| CLAS | Spanish ELA (3, 4) | No | No | |||
| Connecticut | None | - | - | Yes | ||
| Delaware | SAT School Day | Social Studies (HS) | No | No | Yes | |
| Florida | FSA EoC Assessments | EoC: U.S. History, or Civics | No | No | Yes | |
| Georgia | Georgia Milestones | Social Studies (5, 8, HS), EoC: US History / Economics | No | No | Yes | |
| Hawaii | None | - | - | Yes | ||
| Idaho | None | - | - | Yes | ||
| Illinois | None | - | - | Yes | ||
| Indiana | ISTEP+ | Social Studies (5, 7) | No | No | Yes | |
| ILearn | EoC: US Government | No | No | |||
| Iowa | None | - | - | Yes | ||
| Kansas | None | - | - | Yes | ||
| Kentucky | K-PREP and EoC | Social Studies (5, 8), EoC: History | No | No | Yes | |
| Louisiana | LEAP2026 | Social Studies (unclear grades) | No | No | Yes | |
| EoC | US History | No | No | |||
| Maine | None | - | - | Yes | ||
| Maryland | HSA | EoC: Data Analysis, Government | No | No | Yes | |
| Massachusetts | None | - | - | Yes | ||
| Michigan | M-Step | Social Studies (5, 8, 11) | No | No | Yes | |
| Minnesota | None | - | - | Yes | ||
| Mississippi | SATP2 | EoC: US History | No | No | Yes | |
| Missouri | EoC Assessments | EoC: American History, Government | No | No | Yes | |
| Montana | None | - | - | Yes | ||
| Nebraska | None | - | - | Yes | ||
| Nevada | None | - | - | Yes | ||
| New Hampshire | None | - | - | Yes | ||
| New Jersey | None | - | - | Yes | ||
| New Mexico | None | - | - | Yes | ||
| New York | Regents Exams School Quality | EoC: US History and Government, Transitional Exam in Global History and Geography, New Framework Global History & Geography II | No | No | Yes | |
| North Carolina | None | - | - | Yes | ||
| North Dakota | ACT Workkeys | Graphic Literacy, Work-place Documents (11) | No | No | Yes | |
| Ohio | Ohio EoC Exams | EoC: American History, American Government | No | No | Yes | |
| Oklahoma | High School OSTP | US History (11) | No | No | Yes | |
| Oregon | Performance Task System | Social Studies (5, 8, 11) | No | No | Yes | |
| Pennsylvania | None | - | - | Yes | ||
| Rhode Island | None | - | - | Yes | ||
| South Carolina | ACT Work Keys | Locating Information, Essential Soft Skills (3rd yr HS) | No | No | Yes | |
| SCPASS | Social Studies (5, 7) | No | No | |||
| EoCEP | EoC: US History and the Constitution | No | No | |||
| South Dakota | None | - | - | Yes | ||
| Tennessee | EoC | EoC: US History, Geography | No | No | Yes | |
| TCAP | Social Studies (6, 8) | No | No | |||
| Texas | STAAR | Social Studies (8) | No | No | Yes | |
| STAAR EoC, | EoC: US History | No | No | |||
| Utah | None | - | - | Yes | ||
| Vermont | None | - | - | Yes | ||
| Virginia | EoC SOL Test | EoC: Virginia and US History, World Geography, World History I-II | No | No | Yes | |
| Content Specific SOL History Test | Upper elementary or middle school: Virginia Studies, Civics and Economics | No | No | |||
| Washington | None | - | - | Yes | ||
| West Virginia | None | - | - | Yes | ||
| Wisconsin | Wisconsin Forward | Social Studies (4, 8, 10) | No | No | Yes | |
| Wyoming | None | - | - | Yes | ||
| Total Regular States (N=50) | 28 | 22 | ||||
| Unique States | Reporting Summary | |||||
| American Samoa | None | - | - | Yes | ||
| Bureau of Indian Education | Assessments by state | By state | - | - | No info. | |
| Commonwealth of Northern Mariana Islands | SBA | Chamorro and Carolinian Language Heritage Studies (4, 6, 8, 9–12) | No | No | Yes | |
| EoC | EoC: NMI History | No | No | |||
| District of Columbia | None | - | - | Yes | ||
| Federated States of Micronesia | None | - | - | Yes | ||
| Guam | SBA | US Government, US History, World History, Guam History, and Geography | No | No | Yes | |
| Palau | No information | - | - | No Info. | ||
| Puerto Rico | None | - | - | Yes | ||
| Republic of Marshall Islands | MISAT | Social Studies (8) | No | No | Yes | |
| U.S. Department of Defense Education Activity | Social Studies | Social Studies (3–12) | No | No | Yes | |
| U.S. Virgin Islands | None | - | - | Yes | ||
| Total Unique States (N=11) | 7 | 4 | ||||
| Total Regular and Unique States (N=61) | 35 | 26 | ||||
| Percent of All States | 57% | 43% | ||||
Table B-9. Disaggregated ELs in Special Education Data for AA-AAAS: Reading/ELA, Math, and Science
| State | Test | Subject Areas/ Grade | Partici-pation | Perform-ance | Part. and Perf. All Tests | Part. and Perf. Some or All Tests | Part. Only All Tests | Perf. Only All Tests | No Publicly Reported Data Found |
|---|---|---|---|---|---|---|---|---|---|
| Regular States | Reporting Summary | ||||||||
| Alabama | Alabama Alternate Assessment | Reading, Math (3–8, 10), Science (5, 7, 10) | No | No | Yes | ||||
| Alaska | DLM | ELA and Math (3–10), Science (4, 8, 10) | Yes | Yes | Yes | ||||
| Arizona | MSAA, AIMS-A Science | ELA, Math (3–8, 11), Science (4, 8, 10) | No | No | Yes | ||||
| Arkansas | DLM | ELA, Math, Science (3–10) | No | No | Yes | ||||
| AAPA | Science (5, 7, 10) | No | No | ||||||
| California | CAA | ELA, Math (3–8, 11) | Yes | Yes | Yes | ||||
| CAA Science | Science (5, 8, once in HS, field testing) | No | No | ||||||
| Colorado | CoAlt | ELA, Math (3–11) | Yes | Yes | Yes | ||||
| CoAlt Science | Science (5, 8, HS) | Yes | Yes | ||||||
| Connecticut | CTAA | ELA, Math (3–8, 11) | No | No | Yes | ||||
| CTAS | Science (5, 8, 11, field testing) | No | No | ||||||
| Delaware | DeSSA-Alt | Reading, Math (3–8, 11), Science (5, 8, 10, 11) | Yes | Yes | Yes | ||||
| Florida | FSAA with Datafolio Tier | ELA (3–10), Math (3–8), Science (3, 5, 8), EoC: Algebra I, Geometry, Biology | No | No | Yes | ||||
| Georgia | Alternate Assessment | ELA, Math (K, 3–8, HS), Science (5, 8, HS) | Yes | Yes | Yea | ||||
| Hawaii | HSA – Alt | ELA, Math (3–8, 11), Science (4, 8, 11) | No | No | Yes | ||||
| Idaho | IDAA | ELA, Math (3–8, HS), Science (5, 7, 10) | No | No | Yes | ||||
| Illinois | DLM | ELA, Math (3–8, 11) | Yes | Yes | Yes | ||||
| DLM Science | Science (5, 8, 11) | Yes | Yes | ||||||
| Indiana | ISTAR | ELA, Math (3–8, 10), Science (4, 7) | No | No | Yes | ||||
| Iowa | IAA | Reading, Math (3–8, 11) | No | No | Yes | ||||
| IAA Science | Science (5, 8, 11) | No | No | ||||||
| Kansas | DLM | ELA, Math (3–8, 10), Science (5, 8, 11) | Yes | No | Yes | ||||
| Kentucky | Alternate K-PREP | Reading (3–9), Math (3–8,10), Writing (4, 5, 6, 8, 10, 11), Science (4, 7, 11) | No | No | Yes | ||||
| Louisiana | LEAP Connect | Reading, Math (3–11), Science (4, 8, 11) | No | No | Yes | ||||
| Maine | MSAA, PAAP Science | ELA/Literacy, Math (3–8, HS), Science (5, 8, HS) | No | No | Yes | ||||
| Maryland | MCAP Alternate | Reading, Math (3–8, 11), Science (5,8,11) | No | Yes | Yes | ||||
| Massachusetts | MCAS-Alt | ELA, Math (3–8, 10), Science and Technology/ Engineering (5, 8, 9 or 10) | No | No | Yes | ||||
| Michigan | MI-Access Functional Independence | ELA, Math (3–8, 11), Science (4, 7, 11) | No | No | Yes | ||||
| MI-Access Supported Independence | ELA, Math (3–8, 11), Science (4, 7 11) | No | No | ||||||
| MI-Access Participation | ELA, Math (3–8, 11), Science (4, 7, 11) | No | No | ||||||
| Minnesota | MTAS III | Reading, Math (3–8, HS), Science (5, 8, HS) | Yes | Yes | Yes | ||||
| Mississippi | DLM | ELA, Math (3–8, HS), Science (5,8, HS) | No | No | Yes | ||||
| Missouri | MAPA | ELA (3–8, 11), Math (3–8, 10), Science (5, 8, 11) | No | No | Yes | ||||
| Montana | MSAA | ELA, Math (3–8, 10) | No | No | Yes | ||||
| CRT Alternate | Science (4, 8, 10) | No | No | ||||||
| Nebraska | NESA-M and NESA-AAM | ELA, Math (3–8, 11), Science (5, 8, 11) | No | No | Yes | ||||
| Nevada | NAA | ELA, Math (3–8, 11), Science (5, 8, 11) | Yes | Yes | Yes | ||||
| New Hampshire | DLM | Reading, Math (3–8, 11), Science (5, 8, 11) | No | No | Yes | ||||
| New Jersey | DLM | ELA, Math (3–8, 11) | Yes | Yes | Yes | ||||
| APA | Science (5, 8, 11) | No | No | ||||||
| New Mexico | NMAPA | ELA, Math (3–8, 10, 11), Science (4, 7, 11) | No | No | Yes | ||||
| New York | NYSAA | ELA, Math (3–8, HS), Science (4, 8, HS) | No | No | Yes | ||||
| North Carolina | NCEXTEND1 | Reading, Math (3–8), Science (5, 8), 10: Math I, Biology, English II | Yes | Yes | Yes | ||||
| North Dakota | DLM | Reading/Language Arts, Math (3–8, HS) | No | No | Yes | ||||
| NDAA Science | Science (4, 8, 11) | No | No | ||||||
| Ohio | AASCD | ELA, Math (3–8), Science (5,8) | Yes | Yes | Yes | ||||
| OGT-HS-AASCD | ELA II, Math II, Geometry, Biology (HS) | Yes | Yes | ||||||
| Oklahoma | OAAP | ELA, Math (3–8, HS), Science (5, 8) | No | No | Yes | ||||
| Oregon | Oregon Extended Assessment | Reading, Math (3–8, 11), Science (5, 8, 11) | No | No | Yes | ||||
| Pennsylvania | PASA | ELA, Math (3–8, 11), Science (4, 8, 11) | No | No | Yes | ||||
| Rhode Island | DLM | ELA, Math (3–8, 11), Science (5, 8, 11) | No | Yes | Yes | ||||
| South Carolina | SC-ALT | Science (4, 6, 8, 11), HS: Biology I, English I, Algebra I | No | No | Yes | ||||
| NCSC | ELA, Math (3–8, 11) | No | No | ||||||
| South Dakota | SD ELA and Math Alternate Assessments | ELA, Math (3–8, 11) | No | No | Yes | ||||
| SDSA-Alternate | Science (5, 8, 11) | No | No | ||||||
| Tennessee | MSAA | ELA, Math (3–8, 11) | No | No | Yes | ||||
| TCAP-Alt | Science (3–8), Biology (10) | No | No | ||||||
| Texas | STAARALT 2 | Math, Reading (3–8), Writing (4, 7), Science (5, 8) | Yes | Yes | Yes | ||||
| STAARALT2 EoC | EoC: English I-II, Algebra I, Biology | Yes | Yes | ||||||
| Utah | DLM | ELA, Math (3–11) | No | No | Yes | ||||
| UAA | Science (4–11) | No | No | ||||||
| Vermont | VTALT | ELA, Math (3–11) | No | No | Yes | ||||
| VTALT | Science (5, 8, 11) | No | No | ||||||
| Virginia | VAAP | Reading, Math, Science, Writing (3–8, HS) | No | No | Yes | ||||
| Washington | WA-AIM | ELA, Math (3–8, 11), Science (5, 8, 11) | No | No | Yes | ||||
| West Virginia | WVASA – DLM | Reading, Math (3–8, HS) | No | No | Yes | ||||
| WVASA Science | Science (5, 8, 11) | No | No | ||||||
| Wisconsin | DLM | ELA, Math (3–11), Science (4, 8–11) | Yes | Yes | Yes | ||||
| Wyoming | WY-ALT | ELA, Math (3–8, HS), Science (4, 8, 9–11) | No | No | Yes | ||||
| Total Regular States (N=50) | 11 | 2 | 1 | 2 | 34 | ||||
| Unique States | Reporting Summary | ||||||||
| American Samoa | Alternate Assessment | Reading, Math (3–8, 10) | No | No | Yes | ||||
| Bureau of Indian Education | Alternates by State | By state | No | No | Yes | ||||
| Commonwealth of Northern Mariana Islands | MSAA | ELA, Math (3–8, 11) | No | No | Yes | ||||
| District of Columbia | MSAA | ELA, Math (3–8, HS) | No | No | Yes | ||||
| DC Science Alternate | Science (5, 8, HS) | No | No | ||||||
| Federated States of Micronesia | No Title I assessment | - | - | Yes | |||||
| Guam | NCSC and DoE Alternate | ELA, Math (3–8, 11) and DoE Alternate in ELA and Math (1, 2, 9, 10) | No | No | Yes | ||||
| Palau | No Information | - | - | Yes | |||||
| Puerto Rico | Puerto Rico Alternate Assessment | Spanish, English, Math (3–8, 11), Science (4, 8, 11) | No | No | Yes | ||||
| Republic of Marshall Islands | No Title I alternate assessment | - | - | Yes | |||||
| U.S. Department of Defense Education Activity | No Title I alternate assessment | Reading/Language Arts, Math, Science (3–12) These not used for Title I | - | - | Yes | ||||
| U.S. Virgin Islands | MSAA | ELA, Math (3–8, 11) | No | No | Yes | ||||
| Total Unique States (N=11) | 0 | 0 | 0 | 0 | 11 | ||||
| Total Regular and Unique States (N=61) | 11 | 2 | 1 | 2 | 45 | ||||
| Percent of All States | 18% | 3% | 2% | 3% | 74% | ||||
Table B-10 Disaggregated ELs in Special Education Data for AA-AAAS: Other Content Areas
| State | Test | Subject Areas/Grades | Partici-pation | Perform-ance | Part. and Perf. for All Tests | No Publicly Reported Data Found |
|---|---|---|---|---|---|---|
| Regular States | Reporting Summary | |||||
| Colorado | CoAlt | Social Studies (4, 7) | Yes | Yes | Yes | |
| Florida | FSAA with Datafolio Tier | Social Studies (often 7th), EOC: Civics | No | No | Yes | |
| Georgia | Alternate Assessment | Social Studies (4, 8, HS) | Yes | Yes | Yes | |
| Indiana | ISTAR | Social Studies (4, 7) | No | No | Yes | |
| Kentucky | Alternate K-PREP | Social Studies (5, 8) | No | No | Yes | |
| Ohio | HS-AASCD | American US History (HS) | Yes | Yes | Yes | |
| South Carolina | SC-ALT | Social Studies (5, 7), US History and the Constitution | No | No | Yes | |
| Texas | STAARALT2, EoC | Social Studies (8), EoC: US History | Yes | Yes | Yes | |
| Wisconsin | DLM | Social Studies (4, 8, 10) | Yes | Yes | Yes | |
| Total Regular States (N=9) | 5 | 4 | ||||
| Unique States | ||||||
| Total Unique States (N=0) | 0 | 0 | ||||
| Total Regular and Unique States (N=9) | 5 | 4 | ||||
| Percent of All States with Other Content | 56% | 44% | ||||
Table B-11. Participation and Performance Data for Students with Disabilities and ELs with Disabilities, Alternate Assessments Based on Grade Level Achievement Standards (AA-GLAS) Used for Title I Accountability, 2018–2019
| State | Test | Grade | Subject Areas | Disaggregated Data for AA-GLAS | |||
|---|---|---|---|---|---|---|---|
| Students with Disabilities | ELs | ||||||
| Participation | Performance | Participation | Performance | ||||
| Regular States | |||||||
| Massachusetts | Alternate Based on Grade Level Achievement Standards | 3–8, 10 | English Language Arts, Math, Science/Engineering (5, 8, 9, 10) | Yes | Yes1 | No | No |
| Total Regular States with GLAS (N=1) | 1 | 1 | 0 | 0 | |||
| Percent | 100% | 100% | 0% | 0% | |||
1 State reports these data merged with other performance data.
Table B-12. Participation Data Reported on General Assessments
| State | Number Enrolled/ Eligible to be Tested | Number Students Tested | Number Students Not Tested | Percent Participating in Test | Percent Students not Tested | Number Students with Scores | Number Students with No scores | Percent Students with No Scores |
|---|---|---|---|---|---|---|---|---|
| Regular States | ||||||||
| Alabama | - | - | - | X | - | - | - | - |
| Alaska | X | - | - | X | - | - | - | - |
| Arizona | - | X | - | - | - | - | - | - |
| Arkansas | - | X | - | X | - | - | - | - |
| California | X | X | - | - | - | X | - | - |
| Colorado | - | - | - | X | - | X | - | - |
| Connecticut | X | X | - | X | - | X | - | - |
| Delaware | - | X | - | - | - | - | - | - |
| Florida | - | X | - | X | - | - | - | - |
| Georgia | X | X | - | X | - | - | - | - |
| Hawaii | - | X | - | X | - | - | - | - |
| Idaho | - | - | - | X | - | - | - | - |
| Illinois | - | X | - | X | - | - | - | - |
| Indiana | - | X | - | - | - | - | - | - |
| Iowa | - | X | - | - | - | - | - | - |
| Kansas | X | X | - | X | X | - | - | - |
| Kentucky | X | X | - | X | - | - | - | - |
| Louisiana | - | X | - | - | - | - | - | - |
| Maine | X | X | - | X | - | - | - | - |
| Maryland | X | X | - | X | - | - | - | - |
| Massachusetts | - | X | - | X | - | - | - | - |
| Michigan | - | X | - | - | - | - | - | - |
| Minnesota | - | X | - | X | - | - | - | - |
| Mississippi | - | - | - | X | - | - | - | - |
| Missouri | - | - | - | - | - | - | - | - |
| Montana | - | - | X | X | - | - | - | - |
| Nebraska | - | - | X | - | X | - | - | - |
| Nevada | X | X | - | - | X | - | - | - |
| New Hampshire | - | - | - | X | - | - | - | - |
| New Jersey | - | - | - | - | - | X | - | - |
| New Mexico | - | X | - | - | - | - | - | - |
| New York | X | X | X | X | - | - | - | - |
| North Carolina | X | X | X | X | X | X | X | X |
| North Dakota | - | - | - | X | - | - | - | - |
| Ohio | X | X | X | - | X | - | - | - |
| Oklahoma | - | - | - | - | - | - | - | - |
| Oregon | - | X | - | X | - | - | - | - |
| Pennsylvania | - | - | - | X | - | - | - | - |
| Rhode Island | - | X | - | - | - | - | - | - |
| South Carolina | - | X | - | - | - | - | - | - |
| South Dakota | X | X | - | X | - | - | - | - |
| Tennessee | X | X | - | - | - | X | - | - |
| Texas | - | X | - | - | - | - | - | - |
| Utah | - | X | X | - | X | - | - | - |
| Vermont | - | X | - | X | X | - | - | - |
| Virginia | - | - | - | X | - | - | - | - |
| Washington | X | - | - | - | - | - | - | X |
| West Virginia | - | X | - | - | - | - | - | - |
| Wisconsin | X | X | X | - | X | - | - | - |
| Wyoming | - | X | - | X | - | - | - | - |
| Total Regular States (N=50) | 16 | 35 | 7 | 28 | 8 | 6 | 1 | 2 |
| Unique States | ||||||||
| American Samoa | - | - | - | - | - | - | - | - |
| Bureau of Indian Education | - | - | - | - | - | - | - | - |
| Commonwealth of Northern Mariana Islands | - | - | - | - | - | - | - | - |
| District of Columbia | - | X | - | X | - | X | - | - |
| Federated States of Micronesia | - | - | - | - | - | - | - | - |
| Guam | X | X | - | - | - | X | - | - |
| Palau | - | - | - | - | - | - | - | - |
| Puerto Rico | - | - | - | - | - | - | - | - |
| Republic of Marshall Islands | - | - | - | - | - | - | - | - |
| U.S. Department of Defense Education Activity | - | - | - | - | - | - | - | - |
| U.S. Virgin Islands | - | - | - | - | - | - | - | - |
| Total Unique States (N=11) | 1 | 2 | 0 | 1 | 0 | 2 | 0 | 0 |
| Total All Regular and Unique States (N=61) | 17 | 37 | 7 | 291 | 8 | 8 | 1 | 2 |
1 Eleven states of these 29 were not included in Figure 12 graphing participation rates for middle school math as they either reported grades merged or reported percent participating split by accommodated status. These eleven states were: Florida, Hawaii, Illinois, Kansas, Kentucky, Maine, Mississippi, New Hampshire, New York, Pennsylvania, and Virginia.
Table B-13. Participation Data Reported On AA-AAAS Note: M indicates state AA-AAAS data was merged with general assessment data.
| State | Number Enrolled/ Eligible to be Tested | Number of Students Tested | Number Students Not Tested | Percent Partici-pating in Test | Percent Students not Tested | Number Students with Scores | Number Students with No scores | Percent Students with No Scores |
|---|---|---|---|---|---|---|---|---|
| Regular States | ||||||||
| Alabama | - | - | - | X | - | - | - | - |
| Alaska | X | - | - | X | - | - | - | - |
| Arizona | - | M | - | - | - | - | - | - |
| Arkansas | - | X | - | X | - | - | - | - |
| California | X | X | - | - | - | X | - | - |
| Colorado | - | - | - | - | - | X | - | - |
| Connecticut | X | X | X | X | - | X | - | - |
| Delaware | - | X | - | X | - | - | - | - |
| Florida | - | X | - | X | - | - | - | - |
| Georgia | X | X | - | X | - | - | - | - |
| Hawaii | - | X | - | X | - | - | - | - |
| Idaho | - | - | - | - | - | - | - | - |
| Illinois | - | X | - | X | - | - | - | - |
| Indiana | - | - | - | - | - | - | - | - |
| Iowa | - | - | - | - | - | - | - | - |
| Kansas | X | X | - | X | X | - | - | - |
| Kentucky | X | X | - | X | - | - | - | - |
| Louisiana | - | X | - | - | - | - | - | - |
| Maine | - | X | - | X | - | - | - | - |
| Maryland | M | X | - | X | - | - | - | - |
| Massachusetts | - | X | - | X | - | - | - | - |
| Michigan | - | X | - | - | - | - | - | - |
| Minnesota | - | X | - | X | - | - | - | - |
| Mississippi | - | X | - | X | - | - | - | - |
| Missouri | - | - | - | - | - | - | - | - |
| Montana | - | - | X | X | - | - | - | - |
| Nebraska | - | - | - | - | - | - | - | - |
| Nevada | X | X | - | - | X | - | - | - |
| New Hampshire | - | - | - | M | - | - | - | - |
| New Jersey | - | - | - | - | - | X | - | - |
| New Mexico | M | X | X | - | - | - | - | - |
| New York | M | X | X | M | - | - | - | - |
| North Carolina | X | X | X | X | - | - | X | X |
| North Dakota | - | - | - | M | - | X | - | - |
| Ohio | M | M | X | - | X | - | - | - |
| Oklahoma | - | - | - | - | - | - | - | - |
| Oregon | - | X | - | X | - | - | - | - |
| Pennsylvania | - | - | - | M | - | - | - | - |
| Rhode Island | X | X | - | X | - | - | - | - |
| South Carolina | - | - | - | - | - | - | - | - |
| South Dakota | X | X | - | X | - | - | - | - |
| Tennessee | M | M | - | - | - | M | - | - |
| Texas | - | X | - | X | - | - | - | - |
| Utah | - | X | - | X | - | - | - | - |
| Vermont | - | X | - | X | M | - | - | - |
| Virginia | - | X | - | X | - | - | - | - |
| Washington | X | - | - | X | - | - | - | X |
| West Virginia | - | M | - | - | - | - | - | - |
| Wisconsin | M | X | X | - | X | - | - | - |
| Wyoming | - | X | - | X | - | - | - | - |
| Total Regular States (N=50) | 17 | 34 | 7 | 31 | 5 | 6 | 1 | 2 |
| Unique States | ||||||||
| American Samoa | - | - | - | - | - | - | - | - |
| Bureau of Indian Education | - | - | - | - | - | - | - | - |
| Commonwealth of Northern Mariana Islands | - | - | - | - | - | - | - | - |
| District of Columbia | - | X | - | M | - | X | - | - |
| Federated States of Micronesia | - | - | - | - | - | - | - | - |
| Guam | X | X | X | - | - | - | X | - |
| Palau | - | - | - | - | - | - | - | - |
| Puerto Rico | - | - | - | - | - | - | - | - |
| Republic of Marshall Islands | - | - | - | - | - | - | - | - |
| U.S. Department of Defense Education Activity | - | - | - | - | - | - | - | - |
| U.S. Virgin Islands | - | - | - | - | - | - | - | - |
| Total Unique States (N=11) | 1 | 2 | 1 | 1 | 0 | 1 | 1 | 0 |
| Total All Regular and Unique States (N=61) | 18 | 36 | 8 | 32 | 5 | 7 | 2 | 2 |
Table B-14. State Abbreviation Key
| State Abbreviation | State’s Full Name | State Abbreviations Continued |
State’s Full Name |
|---|---|---|---|
| AL | Alabama | MT | Montana |
| AK | Alaska | NE | Nebraska |
| AR | Arkansas | NV | Nevada |
| AZ | Arizona | NH | New Hampshire |
| CA | California | NJ | New Jersey |
| CO | Colorado | NM | New Mexico |
| CT | Connecticut | NY | New York |
| DE | Delaware | NC | North Carolina |
| DC | District of Columbia | ND | North Dakota |
| FL | Florida | OH | Ohio |
| GA | Georgia | OK | Oklahoma |
| HI | Hawaii | OR | Oregon |
| ID | Idaho | PA | Pennsylvania |
| IL | Illinois | RI | Rhode Island |
| IN | Indiana | SC | South Carolina |
| IA | Iowa | SD | South Dakota |
| KS | Kansas | TN | Tennessee |
| KY | Kentucky | TX | Texas |
| LA | Louisiana | UT | Utah |
| ME | Maine | VT | Vermont |
| MD | Maryland | VA | Virginia |
| MA | Massachusetts | WA | Washington |
| MI | Michigan | WV | West Virginia |
| MN | Minnesota | WI | Wisconsin |
| MS | Mississippi | WY | Wyoming |
| MO | Missouri |
Table B-15. Performance Data Reported for General Assessments
| State | Percent Proficient | Percent Proficient Derived | Percent Not Proficient | Number Proficient | Number Not Proficient | Number by Achievement Level | Percent by Achievement Level | Other (e.g., Index, Scale Score) |
|---|---|---|---|---|---|---|---|---|
| Regular States | ||||||||
| Alabama | X | - | - | - | - | - | X | - |
| Alaska | X | - | X | X | X | - | - | - |
| Arizona | X | - | - | - | - | - | X | - |
| Arkansas | - | X | - | - | - | - | X | - |
| California | - | X | - | - | - | - | X | X |
| Colorado | X | - | - | - | - | - | X | X |
| Connecticut | X | - | - | X | - | X | X | X |
| Delaware | - | X | - | - | - | - | X | - |
| Florida | X | - | - | - | - | - | X | - |
| Georgia | - | X | - | - | - | X | X | - |
| Hawaii | - | X | - | - | - | X | X | X |
| Idaho | X | - | - | - | - | - | X | - |
| Illinois | X | - | - | - | - | - | X | - |
| Indiana | X | - | - | X | - | - | X | - |
| Iowa | X | - | - | - | - | - | X | - |
| Kansas | X | - | - | - | - | - | X | - |
| Kentucky | X | - | - | - | - | - | X | - |
| Louisiana | X | - | X | - | X | X | X | - |
| Maine | X | - | - | - | - | X | - | |
| Maryland | X | - | - | - | - | - | X | - |
| Massachusetts | - | X | - | - | - | - | X | - |
| Michigan | X | - | - | X | - | X | X | X |
| Minnesota | X | - | - | X | - | X | X | - |
| Mississippi | - | X | - | - | - | - | X | - |
| Missouri | X | - | - | - | - | - | - | - |
| Montana | - | X | - | - | - | X | X | - |
| Nebraska | - | X | - | - | - | - | X | - |
| Nevada | X | - | - | - | - | - | X | - |
| New Hampshire | X | - | - | - | - | - | X | X |
| New Jersey | X | - | - | - | - | - | X | - |
| New Mexico | - | X | - | - | - | - | X | - |
| New York | X | - | - | X | - | X | X | X |
| North Carolina | X | - | - | X | - | - | X | X |
| North Dakota | X | - | - | - | - | - | X | X |
| Ohio | X | - | - | - | - | X | X | - |
| Oklahoma | - | X | - | - | - | - | X | - |
| Oregon | X | - | - | X | - | X | X | - |
| Pennsylvania | - | X | - | - | - | - | X | - |
| Rhode Island | X | - | - | - | - | X | X | X |
| South Carolina | X | - | - | - | - | - | X | X |
| South Dakota | X | - | - | X | - | X | X | - |
| Tennessee | X | - | - | - | - | X | X | - |
| Texas | - | X | - | - | - | X | X | X |
| Utah | X | - | - | - | - | - | X | - |
| Vermont | X | - | X | - | - | - | X | X |
| Virginia | X | - | X | - | - | - | X | - |
| Washington | X | - | - | X | - | - | X | - |
| West Virginia | X | - | - | - | - | - | X | - |
| Wisconsin | - | X | - | - | - | X | X | X |
| Wyoming | X | - | X | - | - | - | X | - |
| Total Regular States (N=50) | 36 | 14 | 5 | 10 | 2 | 15 | 48 | 14 |
| Unique States | ||||||||
| American Samoa | - | - | - | - | - | - | - | - |
| Bureau of Indian Education | - | - | - | - | - | - | - | - |
| Commonwealth of Northern Mariana Islands | - | - | - | - | - | - | - | - |
| District of Columbia | X | - | - | X | - | - | X | - |
| Federated States of Micronesia | - | - | - | - | - | - | - | - |
| Guam | - | X | - | - | - | - | X | - |
| Palau | - | - | - | - | - | - | - | - |
| Puerto Rico | - | - | - | - | - | - | - | - |
| Republic of Marshall Islands | - | - | - | - | - | - | - | - |
| U.S. Department of Defense Education Activity | - | - | - | - | - | - | - | - |
| U.S. Virgin Islands | X | - | - | - | - | - | - | - |
| Total Unique States (N=11) | 2 | 1 | 0 | 1 | 0 | 0 | 2 | 0 |
| Total All Regular and Unique States (N=61) | 38 | 15 | 5 | 11 | 2 | 15 | 50 | 14 |
Table B-16. Performance Data Reported for AA-AAAS
Note: M indicates state merged AA-AAAS data with general assessment
data.
| State | Percent Proficient | Percent Proficient Derived | Percent Not Proficient | Number Proficient | Number Not Proficient | Number by Achievement Level | Percent by Achievement Level |
|---|---|---|---|---|---|---|---|
| Regular States | |||||||
| Alabama | X | - | - | - | - | - | X |
| Alaska | X | - | X | X | X | - | - |
| Arizona | M | - | - | - | - | - | M |
| Arkansas | X | - | - | - | - | X | - |
| California | - | X | - | - | - | - | X |
| Colorado | X | - | - | - | - | - | X |
| Connecticut | - | X | - | - | - | X | X |
| Delaware | - | X | - | - | - | - | X |
| Florida | M | - | - | X | - | - | - |
| Georgia | - | X | - | - | - | X | X |
| Hawaii | - | M | - | - | - | X | M |
| Idaho | - | - | - | - | - | - | - |
| Illinois | X | - | - | - | - | - | X |
| Indiana | - | - | - | - | - | - | - |
| Iowa | - | - | - | - | - | - | - |
| Kansas | M | - | - | - | - | - | M |
| Kentucky | X | - | - | - | - | - | X |
| Louisiana | - | X | X | - | X | X | X |
| Maine | M | - | - | - | - | - | M |
| Maryland | X | - | - | - | - | - | X |
| Massachusetts | - | X | - | - | - | X | X |
| Michigan | X | - | - | X | X | X | X |
| Minnesota | X | - | - | X | - | X | X |
| Mississippi | - | M | - | - | - | - | M |
| Missouri | M | - | - | - | - | - | - |
| Montana | - | X | - | - | - | X | X |
| Nebraska | - | - | - | - | - | - | - |
| Nevada | X | - | - | - | - | - | X |
| New Hampshire | M | - | - | - | - | - | M |
| New Jersey | - | X | - | - | - | - | X |
| New Mexico | - | X | - | - | X | - | X |
| New York | - | X | - | - | - | X | X |
| North Carolina | X | - | - | X | - | - | X |
| North Dakota | M | - | - | - | - | - | X |
| Ohio | M | X | - | - | - | X | X |
| Oklahoma | - | M | - | - | - | - | M |
| Oregon | M | - | - | M | - | M | M |
| Pennsylvania | - | M | - | - | - | - | M |
| Rhode Island | X | - | - | - | - | X | X |
| South Carolina | - | - | - | - | - | - | - |
| South Dakota | X | - | - | X | - | X | X |
| Tennessee | M | - | - | - | - | M | M |
| Texas | - | X | X | - | - | X | X |
| Utah | X | - | - | X | - | - | - |
| Vermont | - | X | - | - | - | - | X |
| Virginia | M | - | M | - | - | - | M |
| Washington | X | - | - | X | - | - | X |
| West Virginia | M | - | - | - | - | - | M |
| Wisconsin | - | X | - | - | - | X | X |
| Wyoming | X | - | X | - | - | - | X |
| Total Regular States (N=50) | 28 | 18 | 5 | 9 | 4 | 17 | 40 |
| Unique States | |||||||
| American Samoa | - | - | - | - | - | - | - |
| Bureau of Indian Education | - | - | - | - | - | - | - |
| Commonwealth of Northern Mariana Islands | - | - | - | - | - | - | - |
| District of Columbia | X | - | - | X | - | - | X |
| Federated States of Micronesia | - | - | - | - | - | - | - |
| Guam | - | X | - | - | - | - | X |
| Palau | - | - | - | - | - | - | - |
| Puerto Rico | - | - | - | - | - | - | - |
| Republic of Marshall Islands | - | - | - | - | - | - | - |
| U.S. Department of Defense Education Activity | - | - | - | - | - | - | - |
| U.S. Virgin Islands | - | - | - | - | - | - | - |
| Total Unique States (N=11) | 1 | 1 | 0 | 1 | 0 | 0 | 2 |
| Total All General and Unique States (N=61) | 29 | 19 | 5 | 10 | 4 | 17 | 42 |
Table B-17. Public Reporting on Accommodations
| State | Reported Number Receiving | Reported Performance | Total States with Participation or Performance | Participation and Performance Reported | Participation Only Reported | No Publicly Reported Data Found |
|---|---|---|---|---|---|---|
| Regular States | Reporting Summary | |||||
| Alabama | Yes | Yes | Yes | X | - | - |
| Alaska | No | No | - | - | - | X |
| Arizona | No | No | - | - | - | X |
| Arkansas | Yes | No | Yes | - | X | - |
| California | No | No | - | - | - | X |
| Colorado | No | No | - | - | - | X |
| Connecticut | No | No | - | - | - | X |
| Delaware | No | No | - | - | - | X |
| Florida | Yes | No | Yes | - | X | - |
| Georgia | No | No | - | - | - | X |
| Hawaii | No | No | - | - | - | X |
| Idaho | No | No | - | - | - | X |
| Illinois | No | No | - | - | - | X |
| Iowa | No | No | - | - | - | X |
| Indiana | No | No | - | - | - | X |
| Kansas | Yes | No | Yes | - | X | - |
| Kentucky | Yes | Yes | Yes | X | - | - |
| Louisiana | Yes | Yes | Yes | X | - | - |
| Maine | Yes | Yes | Yes | X | - | - |
| Maryland | No | No | - | - | - | X |
| Massachusetts | Yes | No | Yes | - | X | - |
| Michigan | No | No | - | - | - | X |
| Minnesota | No | No | - | - | - | X |
| Mississippi | No | No | - | - | - | X |
| Missouri | No | No | - | - | - | X |
| Montana | No | No | - | - | - | X |
| Nebraska | No | No | - | - | - | X |
| Nevada | Yes | Yes | Yes | X | - | - |
| New Hampshire | No | No | - | - | - | X |
| New Jersey | Yes | Yes | Yes | X | - | - |
| New Mexico | No | No | - | - | - | X |
| New York | Yes | No | Yes | - | X | - |
| North Carolina | Yes | Yes | Yes | X | - | - |
| North Dakota | Yes | No | Yes | - | X | - |
| Ohio | Yes | Yes | Yes | X | - | - |
| Oklahoma | No | No | - | - | - | X |
| Oregon | No | No | - | - | - | X |
| Pennsylvania | No | No | - | - | - | X |
| Rhode Island | No | No | - | - | - | X |
| South Carolina | No | No | - | - | - | X |
| South Dakota | Yes | Yes | Yes | X | - | - |
| Tennessee | No | No | - | - | - | X |
| Texas | No | No | - | - | - | X |
| Utah | Yes | No | Yes | - | X | - |
| Vermont | No | No | - | - | - | X |
| Virginia | No | No | - | - | - | X |
| Washington | No | No | - | - | - | X |
| West Virginia | No | No | - | - | - | X |
| Wisconsin | No | No | - | - | - | X |
| Wyoming | Yes | Yes | Yes | X | - | - |
| Total Regular States | 17 | 10 | 17 | 10 | 7 | 33 |
| Unique States | Reporting Summary | |||||
| American Samoa | No | No | - | - | - | X |
| Bureau of Indian Affairs | No | No | - | - | - | X |
| Commonwealth of Northern Mariana Islands | No | No | - | - | - | X |
| District of Columbia | Yes | Yes | Yes | X | - | - |
| Federated States of Micronesia | No | No | - | - | - | X |
| Guam | Yes | Yes | Yes | X | - | |
| Palau | No | No | - | - | - | X |
| Puerto Rico | No | No | - | - | - | X |
| Republic of Marshall Islands | No | No | - | - | - | X |
| U.S. Department of Defense Education Activity | No | No | - | - | - | X |
| U.S. Virgin Islands | No | No | - | - | - | X |
| Total Unique States | 2 | 2 | 2 | 2 | 0 | 9 |
| Total States | 19 | 12 | 19 | 12 | 7 | 42 |
Table B-18. English Language Proficiency Assessment (ELPA) Reporting Summary
| State | Regular ELPA Used (K-12) | Total with ELPA Data for ELs | Reported Partici- pation for ELs |
Reported Perform- ance for ELs |
Total with ELPA Data for ELs with Disabilities | Reported Partici- pation for ELs with Disabilities |
Reported Perform- ance for ELs with Disabilities |
Total with Alternate ELPA Data for ELs with Disabilities | Reported Alternate ELPA Partici- pation |
Reported Alternate ELPA. Perform- ance |
|---|---|---|---|---|---|---|---|---|---|---|
| Alabama | ACCESS 2.0 | No | - | - | No | - | - | No | - | - |
| Alaska | ACCESS for ELLs | Yes | X | X | No | - | - | No | - | - |
| Arizona | ACCESS for ELLs | Yes | X | X | No | - | - | No | - | - |
| Arkansas | ELPA21 | Yes | X | X | No | - | - | No | - | - |
| California | ELPAC | Yes | X | X | Yes | X | X | Yes | X | X |
| Colorado | ACCESS for ELLs | No | - | - | No | - | - | No | - | - |
| Connecticut | LAS Links | Yes | X | X | Yes | X | X | No | - | - |
| Delaware | ACCESS for ELLs | Yes | X | X | Yes | X | X | No | - | - |
| Florida | ACCESS for ELLs | No | - | - | No | - | - | No | - | - |
| Georgia | ACCESS for ELLs | Yes | X | X | No | - | - | No | - | - |
| Hawaii | ACCESS for ELLs | No | - | - | No | - | - | No | - | - |
| Idaho | ACCESS for ELLs | Yes | X | X | No | - | - | Yes | - | X |
| Illinois | ACCESS for ELLs | No | - | - | No | - | - | No | - | - |
| Indiana | ACCESS for ELLs | No | - | - | No | - | - | No | - | - |
| Iowa | ELPA-21 | No | - | - | No | - | - | No | - | - |
| Kansas | KELPA2 | Yes | - | X | Yes | - | X | No | - | - |
| Kentucky | ACCESS for ELLs | Yes | X | X | Yes | X | X | No | - | - |
| Louisiana | ELPT | Yes | X | X | No | - | - | No | - | - |
| Maine | ACCESS for ELLs | No | - | - | No | - | - | No | - | - |
| Maryland | ACCESS for ELLs | Yes | X | X | Yes | X | X | No | - | - |
| Massachusetts | ACCESS for ELLs | Yes | X | X | Yes | X | X | Yes | X | X |
| Michigan | ACCESS for ELLs | Yes | X | X | Yes | X | X | No | - | - |
| Minnesota | ACCESS for ELLs | Yes | X | X | Yes | X | X | No | - | - |
| Mississippi | LAS Links | Yes | X | X | No | - | - | No | - | - |
| Missouri | ACCESS for ELLs | No | - | - | No | - | - | No | - | - |
| Montana | ACCESS for ELLs | Yes | X | X | No | - | - | Yes | X | - |
| Nebraska | ELPA21 | No | - | - | No | - | - | No | - | - |
| Nevada | ACCESS for ELLs | No | - | - | No | - | - | No | - | - |
| New Hampshire | ACCESS for ELLs | No | - | - | No | - | - | No | - | - |
| New Jersey | ACCESS for ELLs | Yes | X | - | Yes | X | - | No | - | - |
| New Mexico | ACCESS for ELLs | Yes | - | X | No | - | - | Yes | - | X |
| New York | NYSESLAT | Yes | X | X | No | - | - | No | - | - |
| North Carolina | ACCESS for ELLs | No | - | - | No | - | - | No | - | - |
| North Dakota | ACCESS for ELLs | No | - | - | No | - | - | No | - | - |
| Ohio | OELPA | No | - | - | No | - | - | No | - | - |
| Oklahoma | ACCESS for ELLs | No | - | - | No | - | - | No | - | - |
| Oregon | ELPA 21 | Yes | X | X | No | - | - | No | - | - |
| Pennsylvania | ACCESS for ELLs | No | - | - | No | - | - | No | - | - |
| Rhode Island | ACCESS for ELLs | Yes | X | X | Yes | - | X | Yes | X | X |
| South Carolina | ACCESS for ELLs | Yes | X | X | No | - | - | Yes | X | X |
| South Dakota | ACCESS for ELLs | No | - | - | No | - | - | No | - | - |
| Tennessee | ACCESS for ELLs | Yes | - | X | No | - | - | No | - | - |
| Texas | TELPAS | Yes | X | X | Yes | X | X | No | - | - |
| Utah | ACCESS for ELLs | No | - | - | No | - | - | No | - | - |
| Vermont | ACCESS for ELLs | Yes | - | X | Yes | - | X | No | - | - |
| Virginia | ACCESS for ELLs | Yes | - | X | No | - | - | No | - | - |
| Washington | ELPA 21/WIDA Alt-ACCESS | Yes | X | X | Yes | X | X | Yes | X | X |
| West Virginia | ACCESS for ELLs | No | - | - | No | - | - | No | - | - |
| Wisconsin | ACCESS for ELLs | No | - | - | No | - | - | No | - | - |
| Wyoming | ACCESS for ELLs | No | - | - | No | - | - | No | - | - |
| District of Columbia | ACCESS for ELLs | No | - | - | No | - | - | No | - | - |
| Total States (of 51) | 28 | 23 | 27 | 14 | 11 | 13 | 8 | 6 | 7 |