Acknowledgments
This report was developed through a truly collaborative process with the 48 states participating in the 1% Cap CoP during its bi-weekly webinar calls in 2019. Although the CoP was formed at the request of states to provide them the opportunity for private state conversations, it was with mutual agreement among the CoP, including the states highlighted here, that this report should be shared publicly on the NCEO website.
The states participating in the 1% Cap CoP are listed here. Many of the states had multiple representatives on the CoP webinar calls. This report would not exist had it not been for their active participation and sharing during the CoP calls.
| Alabama
Arizona Arkansas California Colorado Connecticut Delaware Florida Georgia Hawaii Idaho Illinois Indiana Iowa Kansas Kentucky Louisiana Maine Maryland Massachusetts Michigan Minnesota Mississippi Missouri Montana |
Nebraska New Hampshire New Jersey New Mexico New York North Carolina North Dakota Ohio Oklahoma Oregon Pennsylvania Rhode Island South Carolina South Dakota Tennessee Texas Utah Vermont Virginia Washington West Virginia Wisconsin Wyoming |
Executive Summary
This report highlights the work of states in the National Center on Educational Outcomes (NCEO) 1% Community of Practice (CoP) that reduced their alternate assessment participation rates from school year 2016-17 to school year 2017-18. At the time this report was developed, these were the most recent data verified by the U.S. Department of Education. Data were available for reading/language arts and mathematics; participation data for science assessments were not available to us.
U.S. Department of Education data for those states over the required 1.0% alternate assessment participation rate indicated that 11 states had a reduction of at least 0.1 percentage points in either reading/language arts, mathematics, or both. The 0.1 percentage points criterion is used by the U.S. Department of Education as a significant reduction in the participation rate.
Five states volunteered to share information on their approaches to decreasing the state-level participation rate in their states’ alternate assessments based on alternate academic achievement standards (AA-AAAS). The states highlighted in this report are Arkansas, Massachusetts, Michigan, Nebraska, and Wisconsin. Each state provided information on the strategies that it took; several provided examples of some of the materials they used (see appendices).
The report concludes with a discussion of additional considerations. These include the definition of “substantial progress,” the 95% assessment participation requirement, and meeting the 1.0% threshold in science AA-AAAS.
Introduction
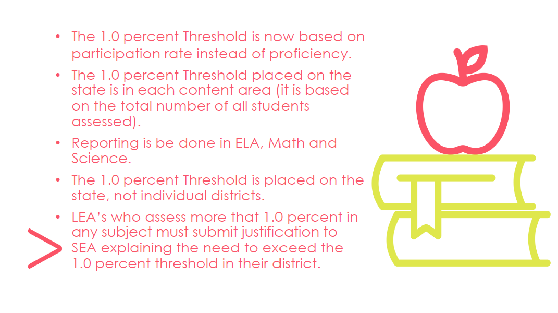
The 2015 reauthorization of the Every Student Succeeds Act (ESSA) placed a state-level 1.0% threshold on student participation in the alternate assessment based on alternate academic achievement standard (AA-AAAS). ESSA also stipulated that state education agencies (SEAs) may not impose on any local educational agency (LEA) a cap on the percentage of students administered an alternate assessment. Nevertheless, LEAs are required to submit information to the SEA justifying the need to exceed 1.0% and SEAs must provide appropriate oversight of these districts.
The National Center on Educational Outcomes (NCEO), at the request of states, initiated a 1% Cap Community of Practice (CoP) as a private forum for regular videoconferences. A password-protected website was established by NCEO so that the 1% CoP states could learn how other states were approaching implementation of the ESSA 1.0% requirements, including oversight of LEAs, and to share resources and information with and among states that would further the purpose of the ESSA legislation in this regard. Since that time states have been addressing the challenges of meeting the 1.0% requirement and searching for and implementing strategies that would help ensure that all students, including students with the most significant cognitive disabilities, are assigned to the appropriate assessment.
The purpose of this report is to highlight the work of states in the 1% CoP that have successfully reduced their alternate assessment participation rates of students with the most significant cognitive disabilities. We used the criterion of at least a 0.1 percentage point decrease in the percentage of students for a subject area that the U.S. Department of Education (2019) established as a benchmark for a state making “substantial progress” in reducing the number of students taking alternate assessments. The states included in this report also met ESSA’s requirement to assess 95% of all students and students with disabilities.
This report identifies the strategies, challenges, resources, and plans for the future of five states that volunteered to share these with the CoP in an effort to provide a collective base of knowledge about “what works” to reduce alternate assessment participation and improve appropriate assessment participation decision making for students with the most significant cognitive disabilities.
The Data
The data used to identify states for this report were those reported to the U.S. Department of Education via the EdFacts system. We examined the difference between the state-level percentage in 2017-18 and the state-level percentage in 2016-17 for those states that were over 1.0% in any subject area. The year 2017-18 was the most recent year for which data verified by the U.S. Department of Education were available to us. We examined the data for reading/language arts and mathematics. We did not have access to science data at the time this report was developed.
Table 1 shows those states that were over 1.0% that had any reduction of at least 0.1 percentage points in at least one subject area. All but two states met the decrease of 0.1 percentage point criterion in both reading/English language arts and mathematics. One of the states that did not meet the 0.1 percentage point decrease criterion did not meet it in reading/language arts and one did not meet it in math. Also notable in the table is that the degree of difference in rates from 2016-17 to 2017-18 ranged from just over -0.1 percentage points to just over -0.4 percentage points. Most changes in rates, though, ranged from -0.15 percentage points to -0.20 percentage points.
Table 1. States with Significant Reductions in the State-Level Percentage of Students Participating in the AA-AAAS (2016-17 to 2017-18)a
| State | Reading/Language Arts | Mathematics | ||||
|---|---|---|---|---|---|---|
| 2017-18 | 2016-17 | Difference | 2017-18 | 2016-17 | Difference | |
| Arkansas | 1.21 | 1.37 | -0.16 | 1.21 | 1.38 | -0.17 |
| Illinois | 1.12 | 1.10 | NA | 1.12 | 1.54 | -0.42 |
| Louisiana | 1.30 | 1.54 | -0.24 | 1.30 | 1.54 | -0.24 |
| Maine | 1.00 | 1.19 | -0.19 | 1.00 | 1.20 | -0.20 |
| Massachusetts | 1.45 | 1.56 | -0.11 | 1.47 | 1.58 | -0.11 |
| Michigan | 2.08 | 2.28 | -0.20 | 2.15 | 2.32 | -0.17 |
| Missouri | 1.06 | 1.27 | -0.21 | 1.06 | 1.26 | -0.20 |
| Nebraska | 1.12 | 1.25 | -0.13 | 1.12 | 1.26 | -0.14 |
| South Dakota | 1.15 | 1.33 | -0.18 | 1.15 | 1.33 | -0.18 |
| Virginia | 1.16 | 1.30 | -0.13 | 0.99 | 0.97 | NA |
| Wisconsin | 1.01 | 1.16 | -0.15 | 1.00 | 1.16 | -0.16 |
a The U.S. Department of Education definition of a significant reduction being at least 0.1 percentage points was used here.
We asked volunteer states in the NCEO 1% Cap CoP to provide us with information they believed was relevant to their success in decreasing the state-level participation rate. In this report, we provide information shared by Arkansas, Massachusetts, Michigan, Nebraska, and Wisconsin.
State Spotlights
States are using a variety of approaches to reduce their state-level AA-AAAS participation rates. The five states we showcased here were included because they reduced their rates more than 0.1 percentage points in at least one subject area and provided us with information on their strategies, challenges, resources, and plans for the future.
Arkansas
Data
Arkansas showed a decrease in percentage points of 0.16 in reading/language arts and 0.17 in mathematics from 2016-17 to 2017-18. Arkansas started in 2016-17 with participation rates of 1.37% in reading/language arts and 1.38% in mathematics for its alternate assessment, the Arkansas Alternate Assessment.
Strategies
Arkansas engaged in two general strategies to work on its AA-AAAS participation rates: (a) focused training, and (b) tier-based training and technical assistance. The specific approaches that Arkansas used under each of these general strategies are listed here.
Focused Training
- Arkansas provided 19 trainings in the summer and 15 in the fall (2019).
- Trainings included a focus on:
- The state’s definition of students with the most significant cognitive disabilities, addressing the cognitive and adaptive characteristics separately.
- The difference in adaptive behavior and maladaptive behavior (districts indicated students with behavioral problems could not participate in a regular classroom). Many districts used a tool that worked well identifying maladaptive behaviors but not adaptive behaviors.
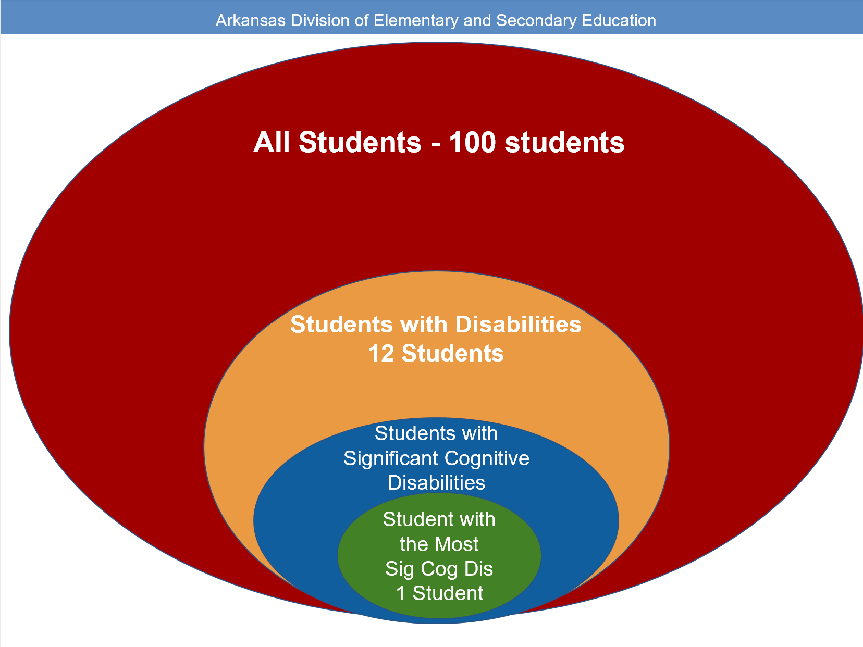
- Comparing the number of students, including students in all types of facilities, in the all students group, the students with disabilities group, the students with significant cognitive disabilities group, and the student with the most significant cognitive disability group (used a graphic representation).
- Addressing Arkansas’ finding that the highest percentage of students who participated in the alternate assessment were the youngest students. Arkansas trained educators to ensure students are identified correctly in early grades. The state borrowed from Donnellan’s (2012) theory of “least dangerous assumption” (Donnellan, 1984), which supports the idea that educators should first assume a student would be able to participate in the regular assessment, and only after that consider participation in an alternate assessment. Included a video to illustrate this concept.
- Using NCEO’s 1% CoP state resources (i.e., reviewed Kentucky’s student profiles and compared West Virginia’s and Idaho’s participation criteria).
Tier-based Training and Technical Assistance
- Arkansas provided training using a need-based tiered approach to training.
- Level 1 - 1.01-1.49%
- Training for all special education staff
- Student list with eligibility categories
- Level 2 - 1.5-1.99%
- Training for all special education staff
- Individual Student Information
- Level 3 - 2.00% and up
Training for all special education staff
Individual Student Information
Onsite review of students
Arkansas brought in a five- to six-member team for at least a full day for folder review of two large districts. A report was created and shared back with the districts. The review was conducted student by student, and when needed, a suggestion was made that the IEP teams review decisions.
Challenges
Arkansas identified a few challenges that it had encountered as it worked to reduce state-level participation rates in the Arkansas Alternate Assessment.
- There were a high number of districts with high alternate assessment participation rates.
- Educators needed to better understand who the students with the most significant cognitive disabilities are.
- Some district administrators were reluctant about having IEP teams move students from the alternate assessment to the general assessment for fear that proficiency rates would drop.
Resources
Arkansas has made numerous resources available. Some were used during training. Others were also posted online. Some of these resources are listed here:
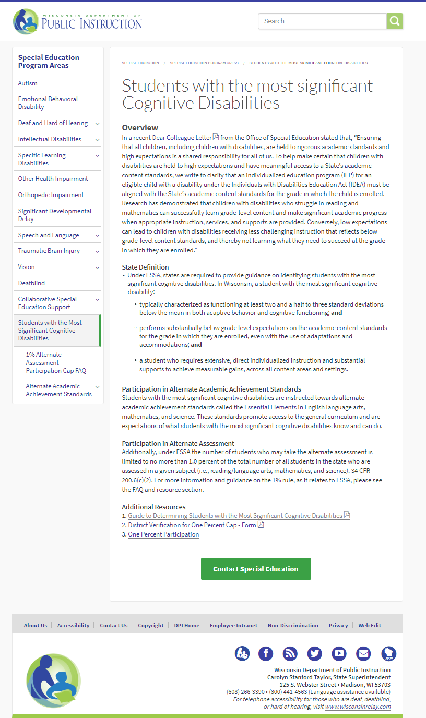
- PowerPoint Training and Link to the training video: http://dese.ade.arkansas.gov/divisions/learning-services/special-education/presentations. Select the last item on the page to view the video.
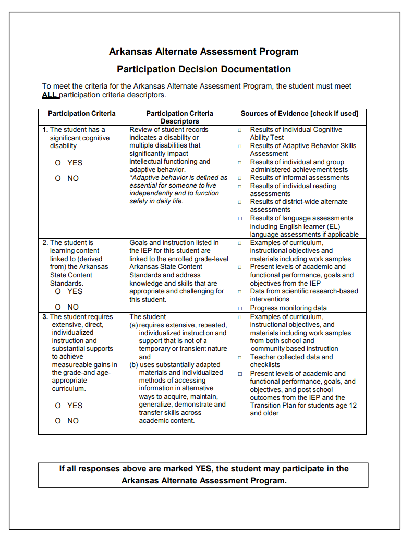
- Guidance for IEP Teams: http://dese.ade.arkansas.gov/public/userfiles/Learning_Services/Student%20Assessment/DLM/Guidance_for_IEP_Teams_on_Alternate_Assessment_2018-2019.pdf
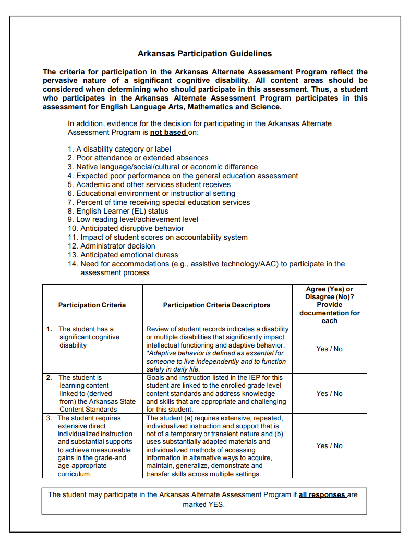
- Arkansas Participation Guidelines: http://adecm.arkansas.gov/Attachments/LS-16-084--ArkansasAlternateAssessmentParticipationDecisionGuidelines.pdf
- List of Arkansas Districts Over the 1.0% Threshold: Districts required to provide justifications for alternate assessment participation rates
- LEA Justification Documentation: LEA Alternate Assessment Justification Documentation
Plans for the Future
- A workgroup will convene to determine if the state’s alternate assessment criteria should be updated. If it is determined that the criteria should be updated and made more specific, the workgroup will draft new criteria.
- A presentation will be recorded to explain which students should participate in the alternate assessment: http://dese.ade.arkansas.gov/divisions/learning-services/special-education/presentations.
- Two presentations will be provided statewide during the summer. One will focus exclusively on the alternate assessment participation criteria, IEP development, and instruction for students with the most significant cognitive disabilities. The other will focus on inclusive practices.
Massachusetts
Data
Massachusetts reduced AA-AAAS participation by 0.11 percentage points in both reading/language arts and mathematics between the 2016-2017 and 2017-2018 school years, after starting 2016-17 with a relatively high alternate assessment participation rate of 1.56% in reading/language arts and 1.58% in mathematics.
Strategies
Massachusetts undertook two general strategies to work to reduce its AA-AAAS participation rates: (a) work directly with the highest-percentage districts, and (b) clarify participation guidelines to help IEP teams make appropriate assessment participation decisions. The specific approaches used by Massachusetts for each of these general strategies are listed here.
Work Directly with Districts
- Focused intensive technical assistance on about 25 districts with high percentages (i.e., more than 2.5 percent) of assessed students taking the MCAS-Alt. Massachusetts noticed that larger, primarily urban districts had much higher percentages of students participating in the alternate assessment than did smaller districts; and that changes in assessment decision-making for students in larger, higher-percentage districts would yield more dramatic reductions than would similar intervention in smaller districts.
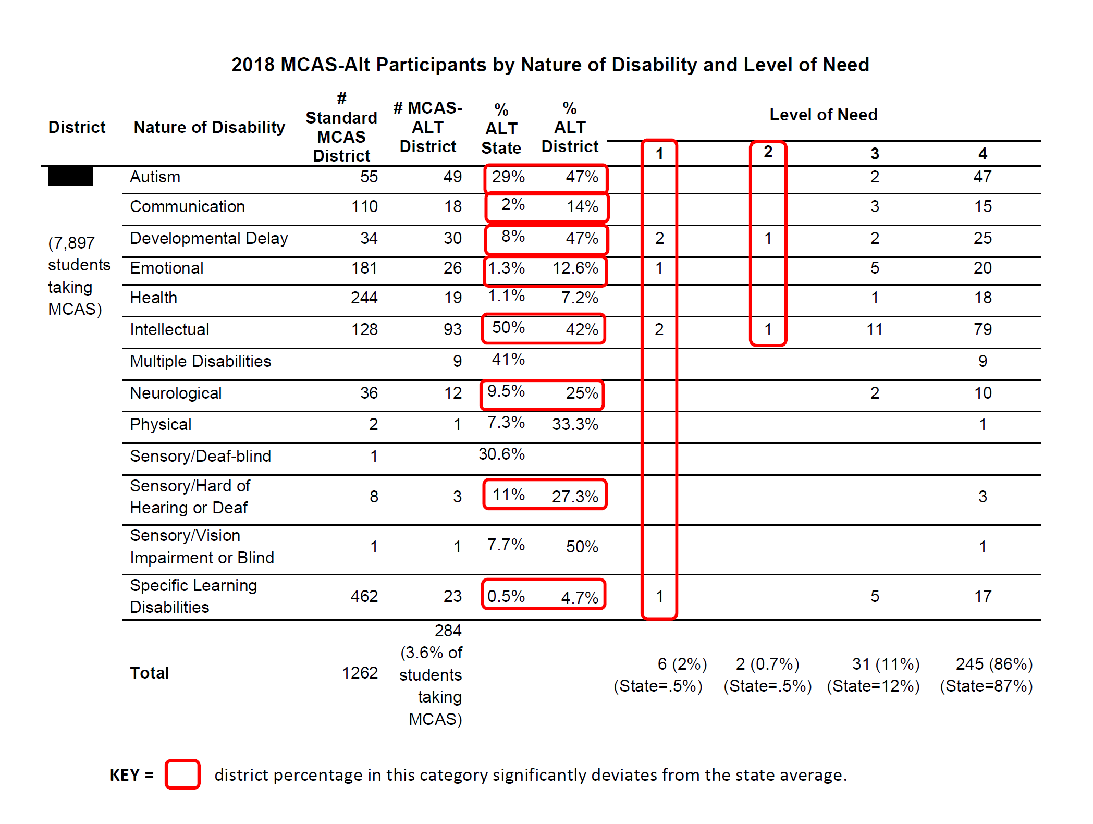
- Made site visits to 12 districts in 2017-2018 and an additional 10 site visits in 2018-2019 (i.e., districts with more than 500 students assessed overall, and 2.5 percent or higher taking the MCAS-Alt), meeting specifically with IEP team chairs as a primary targeted group, plus special education administrators and principals as available. Data were presented and information on state- and district-wide patterns and discrepancies that existed between state and district percentages within each disability and “level of need” category (“level of need” is a metric collected by the state for each student with a disability).
- Clarified AA-AAAS participation guidelines with districts and the criteria that should not be used in designating students for the alternate assessment (e.g., excessive absences, previous failure on the standard assessment, or undue pressure on the IEP team to designate the AA for accountability reasons). The state reviewed the importance of appropriate assessment participation decisions, with a focus on:
- The state’s graduation requirements, which students taking the AA-AAAS cannot achieve. Students with less significant cognitive disabilities (SCDs), or who do not have SCDs, may yet be capable of earning a diploma as a result of good instruction, district support, and perseverance, but only if they participate in the grade-level curriculum and take the standard assessment.
- Subgroup participation in the AA-AAAS, especially regarding disproportionate representation of students in specific subgroups.
- Comparing state and district AA participation numbers and percentages in each primary disability category and by level of need.
- Encouraged districts to analyze their data and identify students taking the AA-AAAS as possible candidates for designation to standard assessments. Focused districts on making progress in lowering their participation rate for the coming year, rather than attempting to achieve 1.0 percent all at once.
Help IEP Teams Make Appropriate Decisions
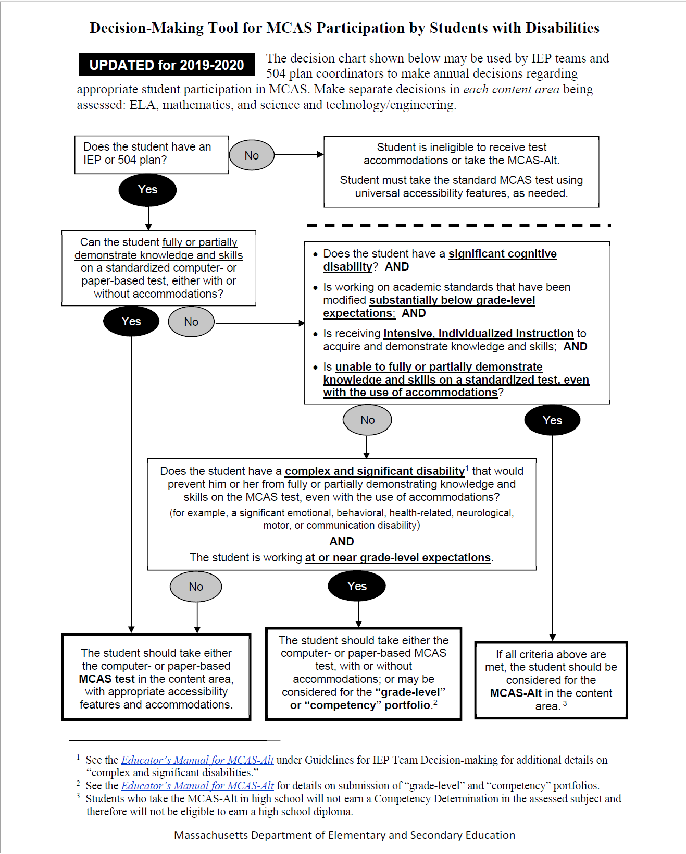
- Developed a Decision-Making Tool to guide IEP teams to begin the assessment discussion at the team meeting and reach appropriate decisions efficiently. Districts have reported they find the tool helpful during conversations about assessment participation. The tool makes clear that students who take the MCAS-Alt in high school will not earn a Competency Determination in the assessed subject and therefore will not be eligible to earn a high school diploma.
- Posted a spreadsheet to the Internet listing all Massachusetts districts and their rate of AA-AAAS participation in 2017, 2018, and 2019. Districts use these to assess their progress in lowering their number of students taking the MCAS-Alt each year.
- Made sample parent notification letter (translated into five languages) available.
- Developed presentation for annual IEP team training.
Challenges
Massachusetts noted some challenges:
- There was a need to increase awareness about the AA-AAAS and provide ongoing technical assistance in clarifying the requirements of ESSA in this regard.
- A higher number and percentage of students taking alternate assessments exists overall in large districts taking the AA-AAAS, plus additional demographic challenges (e.g., economic disadvantages) in urban districts, requiring additional and ongoing technical assistance, although smaller districts also need assistance with this effort.
Resources
Three tools that Massachusetts provides to its districts are listed here and included in Appendix A.
- Decision-Making Tool
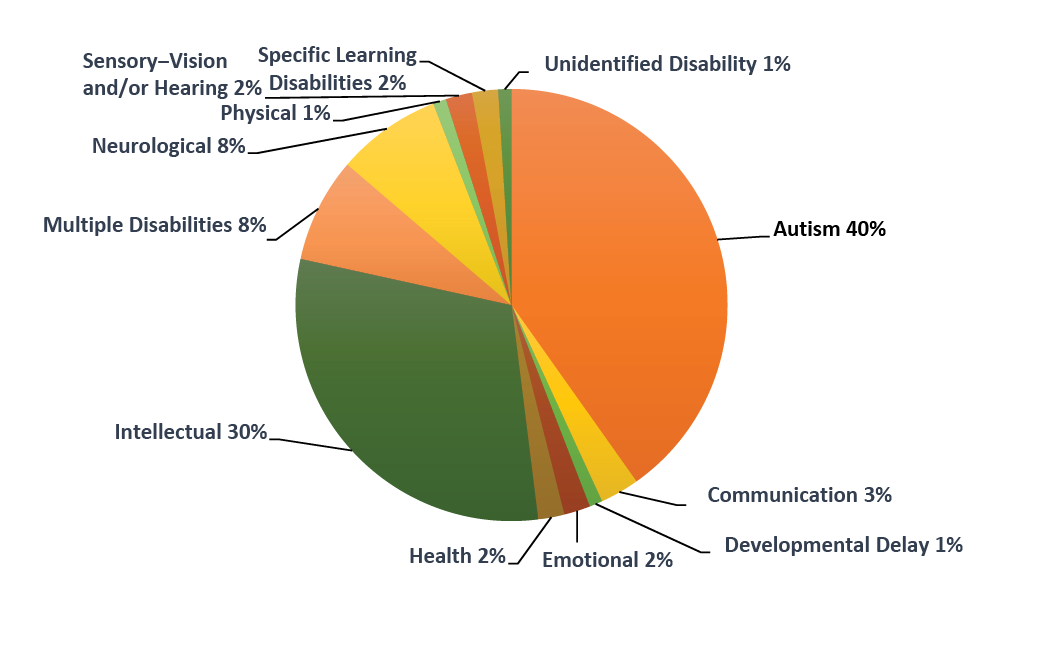
- Statewide MCAS-Alt Participation by Percent in each Disability Category (Circle graph)
- Sample MCAS-Alt District Data Display
Massachusetts used the data displays to focus on comparisons between the district and state, highlighting areas in need of further reflection and investigation by the district.
The data displays Massachusetts shared with districts show information based on the following metrics (see Appendix A):
- Total number taking MCAS and MCAS-Alt, plus district’s overall percent AA participation rate; and progress made since the prior year
- Nature of Disability of students taking the MCAS-Alt (District and State)—Autism, Intellectual, Communication, Emotional, Specific Learning, etc.
- A comparison between District and State numbers and percent for students taking MCAS-Alt by disability category
- Level of Need (1 through 4)—A comparison between District and State number of hours and intensity of services provided to students taking the MCAS-Alt
Plans for the Future
Massachusetts indicated that it expects to continue decreasing its statewide percent over the next 2-3 years, as long as it maintains technical assistance and pressure on districts. However, the rate of decrease will likely diminish over time since most of the likely candidates for re-designation have already been removed from the alternate assessment. The state would need to re-designate an additional 2,000 of 7,000 students now participating in the AA-AAAS for it to reach one percent, which may not be possible or realistic. Massachusetts will continue to target specific districts for individualized site visits and assistance, plus send out annual letters requesting justification and other information if the district will continue to exceed one percent in the coming year.
Despite concerns about future rates of decrease in AA-AAS participation, Massachusetts has reported a decrease from 1.6 percent in 2017-2018 to 1.4 percent in 2018-2019, a reduction of about 1,000 students taking alternate assessments over the past two school years.
Michigan
Data
Michigan showed a decrease in percentage points of 0.20 in reading/language arts, from 2.28 in 2016-17 to 2.08 in 2017-18. It also showed a decrease of 0.17 percentage points in mathematics, from 2.32 in 2016-17 to 2.15 in 2017-18.
Strategies
Michigan employed several strategies to reduce the state-level participation rate in the AA-AAAS, as listed here.
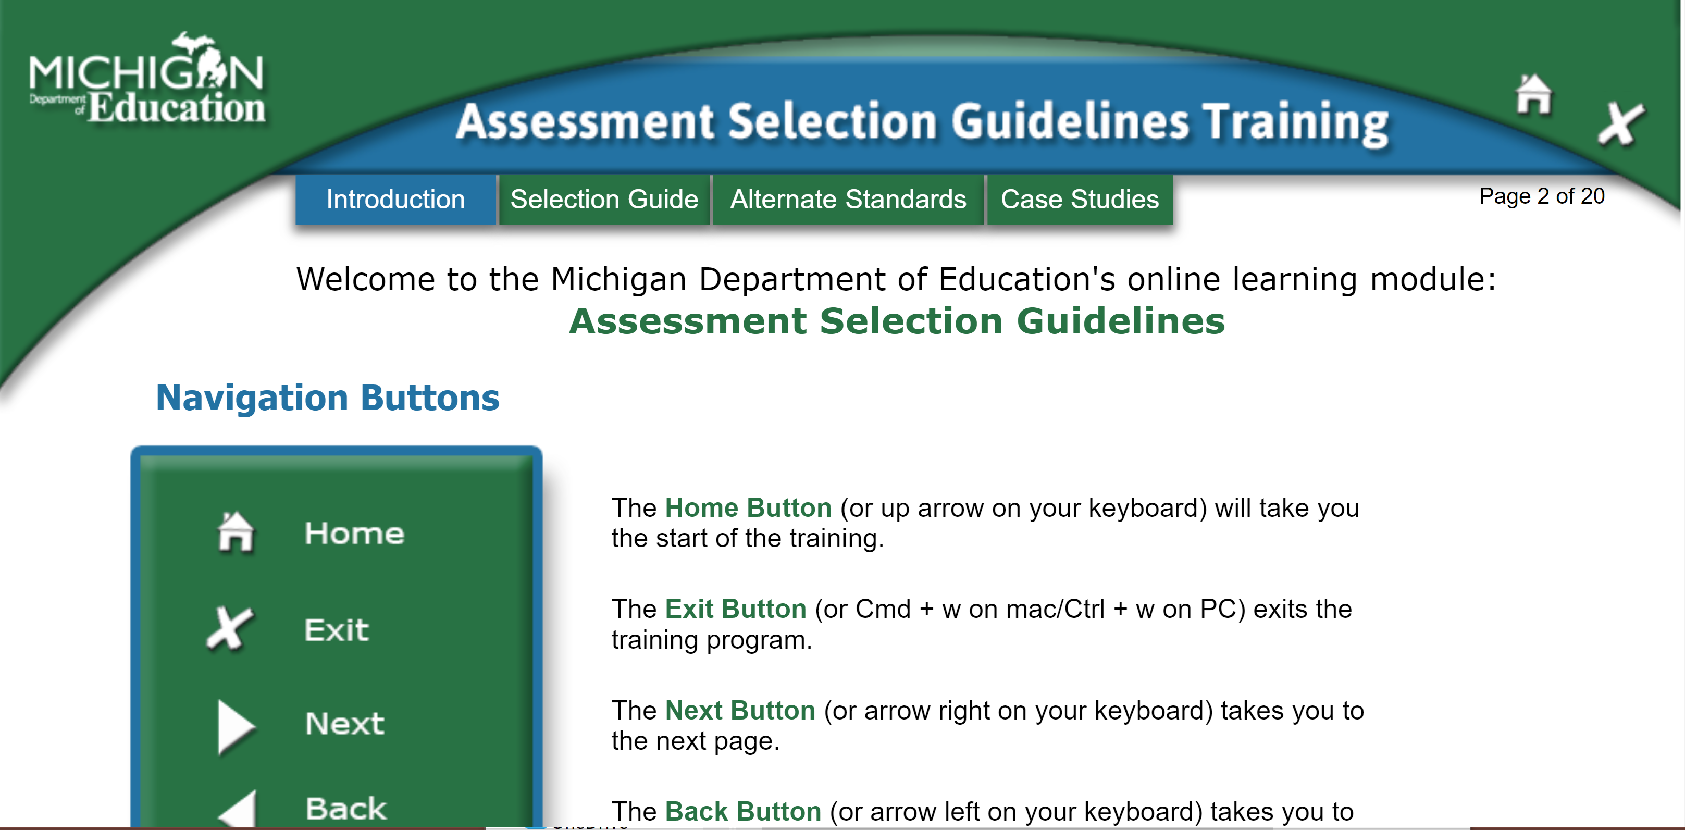
- Developed online “Assessment Selection Guidelines Training,” that includes case studies
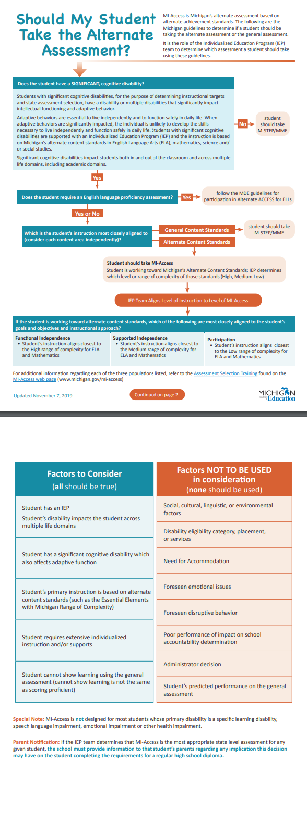
- Developed a decision making flowchart: “Should My Student Take the Alternate Assessment?”
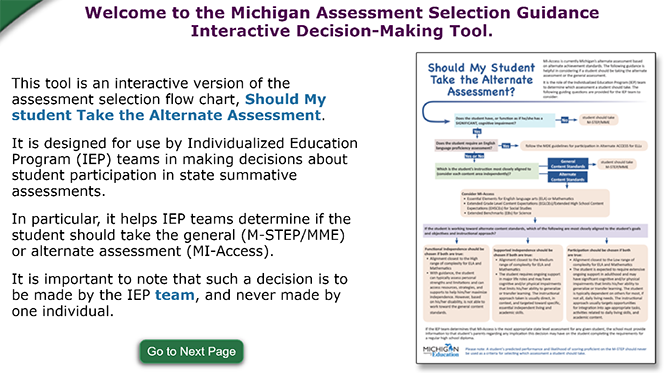
- Developed an Assessment Selection Interactive Decision-Making Tool for IEP teams to use during meetings
- Developed a tiered monitoring approach and involved regional Intermediate School Districts to help with the work
- Asked districts to review students who were flagged for disproportionality, for example, economically disadvantaged
- In the first two years of review, in each year, the MDE 1% Cap team reviewed approximately 900 justification forms and 56 Intermediate School District (ISD) Summaries and provided individualized feedback to ISDs for each member district
Challenges
Michigan identified several challenges that it had encountered, including the following:
- Need for awareness and training
- Need for training to target all educators involved in IEP team process
- Need for opportunities for parents to learn about alternate standards, the alternate assessment, implications for student participation in the alternate assessment, and the impact on receiving a regular high school diploma
- The extremely large number (900) of district justifications to be reviewed by only three or four SEA staff members
- Although, at the state level, there were no sub-groups in which the risk-ratio would indicate a concern with disproportionality, 33 LEAs were identified as having risk ratios for a particular sub-group indicating an issue with disproportionality. Those LEAs are targeted for future activities and discussions with the ISDs and SEA
Resources
Michigan has resources that are publicly available, as noted here. In addition, three resources are provided in Appendix B.
- Assessment Selection Guidelines Training:https://mdoe.state.mi.us/mdedocuments/AssessmentSelectionGuidelinesTraining/index.html
- The training can be done in group(s) or as a self-study.
- The training provides specific attention to a decision-making flowchart (Should My Student Take the Alternate Assessment?).
- The training includes six case studies to apply and practice.
- Assessment Selection Interactive Decision-Making Tool for IEP teams https://mdoe.state.mi.us/MDEDocuments/InteractiveDecision-MakingTool/index.html
- Flowchart: “Should My Student Take the Alternate Assessment?” https://www.michigan.gov/documents/mde/Should_My_Student_Take_the_Alternate_Assessment_556705_7.pdf
Michigan noted that in addition to its significant change in AA-AAAS participation rates from 2016-17 to 2017-18, it has projected its rates for 2018-19 (see Display in Appendix B), as follows:
- ELA: 1.97% (a 0.11 percentage point decrease from 2017-18, and a 0.31 percentage point decrease from 2016-17)
- Math: 2.0% (a 0.13 percentage point decrease from 2017-18, and a 0.3 percentage point decrease from 2016-17)
- Michigan also saw improvement in their State Determination Part B Results Matrix (the matrix considers what percentage of students take the regular assessment when compared to ALL students assessed. These data consider only 4th and 8th grade in Math and ELA).
- Michigan has committed to several activities in the future, with the continued intent to significantly “move the needle” on the alternate assessment participation rate.
Plans for the Future
- Explicitly define “Students with the Most Significant Cognitive Disabilities.”
- Increase LEA use of their own data in justification forms. Justification forms, as of February 2020, are electronically available for completion on the office of special education monitoring system. This will provide easy access to member districts and ISDs to complete, submit, and review data. This system also ensures the final response will be in an accessible format for public posting.
- Increase collaboration between the state and ISD on justification review in a train the trainer model.
- Focus on ensuring students are having instruction targeted correctly.
- Ask IEP teams to look critically at students identified to take Michigan’s Functional Independence assessment (Michigan has three levels for their alternate assessment. The Functional Independence assessment aligns most closely to the high range of complexity of Essential Elements or Extended Grade Level Content Expectations/Benchmarks) to determine if there are any students who should participate in the general assessment with accessibility features and accommodations.
- Enhance the focus, beyond assessment selection, to include a collaborative process for developing IEP team guidance for properly targeting instruction for students with disabilities.
- Provide opportunities for educators to share instructions, resources, and supports with each other.
Nebraska
Data
Nebraska saw a decrease in AA-AAAS reading/language arts participation rates from 1.25% in 2016-17 to 1.12% in 2017-2018 (a 0.13 percentage point decrease), and a decrease in AA-AAAS mathematics participation rates from 1.26% in 2016-17 to 1.12% in 2018 (a 0.14 percentage point decrease).
Strategies
Nebraska identified several strategies that it has used to support the reduction in AA-AAAS participation rates, as noted here:
- Conducted district monitoring for identified students and added this to department’s monitoring of IEPs
- Required districts to submit a justification regardless if they will be over the 1% or not (also asked districts to submit information on identified students along with the justification)
- Held in-depth conversations with district special education directors and educational service unit directors on identification and training
- Implemented statewide multi-tiered system of supports (MTSS)
- Some of Nebraska’s larger districts implemented their own in-house process for checking that the student meets all of the criteria for the alternate assessment. This process functions as an internal checks and balances approach. The first year a Nebraska district implemented this process the district reduced the number of students participating in the alternate assessment by 77 students. Districts communicated with other districts to share how to use this process.
Challenges
Nebraska identified several challenges it is addressing as it works to reduce the state’s alternate participation rate:
- Small districts with small numbers (116 out of 244 districts had one to four students identified for alternate assessment in the 2017-18 school year)
- High number of students identified to participate in the alternate assessment (115 out of 244 districts were over the 1% threshold in 2018 and 110 out of 244 were over in 2019)
- Teachers’ need for knowledge in effectively using the alternate assessment criteria
- Changes of staff at local level
- Providing appropriate evidence to support why a student is participating in the alternate assessment
- Some districts are not addressing “adaptive behavior.” When doing reviews this past year we found that some districts said the students met all of the criteria, but did not have any data to support that there is an impact on the student’s adaptive behavior or that an adaptive assessment was even completed on students. The next step will be to reach out to school psychologists to provide more information on what adaptive behavior is (districts may also use guidance with their staff).
Resources
Nebraska has developed many resources. The ones listed here are available in Appendix C.
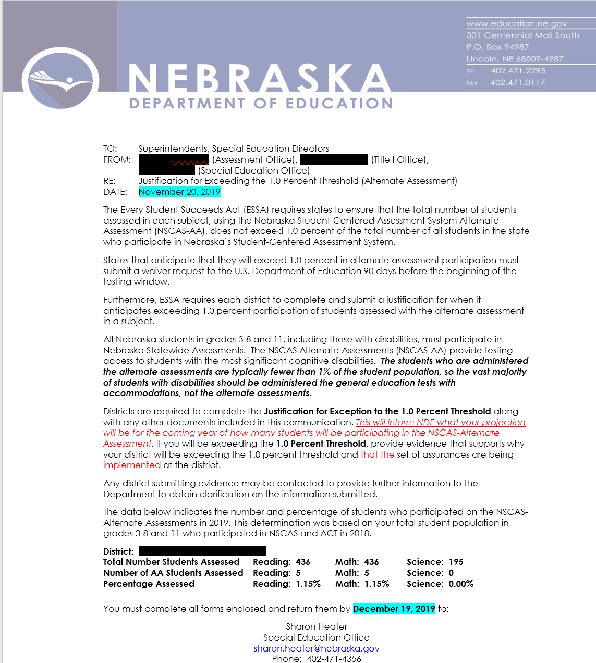
- Letter to Superintendents and Special Education Directors (explains district justifications for exceeding the 1.0% threshold on the alternate assessment)
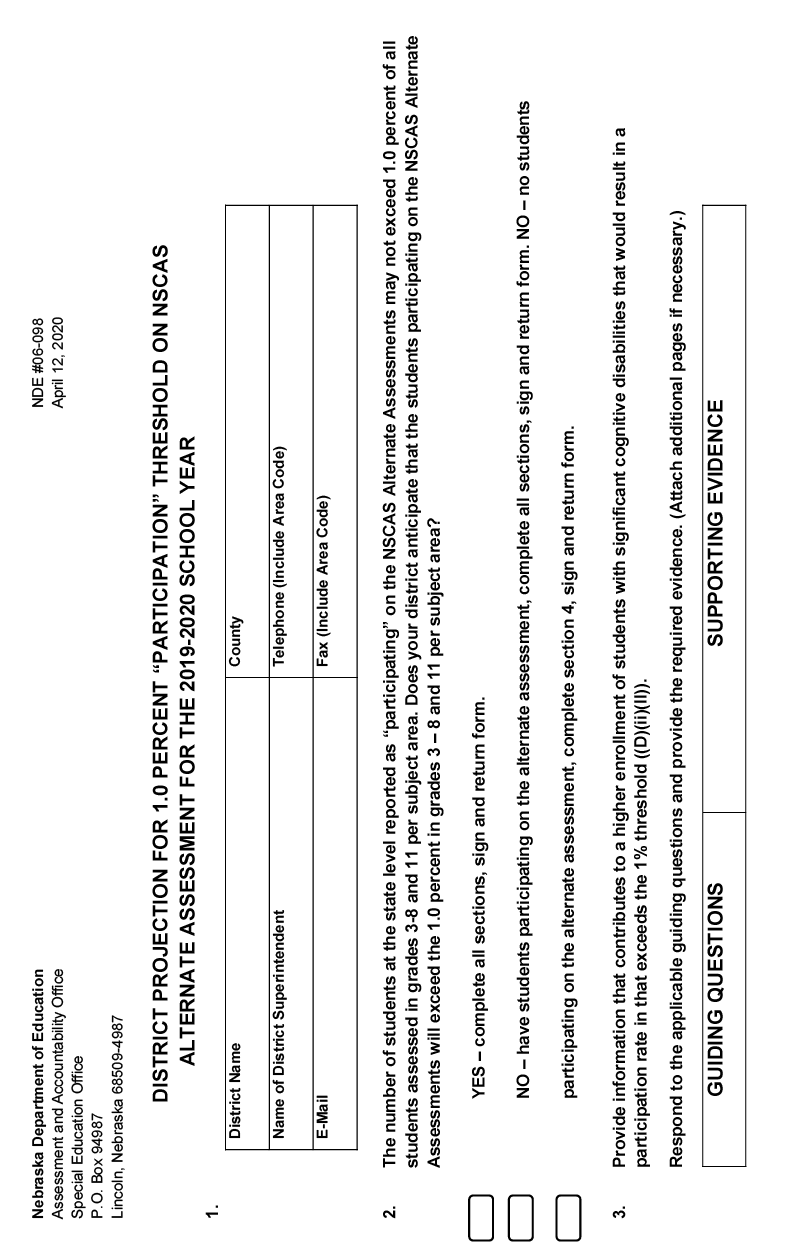
- District Justification Form (see NSCAS Alternate Documents): https://www.education.ne.gov/assessment/nscas-alternate-summative-assessment/#1574203734112-50356b4d-9bc8
- District Justification Support Worksheet (see NSCAS Alternate Documents): https://www.education.ne.gov/assessment/nscas-alternate-summative-assessment/#1574203734112-50356b4d-9bc8
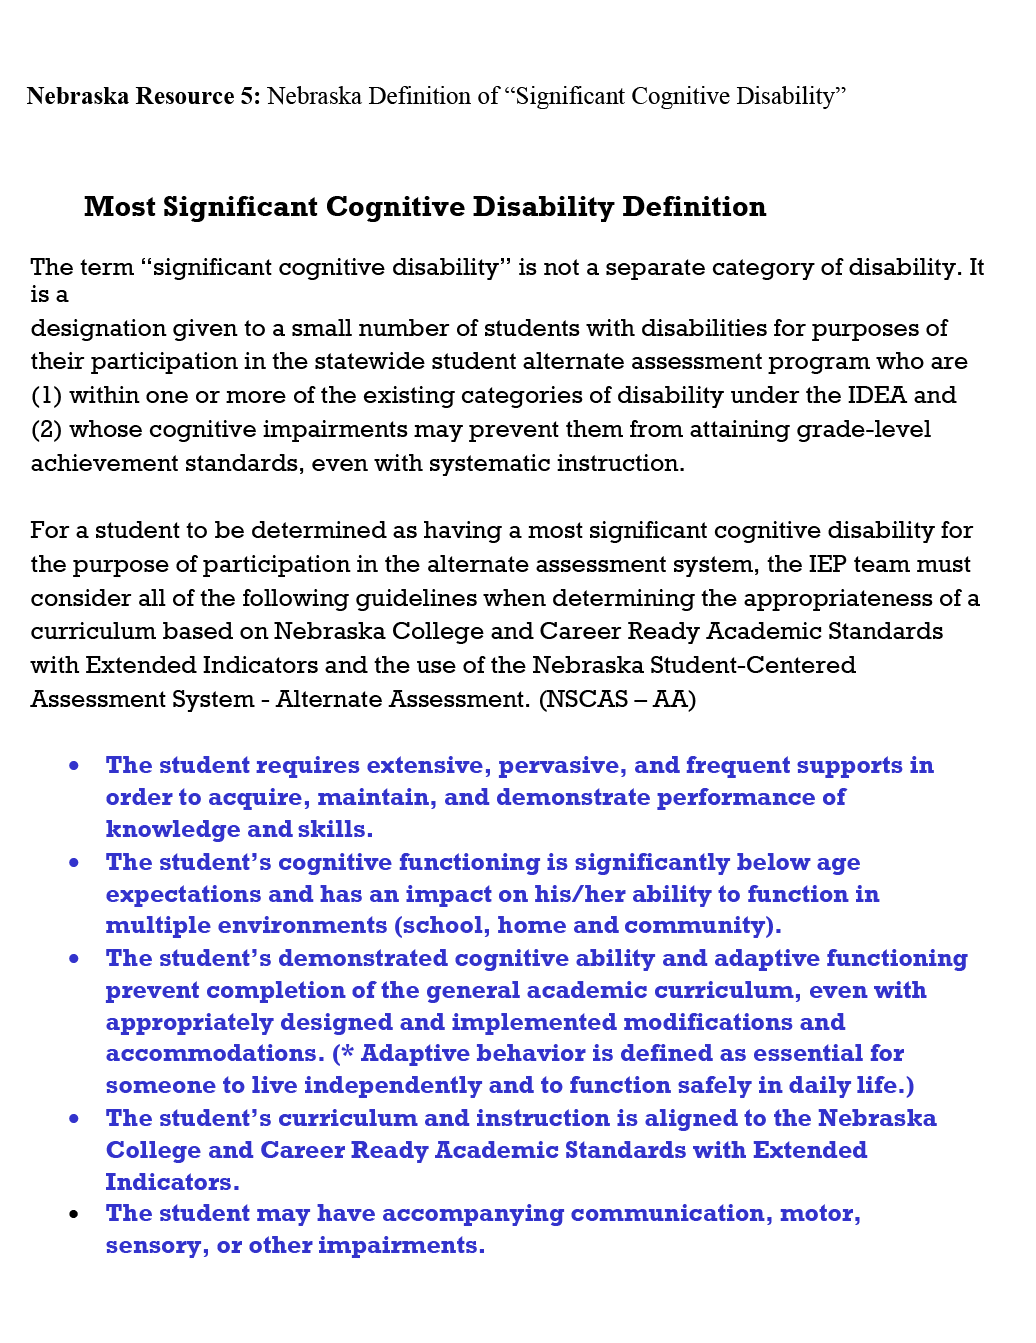
- Nebraska Definition of “Significant Cognitive Disability”
- Engaging Educators Training (this will be posted on Nebraska’s website soon)
- Nebraska Department of Education: Training PowerPoint for Alternate Assessment
Plans for the Future
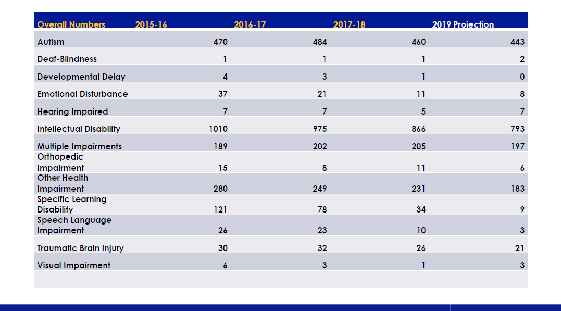
- Nebraska noted that in addition to its significant change in AA-AAAS participation rates from 2016-17 to 2017-18, it has projected its rates for 2018-19, continuing to reduce alternate assessment participation (see Display in Appendix C). Also shown in Appendix C is a display of Nebraska’s data by disability category for 2015-16, 2016-17, and 2017-18.Projections through 2018-19 are also provided.
- Nebraska will continue to monitor district participation by disability and do periodic checks to see that districts are following the NDE guidance on identification.
- Nebraska requires that districts train all staff that may be part of an IEP/MDT (multidisciplinary evaluation team) to be trained on the NDE Guidance/Guidelines on the identification of students who would qualify for the Alternate Assessment. Districts were required to provide evidence that this was completed. Districts are also required to do some type of refresher every year for all staff and provide evidence for this.
Wisconsin
Data
Wisconsin showed a decrease in percentage points of 0.15 in reading/language arts and 0.16 in mathematics from 2016-17 to 2017-18. Wisconsin’s alternate assessment participation rates in 2016 were 1.16 in both reading/language arts mathematics.
Strategies
Wisconsin undertook a number of strategies to work on its alternate assessment participation rates. These strategies were:
- Wisconsin strengthened focus on definition of students with a most significant cognitive disability by promoting use of IEP form Participation Guidelines for Alternate Assessment.
- Prior to 2017-18 test window (January-February 2018), email blasts reviewing ESSA requirements were sent to all special education directors in the state. The emails also included state department webpage links to information highlighting the state definition of students with a most significant cognitive disability and to guides for IEP teams. As a result of the email blast, many directors requested additional information and guidance.
- Special Education Consultants met periodically with regional support network staff to share the same information sent to special education directors and to request their support in providing guidance to the directors in their regions.
- Throughout the year, state Special Education Consultants participated in workshops or break out presentations at as many statewide conferences as possible, sharing the guidelines.
Challenges
Wisconsin has addressed several challenges in its work to lower AA-AAAS participation rates.
- Wisconsin has findings that many IEP teams might not have had the information needed to make appropriate decisions. IEP teams may need to consider if a re-evaluation is needed to gain evidence to support if the student is a student with a most significant cognitive disability.
- There is frequent turnover of teachers, special education teachers, district assessment coordinators, and staff across the state; therefore, there is a need for ongoing professional development.
Resources
Wisconsin has made the following resources available:
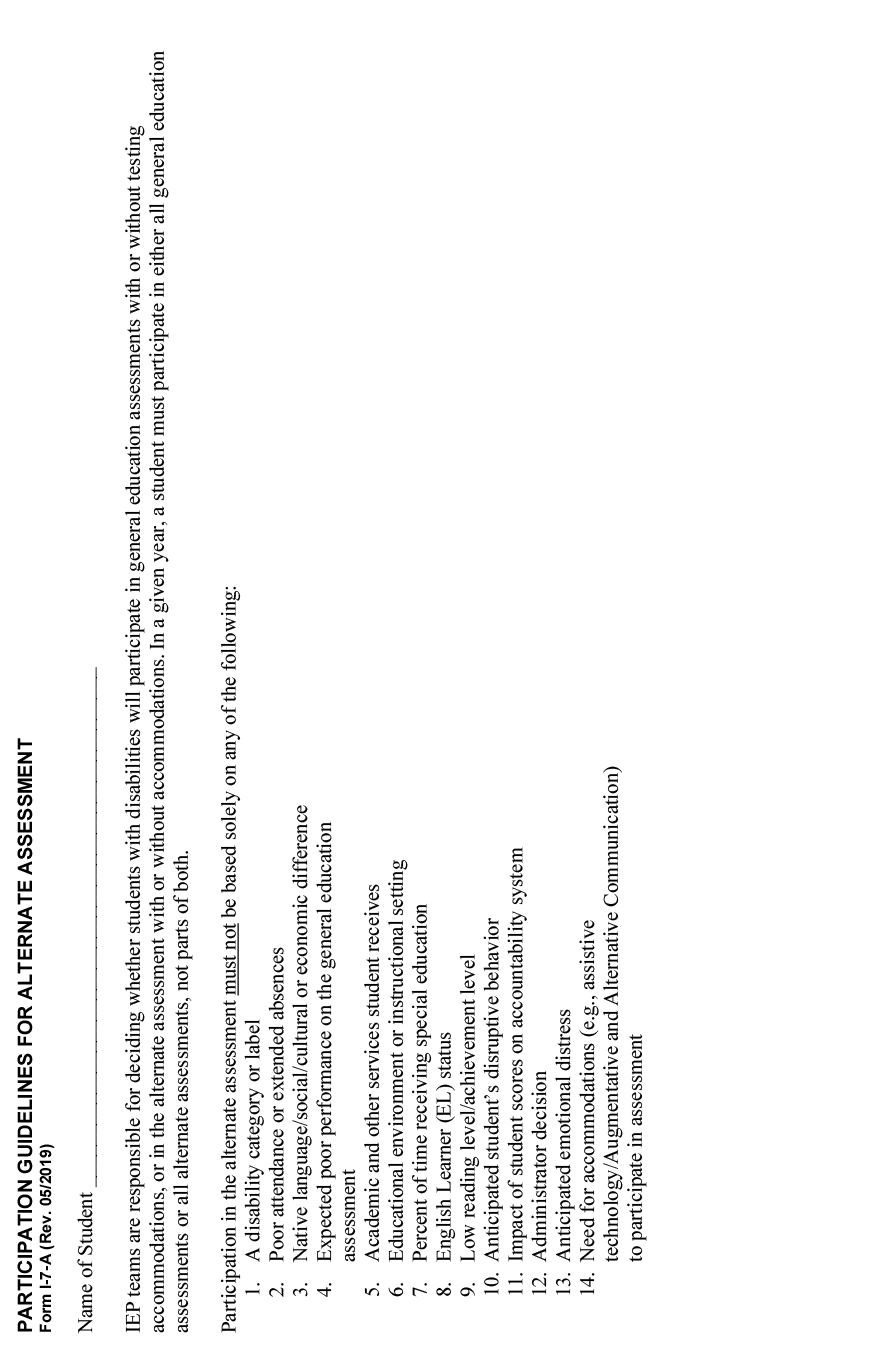
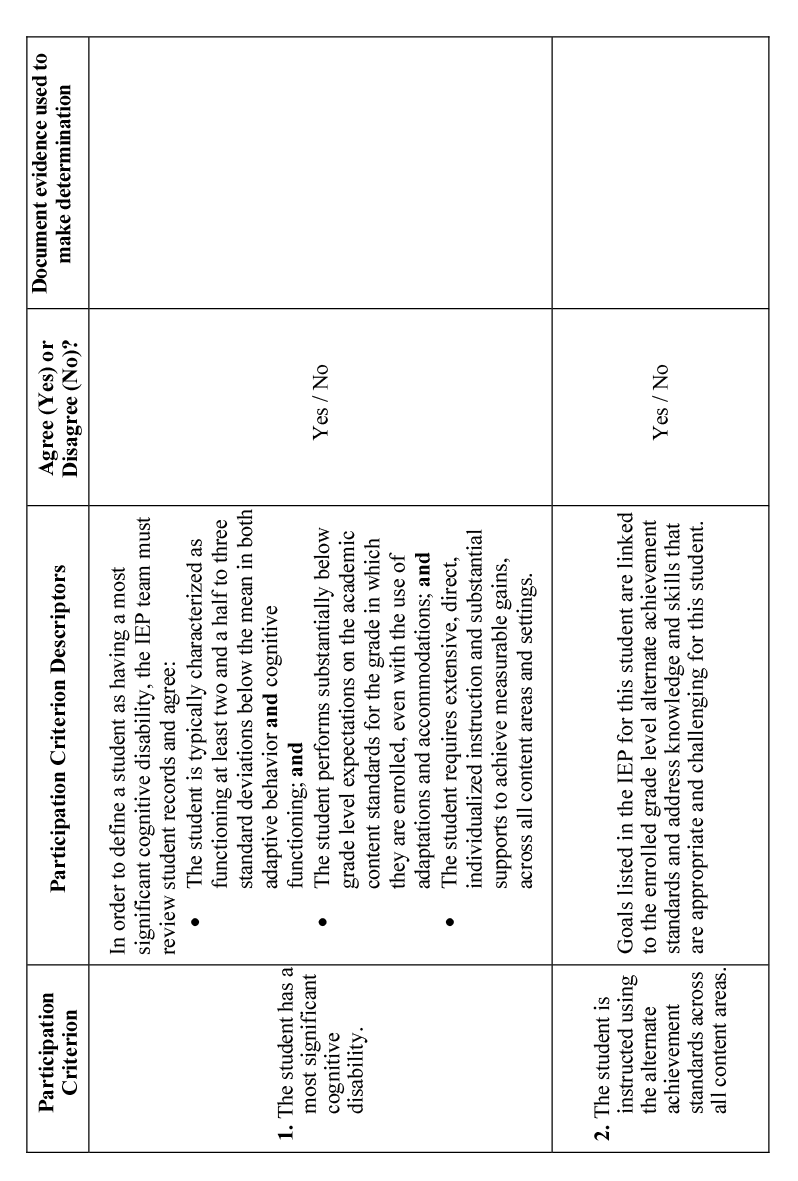
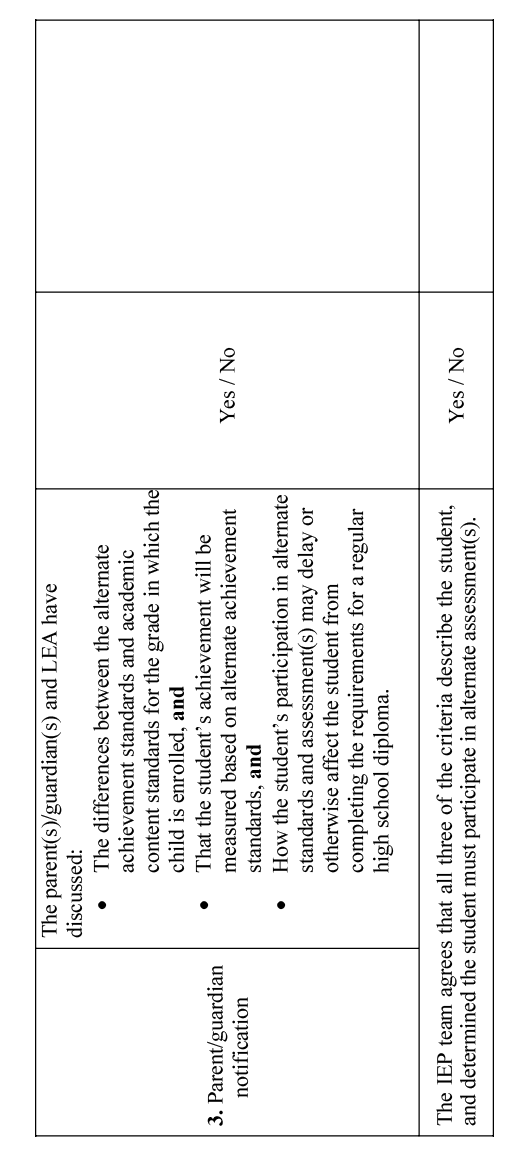
- IEP forms I-7A: Participation Guidelines for Alternate Assessment
- Guide to Determining Students with the Most Significant Cognitive Disability
- Webpage: Students with a Most Significant Cognitive Disability
Plans for the Future
Wisconsin reported that the state did see a decrease in AA-AAAS participation rates from 1.0% in 2017-18 to 0.9% in 2018-19.
New for 2019-20:
- Adding to IEP form I-7A for IEP teams to consider evidence matching the criteria guidance
- Planning a closer look of AA-AAAS performance results and compare with those districts exceeding 1%
- Changing the 1% notification and verification process to an online application process
- Continuing to work with regional support network directors and provide presentations at many statewide conferences
- Developing a module for webpage explaining ESSA 1.0% requirement by summer 2020
Additional Considerations
What is Substantial Progress?
In 2019 the U.S. Department of Education established that substantive progress is defined as having at least a 0.1 percentage point decrease in the percentage of alternate assessment participation for a subject area. Although this report highlights five states that met this criterion in both reading/language arts and mathematics, other states in the NCEO 1% Community of Practice shared evidence of progress in their plans, strategies, guidance, timelines, and district oversight activities, along with their expectation that these efforts would lead to reductions in AA-AAAS participation rates in the future. Examples include Idaho’s initiative to update its participation criteria and provide intensive technical assistance to districts with high participation rates. Another example is Kentucky’s requirement for mandatory participation in online statewide training modules for administrators and educators with a training emphasis on IEP simulation using student case scenarios.
95% Assessment Participation Requirement
Some states are grappling with their assessment participation rates for all students and for students with disabilities. States that wish to apply for a waiver or waiver extension (if the state expects to exceed the 1.0% AA-AAAS participation threshold) must meet this requirement [§200.6(c)(4)(ii)] in order to be approved for a waiver or waiver extension. Opting out movements in some states have contributed to the state’s inability to meet the 95% participation rate requirements. There is currently little to no guidance, research, or best practices to help states address this problem. Nevertheless, it will undoubtedly receive more attention in the future.
Meeting the 1.0% Threshold in the Science AA-AAAS
The U.S. Department of Education’s 1.0% threshold requirements apply to reading, math, and science. Some states are finding it more difficult to meet the threshold in science. Education leaders have suggested that a history of exclusion of students with disabilities from science coursework has contributed to this issue.
Conclusion
As states continue to address the requirements of meeting the 1.0% threshold in the AA-AAAS they find the NCEO 1% Community of Practice state sharing of approaches, ideas, questions, discussion, and resources to be an invaluable support to the 1.0% work in their own state. The 1% CoP and NCEO’s sharing of state spotlights to highlight successes (through this and future reports) hopefully will continue to contribute to states’ efforts to address AA-AAAS participation rates.
Appendix A
Arkansas Resources
- PowerPoint Training Slide Examples and Link to the Training Video
- Guidance for IEP Teams
- Arkansas Participation Guidelines
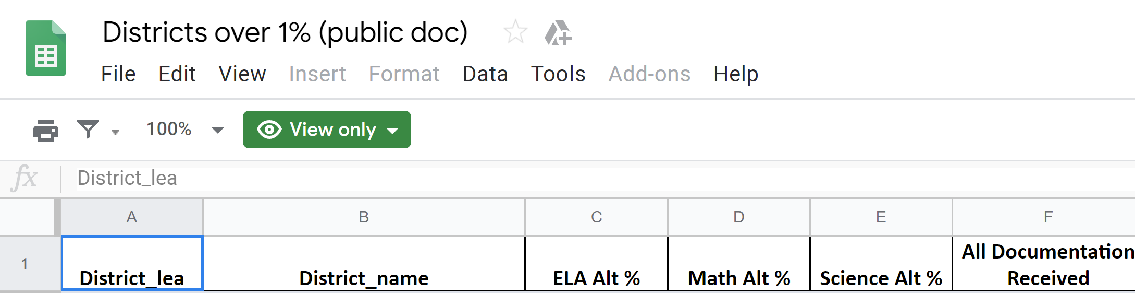
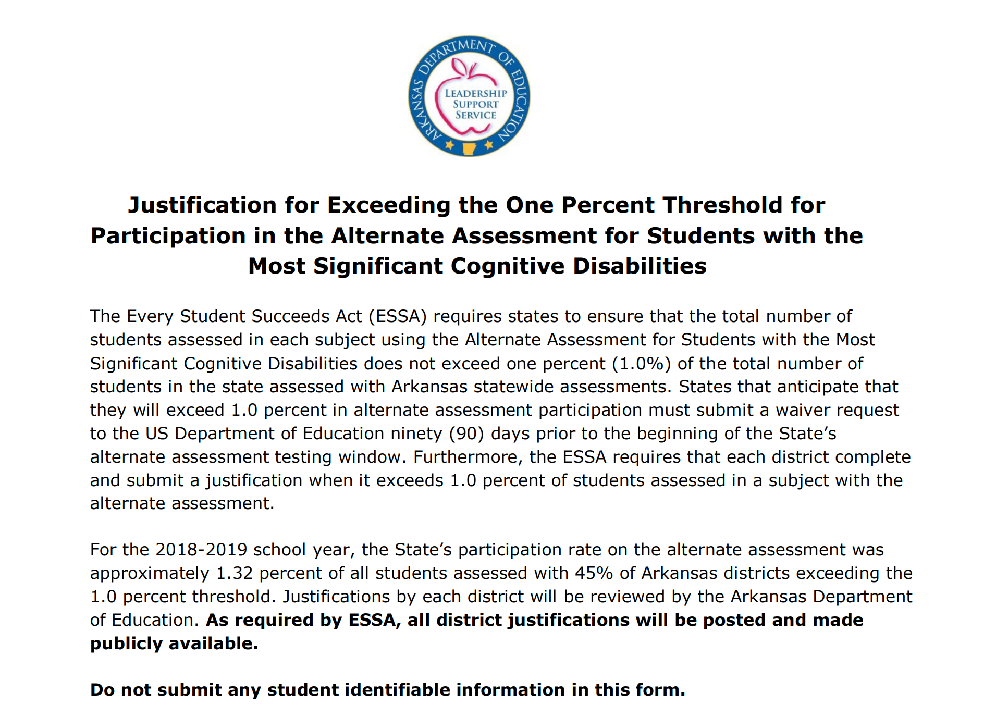
- List of Arkansas Districts Over the 1.0% Threshold
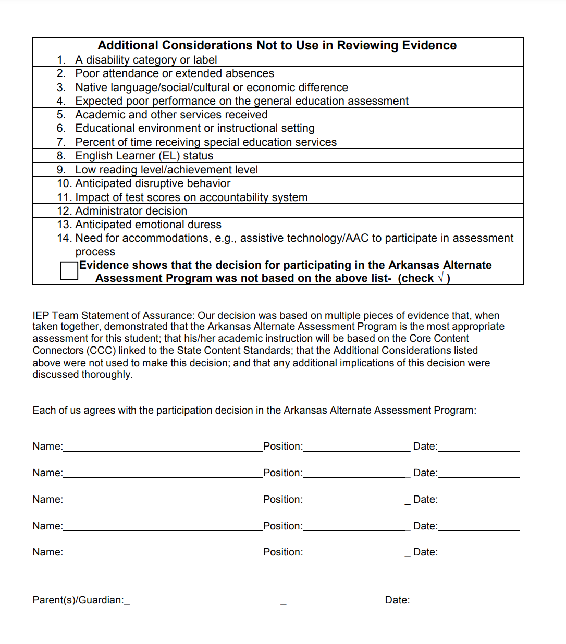
- LEA Justification Documentation
Arkansas Resource 1: Selected Slides (identified as Examples A, B, and C) from PowerPoint Training and Link to the training is at http://dese.ade.arkansas.gov/divisions/learning-services/special-education/presentations. Select the last item on the page to view the video.
Slide A Example:
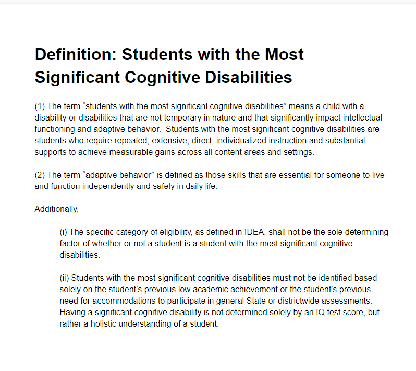
Slide B Example:
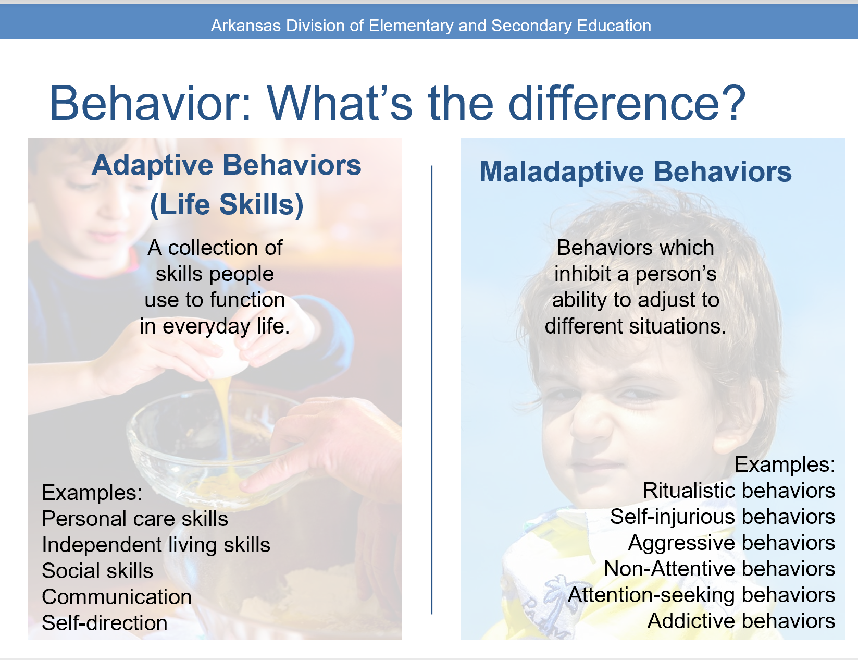
Slide C Example:
Arkansas Resource 2: Guidance for IEP Teams at http://dese.ade.arkansas.gov/public/
userfiles/Learning_Services/Student%20
Assessment/DLM/Guidance_for_IEP_
Teams_on_Alternate_Assessment_2018-2019.pdf
Arkansas Resource 3: Arkansas Participation Guidelines at
http://adecm.arkansas.gov/
Attachments/LS-16-084
ArkansasAlternate
Assessment
ParticipationDecisionGuidelines.pdf
Arkansas Resource 4: List of Arkansas Districts Over the 1.0%
Threshold at
Districts
required to provide justifications for alternate assessment
participation rates
Arkansas Resource 5: LEA Justification Documentation:
LEA
Alternate Assessment Justification Documentation
Appendix B
Massachusetts Resources
- Decision Making Tool
- MCAS-Alt Participation by Percent in each Disability Category (Circle Graph)
- Sample MCAS-Alt District Data Display
Massachusetts Resource 1: Decision-Making Tool
Massachusetts Resource 2: 2019 MCAS-Alt by Disability
Massachusetts Resource 3: Sample MCAS-Alt District Data Display
Appendix C
Michigan Resources
- Assessment Selection Guidelines Training
- Flowchart: “Should My Student Take the Alternate Assessment?”
- Interactive Decision-Making Tool
- Data Display: 1% Cap – Where is Michigan Now?
Michigan Resource 1: Assessment Selection Guidelines Training at
https://mdoe.state.mi.us/mdedocuments/AssessmentSelectionGuidelinesTraining/index.html
Michigan Resource 2: Flow Chart, “Should My Student Take the
Alternate Assessment?” at
https://www.michigan.gov/documents/mde/Should_My_Student_Take_
the_Alternate_Assessment_556705_7.pdf
Michigan Resource 3: Interactive Decision-Making Tool
at
https://mdoe.state.mi.us/MDEDocuments/InteractiveDecision-MakingTool/index.html
Michigan Resource 4: Data Display: 1% Cap – Where is Michigan Now?
|
|
Spring 2017 |
Spring 2018 |
Spring 2019 |
|||
|---|---|---|---|---|---|---|
|
Subject |
Percent |
Count |
Percent |
Count |
Percent |
Count |
|
ELA |
2.28 |
17,867 |
2.08 |
15,875 |
1.97 |
14,825 |
|
Mathematics |
2.32 |
18,151 |
2.15 |
16,388 |
2.02 |
15,179 |
Subject |
Percent Change |
Count change |
|---|---|---|
ELA |
-0.31 |
-3,042 |
Mathematics |
-0.30 |
-2,972 |
Appendix D
Nebraska Resources
- Letter to Superintendents and Special Education Directors
- District Justification Form
- District Justification Support Worksheet
- Data Projections
- Nebraska Definition of “Significant Cognitive Disability”
- “Engaging Educators” Training
- Nebraska Department of Education: Training PowerPoint for Alternate Assessment
Nebraska Resource 1: Letter to Superintendents and Special Education Directors
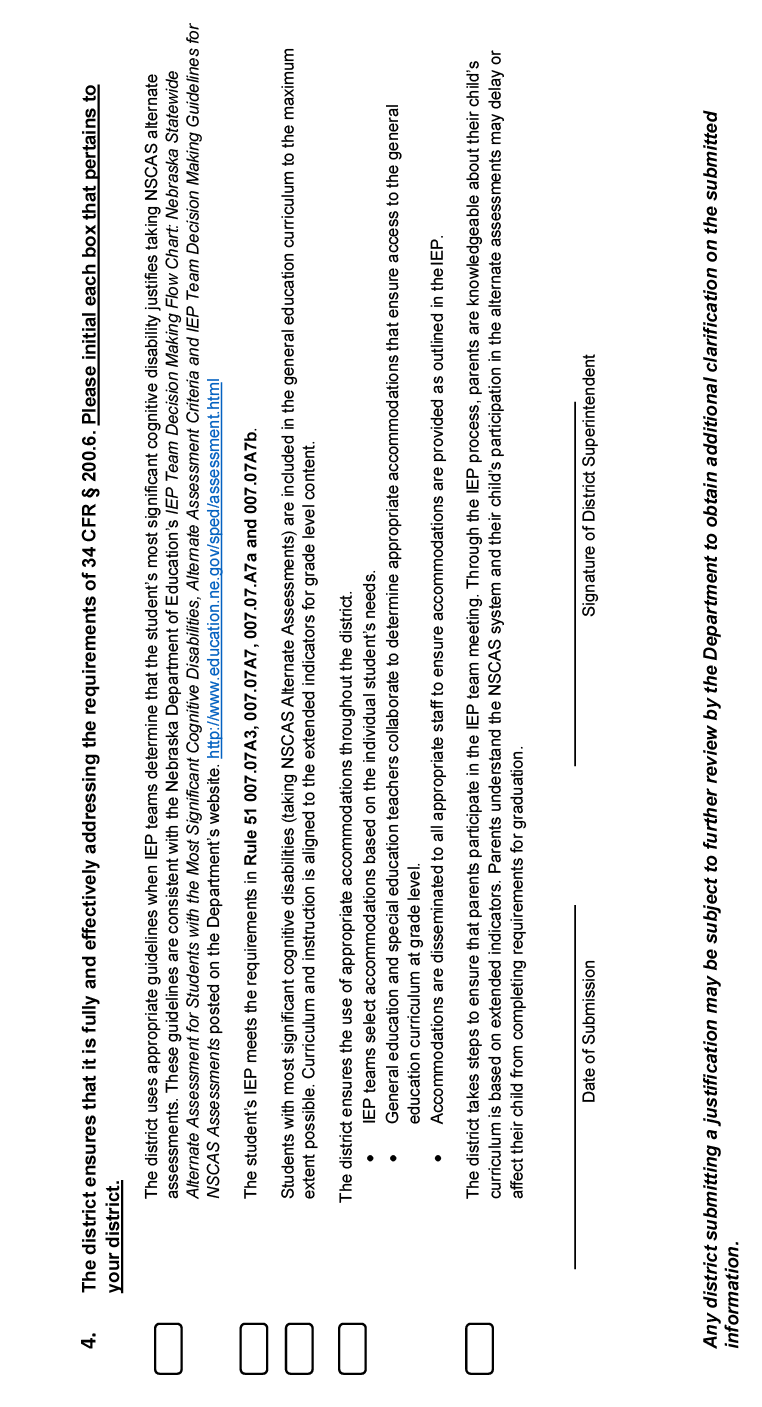
Nebraska Resource 2: District Justification Form
https://www.education.ne.gov/assessment/nscas-alternate-summative-assessment/#1574203734112-50356b4d-9bc8. See NSCAS Alternate Documents.
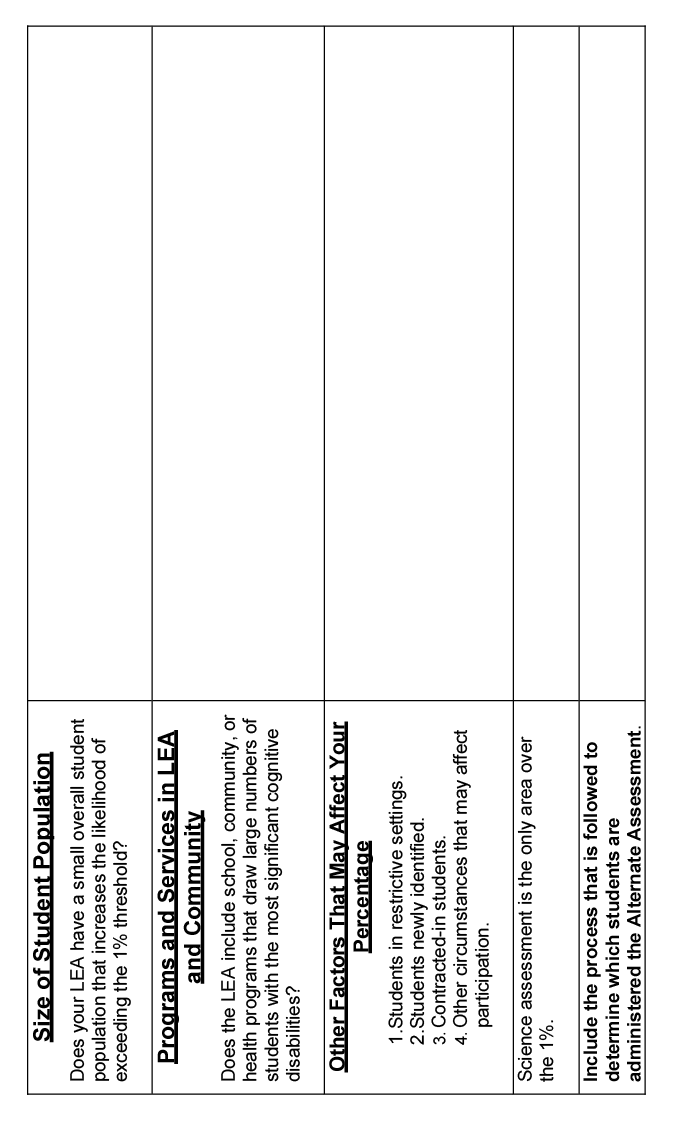
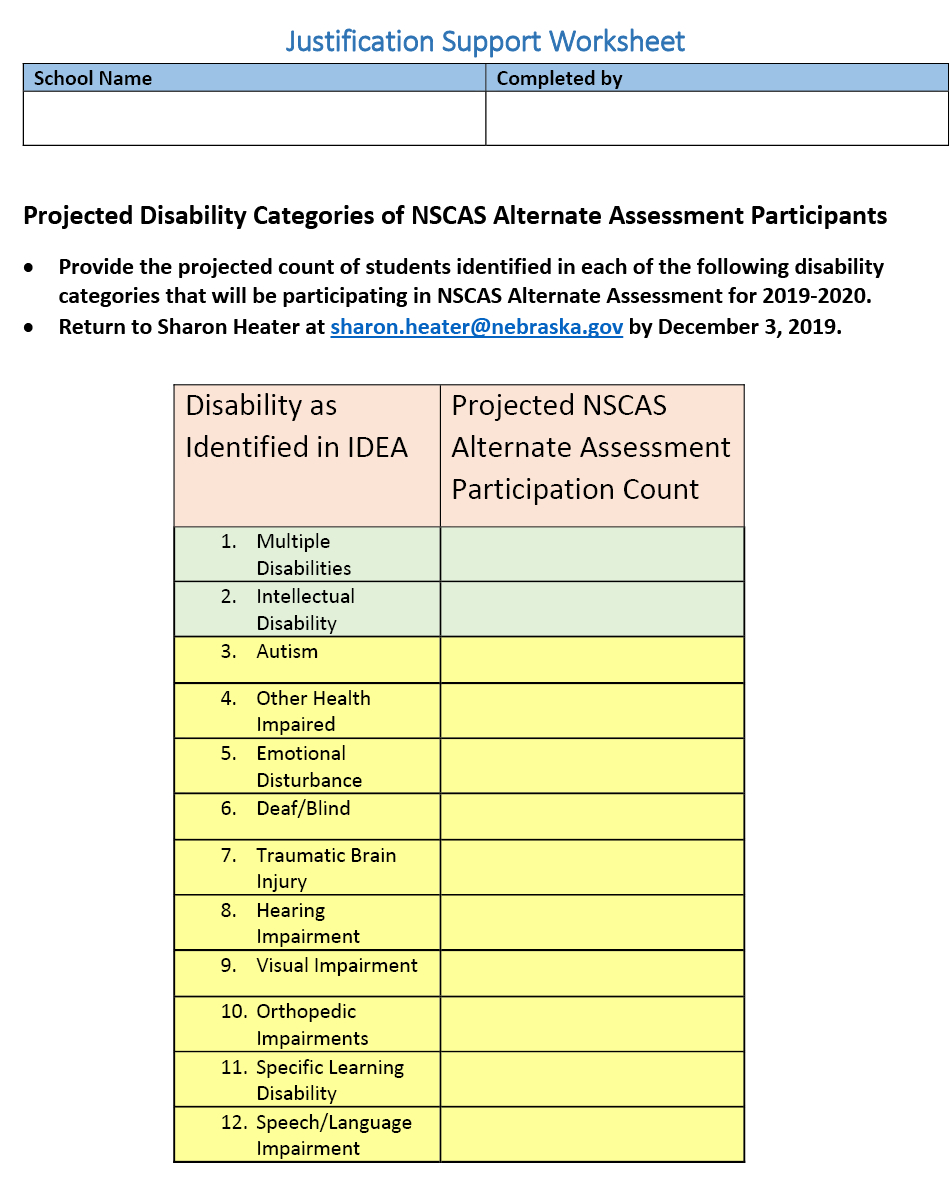
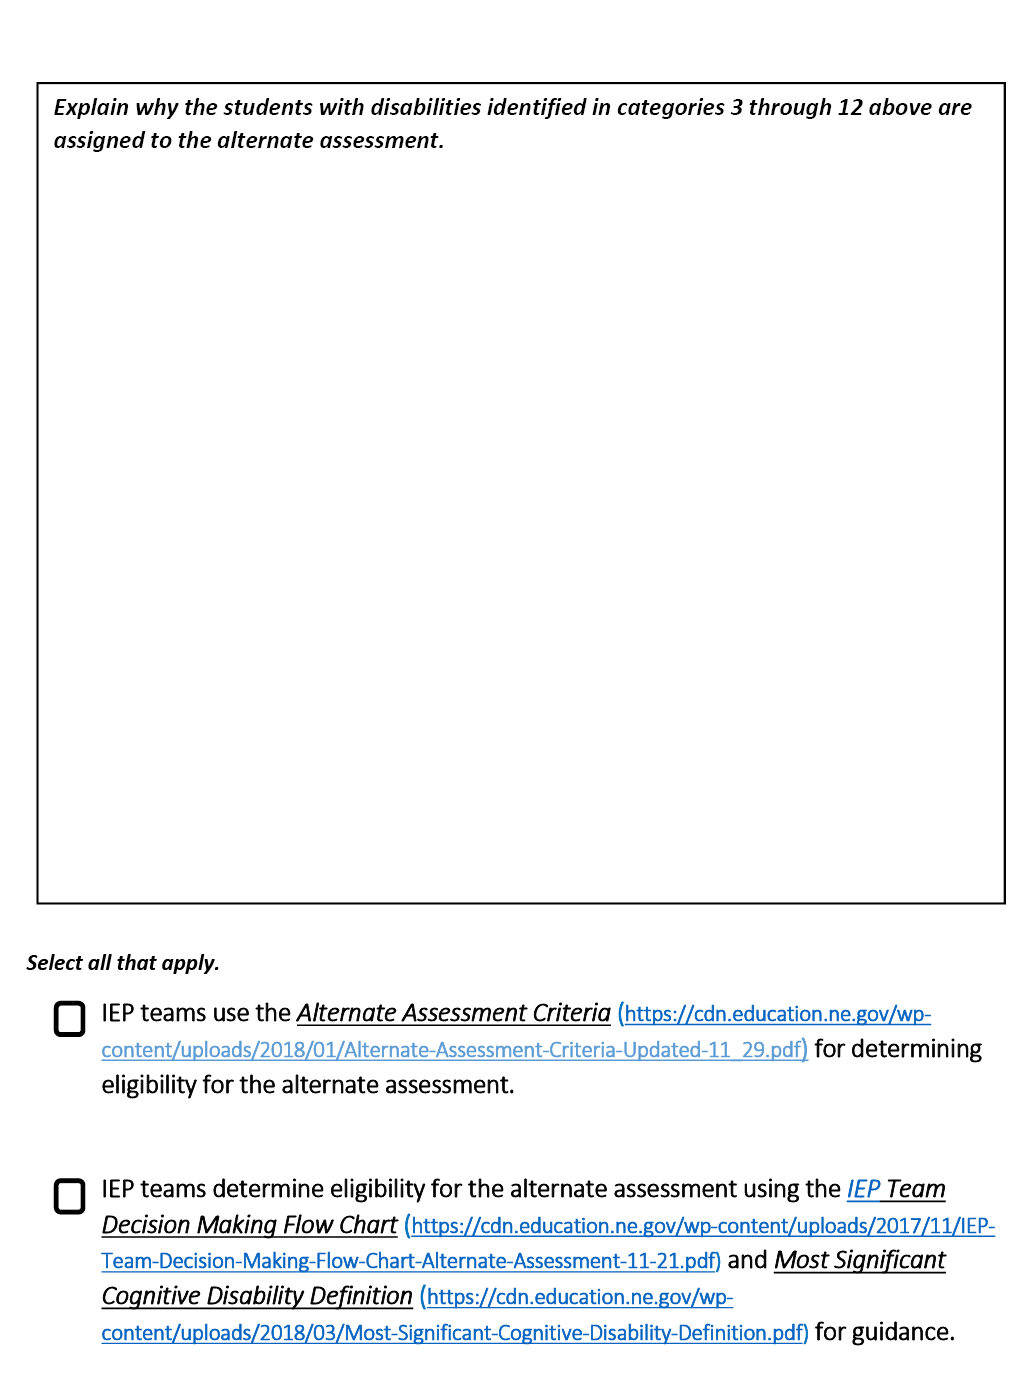
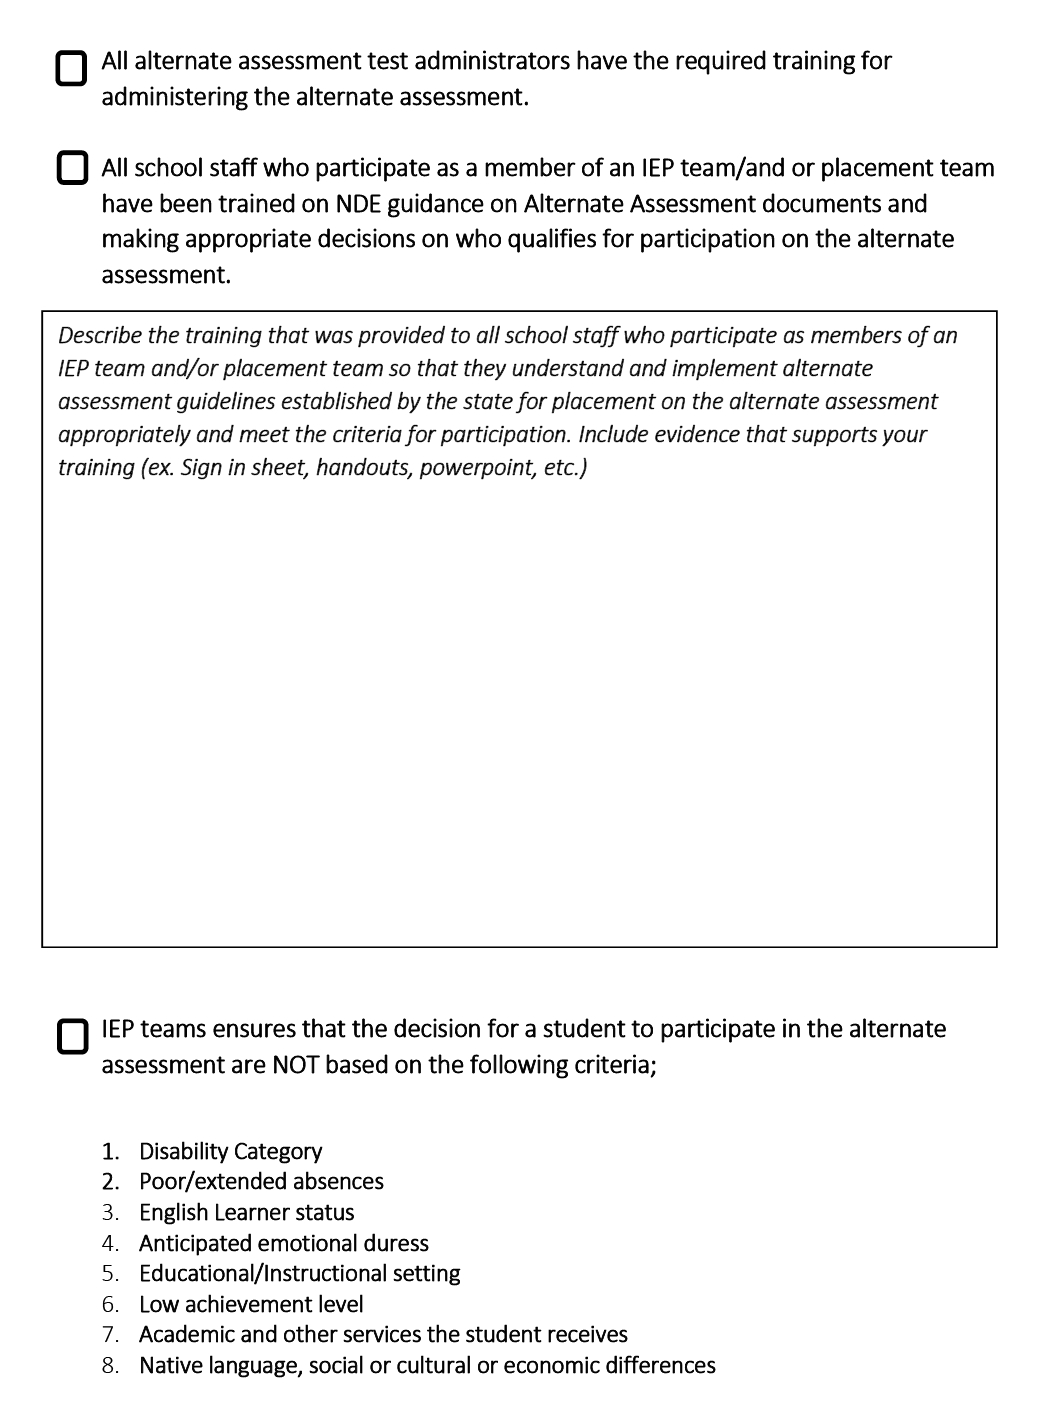
Nebraska Resource 3: District Justification Support Worksheet at
https://www.education.ne.gov/assessment/nscas-alternate-summative
-assessment/#1574203734112-50356b4d-9bc8.
See NSCAS Alternate Documents.
Nebraska Resource 4: Data Projections
| Participation Data | |||||||
|---|---|---|---|---|---|---|---|
| NSCAS Alternate Assessment | |||||||
| 2017 | 2018 | 2019 | 2020 Projections |
||||
| Number | Percent | Number | Percent | Number | Percent | Number | |
| ELA | 2054 | 1.27 | 1833 | 1.12 | 1716 | 1.04 | 1778 |
| MATH | 2058 | 1.27 | 1831 | 1.12 | 1715 | 1.04 | 1778 |
| SCIENCE | 892 | 1.30 | 817 | 1.19 | 733 | 1.04 | 785 |
Nebraska Resource 6: Engaging Educators Training (this will be on Nebraska’s website soon)
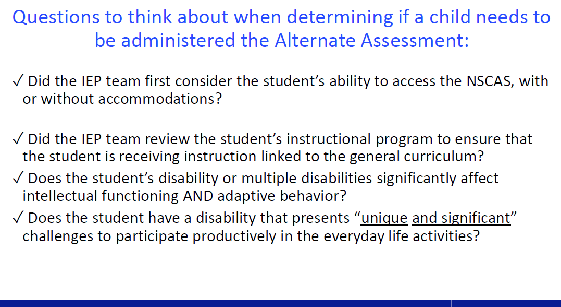
Selected slides are shown below, labeled as A. B. and C.
Slide A Example:
Slide B Example:
Slide C Example
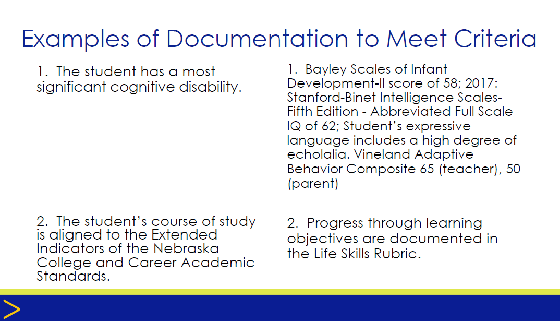
Nebraska Resource 7: Nebraska Department of Education: Training PowerPoint for Alternate Assessment (this will be on Nebraska’s website soon)
Selected slides are shown below, labeled as A. B. and C.
Slide A Example:
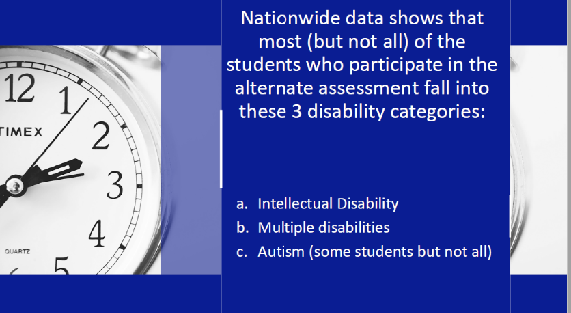
Slide B Example:
Slide C Example:
Appendix E
Wisconsin Resources
- IEP forms I-7A Participation Guidelines for Alternate Assessment
- Guide to Determining Students with the Most Significant Cognitive Disability
- Webpage: Students with a Most Significant Cognitive Disability
Wisconsin Resource 1: IEP forms I-7A Participation Guidelines for
Alternate Assessment
This resource may be accessed at Participation
Guidelines for Alternate Assessment.
Wisconsin Resource 2: Guide to Determining Students with the Most Significant Cognitive Disability: This resource may be accessed at: https://dpi.wi.gov/sites/default/files/imce/sped/pdf/mscd-guide-to-determining-students-with-mscd.pdf
Wisconsin Resource 3: Webpage, Students with a Most Significant Cognitive Disability at https://dpi.wi.gov/sped/program/students-most-significant-cognitive-disabilities