Martha L. Thurlow, Deb A. Albus, and Sheryl S. Lazarus
May 2017
All rights reserved. Any or all portions of this document may be reproduced and distributed without prior permission, provided the source is cited as:
Thurlow, M. L., Albus, D. A., & Lazarus, S. S. (2017). 2014-15 publicly reported assessment results for students with disabilities and ELs with disabilities (NCEO Report 405). Minneapolis, MN: University of Minnesota, National Center on Educational Outcomes.
This is the eighteenth report by the National Center on Educational Outcomes (NCEO) that describes how states publicly report online assessment data for students with disabilities in K-12 schools in the United States. The 2015 reauthorization of the Elementary and Secondary Education Act (ESEA), as well as the Individuals with Disabilities Education Act (IDEA), continues to require states to disaggregate participation and performance data at the state level for all students and student subgroups.
This report presents information on publicly reported participation and performance data for students with disabilities for the 50 regular states and the 11 unique states (American Samoa, Bureau of Indian Education, Commonwealth of Northern Mariana Islands, U.S. Department of Defense Education Activities, District of Columbia, Federated States of Micronesia, Guam, Palau, Puerto Rico, Republic of the Marshall Islands, and U.S. Virgin Islands).
For the 2014-15 school year, 42 of the 61 states reported participation and performance data for students with disabilities for all general assessments, and 37 states reported these data for all alternate assessments based on alternate achievement standards (AA-AAS) that were used for the Title I accountability system. During this school year, many states were field-testing new assessments for either their general consortia assessments or alternate consortia assessments. Therefore, the reporting of assessment data was affected to some degree for this reporting cycle. Information about state assessments not used for Title I is also presented.
Information on public reporting for English Learners (ELs) with disabilities is also included in this report. Only 3 states reported both participation and performance for ELs with disabilities for the general assessment. But, as in previous years, more states (N=12) reported these same data for ELs with disabilities on the AA-AAS.
A majority of states reported some participation and performance data by individual grade and test for students with disabilities, though a few only reported these data by merged grades. Thirty-nine states reported student performance by achievement level, and 37 reported the percent proficient.
The public reporting of data will continue to be an essential part of accountability systems. It is anticipated that states will continue to refine how they report data. The following recommendations are offered to states for the public reporting of disaggregated data for students with disabilities:
Top of Page | Table of Contents
Under the 2015 reauthorization of the Elementary and Secondary Education Act (ESEA) and the continuation of the Individuals with Disabilities Education Act (IDEA) of 2004, the requirement continues for states that receive federal funding, including unique states, to report reading, mathematics, and science assessment data to the federal government for all students and student subgroups. States also are required to report these data to the general public. In the 2014-15 school year many states were field-testing new assessments. Therefore, the reporting of assessment data was affected to some degree for this reporting cycle. States report these data online to the public in several ways, including as state report cards, state assessment reports, and customized data reports generated on state education websites (Albus, Lazarus, & Thurlow, 2014; Lazarus, Albus, & Thurlow, 2016).
The purpose of this report is to examine the extent to which states reported 2014-15 assessment data for students with disabilities "to the public with the same frequency and in the same detail as it reports on the assessment of nondisabled children," as required by IDEA (Wiley, Thurlow, & Klein, 2005). It also describes how states report assessment participation and performance data to the public online. It summarizes these data for grades 4 and 8, and high school, with additional analyses that focus on average performance gaps across years. Additionally, the report summarizes the extent that states report participation and performance for English learners (ELs) with disabilities. It also examines the public reporting of accommodated student data for any student subgroup.
The National Center on Educational Outcomes (NCEO) has tracked and analyzed public reporting for the students with disabilities subgroup for more than 15 years. In 2013-14, the total number of regular and unique states reporting disaggregated participation and performance data online for students with disabilities was 45 states (Lazarus, Albus, & Thurlow, 2016). This showed a decrease of 7 states from the 52 that reported these data in the previous year, 2012-13. Prior to 2012-13, the number had been 49 states in 2011-12, 53 states in 2010-11, and 46 states in 2008-09 and 2007-08 (Albus, Lazarus & Thurlow, 2015; Albus & Thurlow, 2013; Thurlow, Bremer, & Albus, 2011; Albus, Thurlow, & Bremer, 2009). From 2002-03 to 2006-07, the number of states reporting participation and performance varied between 35 states and 39 states (Klein, Wiley, & Thurlow, 2006; Thurlow, Bremer, & Albus, 2008; Thurlow & Wiley, 2004; Thurlow, Wiley, & Bielinski, 2003; Wiley, Thurlow, & Klein, 2005; VanGetson & Thurlow, 2007).
In 2013-14, the number of states that reported disaggregated participation and performance data for alternate assessments based on alternate achievement standards (AA-AAS) was 48. During the past 10 years, the number of states reporting for the AA-AAS had been as high as 52 in 2012-13 and as low as 36 states in 2006-07 and 2007-08.
Top of Page | Table of Contents
Between January and March 2016, state department of education websites were searched for publicly available reports that disaggregated participation and performance data for students with disabilities for the 2014-15 school year (i.e., state assessment reports, state report cards, customized report generators, and other report formats). The Annual Performance Report (APR) that states submit for federal accountability was not included in the analysis.
States included in the search were the 50 "regular" states and the 11 "unique" states (American Samoa, Bureau of Indian Education, Commonwealth of Northern Mariana Islands, U.S. Department of Defense Education Activities, District of Columbia, Federated States of Micronesia, Guam, Palau, Puerto Rico, Republic of the Marshall Islands, and U.S. Virgin Islands). Participation and performance data were collected, as well as information about how states reported those data. Data collection included all general and alternate assessments regardless of whether they were used for the Title I accountability system, including those assessments designed for bilingual students or ELs that were either general or alternate assessments.
Individual state summary tables were prepared for verification using the information gathered about how states reported participation and performance. These verification materials were sent to state assessment directors and state directors of special education in July 2016. Twelve regular states and one unique state responded to the verification request. After the verification was completed, the information on how and whether states reported participation and performance was summarized and additional information on participation rates and proficiency rates were analyzed. Double-checks of the data were completed for accuracy. See Appendix A for a sample email sent to the state directors and sample tables used in the verification process.
Different types of assessments are given in states to serve one or more purposes. For example, some are given for accountability, while others are for diploma or graduation purposes. Some assessments may serve dual purposes within a state. Although the data collected for this report included all state level administered assessments found on state websites, this report focuses on how states publicly reported participation and performance data for students with disabilities on general assessments and AA-AAS. For this analysis, assessments were defined as follows:
General assessment: Any assessment intended for students without disabilities and most students with disabilities that is designed to measure content area performance for Title I accountability or for exit or diploma purposes. General assessments may include end-of-course assessments for states that have them.
Alternate assessment based on alternate achievement standards (AA-AAS): Any assessment intended for a very small percentage of students with disabilities who have significant cognitive disabilities to measure content area performance for Title I accountability, or for exit or diploma purposes. AA-AAS may include end-of-course assessments for states that have them.
For the few states that administer additional types of alternate assessments, such as those using modified achievement standards or grade-level achievement standards, we provide only basic information on how they reported those data.
Changes in policies for reporting data to the U.S. Department of Education over time, as well as adjustments in our own criteria, which narrowed after 2004-05, likely have affected the numbers of states counted as reporting on the general assessment and AA-AAS across years. APR data were not counted as publicly reported data after 2004-05 because these data were not necessarily reported with the same frequency and detail as public reporting for all students (see Thurlow et al., 2008).
Top of Page | Table of Contents
Results are presented in five sections in this report. The first section presents information about how states reported participation and performance data for students with disabilities for general and alternate assessments used for Title I accountability as well as those assessments not used for Title I accountability. It also examines how the same data were reported for ELs with disabilities. The second section describes the approaches states used to report participation data for general assessments. The third section describes the approaches states used to report performance data for general assessments. The fourth section presents select general assessment performance data at the elementary, middle school, and high school levels for reading and math, including information about average achievement gaps. The final section presents information about the public reporting of the use of accommodations on state assessments.
Top of Page | Table of Contents
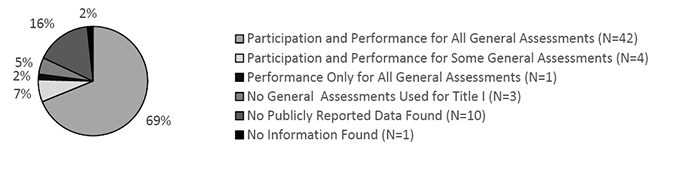
Figure 1 shows that 42 of the 61 regular and unique states reported participation and performance for all general assessments used for Title I accountability for students with disabilities. Sixty-nine percent of states reported participation and performance for all general assessments, 7 percent reported participation and performance for some general assessments, and 16 percent had no publicly reported data. Five percent (3 unique states) had no general assessments used for Title I. States with "no information found" differed from states without reported data found in that no assessment information or documents were found for general students in those states.
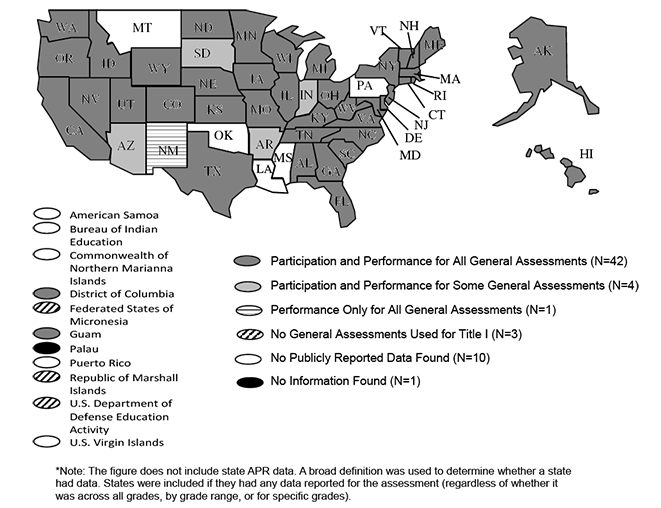
Figure 2 shows how each state reported the participation and performance of students with disabilities for the general assessment. The map shows that most states had full reporting of participation and performance for students with disabilities on general assessments used for Title I accountability. For details, see Table B-1 in Appendix B.
Figure 1. Extent of Reporting of General Assessment Data for Students with Disabilities Used for Title I [N=61]
Figure 2. States Reporting 2014-15 Disaggregated Participation or Performance Data for Students with Disabilities on General State Assessments Used for Title I*
States also reported participation and performance for students with disabilities on general assessments not used for the Title I accountability system. Figure 3 shows that thirty-five states only had general assessments used for Title I. We examined reporting for the remaining 26 states Figure 3 shows that of the 24 states that had general assessments not used for Title I, 6 states reported participation and performance data for all tests, 1 reported these data for some tests, and 17 states did not publicly report data.
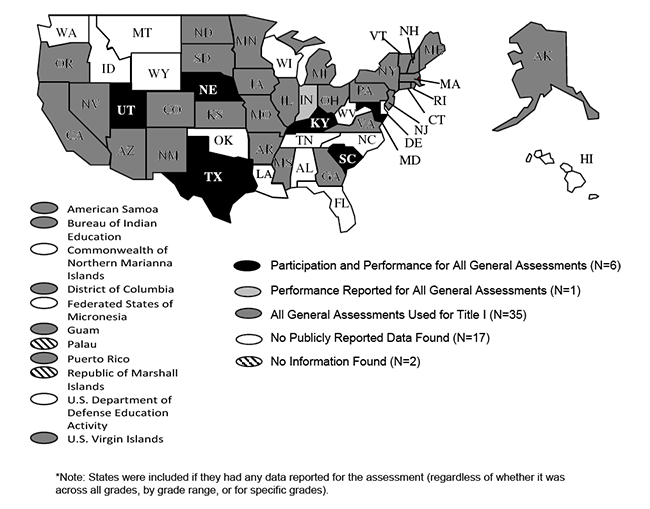
Figure 4 presents participation and performance reporting by state for general assessments not used for Title I. This map shows that only a handful of states publicly reported participation and performance for these assessments. For details, see Table B-2 in Appendix B.
Figure 3. Extent of Reporting of General Assessment Data for Students with Disabilities Not Used for Title I [N=61]
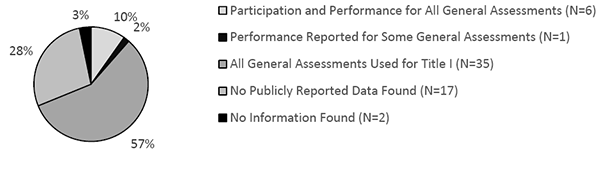
Figure 4. States Reporting 2014-15 Disaggregated Participation or Performance Data for Students with Disabilities on General Assessments Not Used for Title I*
This section presents the extent to which states reported participation and performance data for students with disabilities on alternate assessments based on alternate achievement standards (AA-AAS) used for Title I. Figure 5 shows that 37 states reported both participation and performance data for all AA-AAS. This represents 60% of the states. Six states reported these data for some AA-AAS, and only one state reported performance only. The remaining states either had no AA-AAS used for Title I, had no publicly reported data found for AA-AAS, or no information was found about having an AA-AAS.
Figure 5. Extent of Reporting of AA-AAS Used for Title I [N=61]
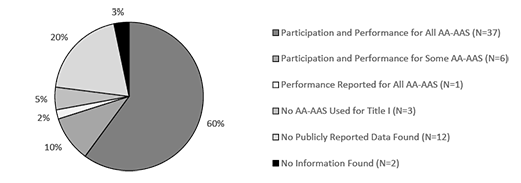
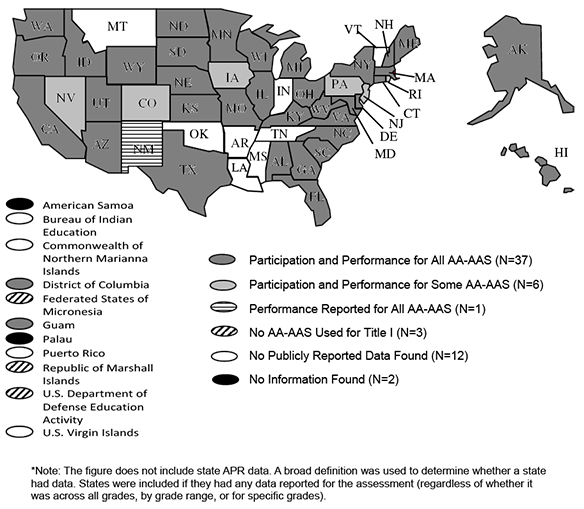
Figure 6 shows the states that reported participation and performance data for AA-AAS used for Title I accountability. The map shows that most states (N=37) publicly reported participation and performance for students with disabilities for these assessments. For details, see Table B-3 in Appendix.
Figure 6. States Reporting 2014-15 Participation or Performance Data for Students with Disabilities on AA-AAS Used for Title I*
Like their peers, most ELs with disabilities take general assessments. Only a small percentage take an AA-AAS. Figure 7 shows that 54 states did not report participation or performance for ELs with disabilities on general assessments used for Title I. Only three states reported both participation and performance data for all general assessments used for Title I. This represents 5% of the states.
Figure 7. Extent of States Reporting Data for ELs with Disabilities on General Assessments Used for Title I [N=61]
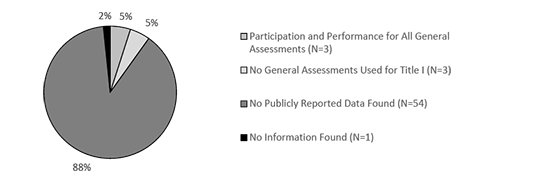
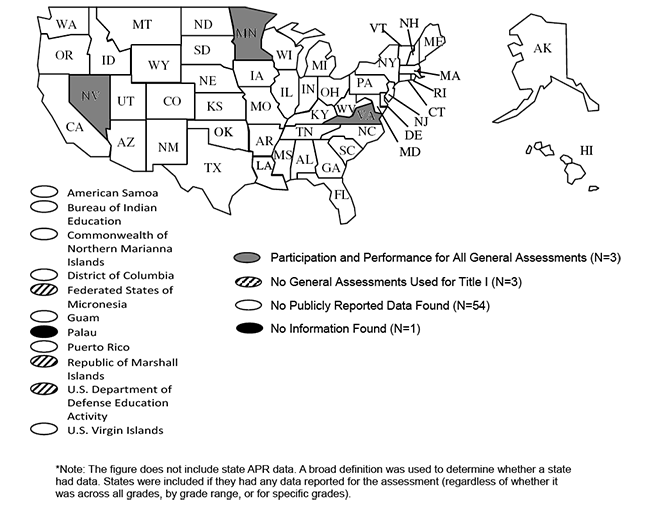
Figure 8 presents the states that reported participation and performance data for ELs with disabilities on general assessments used for Title I. This map shows that very few states (N=3) publicly reported participation and performance data for ELs with disabilities on all general assessments. For details, see Table B-4 in Appendix B.
Figure 8. States Reporting 2014-15 Disaggregated Participation or Performance Data for ELs with Disabilities on General Assessments Used for Title I
For the 24 states that had general assessments not used for Title I, only 1 state reported participation and performance for ELs with disabilities (see B-5 in Appendix B for more details). The data are not graphed in this report.
Figure 9 shows that 12 states, or 20% of states, publicly reported participation and performance on all AA-AAS for ELs with disabilities. Another 6 states publicly reported these data for some of their AA-AAS. Thirty-eight states did not publicly report data for ELs with disabilities who participated in an AA-AAS.
Figure 9. Extent of States Reporting AA-AAS Data for ELs with Disabilities for Title I [N=61]
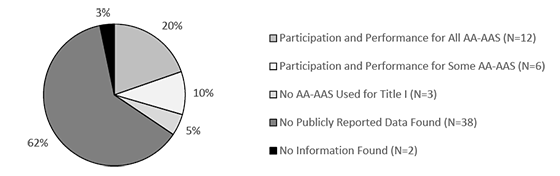
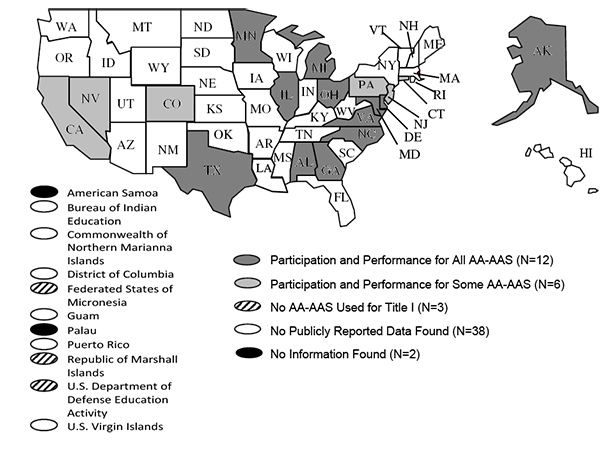
Figure 10 shows the 18 states that reported participation and performance for ELs with disabilities on some or all of the AA-AAS used for Title I. For details, see Table B-6 in Appendix B.
Figure 10. States Reporting 2014-15 Disaggregated Participation or Performance Data for ELs with Disabilities on AA-AAS Used for Title I
Alternate assessments based on modified achievement standards (AA-MAS) were an optional assessment used for Title I accountability until 2014-15, but a few states (n=3) continued to administer these assessments in their states. All three of the states with an AA-MAS in 2014-15 reported participation and performance data for that year, either separately or noted that the AA-MAS data were merged with data for the general assessment. For ELs with disabilities, two of the three states reported participation and performance disaggregated for ELs with disabilities separate from other assessment data. For details, see Table B-7 in Appendix B.
According to the publicly available data on state assessments found, two states had an Alternate Assessment based on Grade-Level Achievement Standards (AA-GLAS). Both of these states reported participation and performance data for students with disabilities, and one reported these data for ELs. For details see Table B-8 in Appendix B.
Top of Page | Table of Contents
States reported participation data for assessments in several ways. Figure 11 shows the approaches taken by 46 states (of the total 61 regular and unique states) that reported participation data. Thirty-seven states publicly reported the number of students tested and 28 states reported the percent of students participating in general assessments for the Title I accountability system. Only 6 states reported the percent of students with no scores; 11 states presented the number of students with no scores. Figure 11 includes data for states that used any method of reporting participation data (i.e., by grade and test, by merging grades and tests, by grade with tests merged, and by test with grades merged). For additional details see Table B-9 in Appendix B. For details about AA-AAS participation see Table B-10 in Appendix B.
Figure 11. States Reporting Participation by Students with Disabilities for General Assessments Used for Title I Accountability in 2014-15
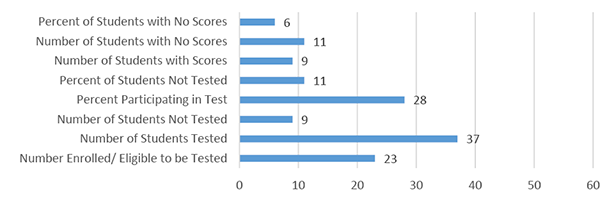
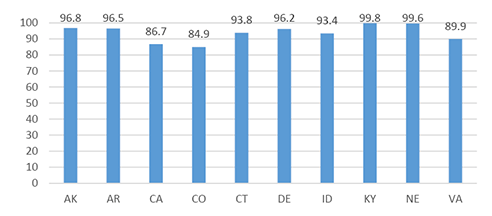
Figure 12 shows the participation rates for grade 8 mathematics for those states with this information reported by grade and test. Of the 28 states that reported on participation rates, 10 states reported these data with denominators based on students with disabilities in grade 8, an approach that could be compared (e.g., does not include rates of entire population or rates reported by accommodated status). See Appendix Table B-11 for the state abbreviation key.
Figure 12. Percentages of Students with Disabilities Participating in Middle School General Math Assessments in Those States with Reported Participation Rates by Grade Level in 2014-15
Top of Page | Table of Contents
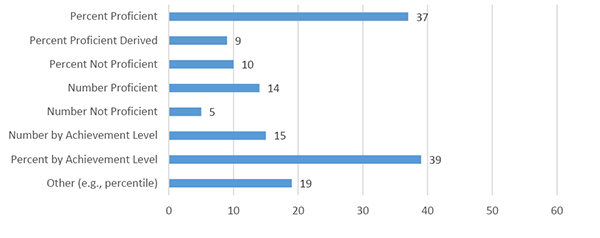
States reported performance data in a variety of ways, such as the number or percent in each achievement level, percent proficient or not proficient, average scaled scores, or percentiles, for example. Figure 13 shows that the most common way that states reported performance data was by percent in each achievement level (n= 39). The next most frequent way was by percent proficient. The "other" category includes states that reported scaled scores, percentiles, or other types of scores. This figure includes data from states that used any method of reporting participation data (i.e., by grade and test, by merging grades and tests, by grade with tests merged, and by test with grades merged). Also, states could be counted more than once for the type of data reported, so the number does not total to 61 states. For additional details see Table B-12 in Appendix B. For details about AA-AAS performance see Table B-13 in the Appendix.
Figure 13. Number of States Reporting Performance in Different Ways for Students with Disabilities in 2014-15 General Assessments Used for Title I
Top of Page | Table of Contents
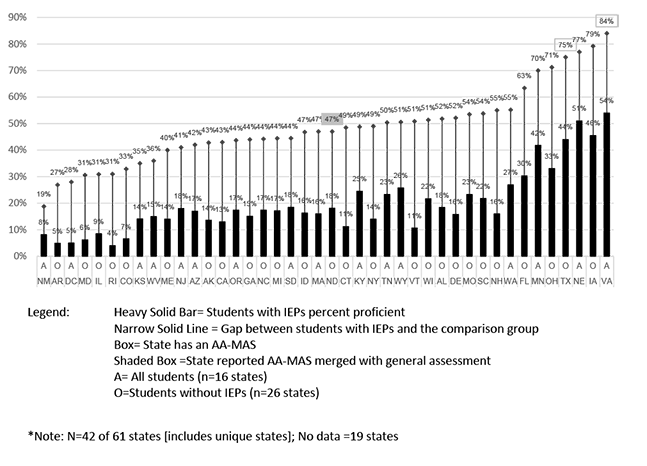
In this section the performance of students with and without Individualized Education Programs (IEPs) is compared for states that reported data for each of three representative grades (e.g., Grade 4, Grade 8, and high school) by the content areas of reading and mathematics. Figures 14 to 19 show the gaps between students with disabilities and a comparison peer group, with the solid line representing the gap between student groups. The comparison peer group varied by state, with some states reporting the performance of students without IEPs and others reporting the total student population that included students with IEPs.
Because the gaps were affected by whether a state used a comparison group of all students or students without disabilities, we indicate the group used by each state on the horizontal axis with an A if the state included all students and an O if the comparison group for the state was students who do not have IEPs. The students without IEPs group may include students with 504 plans depending on how a state defined its population. Therefore, the gaps reported here could also vary based on how those states reported their performance data.
States with an AA-MAS are indicated in the figures with a box around the percent proficient number for the comparison group, and shaded boxes indicate states that merged AA-MAS performance with general assessment data. See Appendix Table B-11 for the state abbreviation key.
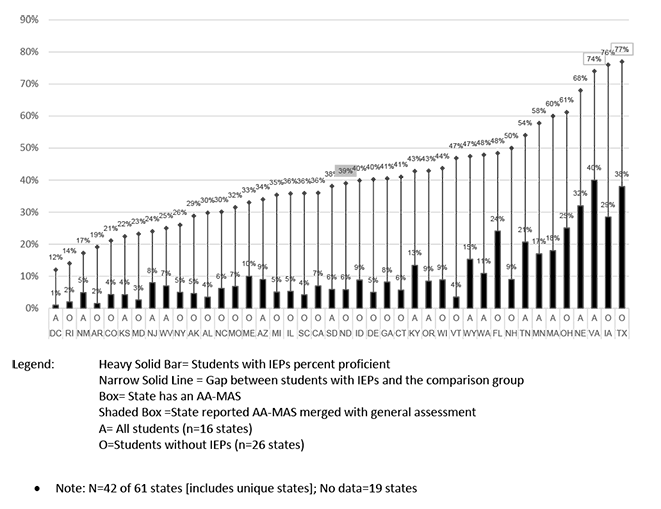
Figures 14 and 15 present the results for Grade 4. Across the states, the smallest gap between students with IEPs and the comparison group for elementary reading was 16 percentage points, and the largest gap was 47 percentage points. For elementary mathematics, the gap ranged from 11 percentage points to 40 percentage points.
Figure 14. Percent Proficient for Elementary Reading*
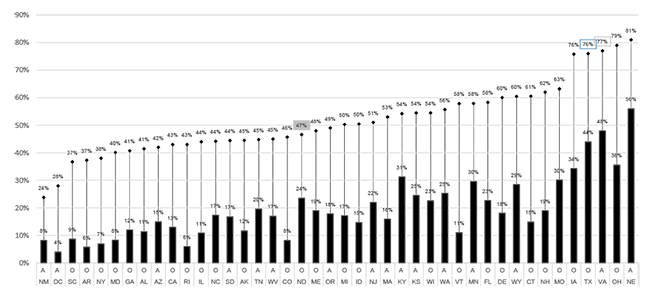
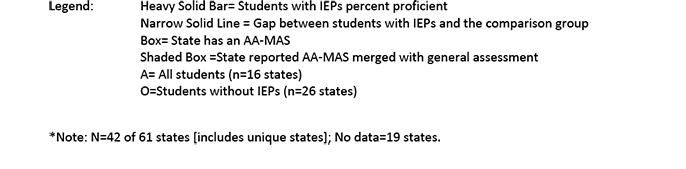
Figure 15. Percent Proficient Elementary Mathematics*
Figures 16 and 17 show the performance gaps for Grade 8 reading and mathematics. At the middle school level, for reading, gaps ranged from 18 percentage points to 54 percentage points. For mathematics, the gaps ranged from 11 percentage points to 48 percentage points.
Figure 16. Percent Proficient for Middle School Reading*
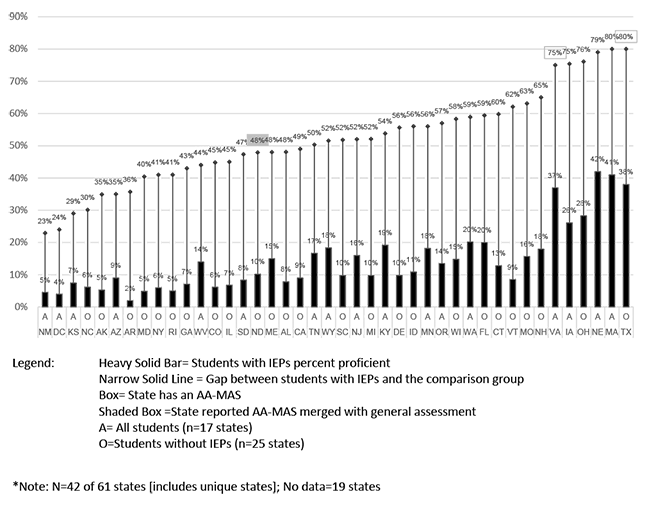
Figure 17. Percent Proficient Middle School Mathematics*
Figures 18 and 19 show gaps for high school reading and mathematics. Grade 10 was used when more than one grade was tested. For reading, the gaps ranged from 21 percentage points to 54 percentage points; for mathematics the range is from 3 percentage points to 49 percentage points.
Figure 18. Percent Proficient for High School Reading*
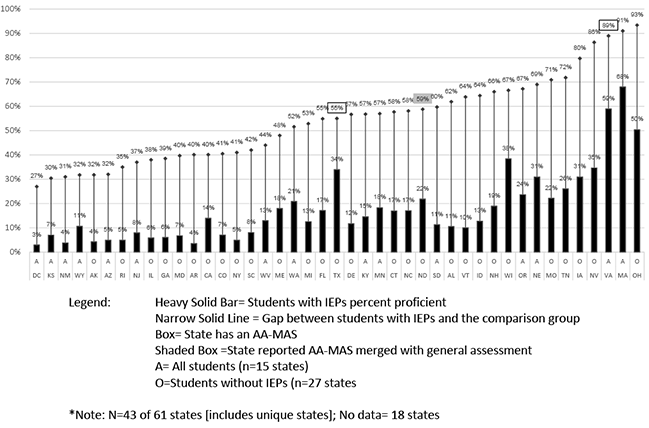
Figure 19. Percent Proficient for High School Mathematics*
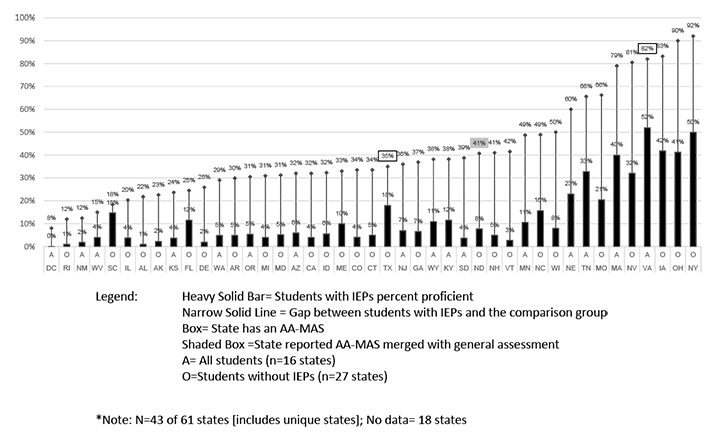
Table 1 summarizes the average achievement gaps between students with IEPs and the comparison peer group. The comparison peer group may or may not include students with IEPs depending on the reporting practices of each state. The table presents gaps by content areas and school levels across select years. There are limitations to this analysis in that the number of states with data fluctuates each year and the assessments a state uses may change over time. Further, there are differences in how states report percent proficient for students with IEPs. For example, in some cases, states reported AA-MAS performance merged with general assessment performance.
Table 1 shows the mean gaps for every other year from 2006-07 through 2014-15. The average gap is presented with the number of states with data for each year. The gap sizes changed only slightly across grades and content areas until the present year, where math average gaps were much lower at the middle and high school levels compared to previous years, even though the number of states changed only slightly. For example, for elementary reading, the mean gap was 31 in 2006-07 and 2008-09, 34 in 2010-11, 35 in 2012-13, and 32 in 2014-15. But for middle and high school math, the gap ranged from 37 to 40 from 2006-07 to 2013-14, but was 28 or 29 in 2014-15.
Table 1. Gaps for Students with IEPs and Comparison Peer Group on General Assessments: Biannually from 2006-07 to 2014-15
|
Grade Ranges |
Mean Gaps for All States with Data1 | |||||||||
|---|---|---|---|---|---|---|---|---|---|---|
| 2006-07 | 2008-09 | 2010-11 | 2012-13 | 2014-15 | ||||||
| Gap |
Number of States |
Gap |
Number of States |
Gap |
Number of States |
Gap |
Number of States |
Gap |
Number of States |
|
| Elementary Reading | 31 | 47 | 31 | 45 | 34 | 45 | 35 (34) | 45 (48) | 32 (32) | 41 (42) |
| Middle School Reading | 40 | 47 | 40 | 46 | 41 | 45 | 41 (41) | 45 (48) | 38 (38) | 41 (42) |
| High School Reading | 40 | 46 | 40 | 44 | 40 | 45 | 39 (38) | 46 (49) | 37 (36) | 41 (42) |
| Elementary Math | 29 | 47 | 28 | 46 | 30 | 45 | 32 (32) | 45 (48) | 29 (28) | 41 (42) |
| Middle School Math | 40 | 47 | 38 | 46 | 40 | 42 | 40 (39) | 45 (48) | 29 (29) | 41 (42) |
| High School Math | 38 | 44 | 37 | 44 | 40 | 43 | 37 (36) | 46 (49) | 28 (28) | 42 (43) |
1 Data in parentheses include the unique states. Data including the unique states were available only for 2012-13 and 2013-14. Prior analyses did not include the unique states.
Top of Page | Table of Contents
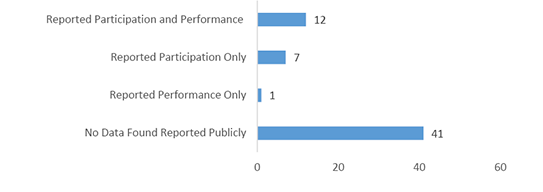
Figure 20 presents the number of regular and unique states that reported data for students with disabilities using accommodations on the general assessment, by whether the state reported participation, performance, or both. Only 20 states had any accommodations data reported, with 12 states reporting participation and performance, 7 states reporting participation only, and 1 state reporting performance only. See Appendix B-14 for specific state information shown in Figure 20.
Figure 20. Number of States Reporting Accommodations Data
Top of Page | Table of Contents
Thirty-three regular states, and two unique states, reported participation and performance for all general assessments and alternate assessments based on alternate achievement standards (AA-AAS) used for Title I accountability purposes in 2014-15. Forty-two of the 61 states reported both participation and performance for all general assessments and 37 reported similar data for the AA-AAS.
Of the 24 states with general assessments not used for Title I, only 6 states reported participation and performance and 1 additional state reported performance only. This is almost exactly the same number that reported these data compared to the prior year, where the same number reported participation and performance, but two states reported either participation or performance only, for all general assessments not used for Title I.
The number of states that reported both participation and performance for ELs with disabilities decreased to three states from seven in 2013-14. For AA-AAS, 12 states reported participation and performance. This number dropped significantly from the 21 states that reported in the previous two years. It might be expected that more states would have reported disaggregated data for this assessment, given the requirements of ESEA to report by subgroup for each state assessment. One state reported participation and performance for ELs on general assessments not used for Title I, the same as last year.
Among the regular states, the most common approaches for communicating participation and performance on general assessments and AA-AAS remained the same in 2008-09, and 2010-11 through 2014-15. For participation in 2014-15, the most common way to report for regular and unique states on general assessments was in terms of the number assessed (37 states) and percent participating (28 states). For performance, the most common way for regular and unique states to report on general assessments was the percent of students in each achievement level (39 states) followed by percent proficient (37 states). Because states used different methods to report (e.g., merging assessments, grades, or both), the numerators and denominators used to report participation and performance data varied significantly across states. Adding to the complexity is the fact that some states report public data using multiple methods across participation and performance, thus increasing the difficulty of making interpretations about participation and performance.
As in previous reports, this report presented participation rates for middle school mathematics as an example of how states report participation rates for students with disabilities. Ten states reported participation rates by grade in a way that would be comparable to include in a graph. Additional states provided numbers that would possibly allow for rates to be calculated. However, in recent years participation data have become less transparent, in part because states that had alternates based on modified achievement standards (AA-MAS) or alternates based on grade-level achievement standards sometimes opted to merge those data with the general assessment data in public reporting for participation and performance. Because the AA-MAS has been phased out of most states that used them, it is anticipated that these data should become more transparent in future years. Another reason that rates may be less straightforward is that states vary in the denominators used to calculate rates.
The achievement gaps between students with and without IEPs in reading and mathematics persist. This report presented average achievement gaps for elementary, middle school, and high school levels. As in past reports, generally speaking, there were smaller overall gaps in elementary reading and mathematics than at the middle school and high school levels. There were a few states that did not fit this generalization. For example, one state had a gap of 3 percentage points in high school mathematics. At the middle school and high school levels, for reading and mathematics, the average gaps across states spanned from 28 percentage points to 38 percentage points for 2014-15.
There was a noticeable decrease in the average gap for middle and high school mathematics from previous years. Due to the many factors underlying achievement gaps, the reason for these specific changes in 2014-15 is not clear. Many states were field-testing or adopting new assessments in this time frame, which may have affected the publicly reported data, but there may be other factors also contributing to this shift in average gaps. In general, the different methods used to report data among states influences the achievement gaps reported. As would be expected, those states with "all students" as the comparison group tended to show smaller gaps compared to states using students without IEPs" as the comparison group. Other factors that influence the size of achievement gaps include whether a state had an AA-MAS, the percentage of students taking an AA-MAS in lieu of the general assessment, and how these data are reported.
Many states have transitioned to new assessments based on College- and Career-Ready Standards, and states continue to shift in what assessments they are using. Given this backdrop, and flexibility in different approaches for accountability reporting, there may be further changes in how participation and performance data for students with disabilities and ELs with disabilities are reported. In the intervening time, it is important that states continue to publicly report data for students with disabilities with the same frequency and detail as for other students. As in the previous report (Lazarus, Albus, & Thurlow, 2016), the following recommendations are offered to states for public reporting of disaggregated data for students with disabilities:
Top of Page | Table of Contents
Albus, D., Lazarus, S. S., & Thurlow, M. L. (2015). 2012-13 publicly reported assessment results for students with disabilities and ELLs with disabilities (Technical Report 70). Minneapolis, MN: University of Minnesota, National Center on Educational Outcomes.
Albus, D., Lazarus, S. S., & Thurlow, M. L. (2014). 2011-12 publicly reported assessment results for students with disabilities and ELLs with disabilities (Technical Report 69). Minneapolis, MN: University of Minnesota, National Center on Educational Outcomes.
Albus, D., & Thurlow, M. (2013). 2010-11 publicly reported assessment results for students with disabilities and ELLs with disabilities (Technical Report 68). Minneapolis, MN: University of Minnesota, National Center on Educational Outcomes.
Albus, D., & Thurlow, M. (2013). 2010-11 publicly reported assessment results for students with disabilities and ELLs with disabilities (Technical Report 68). Minneapolis, MN: University of Minnesota, National Center on Educational Outcomes.
Albus, D., Thurlow, M., & Bremer, C. (2009). Achieving transparency in the public reporting of 2006-2007 assessment results (Technical Report 53). Minneapolis, MN: University of Minnesota, National Center on Educational Outcomes.
Klein, J. A., Wiley, H. I., & Thurlow, M. L. (2006). Uneven transparency: NCLB tests take precedence in public assessment reporting for students with disabilities (Technical Report 43). Minneapolis, MN: University of Minnesota, National Center on Educational Outcomes.
Lazarus, S. S., Albus, D., & Thurlow, M. L. (2016). 2013-14 publicly reported assessment results for students with disabilities and ELLs with disabilities (NCEO Report 401). Minneapolis, MN: University of Minnesota, National Center on Educational Outcomes.
Thurlow, M., Bremer, C., & Albus, D. (2008). Goodnews bad news in disaggregated subgroup reporting to the public on 2005-2006 assessment results (Technical Report 52). Minneapolis, MN: University of Minnesota, National Center on Educational Outcomes.
Thurlow, M. L., Bremer, C., & Albus, D. (2011). 2008-09 publicly reported assessment results for students with disabilities and ELLs with disabilities (Technical Report 59). Minneapolis, MN: University of Minnesota, National Center on Educational Outcomes.
Thurlow, M. L., & Wiley, H. I. (2004). Almost there in public reporting of assessment results for students with disabilities (Technical Report 39). Minneapolis, MN: University of Minnesota, National Center on Educational Outcomes.
Thurlow, M. L., Wiley, H. I., & Bielinski, J. (2003). Going public: What 2000-2001 reports tell us about the performance of students with disabilities (Technical Report 35). Minneapolis, MN: University of Minnesota, National Center on Educational Outcomes.
VanGetson, G. R., & Thurlow, M. L. (2007). Nearing the target in disaggregated subgroup reporting to the public on 2004-2005 assessment results (Technical Report 46). Minneapolis, MN: University of Minnesota, National Center on Educational Outcomes.
U.S. Department of Education (2013). ESEA flexibility: Frequently asked questions addendum. Washington, DC: Author.
Wiley, H. I., Thurlow, M. L., & Klein, J. A. (2005). Steady progress: State public reporting practices for students with disabilities after the first year of NCLB (2002-2003) (Technical Report 40). Minneapolis, MN: University of Minnesota, National Center on Educational Outcomes.
Top of Page | Table of Contents
1. Example letter to Assessment Director and Special Education Director.
The National Center on Educational Outcomes is examining states’ public reports for the 2014-2015 school year assessment results. Our goal is to:
(a) identify all components of each state’s testing system;
(b) determine whether each state reports disaggregated test results for students with disabilities and English language learners (ELLs) with disabilities; and
(c) describe the way participation and performance information is presented.
As in previous years, we are looking at assessment department reports and the equivalent of report cards used for Title I.
We have reviewed your Web site for this information and have enclosed tables summarizing that review. Please verify all included information. Specifically, please return the tables that we have attached, noting your changes to them. Also, if there is additional publicly reported information available for your state, please provide us with the public document and/or website that contains the information. Address your responses to Deb Albus via email albus001@umn.edu.
If you have any questions about our request, please email Deb Albus or call at (612) 626-0323. Please respond by August 1, 2016.
Thank you for taking the time to provide this information.
Martha Thurlow, Director NCEO
Deb Albus, Research Fellow, NCEO
Alabama
1. Reporting in State Assessments SummaryPlease check the information below for accuracy and make edits as needed.
| Assessments | Grade | Subject Areas | Disaggregated Data |
Used for Title I |
|||
|---|---|---|---|---|---|---|---|
| Special Education | ELLs with Disabilities | ||||||
| Participation | Performance | Participation | Performance | ||||
| ACT Aspire | 3-8, 10 | Reading, Math | Yes | Yes | No | No | Yes |
|
The ACT College Readiness Test |
11 |
English, Math, Reading, Science |
No | No | No | No | No |
| Alabama Science | 5,7 | Science | Yes | Yes | No | No | Yes |
|
Alabama Alternate Assessment |
3-8, 10-11 |
Reading, Math Science (5,7) |
Yes | Yes | Yes | Yes | Yes |
| ACT Plan | 10 | English, Math, Science | Yes | Yes | No | No | Yes |
2. Reporting on Students with Disabilities
How was participation and performance reported on the Title I assessments (general and alternate based on alternate achievement standards (AA-AAS))?
Note Yes, No, or NA (not applicable). If AA-AAS is merged with general, repeat the answer for general.
| For Title I Assessments: | Participation | Performance | |||
| Participation | General | AA-AAS | Performance | General | AA-AAS |
| Number Enrolled/ Eligible to be Tested | No | No | Percent Proficient | No | No |
| Number of Students Tested | No | No | Percent Proficient Derived | Yes | Yes |
| Number of Students Not Tested | No | No | Percent Not Proficient | No | No |
| Percent Participating in Test | Yes | Yes | Number Proficient | No | No |
| Percent of Students Not Tested | No | No | Number Not Proficient | No | No |
| Number of Students with Scores | No | No | Number by Achievement Level | No | No |
| Number of Students with No scores | No | No | Percent by Achievement Level | Yes | Yes |
| Percent of Students with No Scores | No | No | Percentile Rank | No | No |
3. If your state had an alternate based on modified achievement standards in 2014, how was participation reported? Not applicable
Accommodated Status Reporting
4. Did your state report accommodated status data for any population? List assessments or note NA, then answer Yes or No. Please note the report name or provide link if different from below.
| |
List assessment and describe reporting |
Reported Participation? |
Reported Performance? |
|---|---|---|---|
| On what assessment(s)? |
ACT Aspire and Alternate Assessment Reporting Number of Students Tested by accommodated and non-accommodated and percent in each performance level |
Yes | Yes |
Report name/Link to report/attach: 2013-2014 Participation and Performance of Students with IEPs Taking Assessments With and Without Accommodations
Participation and Performance Data for Students with Disabilities, English Language Proficiency Assessment (ELPA)
5. Disaggregated Data for the English Language Proficiency Assessment
| ELPA Name | Grade | Reports Data for All Students | Disaggregated Data for ELLs with Disabilities | |
|---|---|---|---|---|
| Participation | Performance | |||
| ACCESS for ELLs | K-12 | No | No | No |
Top of Page | Table of Contents
Table B-1. Participation and Performance Data for Students with Disabilities, General Assessment Used for Title I Accountability, 2014-2015
| State | Test | Grade | Subject Areas | Disaggregated Special Education Data on General Assessments Used for Title I |
|||||
|---|---|---|---|---|---|---|---|---|---|
| Participation | Performance | Reporting Summary By State | |||||||
| Part. and Perf. All Tests | Part. and Perf. Some Tests | Perf. Only For All Tests | No Publicly Reported Data Found | ||||||
| Regular States | |||||||||
| Alabama | ACT Aspire | 3 to 8, 10-11 | Reading, Math, Science (5, 7) | Yes | Yes | Yes | |||
| ACT Plan | 10 | English, Math, Science | Yes | Yes | |||||
| Alaska | Alaska Measures of Progress (AMP) | 3 to 10 | English Language Arts, Math | Yes | Yes | Yes | |||
| Standards Based Assessments | 4, 8, 10 | Science | Yes | Yes | |||||
| Arizona | Arizona’s Instrument to Measure Standards (AIMS and AIMS HS) | 4, 8, HS |
Science | No | No | Yes | |||
| AZMerit | 3 to 11, EoC | Alg I, Alg II, Geometry, Math, English Language Arts | Yes | Yes | |||||
| Arkansas | Augmented Benchmark Exams (ABE) | 5, 7 | Science | No | No | Yes | |||
| PARCC Assessment | 3 to 8 | Math, Literacy | Yes | Yes | |||||
| End of Course Exams | EoC | Biology | No | No | |||||
| California | California Standards Test Scores (CST) | 5, 8, 10 | Science | Yes | Yes | Yes | |||
| Smarter Balanced Summative | 2-11 | English Language Arts, Math | Yes | Yes | |||||
| Colorado | PARCC Assessment | 3 to 11, EoC | Reading (3-11), Math (3-8 and Alg.I, Geom., Integ. I, Integ. II, Integ. III) | Yes | Yes | Yes | |||
| Colorado Measures of Academic Success | 4-5, 7-8 | Science (5,8), Social Studies (4,7) | Yes | Yes | |||||
| Connecticut | Smarter Balanced Assessments | 3 to 8, 11 | English Language Arts, Math | Yes | Yes | Yes | |||
| Connecticut Academic Performance Test | 10 | Science | Yes | Yes | |||||
| Connecticut Mastery Test (CMT) | 5, 8 | Science | Yes | Yes | |||||
| Delaware | Smarter Balanced Assessment | 3-8, 11 | English Language Arts, Math | Yes | Yes | Yes | |||
| Delaware Comprehensive Assessment Systems (DCAS) | 4-5, 7-8, 10 | Social Studies (4,7), Science (5,8,10) | Yes | Yes | |||||
| Florida | Florida Standards Assessment | 3-8, HS | Reading, Math | Yes | Yes | Yes | |||
| FCAT Science | 5, 8 | Science | Yes | Yes | |||||
| Georgia | Georgia Milestone Assessment End of Grade | 3-8 | Language Arts, Math, Science, Social Studies | Yes | Yes | Yes | |||
| Georgia Milestone Assessment, EoC | HS | Algebra I, CCGPS Coordinate Algebra, United States History, Economics/Business/Free Enterprise, Biology, Physical Science, Ninth Grade Literature and Composition, American Literature and Composition, Geometry, Analytic Geometry | Yes | Yes | |||||
| Hawaii | Smarter Balanced Assessment | 3-8, 11 | English Language Arts, Math | Yes | Yes | Yes | |||
| End of Course | EoC | Biology I (required). Algebra I, Algebra II, and U.S. History are optional. | Yes | Yes | |||||
| Hawaii State Assessment in Science | 4, 8 | Science | Yes | Yes | |||||
| Idaho | General Assessment | 3-8, HS | English Language Arts (ELA) and Math(3-8, HS), Science (5,7, HS) | Yes | Yes | Yes | |||
| Illinois | PARCC Assessment | 3-8, HS | English Language Arts, Math | Yes | Yes | Yes | |||
| Indiana | Indiana State-wide Testing for Education Progress- Plus (ISTEP+) | 3-8 | English/Language Arts, Math, Science (4,6), Social Studies (5,7) | Yes | Yes | Yes | |||
| End of Course Assessments (ECAs) | EoC | English 10, Algebra I, Biology I | No | Yes | |||||
| Iowa | Iowa Assessment | 3-8,11 | Reading, Math | Yes | Yes | Yes | |||
| Iowa Assessment Science | 5,8,11 | Science | Yes | Yes | |||||
| Kansas | General Assessment | 3-8,10, 11 | Reading, Math, Science (4,7,11) No Science reported | Yes | Yes | Yes | |||
| Kentucky | Kentucky Performance Rating for Educational Progress (K-PREP) | 3-8, 10,11 | Reading, Math, Science (4, 7), Social Studies (5,8), Writing (5, 6, 8, 10, 11), Language Mechanics (4, 6, 10) | Yes | Yes | Yes | |||
| End of Course | EoC | English II, Algebra II, Biology, US History | Yes | Yes | |||||
| Stanford Achievement Test 10 (part of K-PREP) | 3-8 | Reading, Math (3-8) Science (4,7), Social Studies (5,8), Language Mechanics (4,6) | Yes | Yes | |||||
| Louisiana | PARCC general assessment | 3 to 8 | English/Language Arts, Math | No | No | X Not at state level | |||
| End of Course tests | EoC | English II, English III, Algebra I, Geometry, Biology, US History | No | No | |||||
| Maine | Smarter Balanced | 3-8, 3rd year HS | Mathematics, ELA/Literacy | Yes | Yes | Yes | |||
| Maine Educational Assessment (MEA) Science | 5,8, 3rd year HS | Science | Yes | Yes | |||||
| Maryland | Maryland School Assessment (MSA) | 5, 8 | Science | Yes | Yes | Yes | |||
| PARCC Assessment | 3 to 8, 10 | English Language Arts, Math | Yes | Yes | |||||
| High School Assessments (HSA) | EoC | Algebra/Data analysis, English, Biology, Government | Yes | Yes | |||||
| Massachusetts | Massachusetts Comprehensive Assessment System (MCAS) | 3-8, 10 | English/Language Arts, Math | Yes | Yes | Yes | |||
| PARCC general assessment | 3 to 8 | English/Language Arts, Math (3 to 8), Algebra I (8th grade) | Yes | Yes | |||||
| STE MCAS Tests | 5, 8, 9, or 10 | Science and Technology/Engineering (single discipline tests in (Biology, Chemistry, Intro Physics, and Technology/ Engineering) | Yes | Yes | |||||
| Michigan | Michigan Student Test of Educational Progress (M-STEP) | 3-8, 11 | English Language Arts, Math, (3 to 8, 11), Science (4,7, 11), Social Studies (5, 8, 11) | Yes | Yes | Yes | |||
| ACT | HS | English, Reading, Math, Science | Yes | Yes | |||||
| Minnesota | Minnesota Comprehensive Assessment (MCA) -III | 3-8, HS | Reading (3 to 8, 10), Math (3 to 8, 11), Science (5, 8, HS) | Yes | Yes | Yes | |||
| Mississippi | PARCC general assessment | 3-8 | Language Arts, Math | No | No | X | |||
| Science Tests | 5,8 | Science | No | No | |||||
| High school Subject Area Tests | EoC | Biology I, US History | No | No | |||||
| Missouri | Grade-Level Assessment | 3-8, HS | English Language Arts, Math, Science (5,8), Social Studies (HS) | Yes | Yes | Yes | |||
| Online End of Course Assessments | EoC | English I and II, Algebra I and II, Geometry, Biology I, Physical Science, American History, Government | Yes | Yes | |||||
| Montana | Smarter Balanced Assessment | 3-8, 11 | English Language Arts, Math | No | No | X | |||
| Criterion Referenced Test Science | 4, 8, 10 | Science | No | No | |||||
| Nebraska | Nebraska State Accountability (NeSA) | 3-8, 11 | Reading, Math , Science (5,8,11), Writing (4, 8, 11) | Yes | Yes | Yes | |||
| Nevada | Criterion Referenced Test (CRT) | 3-8 | Science (5,8) No Reading or Math reported | Yes | Yes | Yes | |||
| High School Proficiency Exam | HS | Reading, Math, Science, Writing | Yes | Yes | |||||
| New Hampshire | Smarter Balanced Assessment | 3 to 8, 11 | Reading, Math | Yes | Yes | Yes | |||
| New England Comprehensive Assessment Program (NECAP) | 4, 8, 11 | Science | Yes | Yes | |||||
| New Jersey | PARCC Assessment | 3 to 8 | English Language Arts, Math | Yes | Yes | Yes | |||
| PARCC High School Assessments | 9 to 11 | English Language Arts (9 to 11), Algebra I, Algebra II, Geometry | Yes | Yes | |||||
| New Mexico | PARCC Assessment | 3-8,10-11 | Reading, Math, Science (3, 7-8, 11). And High School SBA serves as diploma also | No | Yes | Yes | |||
| Standards Based Assessment (SBA) | 4, 7, 10-11 | Science | No | Yes | |||||
| Standards Based Assessment Spanish | 4, 7, 10-11 | Reading | No | Yes | |||||
| New York | New York State Testing Program (NYSTP) | 3-8 | English Language Arts, Math, Science (4,8) | Yes | Yes | Yes | |||
| Common Core Regents | EoC | Algebra I, English Language Arts, Geometry | Yes | Yes | |||||
| Regents Competency Tests | EoC | Math, Science, Reading, Writing, Global Studies, US History and Government. Parts used for Title I and Diploma. | Yes | Yes | |||||
| Regents Exams | EoC | Comprehensive English, US History &Gov’t, Global History & Geography, Alg2/ Trig, Geometry, Integ Alg, Living Envt, Physical etting/Physics, Physical Setting/ Chemistry, Physical setting/Earth Science. Parts used for Title I and Diploma. | Yes | Yes | |||||
| North Carolina | End of Grade Multiple Choice Test | 3-8 | Reading, Math, Science (5,8) | Yes | Yes | Yes | |||
| End of Course Multiple Choice | EoC | Math I, Biology, English II | Yes | Yes | |||||
| North Dakota | Smarter Balanced Assessment | 3-8, 11 | English Language Arts, Math | Yes | Yes | Yes | |||
| NDSA Science (DRC) | 4, 8, 11 | Science | Yes | Yes | |||||
| Ohio | PARCC Assessment | 3-8 | English Language Arts, Math | Yes | Yes | Yes | |||
| Ohio Graduation Tests (OGT) | HS | Reading, Math, Science, Social Studies, Writing | Yes | Yes | |||||
| Oklahoma | Oklahoma Core Curriculum Tests (OCCT) | 3-8 | Math, Reading, Science (5,8), Geography (7), Social Studies (5), US History (8), Writing (5,8) For Title I, all used except for Geography, Social Studies, History and Writing (partially used for Title I) | No | No | X | |||
| End of Instruction | EoI | ACE Algebra I, ACE Algebra II, ACE Geometry, ACE English II, III (Writing included), ACE Biology I, ACE US History. For Title I, all used except for Alg II, Eng II, Geometry and US History (partially used for Title I) | No | No | |||||
| Oregon | Smarter Balanced Assessment | 3-8,11 | English Language Arts, Math | Yes | Yes | Yes | |||
| Science Assessment | 5, 8, 11 | Science | Yes | Yes | |||||
| Pennsylvania | Pennsylvania System of School Assessment (PSSA) | 3-8 | Reading, Math, Science (4,8,) | No | No | X | |||
| Keystone Exam | 11 | Algebra, Biology and Literature | No | No | |||||
| Rhode Island | New England Education Assessment Program (NECAP) | 4, 8, 11 | Science | Yes | Yes | Yes | |||
| PARCC Assessment | 3-8, 11 | English Language Arts, Math, Algebra, Geometry | Yes | Yes | |||||
| South Carolina | Palmetto Assessment of State Standards | 3-8 | English Language Arts, Math, Science, Social Studies, Writing (5, 8) | Yes | Yes | Yes | |||
| End of Course Examination | EoC | Algebra/Math for Technologies 2, Biology/ Applied Biology 2, English 1, US History and the Constitution | Yes | Yes | |||||
| High School Assessment Program Test | 2nd year HS | English Language Arts, Math | Yes | Yes | |||||
| South Dakota | South Dakota State Test of Educational Progress (DSTEP) and Field Testing for Smarter Balanced Assessment | 5, 8, 11 | Science | Yes | Yes | Yes | |||
| Smarter Balanced Assessment | 3 to 8 | English Language Arts, Math | Yes | Yes | |||||
| ACT | HS | English, Math | No | No | |||||
| Tennessee | Criterion Referenced Academic Achievement | 3-8 | Math, Reading/ Language, Science | Yes | Yes | Yes | |||
| End of Course | EoC | Algebra I, Algebra II, English I, English II, English III, US History, Biology, Chemistry | Yes | Yes | |||||
| Texas | State of Texas Assessments of Academic Readiness (STAAR) Includes Spanish versions | 3-8 | Math, Reading, Writing (4,7), Science (5,8) Social Studies (8) | Yes | Yes | Yes | |||
| STAAR EoC | EoC | Algebra I, Biology, English I, Reading, English I Writing, US History | Yes | Yes | |||||
| Utah | Student Assessment of Growth and Excellence (SAGE) | 3-11 | Language Arts, Math, Science | Yes | Yes | Yes | |||
| Vermont | Smarter Balanced Assessment | 3-8, 11 | English Language Arts, Math | Yes | Yes | Yes | |||
| NECAP | 4, 8, 11 | Science | Yes | Yes | |||||
| Virginia | Standards of Learning (SOL) | 3-8 | Reading, Math, Science (3,5,8), History/Social Studies (3,5,8), Writing (5,8) | Yes | Yes | Yes | |||
| Content Specific Test | 3-8 | Reading, Math, History/Social Science, Science | Yes | Yes | |||||
| End of Course Test | EoC | Reading, Writing, Algebra I, II, Geometry, Biology, Chemistry, Earth Science, Virginia and US History, World History I, II, World Geography, US History to 1865, US History from 1865 to present, Civics and Economics, Virginia Studies | Yes | Yes | |||||
| Washington | Smarter Balanced Assessment | 3-8, 11 | English Language Arts, Math | Yes | Yes | Yes | |||
| Measurements of Student Progress (MSP) | 5, 8 | Science | Yes | Yes | |||||
| End of Course | EoC | Algebra 1/Integrated Math 1, Geo-metry/ Integrated Math 2, Biology - part also not used for Title I. Biology reported only. | Yes | Yes | |||||
| West Virginia | West Virginia General Summative Assessment (WVGSA} | 3-11 | English Language Arts/Literacy, Math | Yes | Yes | Yes | |||
| Science | 4, 6, 10 | Science | Yes | Yes | |||||
| Wisconsin | Badger Exam | 3-8 | English Language Arts, Math | Yes | Yes | Yes | |||
| ACT Writing Plus | 11 | Reading, Math, Science, Writing | Yes | Yes | |||||
| Wyoming | Proficiency Assessments for Wyoming Students (PAWS) | 3-8, 11 | Reading, Math, Science (4,8, 11) | Yes | Yes | Yes | |||
| Total Regular States (N=50) | 40 | 4 | 1 | 5 | |||||
| Unique States | |||||||||
| American Samoa | Stanford Achievement Test 10 | Elem to HS | Language Arts, Science, Math Problem Solving, History, Social Science | No | No | X | |||
| Bureau of Indian Education | Individual state administered assessments | Elem to HS | By State: Langauge Arts, Reading, Math, Science | No | No | X | |||
| Commonwealth of Northern Mariana Islands | ACT ASPIRE | 3 to 10 | English, Math, Reading, Science, Writing | No | No | X | |||
| US Department of Defense Education Activity | No Assessments Used for Title I | No Title I Assmts. |
|||||||
| District of Columbia | PARCC Assessment | 3-8, HS | English Language Arts, Math | Yes | Yes | Yes | |||
| Federated States of Micronesia | No Assessments Used for Title I | No Title I Assmts. | |||||||
| Guam | Stanford Achievement Test, 10 | 1-12 | Reading (1,2), Math( 1,2), Science(1-8) and Social Studies(1-8), Following are 9to 12: Anatomy and Physiology, Biology, Chemistry, Physical Science, Algebra 1 and 2, Geometry, US Government, US History, World History, Guam History, and Geography. Results reported for students with disabilities only for Reading, Math and Science. | Yes | Yes | Yes | |||
| ACT ASPIRE | 3 to 10 | English, Reading, Math | Yes | Yes | |||||
| Palau | No information found | No Info Found | |||||||
| Puerto Rico | Puerto Rican Academic Achievement Test | 3-8, 11 | Spanish, English, Math, Science (4,8,11) | No | No | X | |||
| Republic of Marshall Islands | No Assessments Used for Title I | No Title I Assmts. | |||||||
| U.S. Virgin Islands | Smarter Balanced Assessment | 3-8, 11 | English Language Arts, Math | No | No | X | |||
| Total Unique States (N=11)* | 2 | 0 | 0 | 9 | |||||
| Total Regular and Unique States (N=61) | 42 | 4 | 1 | 14 | |||||
| Percent | 69% | 6% | 2% | 23% | |||||
Table B-2. Participation and Performance Data for Students with Disabilities, General Assessment Not Used for Title I Accountability, 2014-2015
| State | Test | Grade | Subject Areas |
Disaggregated Special Education Data on General Assessments Not Used for Title I |
||||||
|---|---|---|---|---|---|---|---|---|---|---|
| Partici-pation | Perform-ance | Reporting Summary By State | ||||||||
| All Used for Title I | Part. and Perf. All Tests | Part. and Perf. Some Tests | Perf. Only For All Tests | No Publicly Reported Data Found | ||||||
| Regular States | ||||||||||
| Alabama | The ACT Plus Writing | 11 | English, Math, Reading, Science, Writing | No | No | |
|
|
|
X |
| Alaska | No non-Title I assessments | |
|
- | - | Yes | |
|
|
|
| Arizona | No non-Title I assessments | |
|
- | - | Yes | |
|
|
|
| Arkansas | No non-Title I assessments | |
|
- | - | Yes | |
|
|
|
| California | No non-Title I assessments | |
|
- | - | Yes | |
|
|
|
| Colorado | No non-Title I assessments | |
|
- | - | Yes | |
|
|
|
| Connecticut | No non-Title I assessments | |
|
- | - | Yes | |
|
|
|
| Delaware | End of Course Exams | EoC | U.S. History (required), Biology, Algebra II, Integrated Mathematics III (not required) | No | No | |
|
|
|
X |
| Florida | End of Course Assessment | EoC | Algebra I, Civics, U.S. History, Biology I, Geometry | No | No | |
|
|
|
X |
| Georgia | No non-Title I assessments | |
|
- | - | Yes | |
|
|
|
| Hawaii | End of Course | EoC | Algebra I, Algebra II, Biology I, Expository Writing I and/or U.S. History | No | No | |
|
|
|
X |
| Idaho | Idaho Reading Indicator | K-3 | Reading | No | No | |
|
|
|
X |
| Illinois | No non-Title I assessments | |
|
- | - | Yes | |
|
|
|
| Indiana | Indiana Reading Evaluation and Determination (IREAD-3) | 3 | Reading | No | Yes | |
|
|
Yes | |
| Iowa | No non-Title I assessments | |
|
- | - | Yes | |
|
|
|
| Kansas | No non-Title I assessments | |
|
- | - | Yes | |
|
|
|
| Kentucky | Explore | 8 | English, Math, Reading, Science | Yes | Yes | |
Yes | |
|
|
| PLAN | 10 | English, Math, Reading, Science | Yes | Yes | ||||||
| ACT | 11 | English, Math, Reading, Science | Yes | Yes | ||||||
| Louisiana | ACT | 12 | English, Reading, Math, Science | No | No | |
|
|
|
X |
| Maine | No non-Title I assessments | |
|
- | - | Yes | |
|
|
|
| Maryland | High School Assessments (HSA) | EoC | English, Algebra/Data Analysis, Biology, Government | Yes | Yes | |
Yes | |
|
|
| Massachusetts | No non-Title I assessments | |
|
- | - | Yes | |
|
|
|
| Michigan | No non-Title I assessments | |
|
- | - | Yes | |
|
|
|
| Minnesota | No non-Title I assessments | |
|
- | - | Yes | |
|
|
|
| Mississippi | No non-Title I assessments | |
|
- | - | Yes | |
|
|
|
| Missouri | No non-Title I assessments | |
|
- | - | Yes | |
|
|
|
| Montana | ACT Plus Writing | HS | Reading, Language, Math, Science, Writing | No | No | |
|
|
|
X |
|
Nebraska |
Iowa Test of Basic Skills (ITBS) | 3-11 | Reading, Math | Yes | Yes | |
Yes | |
|
|
| National Assessment Instrument | 2 to 12 | Reading, Math | Yes | Yes | ||||||
| Metropolitan Achievement Test | 4, 8 | Reading, Math | Yes | Yes | ||||||
| Terra Nova | 3-11 | Reading, Math | Yes | Yes | ||||||
| SAT | 4, 5, 8 to 9 | Reading, Math | Yes | Yes | ||||||
| ACT ASPIRE | 4, 8, 9, 10 | Reading, Math | Yes | Yes | ||||||
| ACT Explore | 8 | Math, Reading | Yes | Yes | ||||||
| ACT PLAN | 9 to 11 | Math, Reading | Yes | Yes | ||||||
| Nevada | No non-Title I assessments | |
|
- | - | Yes | |
|
|
|
| New Hampshire | No non-Title I assessments | |
|
- | - | Yes | |
|
|
|
| New Jersey | No non-Title I assessments | |
|
- | - | Yes | |
|
|
|
| New Mexico | No non-Title I assessments | |
|
- | - | Yes | |
|
|
|
| New York | No non-Title I assessments | |
|
- | - | Yes | |
|
|
|
| North Carolina | ACT Benchmark | 11 | English, Math, Reading, Science, Writing. State requires taking in 11th grade. | No | No | |
|
|
|
X |
| North Dakota | No non-Title I assessments | |
|
- | - | Yes | |
|
|
|
| Ohio | No non-Title I assessments | |
|
- | - | Yes | |
|
|
|
| Oklahoma | Oklahoma Core Curriculum Tests (OCCT) | 3 to 8 | Math, Reading, Science (5,8), Geography (7), Social Studies (5), US History (8), Writing (5,8) For Title I, all used except for Geography, Social Studies, History and Writing | No | No | |
|
|
|
X |
| End of Instruction | EoI | ACE Algebra I, II, ACE Geometry, ACE English II, III, (writing included), ACE Biology I, ACE US History. For Title I, all used except for Alg II, Eng II, Geometry and US History | No | No | ||||||
| Oregon | No non-Title I assessments | |
|
- | - | Yes | |
|
|
|
| Pennsylvania | No non-Title I assessments | |
|
- | - | Yes | |
|
|
|
| Rhode Island | No non-Title I assessments | |
|
- | - | Yes | |
|
|
|
| South Carolina | ACT | 3rd year in HS | English Language Arts, Math | Yes | Yes | |
Yes | |
|
|
| ACT Work Keys | 3rd year in HS | Reading for Information, Applied Math, Locating Information | Yes | Yes | ||||||
| ACT ASPIRE | 3 to 8 | English, Math, Reading, Writing | Yes | Yes | ||||||
| South Dakota | No non-Title I assessments | |
|
- | - | Yes | |
|
|
|
| Tennessee | Writing | 3-11 | Writing | No | No | |
|
|
|
X |
| ACT PLAN, Exlore | 8, 10 | Reading, Math | No | No | ||||||
| ACT | HS | English, Math, Reading, Science, Composite | No | No | ||||||
| Texas | Texas Assessment of Know-ledge and Skills (TAKS) | 11, 12 (retest) | English Language Arts, Math, Science, Social studies | Yes | Yes | |
Yes | |
|
|
| Utah | K3 Reading Competency | K to 3 | Reading | Yes | Yes | |
Yes | |
|
|
| Vermont | No non-Title I assessments | |
|
- | - | Yes | |
|
|
|
| Virginia | No non-Title I assessments | |
|
- | - | Yes | |
|
|
|
| Washington | End of Course (partially) | EoC | Algebra 1/Integrated Math 1, Geometry/Integrated Math 2, Biology | No | No | |
|
|
|
X |
| High School Proficiency Exam | HS | Reading, Writing | No | No | ||||||
| West Virginia | SAT | HS | Critical Reading and Math | No | No | |
|
|
|
X |
| HEAP Health Assessment | 6, 8, HS | Health | No | No | ||||||
| ACT Work Keys | 12 | Applied Math, Reading for Information, and Locating Information | No | No | ||||||
| Global 21 Career/Technical Education (CTE) | 9 - 12 | Career/Technical Education | No | No | ||||||
| ACT Explore, Plan | 8, 10 | English, Math, Reading, Science | No | No | ||||||
| Wisconsin | ACT Work Keys | 11 | Applied Mathematics, Locating Information, and Reading for Information | No | No | |
|
|
|
X |
| ACT ASPIRE | 9, 10 | Reading, Mathematics, Science, and Writing | No | No | ||||||
| Wyoming | ACT Explore, ACT Plan | 9 | English, Math, Reading, Science | No | No | |
|
|
|
X |
| Act Plus Writing or Workkeys (students have option in grades 11 and 12 to take Workkeys) | 11, 12 | English, math, Reading, Writing, Science | No | No | ||||||
| Total Regular States (N=50) | 29 | 6 | 0 | 1 | 14 | |||||
| Unique States | ||||||||||
| American Samoa | No non-Title I assessments | |
|
- | - | Yes | |
|
|
|
| Bureau of Indian Education | Unclear if any outside for states | |
|
- | - | Yes | |
|
|
|
| Commonwealth of Northern Mariana Islands | Standards Based Assessment | 4, 6, 8, 9 to 12 | Chamorro & Carolinian Language Heritage Studies (CCLHS) | No | No | |
|
|
|
X |
| End of Course | EoC | NMI History | No | No | ||||||
| U.S.Department of Defense Education Activity | Terra Nova, Multiple Assessments, 3rd Edition | 3 - 9 | Reading/Language Arts, Mathematics, Science, Social Studies | No | No | |
|
|
|
X |
| SAT | HS | Critical Reading, Math, Writing | No | No | ||||||
| District of Columbia | No non-Title I assessments | |
|
- | - | Yes | |
|
|
|
| Federated States of Micronesia | National Minimum Competency Standard-Based Test (NMCT) | 4, 6, 8, 10 | Reading (6,8,10), Math (4,6,8,10) | No | No | |
|
|
|
X |
| Guam | No non-Title I assessments | |
|
- | - | Yes | |
|
|
|
| Palau | No information found | |
|
- | - | No Info. Found | |
|
|
|
| Puerto Rico | No non-Title I assessments | |
|
- | - | Yes | |
|
|
|
| Republic of Marshall Islands | No information found | |
|
- | - | No Info. Found | |
|
|
|
| U.S. Virgin Islands | No non-Title I assessments | |
|
- | - | Yes | |
|
|
|
| Total Unique States (N=11) | 8 | 0 | 0 | 0 | 3 | |||||
| Total Regular and Unique States (N=61) | 371 | 6 | 0 | 1 | 17 | |||||
| Percent * | 60% | 10% | 0 | 2% | 28% | |||||
1 Two of these states had no information found online.
Table B-3. Participation and Performance Data for Students with Disabilities, Alternate Assessments Based on Alternate Achievement Standards (AA-AAS) Used for Title I Accountability, 2014-2015
| State | Test | Grade | Subject Areas |
Disaggregated Special Education Data For AA-AAS Used for Title I |
|||||||
|---|---|---|---|---|---|---|---|---|---|---|---|
| Partici-pation | Perform-ance | Summary by State | |||||||||
| Partic. And Perf. For All Tests | Partic. And Perf. For Some Tests | Perf. Only | No Alt. for Title I | No Publicly Reported Data Found or No Info. Found | |||||||
| Regular States | |||||||||||
| Alabama | Alabama Alternate Assessment (AAA) | 3-8, 11 | Reading, Math, Science (5,7) | Yes | Yes | Yes | |
|
|
|
|
| Alaska | Alaska Alternate Assessment | 3-10 | Reading, Writing, Math (3-10) Science (4,8,10) | Yes | Yes | Yes | |
|
|
|
|
| Arizona | NCSC | 3 to 11 | English Language Arts, Math | Yes | Yes | Yes | |
|
|
|
|
| Arkansas | NCSC | 3 to 8, 11 | English Language Arts, Math | No | No | |
|
|
|
X | |
| Arkansas Alternate Portfolio | 5, 7, 10 | Science | No | No | |||||||
| California | California Alternate Assessment (CAA) | 3- 8, 11 | English Language Arts, Math | Yes | Yes | Yes | |
|
|
|
|
| California Alternate Performance Assessment (CAPA) | 5, 8, 10 | Science | Yes | Yes | |||||||
| Colorado | Colorado Alternate Assessment (CoAlt) | 5, 8 | Science | Yes | Yes | |
Yes | |
|
|
|
| DLM | |
English Language Arts, Math | No | No | |||||||
| Connecticut | Skills Checklist | 3-8 | Access Skills, Math, Reading, Communication | Yes | Yes | Yes | |
|
|
|
|
| NCSC | 3 -8, 11 | English Language Arts, Math | Yes | Yes | |||||||
| Delaware | Delaware Comprehensive Assessment System (DCAS-Alt) | 3-11 | Reading, Math (3-11), Science (5,8,10), Social Studies (4,7,9) | Yes | Yes | Yes | |
|
|
|
|
| Florida | Florida Alternate Assessment (FAA) | 3-8, HS | Reading, Math | Yes | Yes | Yes | |
|
|
|
|
| Georgia | Georgia Alternate Assessment | 3-8, HS | English/Language Arts, Math, Science, Social Studies | Yes | Yes | Yes | |
|
|
|
|
| Hawaii | Alternate Assessment | 3-8, HS | Reading, Math, Science (4,8,11) | Yes | Yes | Yes | |
|
|
|
|
| Idaho | ISAT Alternate Science | 5, 7, 10 | Science | Yes | Yes | Yes | |
|
|
|
|
| NCSC | 3-8, 11 | English Language Arts, Math | Yes | Yes | |||||||
| Illinois | DLM | 3-8,11 | English Language Arts, Math | Yes | Yes | Yes | |
|
|
|
|
| Indiana | NCSC | 3-8, HS | English Language Arts, Math | No | No | |
|
|
|
X | |
| Indiana Standards Tool for Alternate Reporting (ISTAR) | 4 to 7 | Science and Social Studies | No | No | |||||||
| Iowa | Iowa Alternate Assessment (IAA) | 3-8,11 | Reading, Math | Yes | Yes | |
Yes | |
|
|
|
| Iowa Alternate Assessment (IAA) Science | 5,8,11 | Science | No | No | |||||||
| Kansas | DLM | 3-8, 10, 11 | Reading, Math, Science (4, 7, 10) | Yes | Yes | Yes | |
|
|
|
|
| Kentucky | Alternate Kentucky Performance Rating for Educational Progress (K-PREP) | 3-12 | Reading (3-9), Math (3-8,10), Writing (4,5,6, 8,10,11), Science (4,7,11), Social Studies (5,8,12) | Yes | Yes | Yes | |
|
|
|
|
| Louisiana | Louisiana Alternate Assessment 1. If different test, no information found | 3-11 | English/Language arts, Math, Science | No | No | |
|
|
|
X | |
| Maine | Maine Personalized Alternate Assessment Portfolio (MEPAAP) | 5, 8, 3rd yr. HS | Science | Yes | Yes | Yes | |
|
|
|
|
| NCSC | 3-8, 3rd yr. HS | ELA/Literacy, Math | Yes | Yes | |||||||
| Maryland | Alternate Maryland School Assessment (ALT-MSA) | 3-8,10 | Math, Reading, Science (5,8,10) | Yes | Yes | Yes | |
|
|
|
|
| Massachusetts | Massachusetts Comprehensive Assessment System Alternate (MCAS-Alt) | 3-10 | English/Language Arts, Math, Science and Technology/ Engineering (5, 8-10) | Yes | Yes | Yes | |
|
|
|
|
| Michigan | Michigan Access (MI-Access) Functional Independence | 3-8, 11 | English Language Arts, Math, Science (4, 7, 11), Social Studies (5, 8, 11) | Yes | Yes | Yes | |
|
|
|
|
| Michigan Access (MI-Access) Supported Independence | 3-8, 11 | English Language Arts, Math, Science (4, 7 11) | Yes | Yes | |||||||
| Michigan Access (MI-Access) Participation | 3-8, 11 | English Language Arts, Math, Science (4, 7, 11) | Yes | Yes | |||||||
| Minnesota | Minnesota Test of Academic Skills III (MTAS III) | 3-8, HS | Reading and Math, Science (5, 8, HS) | Yes | Yes | Yes | |
|
|
|
|
| Mississippi | DLM | 3-8 | Language Arts, Math, Science (5,8) | No | No | |
|
|
|
X | |
| DLM | HS | Language Arts, Math, Science | No | No | |||||||
| Missouri | Missouri Assessment Program Alternate (MAP-A) | 3-8, 10, 11 | English Language Arts, (3 to 8, 11) Math (3 to 8, 10), Science (5, 8, 11) | Yes | Yes | Yes | |
|
|
|
|
| Montana | MSAA Alternate (NCSC assessment) | 3-8, 11 | English Language Arts, Math | No | No | |
|
|
|
X | |
| Criterion Referenced Test (CRT) | 4, 8.10 | Science | No | No | |||||||
| Nebraska | Alternate Assessments (NESA-M and NESA-AAM) | 3-8, 11 | Reading, Math, Science (5,8,11), Writing (8,11) | Yes | Yes | Yes | |
|
|
|
|
| Nevada | Nevada Alternate Assessment (NAA) | 3-8, 11 | Reading, Math, | Yes | Yes | |
Yes | |
|
|
|
| Nevada Alternate Assessment (NAA) | 8 | Science (8), Writing (8) | No | No | |||||||
| New Hampshire | New Hampshire Alternate Learning Progression Assessment (NH ALPS) | 4, 8. 11 | Science | Yes | Yes | Yes | |
|
|
|
|
| DLM | 3-8, 11 | Reading, Math | Yes | Yes | |||||||
| New Jersey | Alternate Proficiency Assessment | 4, 8, 11 | Science | Yes | Yes | |
Yes | |
|
|
|
| DLM | 3-8, 11 | Reading Math | No | No | |||||||
| New Mexico | NCSC | 3-8, 11 | English Language Arts, Math | No | Yes | |
|
Yes | |
|
|
| Alternative Performance Assessment (NMAPA) | 4, 7, HS | Science | No | Yes | |||||||
| New York | New York State Alternate Assessment (NYSAA) | 3-8, HS | English Language Arts, Math, Science (4,8, HS), Social Studies (HS) | Yes | Yes | Yes | |
|
|
|
|
| North Carolina | North Carolina Extend 1 (NCEXTEND1) | 3-8 | Reading, Math, Science (5,8) | Yes | Yes | Yes | |
|
|
|
|
| North Carolina Extend 1 (NCEXTEND1) | 10 | Math I, Biology, English II | Yes | Yes | |||||||
| North Dakota | North Dakota Alternate Assessment 1 (NDAA1) | 4, 8. 11 | Science | Yes | Yes | Yes | |
|
|
|
|
| DLM | 3-8, 11 | English Language Arts, Math | Yes | Yes | |||||||
| Ohio | Alternate Assessment for Students with Cognitive Disabilities (AASCD) | 3-8 | English/Language Arts, Math, Science (5,8) | Yes | Yes | Yes | |
|
|
|
|
| Alternate Ohio Graduation Test (OGT-AASCD) | HS | English/Language Arts, Math, Science, Social Studies | Yes | Yes | |||||||
| Oklahoma | Oklahoma Alternate Assessment Program (OAAP) | 3-8, EoI | Math, Reading, Science (5,8), Geography, Social Studies, Writing (5,8), Algebra I, English II/ Writing, Biology, US History (others if took Algebra II, Geometry, English III/ Writing) | No | No | |
|
|
|
X | |
| Oregon | Oregon Assessment of Knowledge and Skills (OAKS) Extended | 3-8,11 | Reading, Math, Science (5,8,11), Writing (11) | Yes | Yes | Yes | |
|
|
|
|
| Pennsylvania | Pennsylvania Alternate System of Assessment (PASA) | 3-8, 11 | Reading, Math | Yes | Yes | |
Yes | |
|
|
|
| Pennsylvania Alternate System of Assessment (PASA) | 4, 8, 11 | Science | No | No | |||||||
| Rhode Island | Rhode Island Alternate Assessment (RIAA) | 4, 8, 11 | Science | No | No | |
Yes | |
|
|
|
| NCSC | 3-8, 11 | English Language Arts, Math | Yes | Yes | |||||||
| South Carolina | South Carolina Alternate (SC-ALT) | 4 to 8 | Science, Social Studies | Yes | Yes | Yes | |
|
|
|
|
| NCSC | 3-8,11 | English Language Arts, Math | Yes | Yes | |||||||
| South Dakota | Dakota State Test of Educational Progress Alternate (DSTEP A) | 5, 8, 11 | Science | Yes | Yes | Yes | |
|
|
|
|
| NCSC | 3-8, 11 | English Language Arts, Math | Yes | Yes | |||||||
| Tennessee | Alternate Assessment (transition to NCSC) | 3-8, 11 | English Language Arts, Math, Science | No | No | |
|
|
|
X | |
| Texas | State of Texas Assessments of Academic Readiness Alternate (STAARALT2) | 3-8 | Math, Reading, Writing (4,7), Science (5,8) Social Studies (8) | Yes | Yes | Yes | |
|
|
|
|
| STAARALT2 End of Course (EoC) | EoC | English I, English II, Algebra I, Biology, US History | Yes | Yes | |||||||
| Utah | DLM | 3-11 | Language Arts, Math, and Science | Yes | Yes | Yes | |
|
|
|
|
| Vermont | Alternate Assessment | 4, 8, 11 | Science | No | No | |
|
|
|
X | |
| DLM | 3 to 11 | English Language Arts, Math | No | No | |||||||
| Virginia | Virginia Alternate Assessment Portfolio (VAAP) | 3-8 | Reading, Math, History/Social Science, Science | Yes | Yes | Yes | |
|
|
|
|
| Virginia Alternate Assessment Portfolio End of Course (VAAP EoC) | EoC | Reading, Math, History/Social Science, Science | Yes | Yes | |||||||
| Washington | WA-AIM Alternate Assessment | 3-8, 11 | English Language Arts, Math, Science (5, 8) | Yes | Yes | Yes | |
|
|
|
|
| West Virginia | West Virginia Alternate Summative Assessment | 3-8, HS | Reading, Math | Yes | Yes | Yes | |
|
|
|
|
| Wisconsin | Wisconsin Alternate Assessment (WAA-SwD) | 4, 8, 10 | Science, Social Studies | Yes | Yes | Yes | |
|
|
|
|
| DLM | 3 to 11 | English Language Arts, Math | Yes | Yes | |||||||
| Wyoming | Wy-ALT | 3-8, HS | English Language Arts, Math (3 to 8-11), Science (4, 8, 9 to 11) | Yes | Yes | Yes | |
|
|
|
|
|
Total Regular States (N=50) |
35 | 6 | 1 | |
8 | ||||||
| Unique States | |||||||||||
| American Samoa | No information found | |
|
No | No | |
|
|
|
No inform. found | |
| Bureau of Indian Education | Merged with regular | Elem to HS | By state: Langauge Arts, Reading, Math, Science | No | No | |
|
|
|
X | |
| Commonwealth of Northern Mariana Islands | Multiple States Alternate Assessment (MSAA) | 3-8, 11 | English Language Arts, Math | No | No | |
|
|
|
X | |
| U.S. Department of Defense Education Activity | DoDEA Alternate Assessment. No Alternate for Title I. | K to 12 | The Alternate Assessment is comprised of evidence of the student’s achievement, including but not limited to student work products, interviews, photographs, videos, etc. | No | No | |
|
|
X | |
|
| District of Columbia | NCSC | 3 to 8, HS | English Language Arts, Math | Yes | Yes | Yes | |
|
|
|
|
| Federated States of Micronesia | Alternate Assessment on Alternate Achievement Standards. No Alternate for Title I. | 6, 8, 10 | Reading, Math, Science (8) | No | No | |
|
|
X |
|
|
| Guam | NCSC and DoE Alt. Assmt | 3-8, 11 | English Language Arts, Math Doe Alternate 1,2, 9, 10 ELA, Math | Yes | Yes | Yes | |
|
|
|
|
| Palau | No information found | |
|
No | No | |
|
|
|
No inform. found | |
| Puerto Rico | Puerto Rico Alternate Assessment | 3-8, 11 | Spanish, English, Math, Science (4,8,11) | No | No | |
|
|
|
X | |
| Republic of Marshall Islands | No Alternate for Title I | |
|
No | No | |
|
|
X | |
|
| U.S. Virgin Islands | Alternate Assessment | 3-8, 11 | English Language Arts. Math | No | No | |
|
|
|
X | |
| Total Unique States (N=11) | 2 | 0 | 0 | 0 | 61 | ||||||
| Total Regular and Unique States (N=61) | 37 | 6 | 1 | 3 | 141 | ||||||
| Percent | 60% | 10% | 2% | 5% | 23% | ||||||
1 Two of these states had no AA-AAS information found.
Table B-4. Participation and Performance Data for English Learners (ELs) with Disabilities, General Assessments Used for Title I Accountability, 2014-2015
| State | Test | Grade | Subject Areas |
Disaggregated Data for ELs with Disabilities for General
Assessments Used for Title I |
||||||
|---|---|---|---|---|---|---|---|---|---|---|
| Partici-pation | Perform-ance | Reporting Summary By State | ||||||||
| Part. and Perf. All Tests | Part. and Perf. Some Tests | No Assmt. Used for Title I |
No Info on Assmts. Found |
No Publicly Reported Data Found | ||||||
| Regular States | ||||||||||
| Alabama | ACT Aspire | 3 to 8, 10-11 | Reading, Math, Science (5, 7) | No | No | |
|
|
|
X |
| ACT Plan | 10 | English, Math, Science | No | No | ||||||
| Alaska | Alaska Measures of Progress (AMP) | 3 to 10 | English Language Arts, Math | No | No | |
|
|
|
X |
| Standards Based Assessments | 4, 8, 10 | Science | No | No | ||||||
| Arizona | Arizona’s Instrument to Measure Standards (AIMS and AIMS HS) | 4, 8, HS | Science | No | No | |
|
|
|
X |
| AZMerit | 3 to 11, EoC | Alg I, Alg II, Geometry, Math, English Language Arts | No | No | ||||||
| Arkansas | Augmented Benchmark Exams (ABE) | 5, 7 | Science | No | No | |
|
|
|
X |
| PARCC Assessment | 3 to 8 | Math, Literacy | No | No | ||||||
| End of Course Exams | EoC | Biology | No | No | ||||||
| California | California Standards Test Scores (CST) | 5, 8, 10 | Science | No | No | |
|
|
|
X |
| Smarter Balanced Summative | 2-11 | English Language Arts, Math | No | No | ||||||
| Colorado | PARCC Assessment | 3 to 11, EoC | Reading (3-11), Math (3-8 and Alg.I, Geom., Integ. I, Integ. II, Integ. III) | No | No | |
|
|
|
X |
| Colorado Measures of Academic Success | 4-5, 7-8 | Science (5,8), Social Studies (4,7) | No | No | ||||||
| Connecticut | Smarter Balanced Assessments | 3 to 8, 11 | English Language Arts, Math | No | No | |
|
|
|
X |
| Connecticut Academic Performance Test | 10 | Science | No | No | ||||||
| Connecticut Mastery Test (CMT) | 5, 8 | Science | No | No | ||||||
| Delaware | Smarter Balanced Assessment | 3-8, 11 | English Language Arts, Math | No | No | |
|
|
|
X |
| Delaware Comprehensive Assessment Systems (DCAS) | 4-5, 7-8, 10 | Social Studies (4,7), Science (5,8,10) | No | No | ||||||
| Florida | Florida Standards Assessment | 3-8, HS | Reading, Math | No | No | |
|
|
|
X |
| FCAT Science | 5, 8 | Science | No | No | ||||||
| Georgia | Georgia Milestone Assessment End of Grade | 3-8 | Language Arts, Math, Science, Social Studies | No | No | |
|
|
|
X |
| Georgia Milestone Assessment, EoC | HS | Algebra I, CCGPS Coordinate Algebra, United States History, Economics/Business/Free Enterprise, Biology, Physical Science, Ninth Grade Literature and Composition, American Literature and Composition, Geometry, Analytic Geometry | No | No | ||||||
| Hawaii | Smarter Balanced Assessment | 3-8, 11 | English Language Arts, Math | No | No | |
|
|
|
X |
| End of Course | EoC | Biology I (required). Algebra I, Algebra II, and U.S. History are optional. | No | No | ||||||
| Hawaii State Assessment in Science | 4, 8 | Science | No | No | ||||||
| Idaho | General Assessment | 3-8, HS | English Language Arts (ELA) and Math(3-8, HS), Science (5,7, HS) | No | No | |
|
|
|
X |
| Illinois | PARCC Assessment | 3-8, HS | English Language Arts, Math | No | No | |
|
|
|
X |
| Indiana | Indiana State-wide Testing for Education Progress- Plus (ISTEP+) | 3-8 | English/Language Arts, Math, Science (4,6), Social Studies (5,7) | No | No | |
|
|
|
X |
| End of Course Assessments (ECAs) | EoC | English 10, Algebra I, Biology I | No | No | ||||||
| Iowa | Iowa Assessment | 3-8,11 | Reading, Math | No | No | |
|
|
|
X |
| Iowa Assessment Science | 5,8,11 | Science | No | No | ||||||
| Kansas | General Assessment | 3-8,10, 11 | Reading, Math, Science (4,7,11) No Science reported | No | No | |
|
|
|
X |
| Kentucky | Kentucky Performance Rating for Educational Progress (K-PREP) | 3-8, 10,11 | Reading, Math, Science (4, 7), Social Studies (5,8), Writing (5, 6, 8, 10, 11), Language Mechanics (4, 6, 10) | No | No | |
|
|
|
X |
| End of Course | EoC | English II, Algebra II, Biology, US History | No | No | ||||||
| Stanford Achievement Test 10 (part of K-PREP) | 3-8 | Reading, Math (3-8) Science (4,7), Social Studies (5,8), Language Mechanics (4,6) | No | No | ||||||
| Louisiana | PARCC general assessment | 3 to 8 | English/Language Arts, Math | No | No | |
|
|
|
X |
| End of Course tests | EoC | English II, English III, Algebra I, Geometry, Biology, US History | No | No | ||||||
| Maine | Smarter Balanced | 3-8, 3rd year HS | Mathematics, ELA/Literacy | No | No | |
|
|
|
X |
| Maine Educational Assessment (MEA) Science | 5,8, 3rd year HS | Science | No | No | ||||||
| Maryland | Maryland School Assessment (MSA) | 5, 8 | Science | No | No | |
|
|
|
X |
| PARCC Assessment | 3 to 8, 10 | English Language Arts, Math | No | No | ||||||
| High School Assessments (HSA) | EoC | Algebra/Data analysis, English, Biology, Government | No | No | ||||||
| Massachusetts | Massachusetts Comprehensive Assessment System (MCAS) | 3-8, 10 | English/Language Arts, Math, | No | No | |
|
|
|
X |
| PARCC general assessment | 3 to 8 | English/Language Arts, Math (3 to 8), Algebra I (8th grade) | No | No | ||||||
| STE MCAS Tests | 5, 8, 9, or 10 | Science and Technology/Engineering (single discipline tests in (Biology, Chemistry, Intro Physics, and Technology/ Engineering) | No | No | ||||||
| Michigan | Michigan Student Test of Educational Progress (M-STEP) | 3-8, 11 | English Language Arts, Math, (3 to 8, 11), Science (4,7, 11), Social Studies (5, 8, 11) | No | No | |
|
|
|
X |
| ACT | HS | English, Reading, Math, Science | No | No | ||||||
| Minnesota | Minnesota Comprehensive Assessment (MCA) –III | 3-8, HS | Reading (3 to 8, 10), Math (3 to 8, 11), Science (5, 8, HS) | Yes | Yes | Yes | |
|
|
|
| Mississippi | PARCC general assessment | 3-8 | Language Arts, Math | No | No | |
|
|
|
X |
| Science Tests | 5,8 | Science | No | No | ||||||
| High school Subject Area Tests | EoC | Biology I, US History | No | No | ||||||
| Missouri | Grade-Level Assessment | 3-8, HS | English Language Arts, Math, Science (5,8), Social Studies (HS) | No | No | |
|
|
|
X |
| Online End of Course Assessments | EoC | English I and II, Algebra I and II, Geometry, Biology I, Physical Science, American History, Government | No | No | ||||||
| Montana | Smarter Balanced Assessment | 3-8, 11 | English Language Arts, Math | No | No | |
|
|
|
X |
| Criterion Referenced Test Science | 4, 8, 10 | Science | No | No | ||||||
| Nebraska | Nebraska State Accountability (NeSA) | 3-8, 11 | Reading, Math , Science (5,8,11), Writing (4, 8, 11) | No | No | |
|
|
|
X |
| Nevada | Criterion Referenced Test (CRT) | 3-8 | Science (5,8) No Reading or Math reported | Yes | Yes | Yes | |
|
|
|
| High School Proficiency Exam | HS | Reading, Math, Science, Writing | Yes | Yes | ||||||
| New Hampshire | Smarter Balanced Assessment | 3 to 8, 11 | Reading, Math | No | No | |
|
|
|
X |
| New England Comprehensive Assessment Program (NECAP) | 4, 8, 11 | Science | No | No | ||||||
| New Jersey | PARCC Assessment | 3 to 8 | English Language Arts, Math | No | No | |
|
|
|
X |
| PARCC High School Assessments | 9 to 11 | English Language Arts (9 to 11), Algebra I, Algebra II, Geometry | No | No | ||||||
| New Mexico | PARCC Assessment | 3-8,10-11 | Reading, Math, Science (3, 7-8, 11). And High School SBA serves as diploma also | No | No | |
|
|
|
X |
| Standards Based Assessment (SBA) | 4, 7, 10-11 | Science | No | No | ||||||
| Standards Based Assessment Spanish | 4, 7, 10-11 | Reading | No | No | ||||||
| New York | New York State Testing Program (NYSTP) | 3-8 | English Language Arts, Math, Science (4,8) | No | No | |
|
|
|
X |
| Common Core Regents | EoC | Algebra I, English Language Arts, Geometry | No | No | ||||||
| Regents Competency Tests | EoC | Math, Science, Reading, Writing, Global Studies, US History and Government. Parts used for Title I and Diploma. | No | No | ||||||
| Regents Exams | EoC | Comprehensive English, US History &Gov’t, Global History & Geography, Alg2/ Trig, Geometry, Integ Alg, Living Envt, Physical etting/Physics, Physical Setting/ Chemistry, Physical setting/Earth Science. Parts used for Title I and Diploma. | No | No | ||||||
|
North Carolina |
End of Grade Multiple Choice Test | 3-8 | Reading, Math, Science (5,8) | No | No | |
|
|
|
X |
| End of Course Multiple Choice | EOC | Math I, Biology, English II, | No | No | ||||||
| North Dakota | Smarter Balanced Assessment | 3-8, 11 | English Language Arts, Math, | No | No | |
|
|
|
X |
| NDSA Science (DRC) | 4, 8, 11 | Science | No | No | ||||||
| Ohio | PARCC Assessment | 3-8 | English Language Arts, Math | No | No | |
|
|
|
X |
| Ohio Graduation Tests (OGT) | HS | Reading, Math, Science, Social Studies, Writing | No | No | ||||||
| Oklahoma | Oklahoma Core Curriculum Tests (OCCT) | 3-8 | Math, Reading, Science (5,8), Geography (7), Social Studies (5), US History (8), Writing (5,8) For Title I, all used except for Geography, Social Studies, History and Writing (partially used for Title I)X | No | No | |
|
|
|
X |
| End of Instruction | EoI | ACE Algebra I, ACE Algebra II, ACE Geometry, ACE English II, III (Writing included), ACE Biology I, ACE US History. For Title I, all used except for Alg II, Eng II, Geometry and US History (partially used for Title I) | No | No | ||||||
| Oregon | Smarter Balanced Assessment | 3-8,11 | English Language Arts, Math | No | No | |
|
|
|
X |
| Science Assessment | 5, 8, 11 | Science | No | No | ||||||
| Pennsylvania | Pennsylvania System of School Assessment (PSSA) | 3-8 | Reading, Math, Science (4,8,) | No | No | |
|
|
|
X |
| Keystone Exam | 11 | Algebra, Biology and Literature | No | No | ||||||
| Rhode Island | New England Education Assessment Program (NECAP) | 4, 8, 11 | Science | No | No | |
|
|
|
X |
| PARCC Assessment | 3-8, 11 | English Language Arts, Math, Algebra, Geometry | No | No | ||||||
| South Carolina | Palmetto Assessment of State Standards | 3-8 | English Language Arts, Math, Science, Social Studies, Writing (5, 8) | No | No | |
|
|
|
X |
| End of Course Examination | EoC | Algebra/Math for Technologies 2, Biology/ Applied Biology 2, English 1, US History and the Constitution | No | No | ||||||
| High School Assessment Program Test | 2nd year HS | English Language Arts, Math | No | No | ||||||
|
South Dakota |
South Dakota State Test of Educational Progress (DSTEP) and Field Testing for Smarter Balanced Assessment | 5, 8, ,11 | Science | No | No | |
|
|
|
X |
| Smarter Balanced Assessment | 3 to 8 | English Language Arts, Math | No | No | ||||||
| ACT | HS | English, Math | No | No | ||||||
| Tennessee | Criterion Referenced Academic Achievement | 3-8 | Math, Reading/ Language, Science | No | No | |
|
|
|
X |
| End of Course | EoC | Algebra I, Algebra II, English I, English II, English III, US History, Biology, Chemistry | No | No | ||||||
| Texas | State of Texas Assessments of Academic Readiness (STAAR) Includes Spanish versions | 3-8 | Math, Reading, Writing (4,7), Science (5,8) Social Studies (8) | No | No | |
|
|
|
X |
| STAAR EoC | EoC | Algebra I, Biology, English I, Reading, English I Writing, US History | No | No | ||||||
| Utah | Student Assessment of Growth and Excellence (SAGE) | 3-11 | Language Arts, Math, Science | No | No | |
|
|
|
X |
| Vermont | Smarter Balanced Assessment | 3-8, 11 | English Language Arts, Math | No | No | |
|
|
|
X |
| NECAP | 4, 8, 11 | Science | No | No | ||||||
| Virginia | Standards of Learning (SOL) | 3-8 | Reading, Math, Science (3,5,8), History/Social Studies (3,5,8), Writing (5,8) | Yes | Yes | Yes | |
|
|
|
| Content Specific Test | 3-8 | Reading, Math, History/Social Science, Science | Yes | Yes | ||||||
| End of Course Test | EoC | Reading, Writing, Algebra I, II, Geometry, Biology, Chemistry, Earth Science, Virginia and US History, World History I, II, World Geography, US History to 1865, US History from 1865 to present, Civics and Economics, Virginia Studies | Yes | Yes | ||||||
| Washington | Smarter Balanced Assessment | 3-8, 11 | English Language Arts, Math | No | No | |
|
|
|
X |
| Measurements of Student Progress (MSP) | 5, 8 | Science | No | No | ||||||
| End of Course | EoC | Algebra 1/Integrated Math 1, Geo-metry/ Integrated Math 2, Biology - part also not used for Title I. Biology reported only. | No | No | ||||||
| West Virginia | West Virginia General Summative Assessment (WVGSA} | 3-11 | English Language Arts/Literacy, Math | No | No | |
|
|
|
X |
| Science | 4, 6, 10 | Science | No | No | ||||||
| Wisconsin | Badger Exam | 3-8 | English Language Arts, Math | No | No | |
|
|
|
X |
| ACT Writing Plus | 11 | Reading, Math, Science, Writing | No | No | ||||||
| Wyoming | Proficiency Assessments for Wyoming Students (PAWS) | 3-8, 11 | Reading, Math, Science (4,8, 11) | No | No | X | ||||
| Total Regular States (N=50) | 3 | 0 | 0 | 0 | 47 | |||||
| Unique States | ||||||||||
| American Samoa | Stanford Achievement Test 10 | Elem to HS | Language Arts, Science, Math Problem Solving, History, Social Science | No | No | |
|
|
|
X |
| Bureau of Indian Education | Individual state administered assessments | Elem to HS | By State: Langauge Arts, Reading, Math, Science | No | No | X | ||||
| Commonwealth of Northern Mariana Islands | ACT ASPIRE | 3 to 10 | English, Math, Reading, Science, Writing | No | No | X | ||||
| U.S.Department of Defense Education Activity | No Assessments Used for Title I | X | ||||||||
| District of Columbia | PARCC Assessment | 3-8, HS | English Language Arts, Math | No | No | X | ||||
| Federated States of Micronesia | No Assessments Used for Title I | X | ||||||||
| Guam | Stanford Achievement Test, 10 | 1-12 | Reading (1,2), Math( 1,2), Science(1-8) and Social Studies(1-8), Following are 9to 12: Anatomy and Physiology, Biology, Chemistry, Physical Science, Algebra 1 and 2, Geometry, US Government, US History, World History, Guam History, and Geography. Results reported for students with disabilities only for Reading, Math and Science. | No | No | X | ||||
| ACT ASPIRE | 3 to 10 | English, Reading, Math | No | No | ||||||
| Palau | No information found | X | ||||||||
| Puerto Rico | Puerto Rican Academic Achievement Test | 3-8, 11 | Spanish, English, Math, Science (4,8,11) | No | No | X | ||||
| Republic of Marshall Islands N | No Assessments Used for Title I | X | ||||||||
| U.S. Virgin Islands | Smarter Balanced Assessment | 3-8, 11 | English Language Arts, Math | No | No | X | ||||
| Total Unique States (N=11)* | 0 | 0 | 3 | 1 | 7 | |||||
| Total Regular and Unique States (N=61) | 3 | 0 | 3 | 1 | 54 | |||||
| Percent | 5% | 0% | 5% | 2% | 88% | |||||
Table B-5. Part9icipation and Performance Data for English Language Learners (ELLs) with Disabilities, General Assessments Not Used for Title I Accountability, 2014-2015
| State | Test | Grade | Subject Areas |
Disaggregated Special Education Data on General Assessments Not Used for Title I |
||||||
|---|---|---|---|---|---|---|---|---|---|---|
| Partici-pation | Perform-ance | Reporting Summary By State | ||||||||
| All Used for Title I | Part. and Perf. All Tests | Part. and Perf. Some Tests | No Assmt. Info Found | No Publicly Reported Data Found | ||||||
| Regular States | ||||||||||
| Alabama | The ACT Plus Writing | 11 | English, Math, Reading, Science, Writing | No | No | |
|
|
|
X |
| Alaska | No non-Title I assessments | |
|
- | - | Yes | |
|
|
|
| Arizona | No non-Title I assessments | |
|
- | - | Yes | |
|
|
|
| Arkansas | No non-Title I assessments | |
|
- | - | Yes | |
|
|
|
| California | No non-Title I assessments | |
|
- | - | Yes | |
|
|
|
| Colorado | No non-Title I assessments | |
|
- | - | Yes | |
|
|
|
| Connecticut | No non-Title I assessments | |
|
- | - | Yes | |
|
|
|
| Delaware | End of Course Exams | EoC | U.S. History (required), Biology, Algebra II, Integrated Mathematics III (not required) | No | No | |
|
|
|
X |
| Florida | End of Course Assessment | EoC | Algebra I, Civics, U.S. History, Biology I, Geometry | No | No | |
|
|
|
X |
| Georgia | No non-Title I assessments | |
|
- | - | Yes | |
|
|
|
| Hawaii | End of Course | EoC | Algebra I, Algebra II, Biology I, Expository Writing I and/or U.S. History | No | No | |
|
|
|
X |
| Idaho | Idaho Reading Indicator | K-3 | Reading | No | No | |
|
|
|
X |
| Illinois | No non-Title I assessments | |
|
- | - | Yes | |
|
|
|
| Indiana | Indiana Reading Evaluation and Determination (IREAD-3) | 3 | Reading | No | No | |
|
|
|
X |
| Iowa | No non-Title I assessments | |
|
- | - | Yes | |
|
|
|
| Kansas | No non-Title I assessments | |
|
- | - | Yes | |
|
|
|
| Kentucky | Explore | 8 | English, Math, Reading, Science | No | No | |
|
|
|
X |
| PLAN | 10 | English, Math, Reading, Science | No | No | ||||||
| ACT | 11 | English, Math, Reading, Science | No | No | ||||||
| Louisiana | ACT | 12 | English, Reading, Math, Science | No | No | |
|
|
|
X |
| Maine | No non-Title I assessments | |
|
- | - | Yes | |
|
|
|
| Maryland | High School Assessments (HSA) | EoC | English, Algebra/Data Analysis, Biology, Government | No | No | |
|
|
|
X |
| Massachusetts | No non-Title I assessments | |
|
- | - | Yes | |
|
|
|
| Michigan | No non-Title I assessments | |
|
- | - | Yes | |
|
|
|
| Minnesota | No non-Title I assessments | |
|
- | - | Yes | |
|
|
|
| Mississippi | No non-Title I assessments | |
|
- | - | Yes | |
|
|
|
| Missouri | No non-Title I assessments | |
|
- | - | Yes | |
|
|
|
| Montana | ACT Plus Writing | HS | Reading, Language, Math, Science, Writing | No | No | |
|
|
|
X |
|
Nebraska |
Iowa Test of Basic Skills (ITBS) | 3-11 | Reading, Math | No | No | |
|
|
|
X |
| National Assessment Instrument | 2 to 12 | Reading, Math | No | No | ||||||
| Metropolitan Achievement Test | 4, 8 | Reading, Math | No | No | ||||||
| Terra Nova | 3-11 | Reading, Math | No | No | ||||||
| SAT | 4, 5, 8 to 9 | Reading, Math | No | No | ||||||
| ACT ASPIRE | 4, 8, 9, 10 | Reading, Math | No | No | ||||||
| ACT Explore | 8 | Math, Reading | No | No | ||||||
| ACT PLAN | 9 to 11 | Math, Reading | No | No | ||||||
| Nevada | No non-Title I assessments | |
|
- | - | Yes | |
|
|
|
| New Hampshire | No non-Title I assessments | |
|
- | - | Yes | |
|
|
|
| New Jersey | No non-Title I assessments | |
|
- | - | Yes | |
|
|
|
| New Mexico | No non-Title I assessments | |
|
- | - | Yes | |
|
|
|
| New York | No non-Title I assessments | |
|
- | - | Yes | |
|
|
|
| North Carolina | ACT Benchmark | 11 | English, Math, Reading, Science, Writing. State requires taking in 11th grade. | No | No | |
|
|
|
X |
| North Dakota | No non-Title I assessments | |
|
- | - | Yes | |
|
|
|
| Ohio | No non-Title I assessments | |
|
- | - | Yes | |
|
|
|
| Oklahoma | Oklahoma Core Curriculum Tests (OCCT) | 3 to 8 | Math, Reading, Science (5,8), Geography (7), Social Studies (5), US History (8), Writing (5,8) For Title I, all used except for Geography, Social Studies, History and Writing | No | No | |
|
|
|
X |
| End of Instruction | EoI | ACE Algebra I, II, ACE Geometry, ACE English II, III, (writing included), ACE Biology I, ACE US History. For Title I, all used except for Alg II, Eng II, Geometry and US History | No | No | ||||||
| Oregon | No non-Title I assessments | |
|
- | - | Yes | |
|
|
|
| Pennsylvania | No non-Title I assessments | |
|
- | - | Yes | |
|
|
|
| Rhode Island | No non-Title I assessments | |
|
- | - | Yes | |
|
|
|
| South Carolina | ACT | 3rd year in HS | English Language Arts, Math | No | No | |
|
|
|
X |
| ACT Work Keys | 3rd year in HS | Reading for Information, Applied Math, Locating Information | No | No | ||||||
| ACT ASPIRE | 3 to 8 | English, Math, Reading, Writing | No | No | ||||||
| South Dakota | No non-Title I assessments | |
|
- | - | Yes | |
|
|
|
| Tennessee | Writing | 3-11 | Writing | No | No | |
|
|
|
X |
| ACT PLAN, Exlore | 8, 10 | Reading, Math | No | No | ||||||
| ACT | HS | English, Math, Reading, Science, Composite | No | No | ||||||
| Texas | Texas Assessment of Know-ledge and Skills (TAKS) | 11, 12 (retest) | English Language Arts, Math, Science, Social studies | Yes | Yes | |
Yes | |
|
|
| Utah | K3 Reading Competency | K to 3 | Reading | No | No | |
|
|
|
X |
| Vermont | No non-Title I assessments | |
|
- | - | Yes | |
|
|
|
| Virginia | No non-Title I assessments | |
|
- | - | Yes | |
|
|
|
| Washington | End of Course (partially) | EoC | Algebra 1/Integrated Math 1, Geometry/Integrated Math 2, Biology | No | No | |
|
|
|
X |
| High School Proficiency Exam | HS | Reading, Writing | No | No | ||||||
| West Virginia | SAT | HS | Critical Reading and Math | No | No | |
|
|
|
X |
| HEAP Health Assessment | 6, 8, HS | Health | No | No | ||||||
| ACT Work Keys | 12 | Applied Math, Reading for Information, and Locating Information | No | No | ||||||
| Global 21 Career/Technical Education (CTE) | 9 - 12 | Career/Technical Education | No | No | ||||||
| ACT Explore, Plan | 8, 10 | English, Math, Reading, Science | No | No | ||||||
| Wisconsin | ACT Work Keys | 11 | Applied Mathematics, Locating Information, and Reading for Information | No | No | |
|
|
|
X |
| ACT ASPIRE | 9, 10 | Reading, Mathematics, Science, and Writing | No | No | ||||||
| Wyoming | ACT Explore, ACT Plan | 9 | English, Math, Reading, Science | No | No | |
|
|
|
X |
| Act Plus Writing or Workkeys (students have option in grades 11 and 12 to take Workkeys) | 11, 12 | English, math, Reading, Writing, Science | No | No | ||||||
| Total Regular States (N=50) | 29 | 1 | 0 | 0 | 20 | |||||
| Unique States | ||||||||||
| American Samoa | No non-Title I assessments | |
|
- | - | Yes | |
|
|
|
| Bureau of Indian Education | Unclear if any outside for states | |
|
- | - | Yes | |
|
|
|
| Commonwealth of Northern Mariana Islands | Standards Based Assessment | 4, 6, 8, 9 to 12 | Chamorro & Carolinian Language Heritage Studies (CCLHS) | No | No | |
|
|
|
X |
| End of Course | EoC | NMI History | No | No | ||||||
| U.S.Department of Defense Education Activity | Terra Nova, Multiple Assessments, 3rd Edition | 3 - 9 | Reading/Language Arts, Mathematics, Science, Social Studies | No | No | |
|
|
|
X |
| SAT | HS | Critical Reading, Math, Writing | No | No | ||||||
| District of Columbia | No non-Title I assessments | |
|
- | - | Yes | |
|
|
|
| Federated States of Micronesia | National Minimum Competency Standard-Based Test (NMCT) | 4, 6, 8, 10 | Reading (6,8,10), Math (4,6,8,10) | No | No | |
|
|
|
X |
| Guam | No non-Title I assessments | |
|
- | - | Yes | |
|
|
|
| Palau | No information found | |
|
- | - | |
|
|
X | |
| Puerto Rico | No non-Title I assessments | |
|
- | - | Yes | |
|
|
|
| Republic of Marshall Islands | No information found | |
|
- | - | |
|
|
X | |
| U.S. Virgin Islands | No non-Title I assessments | |
|
- | - | Yes | |
|
|
|
| Total Unique States (N=11) | 6 | 0 | 0 | 2 | 3 | |||||
| Total Regular and Unique States (N=61) | 35 | 1 | 0 | 2 | 23 | |||||
| Percent * | 57% | 2% | 0 | 3% | 38% | |||||
Table B-6. Participation and Performance Data for English Learners (ELs) with Disabilities, Alternate Assessments Based on Alternate Achievement Standards (AA-AAS) Used for Title I Accountability, 2014-2015
| State | Test | Grade | Subject Areas | Disaggregated Special Education Data For AA-AAS Used for Title I | ||||||
|---|---|---|---|---|---|---|---|---|---|---|
| Partici-pation | Perform-ance | Summary by State | ||||||||
| Partic. And Perf. For All Tests | Partic. And Perf. For Some Tests | No Alt. for Title I | No Alt. Inform. Found | No Publicly Reported Data Found | ||||||
| Regular States | ||||||||||
| Alabama | Alabama Alternate Assessment (AAA) | 3-8, 11 | Reading, Math, Science (5,7) | Yes | Yes | Yes | |
|
|
|
| Alaska | Alaska Alternate Assessment | 3-10 | Reading, Writing, Math (3-10) Science (4,8,10) | Yes | Yes | Yes | |
|
|
|
| Arizona | NCSC | 3 to 11 | English Language Arts, Math | No | No | |
|
|
|
X |
| Arkansas | NCSC | 3 to 8, 11 | English Language Arts, Math | No | No | |
|
|
|
X |
| Arkansas Alternate Portfolio | 5, 7, 10 | Science | No | No | ||||||
| California | California Alternate Assessment (CAA) | 3- 8, 11 | English Language Arts, Math | No | No | |
Yes | |
|
|
| California Alternate Performance Assessment (CAPA) | 5, 8, 10 | Science | Yes | Yes | ||||||
| Colorado | Colorado Alternate Assessment (CoAlt) | 5, 8 | Science | Yes | Yes | |
Yes | |
|
|
| DLM | |
English Language Arts, Math | No | No | ||||||
| Connecticut | Science Alternate | Unclear | Science | No | No | |
Yes | |
|
|
| NCSC | 3 -8, 11 | English Language Arts, Math | Yes | Yes | ||||||
| Delaware | Delaware Comprehensive Assessment System (DCAS-Alt) | 3-11 | Reading, Math (3-11), Science (5,8,10), Social Studies (4,7,9) | Yes | Yes | Yes | |
|
|
|
| Florida | Florida Alternate Assessment (FAA) | 3-8, HS | Reading, Math | No | No | |
|
|
|
X |
| Georgia | Georgia Alternate Assessment | 3-8, HS | English/Language Arts, Math, Science, Social Studies | Yes | Yes | Yes | |
|
|
|
| Hawaii | Alternate Assessment | 3-8, HS | Reading, Math, Science (4,8,11) | No | No | |
|
|
|
X |
| Idaho | ISAT Alternate Science | 5, 7, 10 | Science | No | No | |
|
|
|
X |
| NCSC | 3-8, 11 | English Language Arts, Math | No | No | ||||||
| Illinois | DLM | 3-8,11 | English Language Arts, Math | Yes | Yes | Yes | |
|
|
|
| Indiana | NCSC | 3-8, HS | English Language Arts, Math | No | No | |
|
|
|
X |
| Indiana Standards Tool for Alternate Reporting (ISTAR) | 4 to 7 | Science and Social Studies | No | No | ||||||
| Iowa | Iowa Alternate Assessment (IAA) | 3-8,11 | Reading, Math | No | No | |
|
|
|
X |
| Iowa Alternate Assessment (IAA) Science | 5,8,11 | Science | No | No | ||||||
| Kansas | DLM | 3-8, 10, 11 | Reading, Math, Science (4, 7, 10) | No | No | |
|
|
|
X |
| Kentucky | Alternate Kentucky Performance Rating for Educational Progress (K-PREP) | 3-12 | Reading (3-9), Math (3-8,10), Writing (4,5,6, 8,10,11), Science (4,7,11), Social Studies (5,8,12) | No | No | |
|
|
|
X |
| Louisiana | Louisiana Alternate Assessment 1. If different test, no information found | 3-11 | English/Language arts, Math, Science | No | No | |
|
|
|
X |
| Maine | Maine Personalized Alternate Assessment Portfolio (MEPAAP) | 5, 8, 3rd yr. HS | Science | No | No | |
|
|
|
X |
| NCSC | 3-8, 3rd yr. HS | ELA/Literacy, Math | No | No | ||||||
| Maryland | Alternate Maryland School Assessment (ALT-MSA) | 3-8,10 | Math, Reading, Science (5,8,10) | Yes | Yes | Yes | |
|
|
|
| Massachusetts | Massachusetts Comprehensive Assessment System Alternate (MCAS-Alt) | 3-10 | English/Language Arts, Math, Science and Technology/ Engineering (5, 8-10) | No | No | |
|
|
|
X |
| Michigan | Michigan Access (MI-Access) Functional Independence | 3-8, 11 | English Language Arts, Math, Science (4, 7, 11), Social Studies (5, 8, 11) | Yes | Yes | Yes | |
|
|
|
| Michigan Access (MI-Access) Supported Independence | 3-8, 11 | English Language Arts, Math, Science (4, 7 11) | Yes | Yes | ||||||
| Michigan Access (MI-Access) Participation | 3-8, 11 | English Language Arts, Math, Science (4, 7, 11) | Yes | Yes | ||||||
| Minnesota | Minnesota Test of Academic Skills III (MTAS III) | 3-8, HS | Reading and Math, Science (5, 8, HS) | Yes | Yes | Yes | |
|
|
|
| Mississippi | DLM | 3-8 | Language Arts, Math, Science (5,8) | No | No | |
|
|
|
X |
| DLM HS | HS | Language Arts, Math, Science | No | No | ||||||
| Missouri | Missouri Assessment Program Alternate (MAP-A) | 3-8, 10, 11 | English Language Arts, (3 to 8, 11) Math (3 to 8, 10), Science (5, 8, 11) | No | No | |
|
|
|
X |
| Montana | MSAA Alternate (NCSC assessment) | 3-8, 11 | English Language Arts, Math | No | No | |
|
|
|
X |
| Criterion Referenced Test (CRT) | 4, 8.10 | Science | No | No | ||||||
| Nebraska | Alternate Assessments (NESA-M and NESA-AAM) | 3-8, 11 | Reading, Math, Science (5,8,11), Writing (8,11) | No | No | |
|
|
|
X |
| Nevada | Nevada Alternate Assessment (NAA) | 3-8, 11 | Reading, Math, | Yes | Yes | |
Yes | |
|
|
| Nevada Alternate Assessment (NAA) | 8 | Science (8), Writing (8) | No | No | ||||||
| New Hampshire | New Hampshire Alternate Learning Progression Assessment (NH ALPS) | 4, 8. 11 | Science | No | No | |
|
|
|
X |
| DLM | 3-8, 11 | Reading, Math | No | No | ||||||
| New Jersey | Alternate Proficiency Assessment | 4, 8, 11 | Science | Yes | Yes | |
Yes | |
|
|
| DLM | 3-8, 11 | Reading Math | No | No | ||||||
| New Mexico | NCSC | 3-8, 11 | English Language Arts, Math | No | No | |
|
|
|
X |
| Alternative Performance Assessment (NMAPA) | 4, 7, HS | Science | No | No | ||||||
| New York | New York State Alternate Assessment (NYSAA) | 3-8, HS | English Language Arts, Math, Science (4,8, HS), Social Studies (HS) | No | No | |
|
|
|
X |
| North Carolina | North Carolina Extend 1 (NCEXTEND1) | 3-8 | Reading, Math, Science (5,8) | Yes | Yes | Yes | |
|
|
|
| North Carolina Extend 1 (NCEXTEND1) | 10 | Math I, Biology, English II | Yes | Yes | ||||||
| North Dakota | North Dakota Alternate Assessment 1 (NDAA1) | 4, 8. 11 | Science | No | No | |
|
|
|
X |
| DLM | 3-8, 11 | English Language Arts, Math | No | No | ||||||
| Ohio | Alternate Assessment for Students with Cognitive Disabilities (AASCD) | 3-8 | English/Language Arts, Math, Science (5,8) | Yes | Yes | Yes | |
|
|
|
| Alternate Ohio Graduation Test (OGT-AASCD) | HS | English/Language Arts, Math, Science, Social Studies | Yes | Yes | ||||||
| Oklahoma | Oklahoma Alternate Assessment Program (OAAP) | 3-8, EoI | Math, Reading, Science (5,8), Geography, Social Studies, Writing (5,8), Algebra I, English II/ Writing, Biology, US History (others if took Algebra II, Geometry, English III/ Writing) | No | No | |
|
|
|
X |
| Oregon | Oregon Assessment of Knowledge and Skills (OAKS) Extended | 3-8,11 | Reading, Math, Science (5,8,11), Writing (11) | No | No | |
|
|
|
X |
| Pennsylvania | Pennsylvania Alternate System of Assessment (PASA) | 3-8, 11 | Reading, Math | Yes | Yes | |
Yes | |
|
|
| Pennsylvania Alternate System of Assessment (PASA) | 4, 8, 11 | Science | No | No | ||||||
| Rhode Island | Rhode Island Alternate Assessment (RIAA) | 4, 8, 11 | Science | No | No | |
|
|
|
X |
| NCSC | 3-8, 11 | English Language Arts, Math | No | No | ||||||
| South Carolina | South Carolina Alternate (SC-ALT) | 4 to 8 | Science, Social Studies | No | No | |
|
|
|
X |
| NCSC | 3-8,11 | English Language Arts, Math | No | No | ||||||
| South Dakota | Dakota State Test of Educational Progress Alternate (DSTEP A) | 5, 8, 11 | Science | No | No | |
|
|
|
X |
| NCSC | 3-8, 11 | English Language Arts, Math | No | No | ||||||
| Tennessee | Alternate Assessment (transition to NCSC) | 3-8, 11 | English Language Arts, Math, Science | No | No | |
|
|
|
X |
| Texas | State of Texas Assessments of Academic Readiness Alternate (STAARALT2) | 3-8 | Math, Reading, Writing (4,7), Science (5,8) Social Studies (8) | Yes | Yes | Yes | |
|
|
|
| STAARALT2 End of Course (EoC) | EoC | English I, English II, Algebra I, Biology, US History | Yes | Yes | ||||||
| Utah | DLM | 3-11 | Language Arts, Math, and Science | No | No | |
|
|
|
X |
| Vermont | Alternate Assessment | 4, 8, 11 | Science | No | No | |
|
|
|
X |
| DLM | 3 to 11 | English Language Arts, Math | No | No | ||||||
| Virginia | Virginia Alternate Assessment Portfolio (VAAP) | 3-8 | Reading, Math, History/Social Science, Science | Yes | Yes | Yes | |
|
|
|
| Virginia Alternate Assessment Portfolio End of Course (VAAP EoC) | EoC | Reading, Math, History/Social Science, Science | Yes | Yes | ||||||
| Washington | WA-AIM Alternate Assessment | 3-8, 11 | English Language Arts, Math, Science (5, 8) | No | No | |
|
|
|
X |
| West Virginia | West Virginia Alternate Summative Assessment | 3-8, HS | Reading, Math | No | No | |
|
|
|
X |
| Wisconsin | Wisconsin Alternate Assessment (WAA-SwD) | 4, 8, 10 | Science, Social Studies | No | No | |
|
|
|
X |
| DLM | 3 to 11 | English Language Arts, Math | No | No | ||||||
| Wyoming | Wy-ALT | 3-8, HS | English Language Arts, Math (3 to 8-11), Science (4, 8, 9 to 11) | No | No | |
|
|
|
X |
|
Total Regular States (N=50) |
12 | 6 | 0 | 0 | 32 | |||||
| Unique States | ||||||||||
| American Samoa | No information found | |
|
No | No | |
|
|
X | |
| Bureau of Indian Education | Merged with regular | Elem to HS | By state: Langauge Arts, Reading, Math, Science | No | No | |
|
|
|
X |
| Common-wealth of Northern Mariana Islands | Multiple States Alternate Assessment (MSAA) | 3-8, 11 | English Language Arts, Math | No | No | |
|
|
|
X |
| U.S. Department of Defense Education Activity | DoDEA Alternate Assessment. No Alternate for Title I. | K to 12 | The Alternate Assessment is comprised of evidence of the student’s achievement, including but not limited to student work products, interviews, photographs, videos, etc. | No | No | |
|
X | |
|
| District of Columbia | NCSC | 3 to 8, HS | English Language Arts, Math | No | No | |
|
|
|
X |
| Federated States of Micronesia | Alternate Assessment on Alternate Achievement Standards. No Alternate for Title I. | 6, 8, 10 | Reading, Math, Science (8) | No | No | |
|
X | |
|
| Guam | NCSC and DoE Alt. Assmt | 3-8, 11 | English Language Arts, Math Doe Alternate 1,2, 9, 10 ELA, Math | No | No | |
|
|
|
X |
| Palau | No information found | |
|
No | No | |
|
|
X | |
| Puerto Rico | Puerto Rico Alternate Assessment | 3-8, 11 | Spanish, English, Math, Science (4,8,11) | No | No | |
|
|
|
X |
| Republic of Marshall Islands | No Alternate for Title I | |
|
No | No | |
|
X | |
|
| U.S. Virgin Islands | Alternate Assessment | 3-8, 11 | English Language Arts. Math | No | No | |
|
|
|
X |
| Total Unique States (N=11) | 0 | 0 | 3 | 2 | 6 | |||||
| Total Regular and Unique States (N=61) | 12 | 6 | 3 | 2 | 38 | |||||
| Percent | 20% | 10% | 5% | 3% | 62% | |||||
Table B-7. Participation and Performance Data for Students with Disabilities and ELs with Disabilities, on Alternate Assessments Based on Modified Achievement Standards (AA-MAS) Used for Title I Accountability, 2014-2015
| State | Test | Grade | Subject Areas | Disaggregated Data for AA-MAS | |||
|---|---|---|---|---|---|---|---|
| Students with Disabilities Summary |
ELs with Disabilities Summary |
||||||
| Participation and Performance | No Data Found | Participation and Performance | No Data Found | ||||
| Regular States | |||||||
| California | California Modified Assessment (CMA) | 3-11 | Science (5,8, and 10 Life Science) | Yes | Yes | ||
| North Dakota | North Dakota Alternate Assessment 2 (NDAA2) | 3-8, 11 | Reading/Language Arts, Math, Science (4,8, 11) | Yes | X | ||
| Virginia | Virginia Modified Achievement Standards Test (VMAST) | 3-8, EoC | Math, Reading (3-8), Algebra I and Reading EoC | Yes | Yes | ||
| Total Regular States with MAS (N=11) | 3 | 0 | 2 | 1 | |||
| Percent | 100% | 0% | 67% | 33% | |||
Table B-8. Participation and Performance Data for Students with Disabilities and ELs with Disabilities, Alternate Assessments Based on Grade Level Achievement Standards (AA-GLAS) Used for Title I Accountability, 2014-2015
| State | Test | Grade | Subject Areas | Disaggregated Data for AA-GLAS | |||
|---|---|---|---|---|---|---|---|
| Students with Disabilities | ELs with Disabilities | ||||||
|
Partici- pation |
Perform- ance |
Partici- pation |
Perform- ance |
||||
| Regular States | |||||||
| Massachusetts |
Alternate Based on Grade Level Achievement Standards |
3-8, 10 |
English Language Arts, Math, Science/Engineering (5, 8, 9. 10) |
Yes | Yes1 | No | No |
| Virginia |
Virginia Grade Level Alternate Assessment (VGLAA) and EoC. |
3-8, EoC |
Reading, History/Social Science (3, EoC), Science (3,5,8, EoC) Writing (5,8, EoC) |
Yes | Yes | Yes | Yes |
| Total Regular States with GLAS (N=1) | 2 | 2 | 1 | 1 | |||
| Percent | 100% | 100% | 50% | 50% | |||
1 State reports these data merged with general assessment performance data.
Table B-9. How Participation was Reported in States for the General
Assessments, 2014-2015
(Note: There is an asterisk after the state name if the state did not
report data by grade and test.1)
| State | Participation Data Reported On General Assessments | |||||||
|---|---|---|---|---|---|---|---|---|
|
Number Enrolled/ Eligible to be Tested |
Number of Students Tested |
Number of Students Not Tested |
Percent Part. in Test |
Percent of Students not Tested |
Number of Students with Scores |
Number of Students with No scores |
Percent of Students with No Scores |
|
| Regular States | ||||||||
| Alabama | - | - | - | X2 | - | - | - | - |
| Alaska | X | - | - | X | - | - | - | - |
| Arizona | - | X | - | - | - | - | - | - |
| Arkansas | X | - | - | X | - | X | - | - |
| California | X | X | - | X | - | X | - | - |
| Colorado | - | X | - | X | - | - | X | X |
| Connecticut | X | X | - | X | - | X | - | - |
| Delaware | X | X | X | X | - | - | X | - |
| Florida | X* | X | - | X3 | X | - | - | - |
| Georgia | - | X | - | - | - | - | - | - |
| Hawaii | X | X | - | X* | - | - | - | - |
| Idaho | - | X | - | X | - | - | - | - |
| Illinois | X* | X | X | X* | X | - | - | - |
| Indiana | - | X | - | - | - | - | X | X |
| Iowa | X | X | - | X4 | - | - | - | - |
| Kansas | X | X | X | X* | X | - | - | - |
| Kentucky | X | X | - | X | - | - | - | - |
| Louisiana | - | - | - | - | - | - | - | - |
| Maine | X | X | - | X5 | - | - | - | - |
| Maryland | - | X* | - | X* | - | - | - | - |
| Massachusetts | - | - | - | X6 | X* | - | - | - |
| Michigan | - | X | - | |
- | - | - | - |
| Minnesota | X* | X | - | - | - | - | - | - |
| Mississippi | - | - | - | - | - | - | - | - |
| Missouri | X* | X* | - | - | - | - | - | - |
| Montana | - | - | - | - | - | - | - | - |
| Nebraska | - | X | X | X | X | - | - | - |
| Nevada | X | X | - | - | - | - | - | - |
| New Hampshire | X | X | - | X7 | - | X | X | - |
| New Jersey | X | - | X | - | - | X | X | - |
| New Mexico | - | X* | - | - | - | - | - | - |
| New York | - | X | - | - | - | - | - | - |
| North Carolina | X | X | X | X8 | X | - | X | X |
| North Dakota | X* | X | X | X* | X* | X* | X* | X* |
| Ohio | X* | X* | X* | X* | X* | - | - | - |
| Oklahoma | - | - | - | - | - | - | - | - |
| Oregon | - | X | - | X* | - | - | - | - |
| Pennsylvania | - | - | - | - | - | - | - | - |
| Rhode Island | - | X | - | - | - | - | - | - |
| South Carolina | - | X | - | - | - | - | - | - |
| South Dakota | - | X | - | - | X* | - | - | - |
| Tennessee | - | - | - | - | - | X* | - | - |
| Texas | - | X | - | - | - | X | X | - |
| Utah | - | - | - | - | - | - | - | - |
| Vermont | - | X | - | - | - | - | - | - |
| Virginia | - | X | - | X | X | - | X | - |
| Washington | X | - | X* | - | X* | - | X | X |
| West Virginia | - | - | - | X* | - | - | - | - |
| Wisconsin | X | - | - | - | - | - | X | X |
| Wyoming | - | X | - | X* | - | - | - | - |
| Total Regular States (N=50) | 22 | 35 | 9 | 26 | 11 | 8 | 11 | 6 |
| Unique States | ||||||||
| American Samoa | - | - | - | - | - | - | - | - |
| Bureau of Indian Education | - | - | - | - | - | - | - | - |
|
Commonwealth of Northern Marianna Islands |
- | - | - | - | - | - | - | - |
| District of Columbia | - | X* | - | X* | - | - | - | - |
| Federated States of Micronesia | - | - | - | - | - | - | - | - |
| Guam | X | X | - | X* | - | X | - | - |
| Palau | - | - | - | - | - | - | - | - |
| Puerto Rico | - | - | - | - | - | - | - | - |
| Republic of Marshall Islands | - | - | - | - | - | - | - | - |
|
U.S. Department of Defense Education Activity |
- | - | - | - | - | - | - | - |
| U.S. Virgin Islands | - | - | - | - | - | - | - | - |
| Total Unique States (N=11) | 1 | 2 | 0 | 2 | 0 | 1 | 0 | 0 |
| Total All Regular and Unique States (N=61) | 23 | 37 | 9 | 28 | 11 | 9 | 11 | 6 |
1 Other methods (besides by grade and test) = merging grades and merging
tests, by grade and merging tests, by test and merging grades
2 Alabama reported participation rate by grade, but denominator was
unclear (e.g., 9.17%)
3 Florida reported participation rate by grade but by accommodated status.
4 Iowa reported participation rate by grade, but by accommodated status.
5 Maine only had rates found for Science.
6 Massachusetts reported participation rate by grade, but by accommodated
status and percent not tested.
7 New Hampshire reported participation data by grade, but as percentage
of all students enrolled in grade.
8 North Carolina reported percent participating as percent of all
students tested in grade (e.g., 10%)
Table B-10. How Participation was Reported in States for the Alternate
Assessments based on Alternate Achievement Standards, 2014-2015
(Note: There is an asterisk after the state name if the state did not
report data by grade and test.1)
| State | Participation Data Reported On AA-AAS | ||||||||
|---|---|---|---|---|---|---|---|---|---|
|
Number Enrolled/ Eligible to be Tested |
Number of Students Tested |
Number of Students Not Tested |
Percent Part. in Test |
Percent of Students not Tested |
Number of Students with Scores |
Number of Students with No scores |
Percent of Students with No Scores |
||
| Regular States | |||||||||
| Alabama | - | - | - | X | - | - | - | - | |
| Alaska | X | - | - | X | - | - | - | - | |
| Arizona | - | X | - | X | - | - | - | - | |
| Arkansas | - | - | - | - | - | - | - | - | |
| California | - | X | - | - | - | X | - | - | |
| Colorado | X | - | - | - | - | X | X | X | |
| Connecticut | - | - | - | X | - | - | - | - | |
| Delaware | - | - | - | X | - | - | - | - | |
| Florida | - | X | - | X | - | X | X | - | |
| Georgia | - | X | - | - | - | - | - | - | |
| Hawaii | - | - | - | X* | - | - | - | - | |
| Idaho | - | - | - | X* | - | - | - | - | |
| Illinois | X* | X* | - | - | X* | - | - | - | |
| Indiana | - | - | - | - | - | - | - | - | |
| Iowa | X | X | - | X* | - | - | - | - | |
| Kansas | - | X | - | - | X | - | - | - | |
| Kentucky | X | X | - | X | - | - | - | - | |
| Louisiana | - | - | - | - | - | - | - | - | |
| Maine | X | X | - | X* | - | - | - | - | |
| Maryland | - | X* | - | - | - | - | - | - | |
| Massachusetts | - | X | - | X | X* | - | - | X | |
| Michigan | - | X | - | - | - | - | - | - | |
| Minnesota | - | X | - | X* | - | - | - | - | |
| Mississippi | - | - | - | - | - | - | - | - | |
| Missouri | X* | X* | - | - | - | - | - | - | |
| Montana | - | - | - | - | - | - | - | - | |
| Nebraska | - | X | X | X | X | - | - | - | |
| Nevada | X | X | - | - | - | - | - | - | |
| New Hampshire | X | X | - | X | - | - | X | - | |
| New Jersey | X | X | - | - | - | X | X | - | |
| New Mexico | - | - | - | - | - | - | - | - | |
| New York | X* | X* | - | - | X* | - | - | - | |
| North Carolina | X* | X | X* | X* | - | X* | X* | X* | |
| North Dakota | X* | X | X* | X* | X* | X* | X* | X* | |
| Ohio | X* | X* | X* | X* | X* | - | - | - | |
| Oklahoma | - | - | - | - | - | - | - | - | |
| Oregon | - | - | - | X | - | - | - | - | |
| Pennsylvania | - | X | - | - | - | - | X | X | |
| Rhode Island | X | X | X | - | - | - | X | - | |
| South Carolina | - | X | X | - | - | - | - | - | |
| South Dakota | - | X* | - | - | X* | - | - | - | |
| Tennessee | - | - | - | - | - | X* | - | - | |
| Texas | - | X | - | - | - | X | X | - | |
| Utah | - | X | - | - | - | - | - | - | |
| Vermont | - | - | - | - | - | - | - | - | |
| Virginia | - | X | - | X | X | - | X | - | |
| Washington | X | - | X* | - | X* | - | X | X | |
| West Virginia | - | - | - | X* | - | - | - | - | |
| Wisconsin | X | - | - | - | - | - | X | X | |
| Wyoming | - | X | - | X | - | - | - | - | |
| Total Regular States (N=50) | 17 | 30 | 7 | 22 | 10 | 7 | 12 | 7 | |
| Unique States | |||||||||
| American Samoa | - | - | - | - | - | - | - | - | |
| Bureau of Indian Education | - | - | - | - | - | - | - | - | |
|
Commonwealth of Northern Marianna Islands |
- | - | - | - | - | - | - | - | |
|
U.S. Department of Defense Education Activity |
- | - | - | - | - | - | - | - | |
| District of Columbia | - | X | - | X* | - | - | - | - | |
| Federated States of Micronesia | - | - | - | - | - | - | - | - | |
| Guam | X | X | X | - | - | X | X | - | |
| Palau | - | - | - | - | - | - | - | - | |
| Puerto Rico | - | - | - | - | - | - | - | - | |
| Republic of Marshall Islands | - | - | - | - | - | - | - | - | |
| U.S. Virgin Islands | - | - | - | - | - | - | - | - | |
| Total Unique States (N=11) | 1 | 2 | 1 | 1 | 0 | 1 | 1 | 0 | |
|
Total All Regular and Unique States (N=61) |
18 | 32 | 8 | 23 | 10 | 8 | 13 | 7 | |
1 Other methods (besides by grade and test) = merging grades and merging tests, by grade and merging tests, by test and merging grades
Table B-11. State Abbreviation Key
|
State Abbreviation |
State’s Full Name |
State Abbreviation |
State’s Full Name |
|---|---|---|---|
| AL | Alabama | MO | Missouri |
| AK | Alaska | NV | Nevada |
| AR | Arkansas | NH | New Hampshire |
| AZ | Arizona | NJ | New Jersey |
| CA | California | NM | New Mexico |
| CO | Colorado | NY | New York |
| CT | Connecticut | ND | North Dakota |
| DE | Delaware | OH | Ohio |
| FL | Florida | OK | Oklahoma |
| GA | Georgia | OR | Oregon |
| HI | Hawaii | PA | Pennsylvania |
| ID | Idaho | RI | Rhode Island |
| IL | Illinois | SC | South Carolina |
| IA | Iowa | SD | South Dakota |
| KS | Kansas | TN | Tennessee |
| KY | Kentucky | TX | Texas |
| LA | Louisiana | UT | Utah |
| ME | Maine | VT | Vermont |
| MD | Maryland | VA | Virginia |
| MA | Massachusetts | WA | Washington |
| MI | Michigan | WV | West Virginia |
| MN | Minnesota | WI | Wisconsin |
| MS | Mississippi | WY | Wyoming |
Table B-12. How Performance was Reported in States for the General
Assessments, 2014-2015
(Note: There is an asterisk after the state name if the state did not
report data by grade and test.1)
| State | Performance Data Reported for General Assessments | |||||||
|---|---|---|---|---|---|---|---|---|
| Percent Proficient | Percent Proficient Derived | Percent Not Proficient | Number Proficient | Number Not Proficient |
Number by Achievement Level |
Percent by Achievement Level |
Other (e.g., Percentile) | |
| Regular States | ||||||||
| Alabama | - | X | - | - | - | - | X | - |
| Alaska | X | - | X | X | X | X | X | - |
| Arizona | X | - | - | - | - | - | X | - |
| Arkansas | X | - | - | - | - | - | X | - |
| California | - | X | - | - | - | - | X | - |
| Colorado | X | - | - | X | - | X | X | X |
| Connecticut | X | - | - | X | - | X | X | X |
| Delaware | X | - | X | - | - | - | X | X |
| Florida | - | X | - | - | - | - | - | X |
| Georgia | - | X | - | - | - | - | X | - |
| Hawaii | X* | - | X | X | - | - | X* | - |
| Idaho | X | - | - | - | - | - | X* | - |
| Illinois | X | - | - | - | - | - | X | - |
| Indiana | X | - | X | X | X | - | - | X |
| Iowa | X | - | - | - | - | - | X* | - |
| Kansas | - | X | - | - | - | X | X | - |
| Kentucky | X | - | - | - | - | - | - | - |
| Louisiana | - | - | - | - | - | - | - | - |
| Maine | X* | - | - | X | - | - | X* | - |
| Maryland | X* | - | - | X* | - | - | - | - |
| Massachusetts | X | - | - | - | - | - | X | - |
| Michigan | X | - | - | - | - | - | X | X |
| Minnesota | X | - | - | X | - | X | X | - |
| Mississippi | - | - | - | - | - | - | - | - |
| Missouri | - | X | - | - | - | X* | X* | X |
| Montana | - | - | - | - | - | - | - | - |
| Nebraska | X | - | X | - | - | - | X | X |
| Nevada | X | - | - | - | - | - | X | X |
| New Hampshire | X | - | X | X | X | X | X | X |
| New Jersey | X | - | - | - | - | X | X | X |
| New Mexico | X* | - | - | - | - | - | - | - |
| New York | X | - | - | - | - | X | X | X |
| North Carolina | X | - | - | X* | - | - | X | X |
| North Dakota | X* | - | X* | - | - | - | X | - |
| Ohio | X | - | - | - | - | X | X | - |
| Oklahoma | - | - | - | - | - | - | - | - |
| Oregon | X | - | - | X | - | - | - | - |
| Pennsylvania | - | - | - | - | - | - | - | - |
| Rhode Island | X | - | - | - | - | - | X | X |
| South Carolina | X | - | - | - | - | - | X | X |
| South Dakota | - | X* | - | - | - | - | X* | - |
| Tennessee | X* | - | - | - | - | - | X | - |
| Texas | X | - | X | X | X | X | X | X |
| Utah | - | - | - | - | - | - | - | - |
| Vermont | - | X | - | - | - | - | X | X |
| Virginia | X | - | X | - | - | X | X | X |
| Washington | X | - | X | X | X | X | X | - |
| West Virginia | X* | - | - | - | - | - | - | - |
| Wisconsin | - | X | - | - | - | X | X | X |
| Wyoming | X | - | - | - | - | - | X | - |
| Total Regular States (N=50) | 35 | 9 | 10 | 13 | 5 | 14 | 37 | 19 |
| Unique States | ||||||||
| American Samoa | - | - | - | - | - | - | - | - |
| Bureau of Indian Education | - | - | - | - | - | - | - | - |
|
Commonwealth of Northern Marianna Islands |
- | - | - | - | - | - | - | - |
| U.S. Department of Defense Education Activity | - | - | - | - | - | - | - | - |
| District of Columbia | X* | - | - | X* | - | X* | X* | - |
| Federated States of Micronesia | - | - | - | - | - | - | - | - |
| Guam | X | - | - | - | - | - | X | - |
| Palau | - | - | - | - | - | - | - | - |
| Puerto Rico | - | - | - | - | - | - | - | - |
| Republic of Marshall Islands | - | - | - | - | - | - | - | - |
| U.S. Virgin Islands | - | - | - | - | - | - | - | - |
| Total Unique States (N=11) | 2 | 0 | 0 | 1 | 0 | 1 | 2 | 0 |
|
Total All Regular and Unique States (N=61) checked in tab import for figs and all matched |
37 | 9 | 10 | 14 | 5 | 15 | 39 | 19 |
1 Other methods (besides by grade and test) = merging grades and merging tests, by grade and merging tests, by test and merging grades
Table B-13. How Performance was Reported in States for the Alternate
Assessments Based on Alternate Achievement Standards Used
for Title I Accountability, 2014-2015
(Note: There is an asterisk after the state name if the state did not
report data by grade and test.1)
| State | Performance Data Reported for AA-AAS | ||||||
|---|---|---|---|---|---|---|---|
| Percent Proficient |
Percent Proficient Derived |
Percent Not Proficient | Number Proficient | Number Not Proficient |
Number by Achievement Level |
Percent by Achievement Level |
|
| Regular States | |||||||
| Alabama | - | X | - | - | - | - | X |
| Alaska | X | - | X | X | X | - | - |
| Arizona | X | - | - | - | - | - | X |
| Arkansas | - | - | - | - | - | - | - |
| California | - | X | - | - | - | - | X |
| Colorado | X | - | - | X | - | X | X |
| Connecticut | X | - | - | - | - | - | X |
| Delaware | X | - | X | - | - | - | X |
| Florida | X | - | - | X | - | X | X |
| Georgia | - | X | - | - | - | - | X |
| Hawaii | X* | - | X | - | - | - | X* |
| Idaho | X | - | - | - | - | - | - |
| Illinois | X | - | - | - | - | - | X |
| Indiana | - | - | - | - | - | - | - |
| Iowa | X | - | - | - | - | - | X* |
| Kansas | - | X | - | - | - | X | X |
| Kentucky | X | - | - | - | - | - | - |
| Louisiana | - | - | - | - | - | - | - |
| Maine | X | - | - | X | - | - | X |
| Maryland | X | - | - | X* | - | - | - |
| Massachusetts | - | X | - | - | - | X | X |
| Michigan | X | - | - | - | - | - | X |
| Minnesota | X | - | - | X | - | X | X |
| Mississippi | - | - | - | - | - | - | - |
| Missouri | - | X | - | - | - | X* | X* |
| Montana | - | - | - | - | - | - | - |
| Nebraska | X | - | X | - | - | - | X |
| Nevada | X | - | - | - | - | - | X |
| New Hampshire | X | - | X | X | X | X | X |
| New Jersey | - | X | - | - | - | - | X |
| New Mexico | X* | - | - | - | - | - | - |
| New York | X* | - | - | - | - | - | - |
| North Carolina | X | - | - | X* | - | - | X |
| North Dakota | X* | - | X* | - | - | - | X* |
| Ohio | X | - | - | - | - | X | X |
| Oklahoma | - | - | - | - | - | - | - |
| Oregon | X | - | - | X | - | - | - |
| Pennsylvania | X | - | - | - | - | - | X |
| Rhode Island | - | - | - | - | - | X | X |
| South Carolina | X* | - | - | - | - | - | X |
| South Dakota | - | X* | - | - | - | - | X* |
| Tennessee | - | - | - | - | - | - | - |
| Texas | X | - | X | X | X | X | X |
| Utah | X | - | - | X | - | - | - |
| Vermont | - | - | - | - | - | - | - |
| Virginia | X | - | X | - | - | X | X |
| Washington | X | - | X | X | X | X | X |
| West Virginia | X* | - | - | - | - | - | - |
| Wisconsin | - | X | - | - | - | X | X |
| Wyoming | X | - | - | - | - | - | X |
| Total Regular States (N=50) | 32 | 9 | 9 | 12 | 4 | 13 | 33 |
| Unique States | |||||||
| American Samoa | - | - | - | - | - | - | - |
| Bureau of Indian Education | - | - | - | - | - | - | - |
|
Commonwealth of Northern Marianna Islands |
- | - | - | - | - | - | - |
|
U.S. Department of Defense Education Activity |
- | - | - | - | - | - | - |
| District of Columbia | X* | - | - | X* | - | X* | X* |
| Federated States of Micronesia | - | - | - | - | - | - | - |
| Guam | - | - | - | - | - | X | - |
| Palau | - | - | - | - | - | - | - |
| Puerto Rico | - | - | - | - | - | - | - |
| Republic of Marshall Islands | - | - | - | - | - | - | - |
| U.S. Virgin Islands | - | - | - | - | - | - | - |
| Total Unique States (N=11) | 1 | 0 | 0 | 1 | 0 | 2 | 1 |
|
Total All Regular and Unique States (N=61) |
33 | 9 | 9 | 13 | 4 | 15 | 34 |
1 Other methods (besides by grade and test) = merging grades and merging tests, by grade and merging tests, by test and merging grades.
Table B-14. Accommodations Data Reported for Students with Disabilities on General Assessments 2014-2015
| Regular States |
Reported Participation |
Reported Performance |
Total States with Part. or Perf. |
Part.
and Perf. Reported |
Part.
Only Reported |
Perf.
Only Reported |
No Publicly Reported Data Found |
|---|---|---|---|---|---|---|---|
| Alabama | No | No | |
|
|
|
X |
| Alaska | Yes | Yes | X | X | |
|
|
| Arkansas | Yes | No | X | |
X | |
|
| Arizona | No | No | |
|
|
|
X |
| California | Yes | No | X | |
X | |
|
| Colorado | Yes | Yes | X | X | |
|
|
| Connecticut | No | No | |
|
|
|
X |
| Delaware | No | No | |
|
|
|
X |
| Florida | Yes | Yes | X | X | |
|
|
| Georgia | No | No | |
|
|
|
X |
| Hawaii | No | No | |
|
|
|
X |
| Iowa | Yes | Yes | X | X | |
|
|
| Idaho | No | No | |
|
|
|
X |
| Illinois | No | No | |
|
|
|
X |
| Indiana | Yes | Yes | X | X | |
|
|
| Kansas | No | Yes | X | |
|
X | |
| Kentucky | Yes | Yes | X | X | |
|
|
| Louisiana | No | No | |
|
|
|
X |
| Massachusetts | Yes | No | X | |
X | |
|
| Maryland | Yes | No | X | |
X | |
|
| Maine | No | No | |
|
|
|
X |
| Michigan | No | No | |
|
|
|
X |
| Minnesota | No | No | |
|
|
|
X |
| Missouri | No | No | |
|
|
|
X |
| Mississippi | No | No | |
|
|
|
X |
| Montana | No | No | |
|
|
|
X |
| Nebraska | No | No | |
|
|
|
X |
| Nevada | Yes | Yes | X | X | |
|
|
| New Hampshire | Yes | No | X | |
X | |
|
| New Jersey | No | No | |
|
|
|
X |
| New Mexico | No | No | |
|
|
|
X |
| New York | No | No | |
|
|
|
X |
| North Carolina | Yes | Yes | X | X | |
|
|
| North Dakota | Yes | No | X | |
X | |
|
| Ohio | Yes | Yes | X | X | |
|
|
| Oklahoma | No | No | |
|
|
|
X |
| Oregon | No | No | |
|
|
|
X |
| Pennsylvania | Yes | No | X | |
X | |
|
| Rhode Island | No | No | |
|
|
|
X |
| South Carolina | No | No | |
|
|
|
X |
| South Dakota | No | No | |
|
|
|
X |
| Tennessee | No | No | |
|
|
|
X |
| Texas | Yes | Yes | X | X | |
|
|
| Utah | No | No | |
|
|
|
X |
| Vermont | No | No | |
|
|
|
X |
| Virginia | No | No | |
|
|
|
X |
| Washington | Yes | Yes | X | X | |
|
|
| Wisconsin | No | No | |
|
|
|
X |
| West Virginia | No | No | |
|
|
|
X |
| Wyoming | No | No | |
|
|
|
X |
| Unique States | |
|
|
|
|
|
|
| American Samoa | No | No | |
|
|
|
X |
|
Bureau of Indian Affairs |
No | No | |
|
|
|
X |
|
Commonwealth of Northern Mariana Islands |
No | No | |
|
|
|
X |
| District of Columbia | No | No | |
|
|
|
X |
|
Federated States of Micronesia |
No | No | |
|
|
|
X |
| Guam | Yes | Yes | X | X | |
|
|
| Palau | No | No | |
|
|
|
X |
| Puerto Rico | No | No | |
|
|
|
X |
|
Republic of Marshall Islands |
No | No | |
|
|
|
X |
|
U.S. Department of Defense Education Activity |
No | No | |
|
|
|
X |
| U.S. Virgin Islands | No | No | |
|
|
|
X |
| Total States | 19 | 13 | 20 | 12 | 7 | 1 | 41 |