Christopher M. Rogers, Sheryl S. Lazarus, and Martha L. Thurlow
May 2016
All rights reserved. Any or all portions of this document may be reproduced and distributed without prior permission, provided the source is cited as:
Rogers, C. M., Lazarus, S. S., & Thurlow, M. L. (2016). A summary of the research on the effects of test accommodations: 2013-2014 (NCEO Report 402). Minneapolis, MN: University of Minnesota, National Center on Educational Outcomes.
The use of accommodations in instruction and assessments continues to be of great importance for students with disabilities. This importance is reflected in an emphasis on research to investigate the effects of accommodations. Key issues under investigation include how accommodations affect test scores, how educators and students perceive accommodations, and how accommodations are selected and implemented.
The purpose of this report is to provide an update on the state of the research on testing accommodations as well as to identify promising future areas of research. Previous reports by the National Center on Educational Outcomes (NCEO) have covered research published since 1999. We summarize the research to review current research trends and enhance understanding of the implications of accommodations use in the development of future policy directions, implementation of current and new accommodations, and valid and reliable interpretations when accommodations are used in testing situations. In 2013 and 2014, 53 published research studies on the topic of testing accommodations were found. Among the main points of the 2013-14 research are:
Purpose: More than 40 percent of the research was to evaluate the comparability of test scores when assessments were administered with and without accommodations. The next most common purpose was to report on perceptions and preferences about accommodations use. The majority of studies addressed multiple purposes.
Research design: About 72% of the studies reported primary data collection on the part of the researchers, rather than drawing on existing (extant) data sets. Over two-fifths of the studies involved quasi-experimental designs. Researchers also drew on a variety of other quantitative and qualitative methodologies, including survey methodologies and meta-analyses.
Types of assessments, content areas: A wide variety of instrument types were used in these studies. About half of the studies used non-academic protocols or surveys developed by the study authors. Other studies used academic content items drawn from specified sources outside of the researchers' work, including state criterion-referenced test data, norm-referenced measures, or multiple types of data. Mathematics and reading were the most common content areas included in the 2013-2014 research. Other content areas included science and writing. About 17 percent of all studies addressed more than one content area in the assessments used.
Participants: Participants were most frequently students, spanning a range of grade levels from K-12 to postsecondary students, although several studies included educators as participants. Studies varied in the number of participants; some studies included fewer than 10 participants, whereas other studies involved hundreds of thousands of participants.
Disability categories: Learning disabilities was the most common disability category exhibited by participants in the research, accounting for over half of the studies. Attention problems, emotional behavioral disability, and autism were the next most commonly studied. Low-incidence disabilities were included in more than one-third of the studies.
Accommodations: Presentation accommodations were the most frequently studied category, with oral delivery (read-aloud) accommodations being the most studied within this category (and across categories). Another commonly studied accommodation was extended time.
Findings: Empirical studies investigating performance effects of the extended time accommodation showed a positive impact on assessment scores for students with disabilities. There were not conclusive findings for the oral delivery accommodation; two studies found a differential boost for students with disabilities when compared to students without, three found performance improvements for both students with and without disabilities, and one found no significant benefits. The two studies that addressed calculators both showed positive, although nuanced, support for students with disabilities' performance. The two studies that addressed setting accommodations did not find significant evidence that there was a benefit of separate, low-distraction settings for students with disabilities. Two-thirds of the studies that looked at student perceptions found that most or all participants viewed accommodations as helping them perform better on assessments. About half of the studies of educators' perceptions of test enhancements (accommodations and modifications) found that educators believed that they were beneficial to student test-takers' performance and to students' emotional state and self-esteem.
Limitations: Several limitations of the studies were identified. The most frequently listed limitation was related to small sample size, and other sampling issues. The next most frequently mentioned limitation was methodological limitations and issues related to the lack of authenticity of the testing circumstances.
Directions for future research: A number of promising suggestions were noted, particularly the need for more rigorous studies that used stronger sampling methods. Many studies also noted a need for future studies that had an improved interface between accommodations and naturalistic testing conditions (test/test context).
All students, including students with disabilities, are required by the Individuals with Disabilities Education Act (IDEA) of 2004 and Title I of the 2015 reauthorization of the Elementary and Secondary Education Act (ESEA) to participate in assessments used for accountability. Some students need accommodations to meaningfully access assessments. States and assessment consortia look to accommodations research when making policy decisions about accommodations.
To synthesize accommodations research efforts completed across the years, the National Center on Educational Outcomes (NCEO) has published a series of reports on accommodations research. The time periods included 1999-2001 (Thompson, Blount, & Thurlow, 2002), 2002-2004 (Johnstone, Altman, Thurlow, & Thompson, 2006), 2005-2006 (Zenisky & Sireci, 2007), 2007-2008 (Cormier, Altman, Shyyan, & Thurlow, 2010), 2009-2010 (Rogers, Christian, & Thurlow, 2012), and 2011-2012 (Rogers, Lazarus, & Thurlow, 2014). This report covers the time period 2013-2014.
The purpose of this report is to present a synthesis of the research on test accommodations published in 2013 and 2014. The literature described here encompasses empirical studies of score comparability and validity studies as well as investigations into accommodations use, implementation practices, and perceptions of their effectiveness. As a whole, the current research body offers a broad view and a deep examination of issues pertaining to assessment accommodations. Reporting the findings of current research studies was a primary goal of this analysis; a secondary goal was to identify areas requiring continued investigation in the future.
Similar to the process used in past accommodations research syntheses (Cormier et al., 2010; Johnstone et al., 2006; Rogers et al., 2012; Rogers et al., 2014; Thompson et al., 2002; Zenisky & Sireci, 2007), a number of sources were accessed to complete the review of the accommodations research published in 2013 and 2014. Specifically, five research databases were consulted: Educational Resources Information Center (ERIC), PsycINFO, Academic Search Premier, Digital Dissertations, and Educational Abstracts. To help confirm the thoroughness of our searches, we used the search engine Google Scholar to search for additional research. In addition, a hand-search of 47 journals was completed, in efforts to ensure that no qualifying study was missed. A list of hand-searched journals is available on the NCEO website (https://nceo.info/Resources/bibliographies/accommodations/bibliography).
Online archives of several organizations also were searched for relevant publications. These organizations included Behavioral Research and Teaching (BRT) at the University of Oregon (http://brt.uoregon.edu), the College Board Research Library http://research.collegeboard.org), the National Center for Research on Evaluation, Standards, and Student Testing (CRESST; http://www.cse.ucla.edu), and the Wisconsin Center for Educational Research (WCER; http://testacc.wceruw.org/).
The initial search was completed in December, 2014. A second search was completed in May, 2015, to ensure that all articles published in 2013 and 2014 were found and included in this review. Within each of these research databases and publications archives, we used a sequence of search terms. Terms searched for this review were:
Many of these search terms were used as delimiters when searches yielded large pools of documents found to be irrelevant to the searches.
The research documents from these searches were then considered for inclusion in this review using several criteria. First, this analysis included only research published or defended (in doctoral dissertations) in 2013 and 2014. Second, the scope of the research was limited to investigations of accommodations for regular assessment; hence, articles specific to alternate assessments, accommodations for instruction or learning, and universal design in general were not part of this review. Third, research involving English learners (ELs) was included only if the target population was ELs with disabilities. Fourth, presentations from professional conferences were not searched or included in this review, based on the researchers' criteria to include only research that would be accessible to readers and that had gone through the level of peer review typically required for publication in professional journals or through a doctoral committee review. (This criterion was implemented for the first time during the 2007-2008 review.) Finally, to be included in the online bibliography and summarized in this report, studies needed to involve: (a) experimental manipulation of an accommodation, (b) investigation of the comparability of test scores across accommodated and non-accommodated conditions, or (c) examination of survey results or interview data sets about students' or teachers' knowledge or perceptions of accommodations.
To reflect the wide range of accommodations research that was conducted in 2013 and 2014, the studies are summarized and compared in the following ways: (a) publication type, (b) purposes of research, (c) research type and data collection source, (d) assessment or data collection focus, (e) characteristics of the independent and dependent variables under study, (f) comparability of findings between studies in similar domains, and (g) limitations and directions of future research.
Top of Page | Table of Contents
A total of 53 studies was published between January 2013 and December 2014. As shown in Figure 1, of the 53 studies, 37 were journal articles, 14 were dissertations, and 2 were published professional reports released by research organizations or entities (e.g., ETS).
Figure 1. Percentage of Accommodations Studies by Publication Type
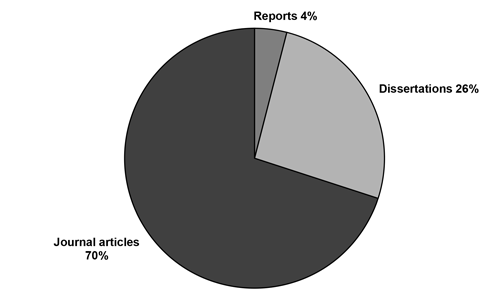
The total number of studies published on accommodations in 2013-2014 (N=53) increased slightly from accommodations research published in 2011-2012 (n=49). The number of journal articles was nearly the same (n=37 in 2013-2014; n=39 in 2011-2012), but the number of dissertations published on accommodations doubled (n=14 in 2013-2014; n=7 in 2011-2012). The report on accommodations research in 2011-2012 (Rogers et al., 2014) included 39 articles from 23 journals; the 37 articles described in the current report were published in 27 journals. (Appendix B, Table B-1, presents individual study information about publication type.)
A number of purposes were identified in the accommodations research published in 2013 and 2014. Table 1 shows the primary focus of each of these 53 studies. Eight studies each listed a single purpose (see Appendix A, Table A-1). The majority of studies reviewed sought to accomplish multiple purposes. In those cases, we identified the "primary purpose" based on the title of the work or the first-mentioned purpose in the text.
Table 1. Primary Purpose of Reviewed Research
| Purpose | Number of Studies | Percent of Studies |
|---|---|---|
| Compare scores | 23 | 43% |
| only students with disabilities (6 studies) | ||
| only students without disabilities (2 studies) | ||
| both students with and without disabilities (16 studies) | ||
| Study/compare perceptions and preferences about use | 12 | 23% |
| Report on implementation practices and accommodations use | 8 | 15% |
| Summarize research on test accommodations | 8 | 15% |
| Develop test | 1 | 2% |
| Investigate test validity | 1 | 2% |
| Compare test items | 0 | 0% |
| Discuss issues | 0 | 0% |
| Identify predictors of the need for test accommodations | 0 | 0% |
| Total | 53 | 100% |
The most common primary purpose for research published during 2013-2014 was to report on the effect of accommodations on test scores (43%) by comparing scores of students who received accommodations to those who did not (see Appendix A). The next most common primary purpose was studying perceptions of accommodations, including preferences between or among a small number of accommodations (23%). The third most common purposes were reporting on implementation practices and accommodations use (15%), and also summarizing research on test accommodations (15%).
Reviews of research on accommodations included explorations of the research: (a) on a specific accommodation's effect for assessment participants (Nees & Berry, 2013), (b) on various accommodations for students with a single disability category (Cawthon & Leppo, 2013), and (c) about a specific accommodation for students with a single disability category (Lewandowski, Cohen, & Lovett, 2013). A specific type of literature review--meta-analysis--as a primary purpose, was exemplified by Li (2014). In this analysis, test development and investigating test validity each were represented by a single study. Test development was investigated by Ketterlin-Geller, Crawford, and Huscroft-D'Angelo (2014) and test validity was examined in Cawthon, Leppo, Carr, and Kopriva (2013).
Table 2 shows the multiple purposes of many studies. Several studies with more than one purpose had two purposes--for example, some studies (Abedi & Ewers, 2013; Cawthon & Leppo, 2013; Li, 2014; Lovett, 2014; Lovett & Leja, 2013; Nees & Berry, 2013) both reviewed the literature and discussed pressing accommodations issues. Other studies (Berger & Lewandowski, 2013; Higgins & Katz, 2013; Meyer & Bouck, 2014) included analyses of score comparisons between students with disabilities and students without disabilities when using accommodations, while also analyzing students' perceptions based on responses from surveys or interviews.
Table 2. All Purposes of Reviewed Research
| Purpose | Number of Studies | Percent of Studies |
|---|---|---|
| Compare scores | 25 | 46% |
| only students with disabilities (11% of studies) | ||
| only students without disabilities (4% of studies) | ||
| both students with and without disabilities (31% of studies) | ||
| Summarize research on test accommodations | 22 | 44% |
| Study/compare perceptions and preferences about use | 22 | 44% |
| Discuss issues | 17 | 32% |
| Report on implementation practices and accommodations use | 14 | 26% |
| Investigate test validity | 8 | 15% |
| Compare test items | 2 | 4% |
| Identify predictors of the need for test accommodations | 1 | 2% |
| Develop test | 1 | 2% |
The total of these percentages is >100% due to the multiple purposes identified in most (45) of the studies; 34 studies had 2 identified purposes, 9 studies had 3 identified purposes, and 2 studies had 4 identified purposes.
When all purposes (i.e., primary, secondary) are included, the most common single purpose of the 2013-2014 studies was demonstrating the effect of accommodations on test scores (46% of studies). Study approaches compared test scores of students with disabilities and students without disabilities when using accommodations, or compared test scores of students with disabilities when using and not using accommodations, or compared test scores of students without disabilities when using and not using accommodations. Of these three approaches to studying the effects of accommodations on performance, comparing scores of students with disabilities and students without disabilities was the most frequent--fully two-thirds (n=17) of the relevant 25 studies (see Appendix A, Table A-1). The second most frequent research purpose was summarizing research on test accommodations, typically reviewing research on the effects of accommodations in various assessment contexts. The frequency of this purpose is due to the number of dissertations; every dissertation had a substantive literature review. The third most common purpose was studying perceptions of accommodations.
Another purpose we identified in almost one-third of the studies was discussing issues. Although not reported as a primary purpose for any of the studies, discussing issues was often noted as a second purpose. For example, Freeman (2013) discussed issues of transitioning some students with disabilities from taking the alternate assessment based on modified achievement standards (AA-MAS) to taking the state's general assessment. The purpose of reporting on implementation practices or accommodations use was part of over one-fourth of the studies. For instance, Barnhill (2014) reported on postsecondary faculty members' current accommodations practices with students with Asperger Syndrome, and Schreuer and Sachs (2014) reported on accommodations commonly used by postsecondary students with disabilities in general.
The purpose of investigating test validity when students used accommodations was explored in some studies (n=8). Typically, studies having this purpose sought to analyze whether use of accommodations fundamentally changed the construct being assessed. For example, Lin and Lin (2013) examined the construct validity of a mathematics assessment when selected setting accommodations were used, while Stone, Cook, and Laitusis (2013) examined the construct validity of oral delivery of an assessment of reading comprehension.
This analysis of accommodations research found that some of the least common purposes were comparing test items, predicting accommodations need, and developing tests. Huggins and Elbaum (2013) performed a score equity assessment, analyzing item-level responses for equating invariance. The purposes of identifying predictors of the need for test accommodations, and developing a test, were both exemplified by Ketterlin-Geller, Crawford, and Huscroft-D'Angelo (2014), who developed an accommodations assignment screening test and analyzed factors disrupting accurate mathematics performance scores and indicating students' needs for specific accommodations.
Over 40% of the 2013-2014 accommodations research used a quasi-experimental research design. As displayed in Table 3, the researchers themselves gathered the data (i.e., primary source data) in over three times as many quasi-experimental studies (n=17) compared to studies with secondary data sources using extant or archival data (n=5). The number of quasi-experimental research studies decreased in 2014 compared to 2013. Likewise, descriptive quantitative analyses and descriptive qualitative analyses also decreased from 2013 to 2014, consistent with an overall decrease in studies from 2013 (n=30) to 2014 (n=23). In 2013 and 2014 researchers also conducted few studies using correlational, experimental, and meta-analytic designs. No studies used longitudinal designs. The relative frequency of the selected research designs is consistent with previous biennial periods examined in past reports, though in the past a few studies typically had longitudinal designs.
We also observed a similarity in data collection sources between the current reporting period and the previous reporting period. In 2013-2014, primary data were used in 38 studies (72%) and secondary data were used in 15 studies (28%). This difference between data sources is even larger than the previous report (Rogers et al., 2014) in which about twice as many studies used primary data in comparison to secondary data sources. (Appendix B, Table B-1, presents research designs and data collection sources for individual studies.)
Table 3. Research Design and Data Collection Source by Year
| Research Design | Data Collection Source | Total Sources | |||
|---|---|---|---|---|---|
| Primary | Secondary | ||||
| 2013 | 2014 | 2013 | 2014 | ||
| Quasi-experimental | 10 | 7 | 3 | 2 | 22 |
| Descriptive quantitative | 7 | 5 | 1 | 1 | 14 |
| Descriptive qualitative | 5 | 3 | 4 | 1 | 13 |
| Correlation/prediction | 0 | 0 | 0 | 1 | 1 |
| Experimental | 0 | 1 | 0 | 0 | 1 |
| Longitudinal | 0 | 0 | 0 | 0 | 0 |
| Meta-analysis | 0 | 0 | 0 | 2 | 2 |
| Year Totals | 22 | 16 | 8 | 7 | 53 |
| Source Totals Across Years | 38 | 15 | 53 | ||
The research included in this analysis used the methods shown in Figure 2 to collect study data. Nearly half of the research (n=24, 46%) used performance data acquired through academic content testing. In some of the cases, tests were administered as part of the study; in other cases, extant data sources were used. Surveys were also another common data source, while interviews, observations, and focus groups were less commonly used methods of collecting data. Another less frequently used method was "articles." This term refers to eight studies that reviewed research literature, including two studies that employed formal meta-analysis techniques. Only one study (Schreuer & Sachs, 2014) collected other data (i.e., student course grades) as one of its measures. About one-third of the studies reported using more than one method or tool to gather data. (See Appendix B, Table B-1, for additional details about each study's data collection methods.)
Figure 2. Data Collection Methods Used in 2013-2014 Research
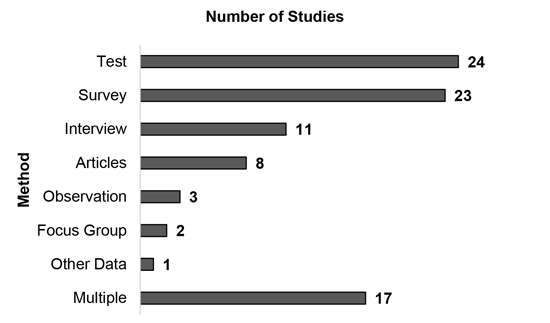
Note. Of the 53 studies reviewed for this report, 15 reported using two data collection methods, and 2 reported using three data collection methods.
Nearly all of the 2013-2014 studies used some type of data collection instrument; only five studies did not employ any instruments (e.g., literature reviews). Table 4 shows the types of data collection instruments used. Surveys presented items of an attitudinal or self-report nature. Tests were course- or classroom-based. Assessments were statewide or large-scale in scope. Protocols refer to sets of questions, usually presented in an interview or focus group format. Measures referred to norm-referenced academic or cognitive instruments. All of these instruments were placed into five categories: non-test protocols or surveys developed by study authors, surveys or academic tests developed by education professionals or drawn by researchers from other sources, norm-referenced academic achievement measures, norm-referenced cognitive ability measures, and state criterion-referenced academic assessments. Non-test protocols developed by the author or authors of the studies--the most commonly-used instrument (in 49% of studies)--included performance tasks, questionnaires or surveys, and interview and focus-group protocols, among others. Surveys or academic tests developed by education professionals or researchers used sources outside of current studies, and were exemplified by perception surveys such as the State Self-Esteem Scale (SSES; Heatherton & Polivy, 1991, as in Wadley & Liljequist, 2013), or by English language arts test items based on the reading framework for the 2009 National Assessment of Educational Progress (National Assessment Governing Board, 2008, as cited in Stone et al., 2013).
State criterion-referenced assessments included those of Georgia, Missouri, North Carolina, Rhode Island, South Carolina, and Ontario, Canada, and released items from state assessments in Arizona, Massachusetts, Ohio, and Virginia, as well as assessments from states that remained unidentified in the research. Fifteen norm-referenced academic achievement measures were used in one or more studies, including the Graduate Record Examination (GRE), the Nelson-Denny Reading Test (NDRT), and the Wechsler Individual Achievement Test-Second Edition (WIAT-II). Norm-referenced cognitive ability measures were used in three studies, and included the Woodcock-Johnson Tests of Cognitive Abilities III (WJIII), among others. A substantial minority--19 studies in all--used instrumentation of more than one kind. We present a complete listing of the instruments used in each of the studies in Table C-1 in Appendix C, including the related studies that served as sources for these instruments, when available.
Table 4. Data Collection Instrument Types
| Instrument Type | Number of Studies | Percent of Studies |
|---|---|---|
| Non-academic protocols or surveys developed by study author/s | 26 | 49% |
| Surveys or academic tests developed by professionals or researchers using sources outside of current study | 13 | 25% |
| Norm-referenced academic achievement measures | 15 | 28% |
| State criterion-referenced assessments | 15 | 28% |
| Norm-referenced cognitive ability measures | 3 | 6% |
| Othera | 2 | 4% |
| Noneb | 5 | 9% |
| Multiple (types) | 19 | 36% |
a Other: 1 study used the Learning Achievement Test in geometry, developed by study researchers based on instructional content (Lee & Chen, 2014), 1 study used an extant data set of interview responses (Newman & Madaus, 2014).
b None: 5 studies were literature reviews of studies employing various data collection approaches and/or instruments (Abedi & Ewers, 2013; Barnhill, 2014; Lovett, 2014; Lovett & Leja, 2013; Nees & Berry, 2013).
A number of studies published during 2013-2014 focused on accommodations used in specific academic content areas. As shown in Table 5, math and reading were the two most commonly studied content areas. Table 5 also provides a comparison to content area frequency found in NCEO's previous analyses of accommodations research (Rogers et al., 2012, 2014). Across the years, reading and mathematics have been the most common content areas for this research; however, the number and the proportion of studies addressing math and reading assessments, and nearly all other content assessments (except science), have decreased. This decrease is related to a general decrease in the number of studies that used assessment data in 2013-2014. There has been little change across years in the percentage of studies addressing science. The number of studies on writing, social studies, and psychology has remained fairly consistent since 2005. There have been no accommodations research studies in the areas of Civics/U.S. History since 2005-2006, so we did not include this content area in the current report. All studies with assessment data published in 2013-2014 reported their associated content areas. This marks a change from the previous report, in which two studies did not specify the content areas of the assessments and their accommodations. (See Appendix C, Table C-2, for additional details about the content areas.)
Table 5. Academic Content Area Assessed Across Three Reports
| Content Area Assessed | 2009-2010a | 2011-2012b | 2013-2014c |
|---|---|---|---|
| Mathematics | 20 (42%) | 22 (45%) | 14 (26%) |
| Reading | 16 (33%) | 19 (39%) | 16 (30%) |
| Writing | 3 (6%) | 5 (10%) | 2 (4%) |
| Other language artsd | 4 (8%) | 2 (4%) | 3 (6%) |
| Science | 7 (15%) | 4 (8%) | 5 (9%) |
| Social studies | 2 (4%) | 1 (2%) | 0 (0%) |
| Psychology | 1 (2%) | 0 (0%) | 0 (0%) |
| Not specific | 0 (0%) | 2 (4%) | 0 (0%) |
| Multiple content | 13 (27%) | 16 (33%) | 9 (17%) |
a Studies in 2009-2010 included examinations of more than one content area ranged in number of areas assessed from 2 to 5.
b Studies in 2011-2012 included examinations of more than one content area ranged in number of areas assessed from 2 to 4.
c Studies in 2013-2014 included examinations of more than one content area ranged in number of areas assessed from 2 to 3.
d Detailed descriptions of what constituted "Other Language Arts" for each of the three states from 2013-2014 can be found in Appendix C, Table C-2.
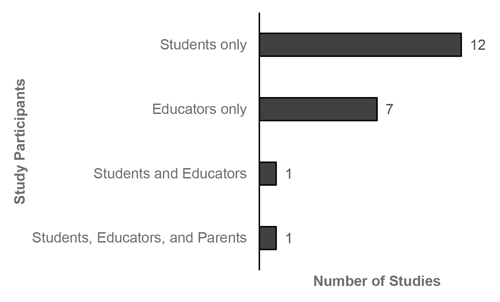
The studies in this analysis of accommodations research included participants in several roles (see Figure 3 and Appendix D, Table D-1). In 2013-2014, a majority of the studies included only students--35 of the 53 studies (66%). The next largest participant group studied (19% of studies) was "educators only." This refers to studies that described or analyzed the educator perspective on accommodations. Both educators and students were included in three studies. The other participant category in 2013-2014 was educators, parents, and students. Only one study (Torres, 2014) was in this group. Five studies did not draw data from research participants.
Table 6 details the composition and size of the participant groups in the research studies published during 2013 and 2014. This information is displayed in more detail by study in Appendix D, Table D-1. The size of the participant groups varied from 3 (Meyer & Bouck, 2014) to 191,906 (Huggins & Elbaum, 2013). The number of participants was fairly evenly spread across the continuum of percentages represented by those numbers, according to data reported in Appendix Table D-1. In addition, the number of studies in which there were more participants without disabilities (n=29) was higher than the number of studies in which there were more students with disabilities (n=20). When the studies with only educator participants (n=10) were taken into account, the composition of the participant groups was fairly even across studies with more students with disabilities and those with more students without disabilities.
Figure 3. Types of Research Participants (n=48)
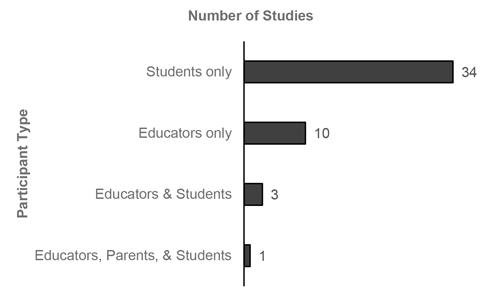
Table 6. Participant Sample Sizes and Ratio of Individuals with Disabilities
| Number of Research Participants by Study | Number of Studies by Proportion of Sample Comprising Individuals with Disabilities | |||||
|---|---|---|---|---|---|---|
| 0-24% | 25-49% | 50-74% | 75-100% | Unavailable | Total | |
| 1-9 | 1 | 0 | 0 | 4 | 0 | 5 |
| 10-24 | 1 | 0 | 1 | 3 | 0 | 5 |
| 25-49 | 1 | 0 | 0 | 2 | 0 | 3 |
| 50-99 | 1 | 2 | 1 | 0 | 0 | 4 |
| 100-149 | 3 | 3 | 0 | 2 | 0 | 8 |
| 150-199 | 0 | 0 | 0 | 2 | 0 | 2 |
| 200-299 | 3 | 0 | 1 | 1 | 0 | 5 |
| 300-499 | 3 | 0 | 0 | 0 | 0 | 3 |
| 500-999 | 2 | 1 | 0 | 1 | 0 | 4 |
| 1000 or more | 6 | 2 | 0 | 2 | 0 | 10 |
| Unavailable | 0 | 0 | 0 | 0 | 0 | 0 |
| Total | 21 | 8 | 3 | 17 | 0 | 49 |
Similar to the previous report on accommodations research (Rogers et al., 2014), research during 2013-2014 involved kindergarten through postsecondary participants (see Table 7). See Appendix D for more detail. Postsecondary refers to both university students and other participants in postsecondary settings. For example, Young (2013) investigated the accommodations knowledge and practices of academic advisors in the college environment. The largest number of studies published in 2013 and 2014 focused on elementary students (n=16; 30%), followed by postsecondary students (n=14; 26%) and middle school students (n=12; 23%). The lowest proportion of studies was at the high school level (11% of studies; n=6). Only 8 studies included students in more than one grade-level cluster.
Table 7. School Level of Research Participants
| Education Level of Participants in Studies | Number of Studies | Percent of Studies |
|---|---|---|
| Elementary school (K-5) | 16 | 30% |
| Middle school (6-8) | 12 | 23% |
| High school (9-12) | 6 | 15% |
| Postsecondary | 14 | 26% |
| Multiple grade-level clusters | 8 | 15% |
| No age | 10 | 19% |
| Not applicable | 5 | 9% |
The accommodations research in 2013-2014 addressed a broad range of disability categories (see Appendix D for details). As shown in Table 8, only five studies did not specify disability categories of student participants and 10 studies did not include students in the sample. Of the remaining 37 studies, the most commonly studied student disability category was learning disabilities (n=31); five of these studies had only participants with learning disabilities, and 10 more compared students with learning disabilities to students without disabilities.
Table 8. Disabilities Reported for Research Participants
| Disabilities of Research Participants | Number of Studiesa | Percent of Studies |
|---|---|---|
| Learning disabilities | 31 | 58% |
| Attention problem | 13 | 25% |
| Emotional behavioral disability | 13 | 25% |
| Autism | 12 | 23% |
| Multiple disabilitiesb | 12 | 23% |
| Physical disabilityc | 11 | 21% |
| Deafness/Hearing impairment | 10 | 19% |
| Blindness/Visual impairment | 9 | 17% |
| Intellectual disabilities | 8 | 15% |
| Speech/Language | 7 | 13% |
| Traumatic brain injury | 1 | 2% |
| No disability | 22 | 42% |
| Not specifiedd | 5 | 9% |
| Not applicablee | 10 | 19% |
aStudies sometimes included student participant groups from more than one disability category.
bMultiple disabilities = individual students who were each specifically categorized as having more than one disability
cPhysical disability = mobility impairments and/or impairment with arm use.
dNot specified = those studies (4) or reviews of studies (1) that did not report about or provide detail as to the participants' disabilities.
eNot applicable = those documents that had only non-students as participants.
About one-third of the remaining 37 studies included students with attentional difficulties (n=13), students with emotional behavioral disabilities (n=12), students with autism-related disabilities (n=12), and students with "multiple disabilities" (n=12). Almost one-fourth of the relevant studies included students with physical disabilities (n=11), or students with deafness or hearing impairments (n=10). About one-fourth included students with blindness or visual disabilities (n=9), or students with intellectual disabilities (n=8). About one-fifth of the studies included students with speech/language impairments (n=7). One study (Freeman, 2013) specifically mentioned including students with traumatic brain injuries. Over one-half of the relevant studies included students without disabilities as comparison groups. Except for studies that addressed accommodations and students with learning disabilities, very few studies examined accommodations for only participants with one specific category of disability.
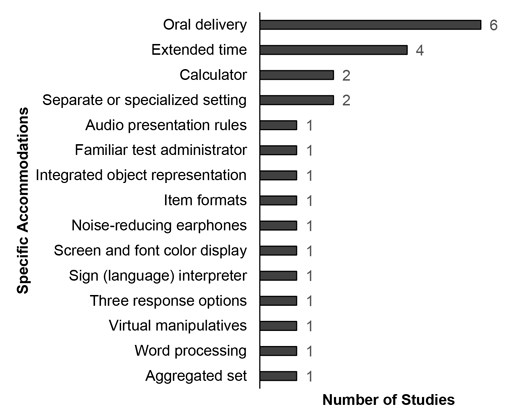
The number of times specific categories of accommodations were included in 2013-2014 published research is summarized in Table 9. Presentation accommodations were the most frequently studied category (n=22), and within this category the most common accommodation was oral delivery--including human reader and various technology approaches (e.g., text-to-speech)--followed by computer administration (n=6). The second most frequent category studied was scheduling accommodations (n=17); all of these studies examined extended time. One study (Lewandowski, Lambert, Lovett, Panahon, & Sytsma, 2014) included breaks from testing as an additional scheduling accommodation. Several studies (n=19) analyzed accommodations from more than one category. A complete listing of accommodations examined in each study is provided in Appendix E.
Table 9. Accommodations in Reviewed Research
| Accommodations Category | Number of Studies |
|---|---|
| Presentation | 22 |
| Equipment/Materials | 9 |
| Response | 12 |
| Timing/Scheduling | 17 |
| Setting | 11 |
| Multiple accommodations | 19 |
The findings of the studies about accommodations published in 2013 and 2014 are summarized according to the nature of the studies, in keeping with the range of their purposes and focuses. The findings included sets of research about specific accommodations: oral delivery, computer administration, extended-time, calculator, and aggregated sets of accommodations commonly called "bundles." We also report the findings about unique accommodations--those examined in only one study--including word processing, computer display screen and font color, three (instead of four) response options, students reading test items aloud, noise-reducing headphones, and student familiarity with test administrator. We also report about accounts of perceptions about accommodations, including those of student test-takers as well as educators and parents. We summarize the findings of the accommodations, and describe a range of implementation conditions as well as incidence of use of various accommodations across large data sets. The findings from studies in postsecondary educational contexts, which have grown over time from 6 to 11 in past reports, to 15 studies in this report, are given separate attention. This report also presents findings by academic content areas: math, reading, science, and writing. In Appendix F, we provide substantial detail about individual studies.
Research examining the effects of accommodations on assessment performance for students with disabilities comprised 25 studies published in 2013 and 2014 (see Figure 4; see also Appendix F, Table F-1, for details about each study of this type). We report the effects of these four discrete accommodations--oral delivery, extended time, calculator, and separate/specialized setting--along with a list of aggregated accommodations and uncommon accommodations.
Figure 4. Effects of Specific Accommodations (n=25)
Note: Three studies examined the effects of accommodations in general, but did not specify comparisons of individual accommodations with one another.
Oral delivery, provided using text-to-speech devices or human reader, was the single most investigated accommodation in 2013-2014, in seven different studies. For clarity in this report, as in the previous report (Rogers et al., 2014) we used "oral delivery" in place of "read aloud" to recognize the range of media formats used, including human readers, recordings of assessment items or instructions, and text-reading software or text-to-speech devices. The delivery methods that do not use human delivery ("read aloud") of the accommodation have continued to receive increased attention in research.
Of the six studies investigating oral delivery, two studies (Brumfield, 2014; Li, 2014) supported differential benefits for students with learning disabilities when receiving oral delivery (over not receiving accommodation), in comparison to students without disabilities. Three studies supported performance improvements for study participants including both students with and without disabilities. Only one study indicated no significant benefits: Meyer and Bouck (2014) reported that the small group of participants with learning disabilities did not show higher comprehension scores when receiving text to speech, nor higher oral reading fluency scores, although when asked, the participants perceived accommodations benefits. Researchers suggested potential factors affecting the score improvements. For instance, Buzick and Stone (2014) reported that grade level of participants and the ways that the accommodations were provided mitigated the variability of the effect sizes in their meta-analysis. Fincher (2013) indicated that poor reading skills for grade 4 students with and without disabilities had a role in the higher degree of benefit of oral delivery in reading, as well as the setting in which students were educated (e.g., time in general education settings), among other factors. Li (2014) noted in a meta-analysis that the strongest factors for oral delivery's effects included when in-person readers delivered the oral test administration, when students were in elementary school, and when extra time was concurrently permitted along with oral delivery (in comparison with oral delivery alone). Worland (2014) concurred with the larger benefits of oral delivery for younger students--grade 3 versus grade 5--and also when students were producing narrative writing.
The four extended-time accommodation studies engaged students at the postsecondary level in investigations about the impact of this accommodation on academic performance. All four had comparison groups of students without disabilities. All four studies' researchers reported that the accommodations provided did not differentially support students with disabilities (ADHD)--either learning disabilities or attention deficit hyperactivity disorder--in comparison with students without disabilities. Two studies (Lewandowski et al., 2013; Miller et al., 2013) examined comparisons between employing 150% time and 200% time, that is, one-and-a-half times to twice as much time as was used in the non-accommodated condition. One of these (Lewandowski et al., 2013) found that students with learning disabilities scored significantly better in the longer extended-time condition than in the shorter time frame, and the other (Miller et al., 2013) found that there was no difference, on average, for students with ADHD in number of items correct based on the time spans allowed. However, when comparing participant groups in terms of the number of items attempted and completed, some studies diverged. Lewandowski and colleagues (2013) indicated that students without disabilities completed more items and got more correct responses than students with learning disabilities. Similarly, May and Stone (2014) indicated that students with learning disabilities completed fewer items and skipped answering more items than did students without disabilities in both test conditions. Conversely, Miller and colleagues (2013) indicated that students with ADHD attempted and completed more items when using extended time than students without disabilities not using accommodations. Wadley and Liljequist (2013) indicated that students with ADHD used about the same amount of time for math placement testing, whether they were told that they had the standard administration time or the extended-time accommodation.
The two studies (Russell, 2014; Yakubova & Bouck, 2014) examining the impact of calculators both compared the performance of students with disabilities using and not using calculators, without a comparison group of students without disabilities. Both studies found that students with disabilities benefited from calculator use on their state mathematics assessment (Russell, 2014) and items involving computation and word problem solving (Yakubova & Bouck, 2014). Additionally, Russell (2014) found that students with learning disabilities in various special education placements all benefited similarly and not to differential degrees when using the calculator accommodation. Yakubova and Bouck (2014) reported that students with mild intellectual disabilities, while a small participant sample, experienced varying benefits and preferences between the scientific calculator and the graphing calculator.
Both studies examining setting accommodations (Lin & Lin, 2013; Lin & Lin, 2014) reported that there was no significant evidence indicating a benefit of separate, low-distraction setting for exceptional students--students with disabilities and English learners--on large scale assessments. Lin and Lin (2013) reported that English learners (ELs) with learning disabilities, and students with learning disabilities who were not ELs, did not score differently on math assessments than all students with learning disabilities. Lin and Lin (2014), examining a separate data set, found that there were no significant benefits for students with learning disabilities using separate settings during either reading or math assessments, at least not benefits that could be shown separate from being male, speaking a language other than English at home, and having less positive attitudes toward learning reading and math.
Only one study (Overton (2013) yielded findings pertaining chiefly and expressly to an aggregated set, or bundle, of accommodations. This researcher reported that grade 5 students with reading-related difficulties and disabilities had no significant score differences when using a combination of student reading aloud with unlimited time, in comparison to reading silently with unlimited time. As a result of finding interaction effects when analyzing data with the accommodation and the text type as factors, the findings suggested that students with reading difficulties and disabilities could benefit from reading narrative text aloud, but expository text silently.
We classified 10 studies as having investigated the impact of unique accommodations (i.e., accommodations that were the focus of just one study during the two years included in this report). Four studies indicated that the unique accommodations supported improved performance for students with disabilities: three response options (Freeman, 2013), noise-reducing headphones (Smith & Riccomini, 2013), familiar test administrators (Szarko et al., 2013), and integrated object representation (Zhang et al., 2014). Three studies yielded that the unique accommodations did not support improved performance for students with disabilities: word-processing for writing essays--although students did indicate preference for word-processing over handwriting (Berger & Lewandowski, 2013); American Sign Language (ASL; Cawthon & Leppo, 2013); and item format adaptations such as visuals and page layout (Cawthon et al., 2013a). Finally, the other three studies pertained to comparing forms of presentation accommodations. Two studies showed that there were no significant differences in performance between accommodations compared: black screen/white print and white screen/black print (Botello, 2014), and virtual versus physical manipulatives for students with low prior geometry knowledge (Lee and Chen, 2013b). One study showed very few differences in the effects of accommodations--that is, for the literal form (rather than the interpretive form) of parenthesis in audio presentation rules (Higgins & Katz, 2013).
Figure 5 displays the data for the 21 studies on perceptions about accommodations. More than one-half of them (n=12) provided findings about student perceptions only, while one-third (n=7) provided findings about educator perceptions only, and two studies (Lewis & Nolan, 2013; Torres, 2014) reported about accommodations perceptions indicated by more than one participant group.
Eight of the 12 studies on student perceptions (only) found that most or all participants viewed accommodations as helping them perform better on assessments (Berger & Lewandowski, 2013; Lewandowski et al., 2014; Lovett & Leja, 2013; Meyer & Bouck, 2014; Schreuer & Sachs, 2014; Stein, 2013; Stone, 2013; Wizikowski, 2013). One of these studies (Meyer & Bouck, 2014) also indicated that accommodations supported students while taking assessments by benefiting them in other ways, and that same study found that there was no significant performance benefit for using the accommodation despite students' perceptions. Further, of the eight studies that found favorable impressions about accommodations among its student participants, three studies (which included both students with disabilities and students without disabilities) indicated that both groups had similar perceptions (Berger & Lewandowski, 2013; Lewandowski et al., 2014; Lovett & Leja, 2013). One study offered feedback for improving the accommodations studied (Higgins & Katz, 2013). In five studies (Lovett & Leja, 2013; Lyman, 2013; May & Stone, 2014; Smith, 2014; Stein, 2013), researchers also inquired about circumstances or conditions for accommodations provision, including students' challenges in benefiting from accommodations. Finally, one study (Higgins & Katz, 2013), a study of math accommodations, observed that students preferred some accommodation strategies over others. There was a preference for interpretive forms of audio presentation for some math terminology and features such as exponents and tables, and the literal form for parentheses; there were also differences of opinion between students with and without disabilities about some audio presentation rules and features.
Figure 5. Accommodations Perceptions (n=21)
About half of the studies of educators' perceptions of test enhancements (accommodations and modifications) found that educators believed that they were beneficial to student test-takers' performance (n=3: Cawthon et al., 2013b; Crawford & Ketterlin-Geller, 2013; Zebehazy & Wilton, 2014), and to students' emotional state and self-esteem (Crawford & Ketterlin-Geller, 2013). Two studies (Alkahtani, 2013; Zebehazy & Wilton, 2014) indicated that some educators had less than favorable attitudes toward accommodations. Specifically, during the interview phase of the study, Alkahtani found that educators had a complicated view of assistive technology; they believed that it can provide access to the curriculum, but that students can also become overly dependent on assistive technology for learning. Zebehazy and Wilton reported that most respondents, who were teachers of students with blindness and visual impairments, perceived that tactile graphics were not appropriately adapted; however, the study did indicate that these teachers thought that they could make tactile graphics understandable and usable. Another study (Hawpe, 2013) found that willingness to provide some accommodations and modifications differed in degree among general and special educators. Yet another study (May, 2013) indicated that the survey respondents' knowledge, attitudes, and intent were not all aligned in a correlated manner, particularly that knowledge is not significantly associated with intent to provide accommodations.
Many of the studies of educator perceptions also reported findings about educators' knowledge, based on either assessment of accommodations facts and state guidelines (n=4: Crawford & Ketterlin-Geller, 2013; May, 2013; Young, 2013; Zebehazy & Wilton, 2014) or self-reported levels of awareness (Alkahtani, 2013). In these four studies, educators at various levels were reported to have widely varying levels of knowledge about accommodations based on their responses to questionnaires; K-12 teacher participants demonstrated a higher degree of knowledge than did postsecondary faculty members and advisors. Alkahtani reported that nearly all participants, both general and special educators, estimated their knowledge of assistive technology as mostly low, and their preparation to provide assistive technology as poor or absent. Most of the studies (n=6: Alkahtani, 2013; Cawthon et al., 2013b; Crawford & Ketterlin-Geller, 2013; Hawpe, 2013; Young, 2013; Zebehazy & Wilton, 2014) also reported about current accommodations practices acknowledged by educators.
Two studies examined the perceptions of multiple groups. In the study that reported details about the perceptions of students as well as educators (Lewis & Nolan, 2013), students and educators concurred about their perceptions of the helpfulness of the separate setting (e.g., small group, individual administration) accommodation, including supporting their assessment performance, yet also identified ways in which the separate testing setting could be improved. A single study (Torres, 2014) engaged the perspectives of students with autism, their parents, and the students' disability services provider; the researcher reported these perspectives in general and as they applied to academic accommodations use, finding positive perceptions about use of extended time and separate low distraction setting, and challenges of self-disclosing and advocating for accommodations. (See Appendix F, Table F-1 for more detailed explanation of findings of each study.)
Sixteen studies reported findings about incidence of accommodations use and implementation-related matters. Ten studies (Alkahtani, 2013; Barnhill, 2014; Cawthon et al., 2013b; Crawford & Ketterlin-Geller, 2013; Hawpe, 2013; Leppo et al., 2014; Newman & Madaus, 2014; Schreuer & Sachs, 2014; Stein, 2013; and Wizikowski, 2013) detailed use patterns as reported by study participants. Almost half of these studies (n=5: Alkahtani, 2013; Crawford & Ketterlin-Geller, 2013; Hawpe, 2013; Leppo et al., 2014; and Nees & Berry, 2013) presented assessment accommodations use only in the primary and secondary education levels. These five studies' findings varied in their scope, with one study (Leppo et al., 2014) reporting that students with deafness and hearing impairments used similar accommodations, regardless of whether they also had other disabilities. Other studies described several accommodations in frequent use at the secondary level (Hawpe, 2013), and the five most common accommodations used in middle schools: extended time, separate setting, small group administration, directions or items read-aloud, and frequent breaks (Crawford & Ketterlin-Geller, 2013). The use-related findings from some studies at the postsecondary level indicated that the most common accommodations provided during examinations were extended time, and separate and specialized setting (Barnhill, 2014; Newman & Madaus, 2014; Stein, 2013); one study (Schreuer & Sachs, 2014) reported extended time and alternate formats were the most common. Additional postsecondary findings were that accommodations were offered at a much lower rate than at the secondary level (Cawthon et al., 2013b; Newman & Madaus, 2014). Wizikowski (2013) estimated a much higher rate of exam-related accommodations--approximately 73 percent--compared to these lower rates.
Six studies (Abedi & Ewers, 2013; Klehm, 2014; Nees & Berry, 2013; Smith, 2014; Young, 2013; and Zebehazy & Wilton, 2014) provided findings about accommodations implementation practices and issues. These studies offered few common themes. For instance, two studies (Abedi & Ewers, 2013; Klehm, 2014) discussed the purposes of accommodations--including eliminating the effects of disability during testing--and how implementation can limit the validity of testing. Nees and Berry (2013) reported on the expanding implementation of audio assistive technology for students with visual impairments, and the implementation difficulties such as technical concerns and preparation of educators. Smith (2014) reported postsecondary students' consideration of practices in their experience, describing personal development issues, chiefly learning interdependence, connected with accommodations practices as they transition from secondary to postsecondary education. Young (2013) described how different approaches to postsecondary advising lead to differing degrees of attention to the underlying needs of students for accessing accommodations. Zebehazy and Wilton (2014) reported on the implementation of tactile graphics for students with visual impairments, from the perspective of their teachers, including that the best presentation format is a combination of tactile graphics with written explanations. (See Appendix F, Table F-1 for more detailed explanation of findings of each study.)
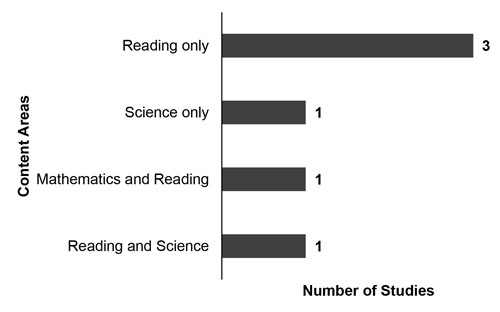
In Figure 6, we report on the six studies (Cawthon et al., 2013a; Finch & Finch, 2013a; Finch & Finch, 2013b; Huggins & Elbaum, 2013; Lewandowski et al., 2013; Stone, 2013) that provided findings about academic construct validity when accommodations were used on large-scale assessments. Five studies reported findings pertaining to reading, including one study (Cawthon et al., 2013a) that examined the constructs of English language arts and science, and one study (Finch & Finch, 2013b) that examined reading and math assessments. Cawthon and her colleagues (2013b) indicated that the construct validity of both English language arts and science were complicated by item adaptations, according to most of the participant groups' performance scores. Finch and Finch (2013a, 2013b) investigated the use of multilevel Rasch mixture models for examining differential item functioning related to disabilities and accommodations, concluding that this was a successful approach, and finding concerns with assessment validity. Similarly, Lewandowski and colleagues (2013) found that extended time complicated the validity of reading comprehension performance for postsecondary students with and without learning disabilities. In contrast, Stone (2013) concluded that a two-stage condition-adaptive testing system simultaneously produced valid reading comprehension performance scores for students with reading disabilities when using oral delivery accommodations; these test-takers also produced oral reading fluency scores separately. As previously mentioned, math assessment validity was reported to be compromised when students with disabilities were provided accommodations (Finch & Finch, 2013b).
Figure 6. Construct Validity (n=6)
The construct validity of science assessments was examined in two studies (Cawthon et al., 2013a; Huggins & Elbaum, 2013). Cawthon and colleagues indicated construct validity concerns in science for elementary students. Huggins and Elbaum (2013) applied "score equity assessment" and indicated that the science assessment scores of older elementary students with disabilities using accommodations were more comparable to the general population of test-takers than were scores of students with disabilities not using accommodations. (See Appendix F, Table F-1 for more detailed explanation of findings of each study.)
Fifteen studies reported findings about accommodations at the postsecondary education level. Researchers investigated effects of accommodations on test performance, test-takers' experiences using accommodations, and faculty members' perceptions of accommodations, along with implementation practices and uses of accommodations; seven studies each reported findings in two of these areas. The four studies examining accommodations effects included three studies on extended time (May & Stone, 2014; Miller et al., 2013; Wadley & Liljequist, 2013) and one study that was a meta-analysis of 19 studies about the effects of American sign language (ASL) spanning primary, secondary, and postsecondary education (Cawthon & Leppo, 2013). The three studies on the effects of extended time yielded convergent findings: there were no differential benefits for postsecondary students with disabilities.
Eleven studies provided findings about perceptions in postsecondary education; seven inquired only about students' perceptions and three inquired only about educators' perceptions, while one study reported about the perceptions of students, educators, and students' parents. The findings of the seven studies (Lewandowski et al., 2014; Lyman, 2013; May & Stone, 2014; Smith, 2014; Stein, 2013; Torres, 2014; Wizikowski, 2013) about postsecondary students' perceptions were complex and diverse. Many studies indicated that students perceived accommodations as generally supportive, yet the researchers often sought additional information about the limits to accommodations at the postsecondary level. Students with disabilities were significantly more positive than students without disabilities about separate room test setting, but both students with and without disabilities indicated that their performance would be improved if using extended time, separate exam rooms, extra breaks, and word processors (Lewandowski et al., 2014).
Students at the postsecondary level with various disabilities believed that accommodations could be helpful, yet also detailed several barriers to accessing accommodations. The barriers included: students' own concerns about how they were perceived by other students and by themselves as well, limited knowledge of their professors about accommodations, and resource limitations in their universities (Lyman, 2013). Students with learning disabilities were not affected by stereotype threat, a concern about potentially confirming stereotypes about themselves and other students with learning disabilities. In other words, these postsecondary students did not appear self-conscious about their need for or use of accommodations (May & Stone, 2014). Students with non-visible disabilities experienced developmental challenges as they transitioned from secondary to postsecondary education, including identity maturation, desiring credibility, and controlling information. All of these challenges were related to the students seeking and receiving accommodations (Smith, 2014).
Students with mental health related disabilities described their accommodations experiences, including the complexity of the separate quiet testing space in that it can decrease distress yet also remove opportunity to interact with course instructors (Stein, 2013). Academic stress, in this case experienced by students with autism spectrum disorders, was investigated by Torres (2014), who found that study participants experienced exam accommodations as supportive, yet the process to access them was socially challenging. Students with various disabilities across public and private universities indicated that exam accommodations were mostly useful and that their experiences were relatively satisfying; also, their perceptions were that accommodations knowledge by relevant university personnel was satisfactory (Wizikowski, 2013).
The three studies reporting on the perceptions of postsecondary faculty and other personnel yielded varying findings: positive perceptions about interpreter, captioning, and speech-to-text technology accommodations (Cawthon et al., 2013b); slightly positive intent of nursing faculty members to provide accommodations in general (May & Stone, 2014); the academic advisors' approach had an impact on their involving disability services' accommodations resources (Young 2013). Finally, one study (Newman & Madaus, 2014) provided findings on the perceptions of students, their disability services provider, and their parents. This study found, in part, that about half of the student participants perceived that they were no longer in need of accommodations and that they in fact did not have disabilities any longer.
Four studies reported on use patterns and implementation practices for students with disabilities at the postsecondary level. Two studies had contradictory findings about the use frequency of accommodations during course examinations by students with disabilities, with Newman and Madaus (2014) estimating rates of less than 10 percent for students early in their postsecondary experience (e.g., reader for tests and assignments: 4%), and Wizikowski (2013) reporting that about 73 percent of study participants reported using exam accommodations at some point during their postsecondary education. The former study (Newman & Madaus) gathered information from students at a different point in their postsecondary experience than the latter study (Wizikowski), which might partially explain the difference in findings. The other two studies reported on the manner by which accommodations were implemented in the postsecondary setting. Smith (2014) inquired about students' perceptions as well as how those perceptions affected the implementation of accommodations, and described students' reluctantly embracing interdependence on academic resources. Young (2013) examined the perspectives of academic advisors, and how their demographic characteristics and working circumstances interacted with their approaches to assisting students with disabilities in assessment accommodations. One finding was that advisors who used a prescriptive approach to advising were associated with failing to refer students with disabilities to disability services offices.
One study (Lovett, 2014) was a literature review about the implications of accommodations research in relation to the Department of Justice implementation guidelines on the Americans with Disabilities Act amendments of 2008, yielding a set of five major points. (See Appendix F, Table F-1 for more detailed explanation of findings of each study.)
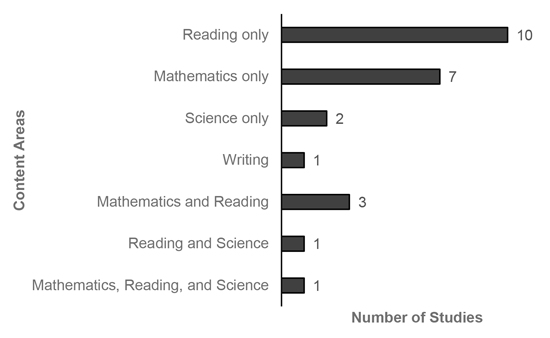
As in previous reports, we analyzed findings according to the academic content area that was the focus of the research. We present findings for each content area according to the frequency with which the content areas were identified, with most prevalent content areas presented first: 15 studies in reading, 11 studies in mathematics, 4 studies in science, and 1 study in writing (see Figure 7). For each content area, we examined the impact of accommodations on assessment performance, perceptions about accommodations, construct validity of accommodated assessments, and implementation and use of accommodations. (See Appendix F, Table F-1 for more detailed explanation of the findings of each study.)
Figure 7. Findings by Content Areas (n=24)
Reading. The findings of the 15 studies in reading included those from 10 studies in reading only (Botello, 2014; Cawthon & Leppo, 2013; Finch & Finch, 2013a; Fincher, 2013; Lewandowski et al., 2013; Meyer & Bouck, 2014; Miller et al., 2013; Overton, 2013; Smith & Riccomini, 2013; Stone, 2013), those from three studies in reading and math (Buzick & Stone, 2014; Finch & Finch, 2013b; Li, 2014), those from a study in English language arts and science (Cawthon et al., 2013a), and those from a study in reading, math, and science (Freeman, 2013). All of these studies--except for Stone (2013)--reported on the effects of various accommodations during math assessments, and five of these 15 studies yielded other findings as well. Four studies (Cawthon et al., 2013a; Finch & Finch, 2013a; Finch & Finch, 2013b; Lewandowski et al., 2013) also reported about validity, and one study (Meyer & Bouck, 2014) also reported about student perceptions.
The accommodations and modifications benefited the reading performance of at least some students with disabilities in seven studies, especially in relation to comparisons with students without disabilities. These studies included three of the four oral delivery studies (Buzick & Stone, 2014; Fincher, 2013; Li, 2014), one study (Cawthon et al., 2013a) with various item adaptations, one study (Overton, 2013) on student reads aloud combined with unlimited time, one study (Smith & Riccomini, 2013) on noise-reduction headphones, and one study (Freeman, 2013) on three response options. One study (Miller et al., 2013) indicated that both students with and students without disabilities improved in both items completed and items correct across the standard administration and the two extended time conditions, suggesting that extended time did not differentially benefit students with disabilities. Another study (Lewandowski et al., 2013) reported that students without disabilities improved even more than students with disabilities when provided extended time. Also, one study (Finch & Finch, 2013b) showed that students improved in reading, but that there was a suspected validity concern complicating this finding. In contrast, three studies showed no significant benefit of accommodations for students with disabilities: for American sign language (in comparison to English print) (Cawthon & Leppo, 2013), for oral delivery (Meyer & Bouck, 2014), and for accommodations in general (Finch & Finch, 2013a). One study (Botello, 2014) which compared two screen and font color options for all students (with a subset of students with disabilities included), reported that there were no significant differences in comprehension across these conditions. Four studies also included findings on construct validity for reading assessments, reporting concerns about the construct validity of reading due to accommodations in general (Finch & Finch, 2013a, Finch & Finch, 2013b) and extended time (Lewandowski et al., 2013). Also, Cawthon and her colleagues (2013b) indicated that a set of item adaptations might have affected validity for part of the participant group. Finally, Stone (2013) reported that students with disabilities believed they scored better when using oral delivery than when they did not; further, the researcher concluded that the condition-adaptive assessment format was able to measure separate reading components without affecting test validity.
Mathematics. The findings of the 11 studies in math included those from seven studies in math only (Higgins & Katz, 2013; Ketterlin-Geller et al., 2014; Lee & Chen, 2014; Russell, 2014; Wadley & Liljequist, 2013; Yakubova & Bouck, 2014; Zhang et al., 2014), those from three studies in math and reading (Buzick & Stone, 2014; Finch & Finch, 2013b; Li, 2014) and those from a study in math, reading, and science (Freeman, 2013). Nearly all of these studies--except for Ketterlin-Geller et al. (2014)--reported on the effects of various accommodations during math assessments, and only two of these 10 studies yielded other findings: one study (Higgins & Katz, 2013) reported about students' perceptions, and one study (Finch & Finch, 2013b) reported about construct validity. The accommodations benefited the performance of students with disabilities in math in five studies, including both calculator studies (Russell, 2014; Yakubova & Bouck, 2014), one study on oral delivery (Li, 2014), one study on three response options (Freeman, 2013), and one study on integrated object representation (Zhang et al., 2014). In contrast, one study (Buzick & Stone, 2014) showed that there was a similar degree of benefit of the oral delivery accommodation for both students with and students without disabilities. Also, one study (Finch & Finch, 2013b) showed that students improved in math but that there was a suspected validity concern complicating this finding. Further, one study (Wadley & Liljequist, 2013) indicated that students with disabilities did not benefit from extended time. Two studies that compared versions of accommodations reported differing findings: Higgins and Katz (2013) indicated that only one audio presentation rule (pertaining to parentheses) showed a benefit in performance for students with disabilities, and Lee and Chen (2014) reported that there was no significant difference in performance between virtual and physical manipulatives.
Science. The findings of the four studies in science included those from two studies in science only (Brumfield, 2014; Huggins & Elbaum, 2013), those from one study in science and English language arts (Cawthon et al., 2013a), and those from one study in science, math, and reading (Freeman, 2013). These findings included those pertaining to performance effects, as well as validity. Three studies reported that, during science assessments, students with disabilities were supported to a greater degree than students without disabilities by oral delivery (Brumfield, 2014), by a set of format adaptations for grade 3 students (Cawthon et al., 2013a), by accommodations in general (Huggins & Elbaum, 2013), and by three response options (as opposed to four; Freeman, 2013). The validity findings were divided: Huggins and Elbaum reported that validity of the science construct was not affected by the accommodations that students received, and Cawthon and her colleagues (2013b) reported that the science construct may have been affected by the set of item format adaptations for part of the participant group.
Writing. There was a single study (Worland, 2014) providing findings related to writing. Worland reported that oral delivery during a writing assessment was supportive for students in grade 3, including students with learning disabilities. This study also reported about the impact of accommodations use related to writing genres.
The researchers of most of the studies (n=44) in this body of research literature discussed limitations that provided context for the results they reported. Table 10 presents the categories of limitations for the 101 limitations that were noted by researchers: methodology, sample characteristics, results, test/test context, and other. Of the 44 studies, 34 of them identified more than one category of limitation; the overall average was about two limitation categories per study.
Table 10. Categorized Limitations Identified by Authors
| Limitation Category | Number of Studiesa |
|---|---|
| Sample characteristics | 35 |
| Methodology | 22 |
| Test/Test context | 22 |
| Results | 18 |
| No limitation listed | 8 |
| Other | 3 |
a Thirty-four studies included more than one category of limitations, represented in 2 to 4 limitations categories.
The most commonly reported category of limitations in 2013-2014 studies was sample characteristics (n=35), which usually referred to the issue that the sample was smaller or narrower than intended or required. This issue yielded a challenge to population representativeness, limiting the generalizability of the findings beyond the research participants. The next most frequent categories (with 22 studies each) were limitations about methodology, and about test and test context. Methodology limitations referred to flaws in research design or practices. Test and test context limitations referred to the degree of authenticity of the testing circumstances, especially pertaining to accommodations. Limitations about results (n=18) indicated that confounding factors constrained the accuracy or consistency of the data, limiting the confidence readers should have about the study's results. (See Appendix G, Table 1 for additional details about the study limitations.)
The researchers of most of the studies (n=42) in the body of research literature included in this analysis discussed several future research directions that provided indicators of lessons they learned as well as their views of the next steps to take. Table 11 presents the categories of the 100 future research directions listed by researchers: methodology, sample characteristics, results, test/test context, and other. Of the 42 studies, 31 studies identified more than one future research direction category; the overall average was approximately two categories per study.
The most commonly reported category of future research directions in 2013-2014 studies was sample characteristics (n=32). Typical directions about sample characteristics were engaging different types of students to affirm or find exceptions to the current studies' findings. The second most common category was research ideas about test and test context (n=26), where researchers indicated the need for improvements in assessments in terms of accessibility, and the need for deeper understandings of how accommodations might support this goal. The third most frequently identified area for future research pertained to methodology (n=17), where researchers pointed to additional angles that could be taken to increase the field's knowledge and understanding about accommodations--sometimes suggesting qualitative methods to uncover meaning beneath quantitative findings. Research ideas about results (n=15) were just a little less common than those about methodology. These addressed investigating possible outcomes or aspects of the findings that could further explain them, often suggesting ways to address the limitations of the current studies' data. Finally, the "other" category included 10 studies with a variety of directions that were outside of the categories, such as inquiring about the effects of professional development for educators about accommodations (Hawpe, 2013; Klehm, 2014). (See Appendix G, Table 2 for additional details about future research directions.)
Table 11. Categorized Future Research Directions Identified by Authors
| Future Research Category | Number of Studiesa |
|---|---|
| Sample characteristics | 32 |
| Test/Test context | 26 |
| Methodology | 17 |
| Results | 15 |
| Other | 10 |
| No future research listed | 8 |
a Thirty-four studies listed directions for future research that fit into multiple categories, represented in 2 to 5 future research directions categories.
Top of Page | Table of Contents
This report provides a snapshot of accommodations research literature in 2013-2014. It addresses the types of accommodations that were studied, the purposes of the research, the research type, data sources, characteristics of the independent and dependent variables under study, comparability of findings between studies in similar domains, and limitations and directions of future research.
As in the past, mathematics and reading were the content areas most frequently addressed in the studies included in this analysis. Students were the participant group in about two-thirds of the studies. Students with learning disabilities (LD) were more likely to be included in the research samples than other groups, which was expected because LD is the more prevalent disability category.
Accommodations research continues to be an area where a substantial amount of research is occurring. There is interest in exploring a wide range of topics related to accommodations. For example, as more assessments shift from paper and pencil tests to technology-based assessments there are new issues and questions.
As in previous reports (Cormier et al., 2010; Johnstone et al., 2006; Thompson et al., 2002; Rogers et al., 2012; Rogers et al., 2014; Zenisky et al., 2007), the findings for a specific accommodation were often mixed. For example, for the oral delivery accommodation, two studies found a differential boost for students with disabilities when compared to students without (Brumfield, 2014; Li, 2014), three found performance improvements for both students with and without disabilities (Buzick & Stone, 2014; Fincher, 2013; Worland, 2014), and one found no significant benefits (Meyer & Bouck, 2014).
Most of the studies included in this analysis identified study limitations. Issues related to the sample characteristics and other aspects of the methodology were the most frequently identified limitations. Limitations were also noted related to the lack of authenticity of the test or testing context. As would be expected, the researchers also identified a need for future studies with stronger methodology and sample characteristics, and the need for studies that take place in more natural and authentic contexts.
The recent reauthorization of the Elementary and Secondary Education Act (ESEA) as the Every Student Succeeds Act (ESSA) gives states more flexibility in how they annually assess students on statewide tests for accountability purposes, but there is a continued focus on ensuring that the assessments are accessible to students with disabilities. New issues related to embedded accommodations on computer-based tests, the compatibility of assistive technology with computer platforms, the validity of inferences, and adaptive testing will continue to arise as states and consortia refine their assessment systems. There will continue to be a need for accommodations research that addresses these and other emerging issues.
Top of Page | Table of Contents
(References in the report to papers that were part of the 2013-2014 accommodations research analysis are not included in this list. They are in the separate list titled: 2013 and 2014 Accommodation References.)
Brown, J. L., Fishco, V. V., & Hanna, G. (1993). Nelson-Denny Reading Test, Form H. Itasca, IL: Riverside Publishing.
Cawthon, S., & Research and Evidence Synthesis Team. (2012). Pepnet 2 needs assessment final report. Retrieved from pepnet 2 website: www.pepnet.org
Cormier, D. C., Altman, J., Shyyan, V., & Thurlow, M. L. (2010). A summary of the research on the effects of test accommodations: 2007-2008 (Technical Report 56). Minneapolis, MN. Retrieved from http://www.cehd.umn.edu/NCEO/onlinepubs/Tech56/default.htm
Educational Testing Service. (2010). GRE General Test. Princeton, NJ: Author.
Heatherton, T. F., & Polivy, J. (1991). Development and validation of a scale for measuring state self-esteem. Journal of Personality and Social Psychology, 60(6), 895-910. doi:10.1037/0022-3514.60.6.895
Hoover, H. D., Dunbar, S. B., Frisbie, D. A., Oberley, K, R., Bray, G. B., Naylor, R. J., Lewis, J. C., Ordman, V. L., & Qualls, A. L. (2003). The Iowa tests: Interpretive guide for school administrators. Itasca, IL: Riverside.
Hresko, W. P., Herron, S. R., Peak, P. K., & Hicks, D. I. (2012). Test of early written language--Third edition (TEWL-3). Hydesville, CA: Psychological and Educational Publications, Inc.
Johnstone, C. J., Altman, J., Thurlow, M. L., & Thompson, S. J. (2006). A summary of research on the effects of test accommodations: 2002 through 2004 (Technical Report 45). Minneapolis, MN. Retrieved from http://www.cehd.umn.edu/NCEO/OnlinePubs/Tech45/default.html
Klehm, M. (2013). High-stakes testing and students with disabilities: A teacher attitude survey (HST-SWD). Teacher attitudes: The effects of teacher beliefs on teaching practices and achievement of students with disabilities (Unpublished doctoral dissertation). University of Rhode Island, Kingston.
Kuh, G. D., Gonyea, R. M., Kish, K. E., Muthiah, R., & Thomas, A. (2003). College student experiences questionnaire: Norms for the 4th edition. Bloomington, IN: Center for Postsecondary Research and Planning, Indiana University.
Lambert, D., Dodd, J. M., Christensen, L., & Fishbaugh, M. S. E. (1996). Rural secondary teachers' willingness to provide accommodations for students with learning disabilities. Rural Special Education Quarterly, 15(2), 36-42. Retrieved from http://acres-sped.org/journal
Lee, C. Y., & Yuan, Y. (2010). Gender differences in the relationship between Taiwanese adolescents' mathematics attitudes and their perceptions toward virtual manipulatives. International Journal of Science and Mathematics Education, 8(5), 937-950. doi:10.1007/s10763-010-9193-8
Leslie, L., & Caldwell, J. (2011). Qualitative reading inventory-5. Upper Saddle River, NJ: Pearson Education.
Lu, J. A., Cheng, L. P., & Lu, C. M. (1991). Junior high school instruction manual of intelligence test. Taipei City, Taiwan: China Behavioral Science Community.
National Assessment Governing Board. (2008, Spring). Reading framework for the 2009 National Assessment of Educational Progress. Washington, DC: Author. Retrieved from http://www.nagb.org/content/nagb/assets/documents/publications/frameworks/reading09.pdf
Pace, C. R., & Kuh, G. D. (1998). College Experiences Questionnaire (4th ed.). Bloomington, IN: Indiana University Center for Postsecondary Research and Planning.
Pauk, W. (2010). Six-way paragraphs, middle level: 100 passages for developing the six essential categories of education (3rd ed.). Chicago, IL: Jamestown.
Renaissance Learning. (2012). STAR Reading. Wisconsin Rapids, WI: Renaissance Learning. Retrieved from http://www.renaissance.com/Products/Star-Assessments.
Rogers, C. M., Christian, E. M., & Thurlow, M. L. (2012). A summary of the research on the effects of test accommodations: 2009-2010 (Technical Report 65). Minneapolis, MN. Retrieved from http://www.cehd.umn.edu/nceo/OnlinePubs/Tech65/TechnicalReport65.pdf
Rogers, C. M., Lazarus, S. S., & Thurlow, M. L. (2014). A summary of the research on the effects of test accommodations, 2011-2012 (Synthesis Report #94). Minneapolis, MN. Retrieved from http://www.cehd.umn.edu/nceo/OnlinePubs/Synthesis94/Synthesis94.pdf
Schopler, E., Reichler, R. J., Bashford, A., Lansing, M D., & Marcus, I. M. (1990). Individualized assessment and treatment for autistic and developmentally disabled children: Vol 1. Psychoeducational Profile--Revised (PEP-R). Austin, TX: Pro-Ed.
Thompson, S., Blount, A., & Thurlow, M. (2002). A summary of research on the effects of test accommodations: 1999 through 2001 (Technical Report 34). Minneapolis, MN: University of Minnesota, National Center on Educational Outcomes. Retrieved from http://www.cehd.umn.edu/NCEO/OnlinePubs/Technical34.htm
University of Oregon. (2006-2012). easyCBM Lite Edition [software]. Retrieved from http://easycbm.com
Watson, D., Clark, L. A., & Tellegen, A. (1988). Development and validation of brief measures of positive and negative affect: The PANAS scales. Journal of Personality and Social Psychology, 54(6), 1063-1070. doi:10.1037/0022-3514.54.6.1063
Wechsler, D. (2002). Wechsler Individual Achievement Test (2nd ed.). San Antonio, TX: Psychological Corporation.
Wechsler, D. (2004). Wechsler Intelligence Scale for Children. London, UK: Pearson Assessments.
Wechsler, D. (2005). Wechsler Individual Achievement Test. London, UK: The Psychological Corporation.
Woodcock, R. W. (1987/1998). Woodcock Reading Mastery Tests-Revised/Normative Update. Bloomington, MN: Pearson Assessments.
Woodcock, R. W., Mather, N., & McGrew, K. S. (2001). Woodcock-Johnson III Tests of Cognitive Abilities Examiner's Manual. Itasca, IL: Riverside.
Yuker, H. E., & Block, J. R. (1986). Research with the Attitudes Toward Disabled Persons Scale (ATDP) 1960-1985. Hempstead, NY: Hofstra University.
Zenisky, A. L., & Sireci, S. G. (2007). A summary of the research on the effects of test accommodations: 2005-2006 (Technical Report 47). Minneapolis, MN. Retrieved from http://www.cehd.umn.edu/NCEO/OnlinePubs/Tech47/TechReport47.pdf
Abedi, J., & Ewers, N. (2013). Smarter Balanced Assessment Consortium: Accommodations for English language learners and students with disabilities: A research-based decision algorithm. Olympia, WA. Retrieved from http://www.smarterbalanced.org/wordpress/wp-content/uploads/2012/08/Accomodations-for-under-represented-students.pdf
Alkahtani, K. D. F. (2013). Teachers' knowledge and use of assistive technology for students with special educational needs. Journal of Studies in Education, 3(2), 65-86. doi:10.5296/jse.v3i2.3424
Berger, C. L., & Lewandowski, L. (2013). The effect of a word processor as an accommodation for students with learning disabilities. Journal of Writing Research, 4(3), 300-318. Retrieved from http://jowr.org/articles/vol4_3/JoWR_2013_vol4_nr3_Berger_Lewandowski.pdf
Cawthon, S., & Leppo, R. (2013). Assessment accommodations on tests of academic achievement for students who are deaf or hard of hearing: A qualitative meta-analysis of the research literature. American Annals of the Deaf, 158(3), 363-376. doi:10.1353/aad.2013.0023
Cawthon, S., Leppo, R., Carr, T., & Kopriva, R. (2013a). Toward accessible assessments: The promises and limitations of test item adaptations for students with disabilities and English language learners. Educational Assessment, 18(2), 73-98. doi:10.1080/10627197.2013.789294
Cawthon, S. W., Leppo, R., & the PEPNET 2 Research and Evidence Synthesis Team. (2013b). Accommodations quality for students who are d/Deaf or hard of hearing. American Annals of the Deaf, 158(4), 438-452. doi:10.1353/aad.2013.0031
Crawford, L., & Ketterlin-Geller, L. R. (2013). Middle school teachers' assignment of test accommodations. The Teacher Educator, 48(1), 29-45. doi:10.1080/08878730.2012.740152
Finch, W. H., & Finch, M. E. H. (2013a). Differential item functioning analysis using a multilevel Rasch mixture model: Investigating the impact of disability status and receipt of testing accommodations. Journal of Applied Measurement, 15(2), 133-151. Retrieved from http://www.jampress.org/
Finch, W. H., & Finch, M. E. H. (2013b). Investigation of specific learning disability and testing accommodations based differential item functioning using a multilevel multidimensional mixture item response theory model. Educational and Psychological Measurement, 73(6), 973-993. doi:10.1177/0013164413494776
Fincher, M. (2013). Investigating the effects of a read-aloud alteration on the third-grade Reading Criterion-Referenced Competency Test (CRCT) for students with disabilities. Georgia State University. Retrieved from http://scholarworks.gsu.edu/epse_diss/87/
Freeman, S. R. (2013). How many are enough? A quantitative analysis of the effects of the number of response options on the academic performance of students with disabilities on large-scale assessments. Dissertation Abstracts International: Section A. Humanities and Social Sciences, 74(12).
Hawpe, J. C. (2013). Secondary teachers' attitudes toward and willingness to provide accommodations and modifications for students with disabilities. Retrieved from http://www.bakeru.edu/soe-prospective-students2/edd/dissertations
Higgins, J., & Katz, M. (2013). A comparison of audio representations of mathematics content. Journal of Special Education Technology, 28(3), 59-66. Retrieved from http://www.tamcec.org/wp-content/uploads/2009/06/JSET-283-Digital_sec.pdf#page=63
Huggins, A. C., & Elbaum, B. (2013). Test accommodations and equating invariance on a fifth-grade science exam. Educational Assessment, 18(1), 49-72. doi:10.1080/10627197.2013.761536
Lewandowski, L., Cohen, J., & Lovett, B. J. (2013). Effects of extended time allotments on reading comprehension performance of college students with and without learning disabilities. Journal of Psychoeducational Assessment, 31(3), 326-336. doi:10.1177/0734282912462693
Lewis, K., & Nolan, C. (2013). Examination accommodations for students with sensory defensiveness. Journal of Postsecondary Education and Disability, 26(2), 163-181. Retrieved from http://www.ahead.org/publications/jped
Lin, P.-Y., & Lin, Y.-C. (2013). The impact of setting accommodation on large-scale assessment of English language learners with and without learning disabilities: Balanced vs. unbalanced data in latent class analyses. Journal of Studies in Education, 3(2), 1-19. doi:10.5296/jse.v3i2.3371
Lovett, B. J., & Leja, A. M. (2013). Students' perceptions of testing accommodations: What we know, what we need to know, and why it matters. Journal of Applied School Psychology, 29(1), 72-89. doi:10.1080/15377903.2013.751477
Lyman, M. J. (2013). Barriers to accommodation use for students with disabilities in postsecondary education. Retrieved from http://scholarsarchive.byu.edu/etd
May, K. G. (2013). Assessing faculty knowledge of disability-related law and providing academic accommodation. Dissertation Abstracts International: Section B. Sciences and Engineering, 76(03).
Miller, L. A., Lewandowski, L. J., & Antshel, K. M. (2013). Effects of extended time for college students with and without ADHD. Journal of Attention Disorders. Advance online publication. doi:10.1177/1087054713483308
Nees, M. A., & Berry, L. F. (2013). Audio assistive technology and accommodations for students with visual impairments: Potentials and problems for delivering curricula and educational assessments. Performance Enhancement & Health, 2(3), 101-109. doi:10.1016/j.peh.2013.08.016
Overto n, A. M. (2013). Examining comprehension when using a student-reads-aloud accommodation on two text types. Dissertation Abstracts International: Section A. Humanities and Social Sciences, 74(08).
Smith, G. W., & Riccomini, P. J. (2013). The effect of a noise reducing test accommodation on elementary students with learning disabilities. Learning Disabilities Research & Practice, 28(2), 89-95. doi:10.1111/ldrp.12010
Stein, K. F. (2013). DSS and accommodations in higher education: Perceptions of students with psychological disabilities. Journal of Postsecondary Education and Disability, 26(2), 145-161. Retrieved from http://www.ahead.org/publications/jped
Stone, E., Cook, L., & Laitusis, C. (2013). Evaluation of a condition-adaptive test of reading comprehension for students with reading-based learning disabilities (ETS RR-13-20). Princeton, NJ. Retrieved from http://www.ets.org/Media/Research/pdf/RR-13-20.pdf
Szarko, J. E., Brown, A. J., & Watkins, M. W. (2013). Examiner familiarity effects for children with autism spectrum disorders. Journal of Applied School Psychology, 29(1), 37-51. doi:10.1080/15377903.2013.751475
Wadley, M. N., & Liljequist, L. (2013). The effect of extended test time for students with attention-deficit hyperactivity disorder. Journal of Postsecondary Education & Disability, 26(3), 263-271. Retrieved from http://ahead.org/publications/jped/vol_26
Wizikowski, H. T. (2013). Academic support experiences and perceptions of postsecondary students with disabilities: A public and private university comparison. Retrieved from http://scholarship.claremont.edu/cgu_etd/76/
Young, R. E. (2013). Advisor knowledge of disability-related needs, laws, and accommodation requirements in postsecondary academic advisement practices. Dissertation Abstracts International: Section A. Humanities and Social Sciences, 75(04)E.
Barnhill, G. P. (2014). Supporting students with Asperger Syndrome on college campuses: Current practices. Focus on Autism and Other Developmental Disabilities. Advance online publication. doi:10.1177/1088357614523121
Botello, J. A. (2014). Comparing the effect of two types of computer screen background lighting on students' reading engagement and achievement. (Doctoral dissertation, Lindenwood University). Retrieved from http://pqdtopen.proquest.com/doc/1530298552.html
Brumfield, G. A. (2014). The effectiveness of reading accommodations for high school students with reading disabilities. Dissertation Abstracts International: Section B. Sciences and Engineering, 75(05).
Buzick, H., & Stone, E. (2014). A meta-analysis of research on the read aloud accommodation. Educational Measurement: Issues and Practice, 33(3), 17-30. doi:10.1111/emip.12040
Ketterlin-Geller, L. R., Crawford, L., & Huscroft-D'Angelo, J. N. (2014). Screening to assign accommodations: Using data to make decisions. Learning Disabilities: A Multidisciplinary Journal, 20(2), 73-86. Retrieved from http://ldaamerica.org/learning-disabilities-a-multidisciplinary-journal/
Klehm, M. (2014). The effects of teacher beliefs on teaching practices and achievement of students with disabilities. Teacher Education and Special Education, 37(3), 216-240. doi:10.1177/0888406414525050
Lee, C.-Y., & Chen, M. (2014). The impacts of virtual manipulatives and prior knowledge on geometry learning performance in junior high school. Journal of Educational Computing Research, 50(2), 179-201.
Leppo, R. H. T., Cawthon, S. W., & Bond, M. P. (2014). Including deaf and hard-of-hearing students with co-occurring disabilities in the accommodations discussion. Journal of Deaf Studies and Deaf Education, 19(2), 189-202. doi:10.1093/deafed/ent029
Lewandowski, L., Lambert, T. L., Lovett, B. J., Panahon, C. J., & Sytsma, M. R. (2014). College students' preferences for test accommodations. Canadian Journal of School Psychology, 29(2), 116-126. doi:10.1177/0829573514522116
Li, H. (2014). The effects of read-aloud accommodations for students with and without disabilities: A meta-analysis. Educational Measurement: Issues and Practice, 33(3), 3-16. doi:10.1111/emip.12027
Lin, P.-Y., & Lin, Y.-C. (2014). Examining student factors in sources of setting accommodation DIF. Educational and Psychological Measurement, 74(5), 759-794. doi:10.1177/0013164413514053
Lovett, B. J. (2014). Testing accommodations under the amended Americans with Disabilities Act: The voice of empirical research. Journal of Disability Policy Studies, 25(2), 81-90. doi:10.1177/1044207312469830
May, A. L., & Stone, C. A. (2014). An initial investigation into the role of stereotype threat in the test performance of college students with learning disabilities. Journal of Postsecondary Education & Disability, 27(1), 89-106. Retrieved from http://www.ahead.org/publications/jped.htm
Meyer, N. K., & Bouck, E. C. (2014). The impact of text-to-speech on expository reading for adolescents with LD. Journal of Special Education Technology, 29(1), 21-34. Retrieved from http://www.tamcec.org/jset/
Newman, L. A., & Madaus, J. W. (2014). Reported accommodations and supports provided to secondary and postsecondary students with disabilities: National perspective. Career Development and Transition for Exceptional Individuals. Advance online publication. doi:10.1177/2165143413518235
Russell, R. (2014). The impact of using calculators as an accommodation on the math achievement of students with learning disabilities. Grand Canyon University. Retrieved from http://search.proquest.com/docview/1564022570
Schreuer, N., & Sachs, D. (2014). Efficacy of accommodations for students with disabilities in higher education. Journal of Vocational Rehabilitation, 40(1), 27-40. doi:10.3233/JVR-130665
Smith, L. A. (2014). The experiences and sense-making of students with non-visible disabilities on their transition to college and utilization of academic accommodations: An interpretative phenomenological analysis. (Doctoral dissertation). Retrieved from https://repository.library.northeastern.edu/theses_and_dissertations
Torres, E. S. (2014). Students with Autism Spectrum Disorders (ASD): The first-year postsecondary educational experience. (Doctoral dissertation, The George Washington University). Retrieved from http://pqdtopen.proquest.com/doc/1497034008.html
Worland, K. M. (2014). The effects of prompt condition and genre on the writing performance of students in 3rd and 5th grade. (Doctoral dissertation). Retrieved from http://drum.lib.umd.edu/
Yakubova, G., & Bouck, E. C. (2014). Not all created equally: Exploring calculator use by students with mild intellectual disability. Education and Training in Autism and Developmental Disabilities, 49(1), 111-126. doi:none
Zebehazy, K. T., & Wilton, A. P. (2014). Quality, importance, and instruction: The perspectives of teachers of students with visual impairments on graphics use by students. Journal of Visual Impairment & Blindness, 108(1), 5-16. Retrieved from http://www.afb.org/jvib/jvib_main.asp
Zhang, D., Wang, Q., Ding, Y., & Liu, J. J. (2014). Testing accommodation or modification? The effects of integrated object representation on enhancing geometry performance in children with and without geometry difficulties. Journal of Learning Disabilities, 47(6), 569-583. doi:10.1177/00222194135
Top of Page | Table of Contents
| Authors | Stated Research Purpose/s | Purpose Category Identifier | ||||||||||
|---|---|---|---|---|---|---|---|---|---|---|---|---|
| A-Effects [SwD] | A-Effects [non] | A-Effects [both] | B-Perceptions | C-Reviews | D-Issues |
E-Implement/ |
F-Items | G-Validity | H-Develop | I-Accomm. Need | ||
| Abedi & Ewers (2013) | Summarize research-based evidence regarding accommodations for the Smarter Balanced Assessment Consortium (SBAC) to develop a common assessment system; also, discuss issues of needed conditions for developing a cross-state accommodations decision-making system. | P | X | |||||||||
| Alkahtani (2013) | Inquire about general educators' and special educators' preparation for, knowledge about, and attitudes about providing assistive technology to their students; also, report on these educators' current accommodations practices. | P | X | |||||||||
| Barnhill (2014) | Report on postsecondary faculty members' current accommodations practices with students with Asperger Syndrome. | P | ||||||||||
| Berger & Lewandowski (2013) | Compare effects of postsecondary students' use of a word processor and typical handwritten course exam responses; also, inquire from postsecondary students about their experience using accommodations, including relative preference for completing tests in handwriting and via word processor. | P | X | |||||||||
| Botello (2014) | Compare effects of screen display colors on reading comprehension scores and test-taking behaviors of elementary students; also, summarize research pertaining to large scale standardized testing via computer formats. | P | X | |||||||||
| Brumfield (2014) | Compare effects of an oral delivery accommodation on science assessment performance for high school students with and without reading disabilities; also, summarize research concerning oral delivery accommodations on assessments of reading comprehension. | P | X | |||||||||
| Buzick & Stone (2014) | Summarize research on the effects of oral delivery on mathematics and reading scores for students with and without disabilities; also, examine construct validity related to oral delivery accommodations; also, analyze effect sizes for math and reading items; finally, discuss issues of different effects by content area and schooling level. | P | X | |||||||||
| Cawthon & Leppo (2013) | Summarize research, employing qualitative meta-analysis, concerning assessment accommodations provided in various contexts to students with deafness and hearing impairments; also, discuss issues pertaining to factors related to these students' assessment and accommodation experiences. | P | X | |||||||||
| Cawthon et al. (2013a) | Examine construct validity related to adaptations to science test items; also, compare effects of various types of test item adaptations on science performance scores for early elementary students with learning disabilities, students with hearing impairments, and students without disabilities. | X | P | |||||||||
| Cawthon et al. (2013b) | Report on various educators' current accommodation practices with students with deafness and hearing impairments; also, discuss issues about access, quality, and consistency of accommodations; finally, inquire about various educators' perceptions about providing accommodations for students with deafness and hearing impairments, including accommodations quality. | X | X | P | ||||||||
| Crawford & Ketterlin-Geller (2013) | Inquire about middle school special education teachers' perspectives regarding understanding and providing accommodations to students with disabilities, including decision-making processes; also, discuss issues about common knowledge among these educators regarding accommodations, and limitations thereof; finally, report on middle school special education teachers' current accommodations practices. | P | X | X | ||||||||
| Finch & Finch (2013a) | Compare effects of various types of accommodations on language performance scores for elementary students with various disabilities and students without disabilities; also, examine construct validity related to the accommodations. | P | X | |||||||||
| Finch & Finch (2013b) | Compare effects of various types of accommodations, individually and in combination, on mathematics and language performance scores for a nationally representative sample of elementary students with and without learning disabilities; also, examine construct validity related to the accommodations. | P | X | |||||||||
| Fincher (2013) | Compare effects of the oral delivery (read-aloud) accommodation during reading assessment for a stratified random sample of extant elementary student state data; also, summarize research concerning oral delivery of reading assessments. | P | X | |||||||||
| Freeman (2013) | Compare effects of providing three or four response choices on a state's alternate assessment based on modified achievement standards (AA-MAS), utilizing extant data sets; also, discuss issues about transitioning some students with disabilities from taking the AA-MAS to taking the state's general assessment; finally, summarize research on test design and testing students with disabilities. | P | X | X | ||||||||
| Hawpe (2013) | Inquire about the attitudes and willingness of secondary teachers about providing accommodations and modifications; also, report on accommodations and modifications and their use in a specific state; also, summarize the research on educators' attitudes and perceptions about disabilities and actions regarding accessibility; finally, discuss issues regarding factors related to accommodations decision-making. | P | X | X | X | |||||||
| Higgins & Katz (2013) | Compare effects of two oral delivery / audio representation approaches, literal and interpretive, via text-to-speech, on math assessment scores; also, inquire from middle and high school students with and without disabilities about their perceptions and preferences for literal or interpretive item presentation. | P | X | |||||||||
| Huggins & Elbaum (2013) | Compare effects of various accommodations provided during state science assessments for an extant data set of elementary school students with and without disabilities; also, ascertain construct validity related to various types of accommodations; finally, perform a score equity assessment, that is, analyze item-level responses for equating invariance. | P | X | X | ||||||||
| Ketterlin-Geller et al. (2014) | Develop an accommodations assignment screening test; also, analyze factors disrupting accurate mathematics performance scores and indicating students' need for specific accommodations; finally, discuss issues related to collecting information for accommodations selection. | X | X | P | ||||||||
| Klehm (2014) | Inquire about middle school general educators' and special educators' attitudes about engaging students with disabilities in high-stakes large-scale assessments and implementing accommodations for students with disabilities; also, report on these educators' current accommodations practices. | P | X | |||||||||
| Lee & Chen (2014) | Compare effects of physical versus virtual manipulatives on learning and performance in geometry for middle school students with different levels of prior knowledge. | P | ||||||||||
| Leppo et al. (2014) | Report on accommodations use by students with deafness and hearing impairments, along with co-occurring disabilities; also, summarize research about accommodations use by students with deafness and hearing impairments; finally, discuss issues about accommodations use patterns in relation to disability categories. | X | X | P | ||||||||
| Lewandowski et al. (2013) | Compare effects of two versions of extended time for postsecondary students with and without learning disabilities on reading comprehension performance; also, examine construct validity related to the extended-time accommodation. | P | X | |||||||||
| Lewandowski et al. (2014) | Inquire about the perceptions of postsecondary students with and without disabilities about examination accommodations. | P | ||||||||||
| Lewis & Nolan (2013) | Inquire about the perceptions of postsecondary students with sensory defensiveness about low-distraction accommodations provided during examinations; also, discuss issues related to distractedness during course exams when students were using other accommodations. | P | X | |||||||||
| Li (2014) | Summarize research concerning oral delivery of reading assessments; also, discuss issues of the factors most strongly influencing oral delivery's effects on assessment performance. | P | X | |||||||||
| Lin & Lin (2013) | Compare effects of various alternate setting accommodations for middle school English language learners with and without learning disabilities on mathematics assessment performance; also, ascertain construct validity related to setting accommodations. | P | X | |||||||||
| Lin & Lin (2014) | Compare effects of various setting accommodations, on mathematics scores for middle school students with and without learning disabilities; also, discuss issues about item completion rates among participant groups. | P | ||||||||||
| Lovett (2014) | Summarize recent empirical research on accommodations decision-making, especially contrasting postsecondary and K-12 processes; also, address issues of the Department of Justice implementation guidelines of the Americans With Disabilities Act 2008 amendments in relation to recent empirical research findings. | P | X | |||||||||
| Lovett & Leja (2013) | Summarize literature on the perceptions, preferences, and reactions of students with disabilities regarding specific accommodations or accommodations in general; also, discuss issues including test-takers' sense of accommodations' effectiveness and helpfulness, and including benefits such as reduction of discomfort and anxiety during assessment. | P | X | |||||||||
| Lyman (2013) | Inquire about the perceptions of postsecondary students with various disabilities regarding accommodations and barriers to their use; also, summarize the limited research on barriers to accommodation use; finally, discuss issues about postsecondary students facing various difficulties accessing accommodations. | P | X | X | ||||||||
| May (2013) | Inquire about the attitudes, intent to provide accommodations, and knowledge of disability legislation, of postsecondary nursing faculty members; also, summarize research on perceptions and awareness of accommodations at the postsecondary level. | P | X | |||||||||
| May & Stone (2014) | Compare effects of the extended time accommodation for postsecondary students with and without learning disabilities during a simulated graduate admission assessment framed in differing terms to participants; also, summarize research concerning postsecondary students' performance on large-scale assessments. | P | X | |||||||||
| Meyer & Bouck (2014) | Compare effects of oral delivery via text-to-speech on reading assessment scores on comprehension, fluency, and completion time, for middle school students with reading disabilities; also, inquire about students' perceptions of the accommodation. | P | X | |||||||||
| Miller et al. (2013) | Compare effects of extended time for postsecondary students with and without attention-related disabilities during a large-scale reading assessment. | P | ||||||||||
| Nees & Berry (2013) | Summarize research on oral delivery accommodations via text-to-speech systems; also, discuss issues such as the tendency to couple oral delivery and extended time accommodations. | P | X | |||||||||
| Newman & Madaus (2014) | Using data from the National Longitudinal Transition Study–2, report on accommodations use and implementation practices in a postsecondary setting; also, inquire from a nationally representative cohort of students with disabilities about their perspectives of postsecondary programs, including accommodations. | X | P | |||||||||
| Overton (2013) | Compare effects of the test-takers reading aloud and silently on reading comprehension for elementary students with reading disabilities; also, summarize the literature on accommodations' effects on reading comprehension of passage reading; finally, analyze the scoring patterns for narrative and expository text types and students' need for accommodation. | P | X | |||||||||
| Russell (2014) | Analyze extant mathematics assessment data for effects of calculator use or non-use for middle school students with learning disabilities; also, summarize the literature on calculator accommodations for students with learning disabilities. | P | X | |||||||||
| Schreuer & Sachs (2014) | Report about accommodations commonly used by postsecondary students with disabilities; also, inquire about postsecondary students with disabilities' appraisals of efficacy of accommodations, as part of establishing the validity and reliability of the Physical, Human and Academic Accommodation Services (PHAAS) survey. | X | P | |||||||||
| Smith (2014) | Inquire about the perceptions of postsecondary students with invisible disabilities regarding accommodations experiences, including in relation to previous high school experiences; also, report on recent accommodations use and barriers to use; finally, summarize the research on postsecondary students' access to and barriers to using accommodations. | P | X | X | ||||||||
| Smith & Riccomini (2013) | Compare effects of noise-reducing headphones on reading comprehension performance for elementary students with and without learning disabilities. | P | ||||||||||
| Stein (2013) | Report on accommodations experiences of postsecondary students with mental health disabilities; inquire about these postsecondary students' perceptions of benefits and challenges of accommodations. | X | P | |||||||||
| Stone (2013) | Inquire about the perceptions of students with learning disabilities about adaptive testing and accommodations; also, examine construct validity related to the oral delivery accommodation. | P | X | |||||||||
| Szarko et al. (2013) | Compare effects of familiar and unfamiliar test administrator on verbal and performance scores of cognitive testing normed on students with autism, including observation of students' test-taking behaviors. | P | ||||||||||
| Torres (2014) | Report on case studies of the first-year postsecondary educational transition and experience of students with Autism Spectrum Disorders (ASD), including their perceptions of accommodations; also, summarize the limited research on postsecondary students with ASD and their experiences from high school to college. | P | X | |||||||||
| Wadley & Liljequist (2013) | Compare effects of extended time for postsecondary students with and without attention-related disabilities during a large-scale mathematics placement assessment; also, discuss issues regarding mood and self-esteem related to assessment. | P | X | |||||||||
| Wizikowski (2013) | Report on recent accommodations use by postsecondary students with disabilities, including in public and private higher education institutions; also, inquire about perceptions of postsecondary students with various disabilities about accommodations and supports; finally, summarize the research about postsecondary students' accommodations experiences. | X | X | P | ||||||||
| Worland (2014) | Compare effects of prompting conditions (unsupported and supported) on elementary students' writing performance in informational report, narrative, and persuasive genres; also, summarize research on writing performance related to prior knowledge and task. | P | X | |||||||||
| Yakubova & Bouck (2014) | Compare effects of two types of calculators, scientific and graphing, on mathematics performance in computation and word problems, for elementary students with intellectual disabilities; also, inquire about the students' perceptions and preferences regarding the calculators. | P | X | |||||||||
| Young (2013) | Report on recent accommodations implementation and use as provided by postsecondary faculty; also, inquire about knowledge and perceptions of postsecondary advisors about accommodations; finally, summarize the research about perspectives and practices of academic advisors regarding accommodations and supports. | X | X | P | ||||||||
| Zebehazy & Wilton (2014) | Inquire about the perceptions of teachers of students with visual impairments about print and tactile graphics used particularly in science classrooms and on science assessments; also, report on graphics use in science assessment accommodations. | P | X | |||||||||
| Zhang et al. (2014) | Compare effects of an integrated object representation (IOR) accommodation on the geometry assessment performance for elementary students with and without geometry-related disabilities. | P | ||||||||||
A-Effects [SwD] = Compare effects of accommodations on assessment scores [only students with disabilities]
A-Effects [non] = Compare effects of accommodations on assessment scores [only students without disabilities]
A-Effects [both] Compare effects of accommodations on assessment scores [both students with and without disabilities]
B-Perceptions = Study/compare perceptions and preferences about use
C-Reviews = Summarize research on test accommodations
D-Issues = Discuss issues
E-Implement/Use = Report on implementation practices and accommodations use
F-Items = Compare test items
G-Validity = Investigate test validity
H-Develop = Develop test
I-Accomm. Need = Identify predictors of the need for test accommodations
P = Primary Purpose
X = Other Purpose
Top of Page | Table of Contents
Table B-1. Reference Types, Research Types, Research Designs, Data Collection Sources, and Collection Instruments
| Authors | Reference Type | Research Type | Research Design | Data Collection Source | Collection Instrument |
|---|---|---|---|---|---|
| Abedi & Ewers (2013) | Report | Qualitative | Descriptive Qualitative | Secondary | Articles |
| Alkahtani (2013) | Journal | Qualitative | Descriptive Qualitative | Primary | Interview Protocol, Survey |
| Barnhill (2014) | Journal | Quantitative | Descriptive Quantitative | Primary | Interview Protocol, Survey |
| Berger & Lewandowski (2013) | Journal | Quantitative | Quasi-Experimental | Primary | Survey, Test |
| Botello (2014) | Dissertation | Quantitative | Quasi-Experimental | Primary | Observations, Test |
| Brumfield (2014) | Dissertation | Quantitative | Quasi-Experimental | Primary | Articles, Test |
| Buzick & Stone (2014) | Journal | Quantitative | Meta-analysis | Secondary | Articles |
| Cawthon & Leppo (2013) | Journal | Qualitative | Descriptive Qualitative | Secondary | Articles |
| Cawthon et al. (2013a) | Journal | Mixed | Descriptive Quantitative | Primary | Test |
| Cawthon et al. (2013b) | Journal | Mixed | Quasi-Experimental | Primary | Focus Group, Interview Protocol, Survey |
| Crawford & Ketterlin-Geller (2013) | Journal | Qualitative | Descriptive Qualitative | Primary | Interview Protocol |
| Finch & Finch (2013a) | Journal | Quantitative | Descriptive Quantitative | Primary | Test |
| Finch & Finch (2013b) | Journal | Quantitative | Quasi-Experimental | Secondary | Test |
| Fincher (2013) | Dissertation | Mixed | Quasi-Experimental | Primary | Survey, Test |
| Freeman (2013) | Dissertation | Quantitative | Descriptive Quantitative | Secondary | Test |
| Hawpe (2013) | Dissertation | Quantitative | Descriptive Quantitative | Primary | Survey |
| Higgins & Katz (2013) | Journal | Mixed | Quasi-Experimental | Primary | Interview Protocol, Test |
| Huggins & Elbaum (2013) | Journal | Quantitative | Quasi-Experimental | Secondary | Test |
| Ketterlin-Geller et al. (2014) | Journal | Qualitative | Descriptive Qualitative | Primary | Survey |
| Klehm (2014) | Journal | Mixed | Descriptive Quantitative | Primary | Survey |
| Lee & Chen (2014) | Journal | Quantitative | Quasi-Experimental | Primary | Test |
| Leppo et al. (2014) | Journal | Quantitative | Correlation/Prediction | Secondary | Survey |
| Lewandowski et al. (2013) | Journal | Quantitative | Quasi-Experimental | Primary | Survey, Test |
| Lewandowski et al. (2014) | Journal | Quantitative | Descriptive Quantitative | Primary | Survey |
| Lewis & Nolan (2013) | Journal | Qualitative | Descriptive Qualitative | Primary | Focus Group. Survey |
| Li (2014) | Journal | Quantitative | Meta-analysis | Secondary | Articles |
| Lin & Lin (2013) | Journal | Quantitative | Quasi-Experimental | Secondary | Test |
| Lin & Lin (2014) | Journal | Quantitative | Quasi-Experimental | Secondary | Test |
| Lovett (2014) | Journal | Expository/Opinion | Descriptive Qualitative | Secondary | Articles |
| Lovett & Leja (2013) | Journal | Qualitative | Descriptive Qualitative | Secondary | Articles |
| Lyman (2013) | Dissertation | Qualitative | Descriptive Qualitative | Primary | Interview Protocol |
| May (2013) | Dissertation | Quantitative | Descriptive Quantitative | Primary | Survey |
| May & Stone (2014) | Journal | Quantitative | Quasi-Experimental | Primary | Survey, Test |
| Meyer & Bouck (2014) | Journal | Mixed | Experimental | Primary | Interview Protocol, Test |
| Miller et al. (2013) | Journal | Quantitative | Quasi-Experimental | Primary | Survey, Test |
| Nees & Berry (2013) | Journal | Qualitative | Descriptive Qualitative | Secondary | Articles |
| Newman & Madaus (2014) | Journal | Quantitative | Descriptive Quantitative | Secondary | Interview Protocol |
| Overton (2013) | Dissertation | Quantitative | Quasi-Experimental | Primary | Test |
| Russell (2014) | Dissertation | Quantitative | Quasi-Experimental | Secondary | Test |
| Schreuer & Sachs (2014) | Journal | Quantitative | Descriptive Quantitative | Primary | Grades, Survey |
| Smith (2014) | Dissertation | Qualitative | Descriptive Qualitative | Primary | Interview Protocol |
| Smith & Riccomini (2013) | Journal | Quantitative | Quasi-Experimental | Primary | Test |
| Stein (2013) | Journal | Qualitative | Descriptive Qualitative | Primary | Interview Protocol |
| Stone et al. (2013) | Report | Quantitative | Descriptive Quantitative | Primary | Survey |
| Szarko et al. (2013) | Journal | Quantitative | Quasi-Experimental | Primary | Observations, Test |
| Torres (2014) | Dissertation | Qualitative | Descriptive Qualitative | Primary | Interview Protocol |
| Wadley & Liljequist (2013) | Journal | Quantitative | Quasi-Experimental | Primary | Survey, Test |
| Wizikowski (2013) | Dissertation | Mixed | Descriptive Quantitative | Primary | Survey |
| Worland (2014) | Dissertation | Quantitative | Quasi-Experimental | Primary | Test |
| Yakubova & Bouck (2014) | Journal | Mixed | Quasi-Experimental | Primary | Observations, Survey, Test |
| Young (2013) | Dissertation | Mixed | Descriptive Quantitative | Primary | Survey |
| Zebehazy & Wilton (2014) | Journal | Quantitative | Descriptive Quantitative | Primary | Survey |
| Zhang et al. (2014) | Journal | Quantitative | Quasi-Experimental | Primary | Test |
Top of Page | Table of Contents
Table C-1. Instrument Types and Specific Instruments Used, and Their Sources
| Authors | Non-Academic Protocols or Surveys Developed by Study Authors | Surveys or Academic Tests Developed by Professionals or Researchers Using Sources Outside of Current Study | Norm-referenced Academic Achievement Measures | State Criterion-referenced Assessment | Norm-referenced Cognitive Ability Measures |
|---|---|---|---|---|---|
| Abedi & Ewers (2013) | No instrument information for this literature review study | ||||
| Alkahtani (2013) | Online survey about teachers' knowledge about and use of assistive technology | ||||
| Barnhill (2014) | No instrument information for this literature review study | ||||
| Berger & Lewandowski (2013) | Survey gathering demographic data, information on accommodations experience as well as past writing difficulties, tutoring in writing, computer experience, and identifying relative preferences about word processing and handwriting; also, Number Writing Task measuring typing speed | Calculation subtest and Writing Fluency subtest of the Woodcock Johnson III Tests of Achievement (WJ-III; Woodcock, McGrew, & Mather, 2001); Written Expression subtest of the Wechsler Individual Achievement Test-Second Edition (WIAT-II, Wechsler, 2002) | |||
| Botello (2014) | Teacher observation of positive test engagement behaviors for a subset of student participants | STAR Enterprise Reading (Renaissance Learning, 2012) -- a 35-item reading comprehension assessment administered via computer | 2012 Missouri Assessment Program (MAP) communication arts assessment data (2013) | ||
| Brumfield (2014) | Georgia High School Graduation Test (GHSGT) in science | ||||
| Buzick & Stone (2014) | In this meta-analysis, individual study results were examined using state academic content assessment data throughout grades K-12 for mathematics and reading | ||||
| Cawthon & Leppo (2013) | Focus groups of professionals and students who were deaf or hard of hearing administered at regional and national conferences | Online survey of professionals beyond scope of this study (Cawthon & Research and Evidence Synthesis Team, 2012) | |||
| Cawthon et al. (2013a) | The field test (with nine items per grade) of a state assessment in science and English language arts for students in grades 3, 4, and 5 | ||||
| Cawthon et al. (2013b) | In this meta-analysis, individual study results were examined using large-scale and classroom assessments throughout grades K-12 and postsecondary; the academic content measured included mathematics, reading, science, and history | In this meta-analysis, individual study results were examined, including one using an intelligence test | |||
| Crawford & Ketterlin-Geller (2013) | A series of interview questions designed to discern teacher participants' knowledge of and attitudes toward accommodations and accommodations policies, and their accommodations decision-making processes | ||||
| Finch & Finch (2013a) | 20 items from an unspecified national English language arts achievement test | ||||
| Finch & Finch (2013b) | Unspecified national achievement test of English language arts and mathematics | ||||
| Fincher (2013) | Participant students' teachers completed surveys about the nature of students' special education instruction (e.g., proportion of academic time in general education, grade level of instruction for these fourth graders), and teachers' rating of degree of students' disabilities | Iowa Test of Basic Skills (Hoover, Dunbar, Frisbie, Oberley, Bray, Naylor, Lewis, Ordman, & Qualls, 2003) scores were also accessed by the researcher for identifying reading skill levels | Georgia Criterion-Referenced Competency Test in reading, 3rd grade level, were collected from these grade 4 participants | ||
| Freeman (2013) | North Carolina alternate assessment based on modified assessment standards (NCEXTEND2) | ||||
| Hawpe (2013) | Demographic survey | Attitudes Towards Persons with Disabilities (ATDP) Scales (Yuker, Block, & Campbell, 1986), with terminology adjustments; and accommodations survey (Lambert, Dodd, Christensen, & Fishbaugh, 1996), adapted for participants and context | |||
| Higgins & Katz (2013) | Survey items about student preferences regarding the literal and interpretive forms, along with cognitive labs, a semi-structured interview format | Released items from state mathematics assessments in Ohio, Virginia, Massachusetts, and Arizona; 10-12 items were used in each study in sets of two similar items each, in order to compare the audio representation of the items in both literal and interpretive forms | |||
| Huggins & Elbaum (2013) | Item-level scores for the 191,906 students who completed the (unspecified) state science assessment in 2009 | ||||
| Ketterlin-Geller et al. (2014) | Screening to Assign Accommodations Tool (SAAT) | ||||
| Klehm (2014) | High-stakes Testing and Students with Disabilities: A Teacher Attitude Survey (HST-SWD; Klehm, 2013) | Participants' students' group achievement data on the New England Common Assessment Program achievement test (reading, math, and science), from the InfoWorks Rhode Island website | |||
| Lee & Chen (2014) | Mathematics attitude scale (Lee & Yuan, 2010) | Intelligence test (Lu, Cheng, & Lu, 1991) | |||
| Leppo et al. (2014) | Demographic data collected from and about schools at which participants were employed | National Longitudinal Transition Study 2 (NLTS2) data set, including the disability statuses of deaf and hard-of-hearing with any additional disability (n=310), deaf and hard-of-hearing with learning disabilities (LD; n=90), and deaf and hard-of-hearing with attention deficit hyperactivitiy disorder (ADHD; n=110) | |||
| Lewandowski et al. (2013) | Demographic survey, which included accommodations experience questions | Nelson-Denny Reading Test (Brown, Fishco, & Hanna, 1993) Forms G and H, subtest on reading comprehension | |||
| Lewandowski et al. (2014) | Survey measuring perceptions about the extent to which each accommodation would help (or not) on either a classroom exam or a high-stakes assessment, along with demographic data and accommodations experience | ||||
| Lewis & Nolan (2013) | Questionnaire (designed by occupational therapists and disability service personnel study participants) with Likert-scale and open-ended items about experiences with testing spaces in which auditory (i.e., noise levels) and visual distractions, as well as ambient temperature conditions; focus group question series about the piloting of low distraction exam settings | ||||
| Li (2014) | This meta-analysis had studies using mathematics and reading assessments administered to grade K-12 students | ||||
| Lin & Lin (2013) | 2005-2006 mathematics test data from Ontario's provincial standardized testing program | ||||
| Lin & Lin (2014) | 2005 and 2006 mathematics and reading test data from Ontario's provincial standardized testing program | ||||
| Lovett (2014) | No instrument information for this literature review study | ||||
| Lovett & Leja (2013) | No instrument information for this literature review study | ||||
| Lyman (2013) | Interview questions pertaining to participants' experiences of barriers to accommodations use | ||||
| May (2013) | Online survey about postsecondary nursing faculty members' attitudes, intent to provide accommodations, and knowledge of disability law and policy | ||||
| May & Stone (2014) | Verbal section of Graduate Record Examination (GRE; Educational Testing Service, 2010) | ||||
| Meyer & Bouck (2014) | Interview questions about participants' experiences with accommodations | Wechsler Individual Achievement Test-Second Edition (WIAT-II; Wechsler, 2005), Woodcock Reading Mastery Tests-Revised/Normative Update (WRMT-R/NU; Woodcock, 1987/1998), Six-Way Paragraphs, Middle Level (Pauk, 2010), CBM Lite Edition (University of Oregon, 2006-2012) | Wechsler Intelligence Scale for Children (WISC-IV; Wechsler, 2004) and Woodcock-Johnson Tests of Cognitive Abilities III (WJIII; Woodcock, Mather, & McGrew, 2001) | ||
| Miller et al. (2013) | Nelson-Denny Reading Test (NDRT; Brown, Fishco, & Hanna, 1993) Forms G & H, subtest on reading comprehension | ||||
| Nees & Berry (2013) | No instrument information for this literature review study | ||||
| Newman & Madaus (2014)2 | |||||
| Overton (2013) | Special education teachers of the eleven student participants also completed demographic information forms about the students | Reading comprehension as measured using reading passages and items from the Qualitative Reading Inventory 5th Edition (QRI-5; Leslie & Caldwell, 2011) and Informal Reading Inventory, Eighth Edition (IRI; Roe & Burns, 2011) | |||
| Russell (2014) | IEP records were examined as part of the initial sampling procedure, and to develop participant comparison groups | South Carolina's Palmetto Assessment of State Standards (PASS); for comparison purposes (between grade levels), the total scale scores were converted into Normal curve equivalent scores | |||
| Schreuer & Sachs (2014) | Student participants completed a survey titled the Physical, Human and Academic Accommodation Services (PHAAS) scale, which inquired both about students' use of and appraisal of the usefulness of various accommodations; and also survey items about demographics, grade point averages, and the number of courses taken per year, and disability-related questions such as diagnoses, age at onset of disability, and degree of independence | College Student Experiences Questionnaire (CSEQ, Pace & Kuh, 1998; Kuh, Gonyea, Kish, Muthiah, & Thomas, 2003) | |||
| Smith (2014) | Semi-structured interview protocol | ||||
| Smith & Riccomini (2013) | Reading comprehension as assessed using the Qualitative Reading Inventory-5 (Leslie & Caldwell, 2011) | ||||
| Stein (2013) | Interview questions | ||||
| Stone et al. (2013) | English language arts test items were based on the reading framework for the 2009 National Assessment of Educational Progress (National Assessment Governing Board, 2008) | ||||
| Szarko et al. (2013) | Observations of student test-takers during tests were made by independent observers not aware of test participants' assigned test conditions (familiar or unfamiliar examiner), pertaining to (1) number of examiner prompts, (2) number of items refused by student, and (3) instances of atypical behaviors exhibited | Psychoeducational Profile-Revised (Schopler, Reichler, Bashford, Lansing, & Marcus, 1990), cognitive performance and cognitive verbal subtests (for students with autism) | |||
| Torres (2014) | Interview questions | ||||
| Wadley & Liljequist (2013) | Measures of moods and emotions: the Positive Affect Negative Affect Schedule (PANAS; Watson, Clark, & Tellegen, 1988) and the State Self-Esteem Scale (SSES; Heatherton & Polivy, 1991) | Mathematics postsecondary placement examination scores, as measured by the Kentucky Online Testing program (KYOTE) | |||
| Wizikowski (2013) | Student participant survey about accommodations and supports use patterns, including usefulness and satisfaction ratings | ||||
| Worland (2014) | Analytic rubric of writing quality modeled after rubrics from the PARCC and SBAC consortia; curriculum based measure of total word count | Contextual Writing subtest of the Test of Early Written Language-III (TEWL-III; Hresko, Herron, Peak, & Hicks, 2012) | English language arts / reading districtwide assessment scores were used as an independent reference point | ||
| Yakubova & Bouck (2014) | Accuracy--measured in scores on a set of five mathematical problem-solving items and five computation items requiring subtraction, and efficiency--measured in time duration for completing each item | ||||
| Young (2013) | Survey about educators' perceptions of graphics quality and graphics use by students with visual impairments | ||||
| Zebehazy & Wilton (2014) | Online survey inquiring about educators' perceptions about graphics quality and graphics use by students with visual impairments | ||||
| Zhang et al. (2014) | Geometry problem solving test items were developed from Florida Comprehensive Assessment Test curriculum supplemental materials | ||||
| TOTAL | 26 | 13 | 15 | 15 | 3 |
Appendix C Table C-2. Content Areas Assessed
| Authors | Math | Reading | Writing |
Other LA |
Science |
Social Studies |
Intelligence Test |
Psychology |
Not Specific |
N |
|---|---|---|---|---|---|---|---|---|---|---|
| Berger & Lewandowski (2013) | • | 1 | ||||||||
| Botello (2014) | • | 1 | ||||||||
| Brumfield (2014) | • | 1 | ||||||||
| Buzick & Stone (2014) | • | 1 | ||||||||
| Cawthon & Leppo (2013) | • | • | • | 3 | ||||||
| Cawthon et al. (2013a) | •a | • | 2 | |||||||
| Finch & Finch (2013a) | •b | 1 | ||||||||
| Finch & Finch (2013b) | • | • | 2 | |||||||
| Fincher (2013) | • | 1 | ||||||||
| Freeman (2013) | • | • | • | 3 | ||||||
| Higgins & Katz (2013) | • | 1 | ||||||||
| Huggins & Elbaum (2013) | • | 1 | ||||||||
| Lee & Chen (2014) | • | 1 | ||||||||
| Lewandowski et al. (2013) | • | 1 | ||||||||
| Li (2014) | • | • | 2 | |||||||
| Lin & Lin (2013) | • | 1 | ||||||||
| Lin & Lin (2014) | • | • | 2 | |||||||
| Lovett (2014) | • | • | 2 | |||||||
| May & Stone (2014) | • | • | 2 | |||||||
| Meyer & Bouck (2014) | • | 1 | ||||||||
| Miller et al. (2013) | • | 1 | ||||||||
| Nees & Berry (2013) | • | • | 2 | |||||||
| Overton (2013) | • | 1 | ||||||||
| Russell (2014) | • | 1 | ||||||||
| Smith & Riccomini (2013) | • | 1 | ||||||||
| Szarko et al. (2013) | • | 1 | ||||||||
| Wadley & Liljequist (2013) | • | 1 | ||||||||
| Worland (2014) | • | 1 | ||||||||
| Yakubova & Bouck (2014) | • | 1 | ||||||||
| Zhang et al. (2014) | • | 1 | ||||||||
| TOTAL | 14 | 16 | 2 | 3 | 5 | 0 | 1 | 0 | 0 | 41 |
Note: This table encompasses the subset of studies (n=30) which used assessments or tests on academic content area/s or cognitive skills; studies that were excluded used surveys or other data collection mechanisms only.
a In this study, other LA = a state's English language arts performance score, which was not termed "reading."
b In this study, other LA = a national language achievement test score, which was not termed "reading."
Top of Page | Table of Contents
Table D-1. Unit of Analysis, Total Sample Sizes, Grade/Education Level, and Types of Disabilities
| Authors |
Unit of Analysis |
Sample Size |
Percent of Sample with Disabilities |
Grade / Education Level |
Disability Types Included in Sample |
|---|---|---|---|---|---|
| Abedi & Ewers (2013) | N/A | N/A | N/A | N/A | N/A |
| Alkahtani (2013) | Educators | 127 | 0% | No age | N/A |
| Barnhill (2014) | Educators | 30 | 0% | No age | N/A |
| Berger & Lewandowski (2013) | Students | 98 | 31% | Postsecondary | LD, None |
| Botello (2014) | Students | 316 | 0% | Grades 2, 3, 4, 5, & 6 | None |
| Brumfield (2014) | Students | 18 | 50% | Grade 11 | LD, None |
| Buzick & Stone (2014) | Students | 17442 | 37% | Elementary, Middle school, High school | LD, None |
| Cawthon & Leppo (2013) | N/A | N/A | N/A | N/A | N/A |
| Cawthon et al. (2013a) | Students | 16468 | 10% | Grades 3, 4, & 5 | HI, LD, None |
| Cawthon et al. (2013b) | Educators | 1350 | 0% | No age | N/A |
| Crawford & Ketterlin-Geller (2013) | Educators | 20 | 0% | No age | N/A |
| Finch & Finch (2013a) | Students | 5966 | 11% | Grade 3 | AP, A, EBD, HI, ID, LD, PD, S/L, V/I, Mult., None |
| Finch & Finch (2013b) | Students | 2553 | 21% | Grade 3 | EBD, ID, LD, S/L, None |
| Fincher (2013) | Students | 664 | 48% | Grade 4 | AP, A, EBD, HI, ID, LD, PD, S/L, None |
| Freeman (2013) | Students | 2404 | 100% | Grades 3-8, 9, 10 | A, EBD, HI, ID, LD, PD, S/L, TBI, VI, Mult. |
| Hawpe (2013) | Educators | 529 | 0% | No age | N/A |
| Higgins & Katz (2013) | Students | 229 | 55% | Grades 5-8, 9-12 | LD, VI, None |
| Huggins & Elbaum (2013) | Students | 191906 | 15% | Grade 5 | AP, A, EBD, HI, ID, LD, PD, S/L, VI, Mult., None |
| Ketterlin-Geller et al. (2014) | Educators | 6 | 0% | No age | N/A |
| Klehm (2014) | Educators | 218 | 0% | No age | N/A |
| Lee & Chen (2014) | Students | 145 | 0% | Grade 8 | None |
| Leppo et al. (2014) | Students | 630 | 100% | ages 13-17 | AP, A, HI, LD, Mult., VI |
| Lewandowski et al. (2013) | Students | 76 | 34% | Postsecondary | LD, None |
| Lewandowski et al. (2014) | Students | 612 | 22% | Postsecondary | AP, EBD, HI, LD, PD, VI, Mult., None |
| Lewis & Nolan (2013) | Educators, Students | 102 | 100% | Postsecondary | AP, A |
| Li (2014) | Students | 114 | 47% | Elementary, Middle school, High school | LD, None |
| Lin & Lin (2013) | Students | 114034 | 2% | Grade 6 | LD, None |
| Lin & Lin (2014) | Students | 8831 | 45% | Grade 6 | LD, None |
| Lovett (2014) | N/A | N/A | N/A | N/A | N/A |
| Lovett & Leja (2013) | N/A | N/A | N/A | N/A | N/A |
| Lyman (2013) | Students | 16 | 100% | Postsecondary | AP, A, EBD, LD, PD, VI |
| May & Stone (2014) | Students | 101 | 29% | Postsecondary | LD, None |
| May (2013) | Educators | 231 | 0% | No age | N/A |
| Meyer & Bouck (2014) | Students | 3 | 100% | Grades 7 & 8 | LD |
| Miller et al. (2013) | Students | 76 | 50% | Postsecondary | AP, EBD, LD, Mult., None |
| Nees & Berry (2013) | N/A | N/A | N/A | N/A | N/A |
| Newman & Madaus (2014) | Educators, Students | 3190 | 100% | High school, Postsecondary | AP, A, EBD, HI, ID, LD, PD, S/L, VI, Mult. |
| Overton (2013) | Educators, Students | 11 | 100% | Grade 5 | LD |
| Russell (2014) | Students | 42 | 100% | Grades 6, 7, & 8 | LD |
| Schreuer & Sachs (2014) | Students | 170 | 100% | Postsecondary | EBD, HI, PD, VI, Mult. |
| Smith & Riccomini (2013) | Students | 254 | 20% | Grades 3, 4, & 5 | AP, A, EBD, LD, PD, S/L, Mult., None |
| Smith (2014) | Students | 5 | 100% | Postsecondary | AP, LD, PD, Mult. |
| Stein (2013) | Students | 16 | 100% | Postsecondary | AP, EBD, LD, Mult. |
| Stone et al. (2013) | Students | 262 | 100% | Grade 8 | LD |
| Szarko et al. (2013) | Students | 26 | 100% | ages 4-7 | A |
| Torres (2014) | Educators, Parents, Students | 4 | 100% | Postsecondary | A |
| Wadley & Liljequist (2013) | Students | 129 | 47% | Postsecondary | AP, LD, None |
| Wizikowski (2013) | Students | 113 | 100% | Postsecondary | A, EBD, HI, ID, LD, PD, VI, Mult. |
| Worland (2014) | Students | 63 | 19% | Grades 3 & 5 | LD, None |
| Yakubova & Bouck (2014) | Students | 5 | 100% | Grade 5 | ID |
| Young (2013) | Educators | 399 | 0% | No age | N/A |
| Zebehazy & Wilton (2014) | Educators | 306 | 0% | No age | N/A |
| Zhang et al. (2014) | Students | 118 | 14% | Grades 3-5 | LD, None |
AP: Attention Problem
A: Autism
EBD: Emotional/Behavioral Disability
HI: Hearing Impairment / Deafness
ID: Intellectual Disability
LD: Learning Disability
PD: Physical Disability
S/L: Speech/Language Disability
TBI: Traumatic Brain Injury
V/I: Visual Impairment / Blindness
Mult.: Multiple Disabilities
None: Students without Disabilities
Top of Page | Table of Contents
Table E-1. Presentation Accommodations Itemized by Study
| Authors | Braille | Clarify Directions | Computer Administration | Examiner Familiarity | Format | Large Print |
|---|---|---|---|---|---|---|
| Botello (2014) | 1 | |||||
| Brumfield (2014) | ||||||
| Buzick & Stone (2014) | ||||||
| Cawthon & Leppo (2013) | ||||||
| Finch & Finch (2013a) | 1 | |||||
| Finch & Finch (2013b) | ||||||
| Fincher (2013) | ||||||
| Freeman (2013) | 1 | |||||
| Hawpe (2013) | 1 | |||||
| Higgins & Katz (2013) | 1 | |||||
| Huggins & Elbaum (2013) | 1 | 1 | ||||
| Lee & Chen (2014) | 1 | |||||
| Lewandowski et al. (2014) | 1 | |||||
| Li (2014) | ||||||
| Lovett & Leja (2013) | ||||||
| Meyer & Bouck (2014) | 1 | |||||
| Nees & Berry (2013) | ||||||
| Overton (2013) | ||||||
| Schreuer & Sachs (2014) | 1 | |||||
| Stone et al. (2013) | 1 | |||||
| Szarko et al. (2013) | 1 | |||||
| Zhang et al. (2014) | ||||||
| TOTAL | 1 | 1 | 5 | 1 | 2 | 3 |
Table E-1 (continued). Presentation Accommodations Itemized by Study
| Authors | Read Aloud / Oral Delivery | Read Directions | Signed Administration | Student Read Aloud | Visual Cues | TOTAL |
|---|---|---|---|---|---|---|
| Botello (2014) | 1 | |||||
| Brumfield (2014) | 1 | 1 | ||||
| Buzick & Stone (2014) | 1 | 1 | ||||
| Cawthon & Leppo (2013) | 1 | 1 | 2 | |||
| Finch & Finch (2013a) | 1 | 1 | 3 | |||
| Finch & Finch (2013b) | 1 | 1 | 2 | |||
| Fincher (2013) | 1 | 1 | ||||
| Freeman (2013) | 1 | |||||
| Hawpe (2013) | 1 | |||||
| Higgins & Katz (2013) | 1 | 2 | ||||
| Huggins & Elbaum (2013) | 2 | |||||
| Lee & Chen (2014) | 1 | 2 | ||||
| Lewandowski et al. (2014) | 1 | 2 | ||||
| Li (2014) | 1 | 1 | ||||
| Lovett & Leja (2013) | 1 | 1 | ||||
| Meyer & Bouck (2014) | 1 | 2 | ||||
| Nees & Berry (2013) | 1 | 1 | ||||
| Overton (2013) | 1 | 1 | ||||
| Schreuer & Sachs (2014) | 1 | 2 | ||||
| Stone et al. (2013) | 1 | 2 | ||||
| Szarko et al. (2013) | 1 | |||||
| Zhang et al. (2014) | 1 | 1 | ||||
| TOTAL | 14 | 2 | 1 | 2 | 2 |
Table E-2. Equipment Accommodations Itemized by Study
| Authors | Computer Administration | Physical Supports | Screen Display | Technological Aid | TOTAL |
|---|---|---|---|---|---|
| Botello (2014) | 1 | 1 | 2 | ||
| Cawthon & Leppo (2013) | 1 | 1 | |||
| Higgins & Katz (2013) | 1 | 1 | |||
| Huggins & Elbaum (2013) | 1 | 1 | |||
| Lee & Chen (2014) | 1 | 1 | |||
| Meyer & Bouck (2014) | 1 | 1 | |||
| Smith & Riccomini (2013) | 1 | 1 | |||
| Stone et al. (2013) | 1 | 1 | |||
| Zebehazy & Wilton (2014) | 1 | 1 | |||
| TOTAL | 5 | 1 | 1 | 3 |
Table E-3. Response Accommodations Itemized by Study
| Authors | Calculator | Computer Administration | Dictated Response | TOTAL |
|---|---|---|---|---|
| Botello (2014) | 1 | 1 | ||
| Finch & Finch (2013a) | 1 | 1 | ||
| Finch & Finch (2013b) | 1 | 1 | 2 | |
| Hawpe (2013) | 1 | 1 | 2 | |
| Higgins & Katz (2013) | 1 | 1 | ||
| Lee & Chen (2014) | 1 | 1 | ||
| Lewandowski et al. (2014) | 1 | 1 | ||
| Meyer & Bouck (2014) | 1 | 1 | ||
| Russell (2014) | 1 | 1 | ||
| Schreuer & Sachs (2014) | 1 | 1 | ||
| Stone et al. (2013) | 1 | 1 | ||
| Yakubova & Bouck (2014) | 1 | 1 | ||
| TOTAL | 4 | 5 | 5 |
Table E-4. Scheduling Accommodations Itemized by Study
| Authors | Extended Time | Test Breaks | TOTAL |
|---|---|---|---|
| Barnhill (2014) | 1 | 1 | |
| Cawthon & Leppo (2013) | 1 | 1 | |
| Crawford & Ketterlin-Geller (2013) | 1 | 1 | |
| Finch & Finch (2013a) | 1 | 1 | |
| Finch & Finch (2013b) | 1 | 1 | |
| Hawpe (2013) | 1 | 1 | |
| Huggins & Elbaum (2013) | 1 | 1 | |
| Lewandowski et al. (2013) | 1 | 1 | |
| Lewandowski et al. (2014) | 1 | 1 | 2 |
| Lovett & Leja (2013) | 1 | 1 | |
| May & Stone (2014) | 1 | 1 | |
| Miller et al. (2013) | 1 | 1 | |
| Overton (2013) | 1 | 1 | |
| Schreuer & Sachs (2014) | 1 | 1 | |
| Smith (2014) | 1 | 1 | |
| Stein (2013) | 1 | 1 | |
| Wadley & Liljequist (2013) | 1 | 1 | |
| TOTAL | 17 | 1 |
Table E-5. Setting Accommodations Itemized by Study
| Authors | Individual | Small Group | Specialized Setting | TOTAL |
|---|---|---|---|---|
| Barnhill (2014) | 1 | 1 | ||
| Finch & Finch (2013a) | 1 | 1 | ||
| Finch & Finch (2013b) | 1 | 1 | ||
| Lewandowski et al. (2014) | 1 | 1 | ||
| Lewis & Nolan (2013) | 1 | 1 | 1 | 3 |
| Lin & Lin (2013) | 1 | 1 | ||
| Lin & Lin (2014) | 1 | 1 | ||
| Lovett & Leja (2013) | 1 | 1 | ||
| Overton (2013) | 1 | 1 | ||
| Smith (2014) | 1 | 1 | ||
| Stein (2013) | 1 | 1 | ||
| TOTAL | 3 | 1 | 9 |
Top of Page | Table of Contents
Table F-1. Accommodations Findings
| Researchers | Findings | Effects | Perceptions |
Implement/ Use |
Validity |
Post- secondary |
Content |
|---|---|---|---|---|---|---|---|
| Abedi & Ewers (2013) | The authors highlighted five major characteristics needed for accommodations: effectiveness, validity, differential impact, relevance, and feasibility. Accommodations need to render assessments effectively more accessible to test-takers, including students with disabilities. Test constructs need to be validly assessed, and accommodations need not alter the constructs. Accommodations need to have a differential impact for students with disabilities, and be sensitive to each student's background. Accommodations need to be intentionally relevant to test-takers. Accommodations need to be feasible to provide during test administration. The authors emphasized the importance of accommodations' effectiveness in that they need to be supported by research--and validity--to allow for the states' accountability for student learning. The implications of these characteristics for recommended accommodations, especially balancing effectiveness and validity, were examined in consideration of the states of the Smarter Balanced Assessment Consortium. | X | |||||
| Alkahtani (2013) | The researcher reported that less than 10% of survey respondents had requested assistive technology evaluations for students or considered assistive technology (AT) when planning students' IEPs, and less than 10% indicated availability of AT devices in the schools, whether low-tech, medium-tech, or high-tech. Most respondents (about 94%) also rated their degree of knowledge as mostly low, and most (about 94%) estimated their preparation to provide students with AT as poor or absent, with about two percent having had courses on AT and about six percent having one or two AT workshop or trainings. Most respondents (84%) endorsed high interest in receiving training about AT, with preferences for individualized or group hands-on training, and for workshops or conference sessions (over formalized coursework). Slightly more than 50 percent of respondents responded neutrally to statements about assistive technology either helping or hindering learning, while few disagreed that AT helps and few agreed that AT hinders students. Most (70%) responded neutrally to the problem that AT is excessively time-consuming, with 12 percent agreeing and 13 percent disagreeing. The interviewees confirmed the themes that they want and need more AT information. The interviewees' comments also reflected the mixed perception of AT devices as benefitting students' access to the curriculum but also building over-dependence on AT for learning. | E | X | ||||
| Barnhill (2014) | Survey results provided information about current support practices for students with Asperger Syndrome (AS) and autism spectrum disorder (ASD). Two of the most common supports--provided by 29 of the 30 institutions--for students with AS and ASD were the examination accommodations of extended time and alternate site. Some also provided oral delivery of examinations. | X | |||||
| Berger & Lewandowski (2013) | The word-processing response format was expected to result in a significantly larger improvement over the handwritten format for students with learning disabilities, in comparison to students without learning disabilities; however, this result did not occur. Scores for essays produced using word-processing were higher than handwritten essays for both students with learning disabilities and students without disabilities. Further, it was expected that the word-processing response format would result in differentially longer essays, by total word count, for students with learning disabilities than for students without disabilities, in comparison to each group's handwritten essays. However, the result was that both students with learning disabilities and students without disabilities produced longer word-processed essays, and the increased length was similar between the participant groups. Finally, it was hypothesized that students with learning disabilities would spend more time working on essays (with the 10-minute limit) than students without disabilities, no matter which test response format was used. Instead, the result was that both groups took similar amounts of time on average for handwritten essays--with most students using the entire 10 minutes. In contrast, significantly fewer students with learning disabilities used the entire time than did students without disabilities when producing essays using word-processing. Survey results indicated that both students with and without disabilities preferred word-processing over handwriting to a similar degree (74% of both groups) and that 61% of students in both groups indicated that typing was easier than handwriting their essays. | U | S | ||||
| Botello (2014) | Comparisons between group means of elementary students (combining students with and without disabilities in general education setting) receiving each of the computer screen color conditions were completed for each of the four grades' administrations of the reading comprehension assessment, yielding that there were no significant differences in mean engagement behavior scores between students in the testing conditions. Also, the researcher compared student groups' performances across the four testing sessions throughout the year for each grade, and found no significant differences in the mean reading comprehension scores for students in each screen and print color condition. Finally, a mean comparison was done for all reading scores in the black screen/white print and in the white screen/black print conditions, and no significant differences in comprehension were detected. Despite the possibility that black screens with white print could provide a benefit to students over the typical white screens with black print, no differences reached significant levels. | U | R | ||||
| Brumfield (2014) | The student participants with learning disabilities scored significantly higher on the science graduation (high school) assessment items when receiving the oral administration ("read-aloud") accommodation than when not doing so. Students without disabilities did not score significantly differently whether provided read-aloud or not. There were no interactions between student disability (or not) condition and accommodation (or not) condition. | O | S | ||||
| Buzick & Stone (2014) | The meta-analysis' effect sizes indicated that read-aloud (or oral-delivery) accommodations support K-12 students both with and without disabilities in higher achievement in reading and to a lesser extent, mathematics. Further, reading score differences were larger for students with disabilities than for students without disabilities. The researchers also discussed that grade level and the manner by which the oral delivery accommodations were presented were factors contributing to variation in effect sizes. | O | M,R | ||||
| Cawthon & Leppo (2013) | Many of the studies in this random-effects meta-analysis of 19 studies examined the effects of assessments administered in American sign language (ASL) in comparison with English print, often resulting in little effect of ASL on scores for students with deafness or hearing impairment, including from elementary school through the postsecondary level. A significant complication limiting clear findings was translation of tests from English into ASL. However, one study acknowledged a positive correlation between two factors, ASL use in classrooms and English reading proficiency, and resulting assessment scores. Additionally, ASL administration with ASL responding by students was shown in studies to yield lower scores than English-printed tests. The researchers noted that ASL was demonstrated not to be central to facilitating assessment access for postsecondary students. Assessments using digital platforms expanded format options for accommodations (e.g., beyond in-person ASL interpretation); these other formats were determined to be equally valid and not changing academic constructs. Test-related factors, such as item format (constructed-response, e.g., essay; and selected-response, e.g., multiple choice), and item difficulty, and student-related factors, such as degree of ASL proficiency and level of hearing loss, were described through detailed review of the studies examined. | U | X | R | |||
| Cawthon et al. (2013a) | The study comprised a secondary data analysis, after item development (with adaptation of items), scaling, and differential item functioning were already completed. Comparisons of student performance means on standard items and adapted items were made at grades 3, 4, and 5 for students without disabilities and students with learning disabilities (LD) and students with HI (hearing impairments). Additionally, the mean scores for each of the adaptations were reported for the participant groups. Group performance comparisons yielded that, in grades 4 and 5, students without disabilities and students with HI scored significantly better in both science and English language arts than students with LD. When comparing scores by item formats, in grade 3, students without disabilities scored similarly on both standard and adapted items, but students with HI and LD scored better on adapted items than standard items. All grade 4 students--with or without disabilities--performed better on the adapted items than the standard items, and all grade 5 students--with or without disabilities--performed better on the standard items than the adapted items. | U | R,S | R,S | |||
| Cawthon et al. (2013b) | The accommodations most commonly reported by secondary and postsecondary educators and service providers for their students included interpreters (75%), captioning media (64%), and sound amplification (63%). The settings in which accommodations use incidence were reported included at the secondary level--with 82% using captioning and 81% using interpreters--and postsecondary level--with 92% using interpreters and 76% using captioning. The provision of interpreters by video remote was very uncommon at the secondary level but much more common at the postsecondary level, and the researchers noted the potential for students transitioning to postsecondary education settings to benefit from being oriented to technology resources. The researchers indicated that participants endorsed some accommodations as both high in quality and high in consistency, including interpreter, captioning, and speech to text. | E | X | X | |||
| Crawford & Ketterlin-Geller (2013) | The most commonly used accommodations, reported by most middle school special education teachers and directors, were extended time, separate setting, small group administration, directions and/or items read-aloud, and frequent breaks. Many of the teachers (70%) indicated that accommodations were effective for their students. Only a couple teachers made decisions alone, with 90% reported IEP team involvement; only one teacher sought input from students. The researchers reported that assignment of accommodations typically did not draw on student data, with only three teachers indicating data were used, and that more often, convenience and teachers' intuition and judgment were primary factors. When discussing rationale for accommodations decisions, nearly all (n=18) teachers reported procedural answers including state policies; without state policies and procedures, nine teachers indicated that they would test students at their instructional level rather than their grade level. Only three teachers indicated that the purpose of accommodations was associated with test score validity and comparability, and most identified accommodations' effect on students' well-being, such as their emotional state and self-esteem. | E | X | ||||
| Finch & Finch (2013a) | National language achievement assessment data for grade 3 students with and without disabilities could be represented by five distinct response patterns, with two distinct sets at the school level. Students in the highest-performing group had the lowest overall disability rate, and students in the lowest-performing group had the highest overall disability rate. Students in the middle three performance level groups had similar overall disability rates. These trends in the association between performance and presence of disabilities was not connected with any specific disability types or categories. Similarly, higher-performing student groups had lower incidence of being provided accommodations, which the researchers connected to the point that receiving accommodations is associated with having disabilities. The multilevel Rasch mixture model data showed that there were patterns at the school level, higher and lower achievement, and that the higher-achieving schools had lower incidence of students with disabilities in general and specific disabilities in particular. Lower-achieving schools had higher proportions of students with learning disabilities and intellectual disabilities, and students received extended time and oral delivery of test directions at higher rates. The researchers concluded that, when examining differential item functioning related to disabilities and accommodations use, the multilevel Rasch mixture model demonstrates benefits. | A | R | R | |||
| Finch & Finch (2013b) | The examinee-level latent classes included students with high mean performance on both math and reading; students with low mean performance on both math and reading, and who have higher incidence of math and reading disabilities and of receiving accommodations; and students with high math and low reading performance, who had higher incidence of reading disabilities than the first group. Several items in both assessments exhibited differential item functioning (DIF) for at least two latent classes, suggesting validity concerns. The researchers concluded that the model used in this analysis, as applied to the examinee-level data, permitted simultaneous analyses of different academic constructs which permitted a clearer demonstration of the complex picture of students with disabilities, their performance, and the connections with access to specific accommodations. | A | M,R | M,R | |||
| Fincher (2013) | Grade 4 students (both with and without disabilities) receiving oral delivery accommodations scored significantly higher in reading than students not receiving accommodations across all reading skill levels. Further, students with and without disabilities who had poor reading skills (vs. average and above-average readers) had the significantly largest differences in scores between those receiving and not receiving accommodations. Students whose teachers rated them as having mild disabilities scored significantly highest, whether receiving or not receiving accommodations, than students with moderate or profound disability ratings. Whether students with disabilities received specific decoding interventions did not seem to be a factor in difference scores. Students receiving oral delivery who spent more than half of their academic time in general education had a larger score gain, on average, than students who spent less than half of their academic time in general education. Finally, students with disabilities provided oral delivery made larger score improvements when they received on-grade-level instruction, compared to students who received below-grade-level instruction. | O | R | ||||
| Freeman (2013) | The researcher reported significant differences in the three comparisons of group assessment data. The performance of all students with disabilities taking assessments with three response options were higher than the scores on assessments with four response options. When data were analyzed by schooling level, the comparisons between scores of assessments with three options indicated they were higher than scores of assessments with four options at the elementary level, the middle school level, and the high school level. When data were analyzed by academic content, assessment scores for the three response option tests were higher than the scores for the four response option tests for all three content areas: math, reading, and science. | U | M,R,S | ||||
| Hawpe (2013) | Secondary teachers' group survey response means about their willingness to provide various accommodations and modifications for their students were calculated, and compared with the neutral response, the mid-point in the range of possible responses. All of the responses were significantly above average, indicating that the tendency was for respondents to endorse using accommodations, including: alternative forms of exams, rephrasings of test items, extra test time, student dictation of answers to a person recording the responses, oral responses to essay questions, calculators, and no score differences for structural errors (punctuation, spelling, and grammar). As for modifications, the average response was significantly different than the neutral response for awards of partial credit for process (separate from final solution), but not significantly different from the neutral response for adjustments to grading criteria to assist students with disabilities to pass. When diverse aspects of the respondent group were compared for differences in willingness to provide accommodations and modifications, some response differences were detected for assessment accommodations. Special education teachers were more willing than general education teachers to provide alternative forms of tests, to allow student oral responses to essay items, and to allow calculators during testing. Teachers with disabilities were more willing than teachers with no disabilities to provide different test forms, and to allow calculators during testing. Regarding test modifications, special education teachers were more willing than general education teachers to adjust grading criteria to help students pass. Additional gender and grade-level links with willingness to provide specific accommodations were reported. On average, the respondent group as a whole had positive attitudes toward people with disabilities, yet there were no significant differences based on gender, school level taught, teaching assignment, teachers' personal disability, or family members with or without disabilities. Correlational analyses between willingness to provide accommodations or modifications and attitude toward people with disabilities demonstrated relationships between the factors in specific instances. For instance, there were weak, but significant, correlation between positive attitude toward people with disabilities and increased willingness to allow student oral responses to essay questions, to allow calculator use during testing, and to no score differences when students made structural errors in compositions. | E | X | ||||
| Higgins & Katz (2013) | Analysis of the math performance data from middle school and high school students with and without specific disabilities indicated that the students without disabilities varied as to which type of audio presentation (literal or interpretive) showed higher scores on average, across different types of items--those containing parentheses, exponents, tables, and graphs. Despite this variation, only one scoring difference was significant: students without disabilities scored significantly better when presented with the literal form for parentheses ("open/close parentheses"). Students with disabilities showed a similar pattern, scoring significantly better on parentheses items with the literal form of audio presentation. A different pattern emerges but not to a level of statistical significance, for the other types of items for students with disabilities. Regarding student preferences about the audio script, the views of students without disabilities and students with disabilities were mostly similar, but sometimes different. During the surveys, majorities of all students (with and without disabilities) preferred the interpretive form for exponents and tables and the literal form for parentheses. However, a majority (69%) of students with disabilities preferred the literal form of the graphs with keys items. In contrast, about half of the students without disabilities preferred either the literal or interpretive form for graphs with keys. The interview data showed a few major themes. Study participants expressed comfort with using the computer platform and the embedded oral delivery software to access the assessment items. The test item content, at grade level, was challenging to participants. Some participants indicated that they were unaware, until it was pointed out, that there was anything different about the way the items were presented. Participants also indicated their thoughts and reasons for their preferences for specific literal or interpretive item forms. | U | S | M | |||
| Huggins & Elbaum (2013) | Grade 5 students without disabilities scored highest, on average, as a group on state science assessments; the next-highest scores were from the students with disabilities who did not receive various IEP-identified accommodations, and the lowest-scoring group was the students with disabilities using their typical accommodations. The researchers noted that this study used extant data and did not control assessment conditions, and mean ability differences appear to have confounded these findings. However, the purpose of the study was to apply "score equity assessment" in order to ascertain both comparability and equity of scores across population subgroups. Analyses indicate that students with disabilities (and English language learners) who used various assessment accommodations evidenced a slightly higher degree of measurement comparability to the general population of test-takers than did students with disabilities (and English language learners) not using accommodations. | A | S | S | |||
| Ketterlin-Geller et al. (2014) | The researchers propounded a process and tool for examining useful information to discern appropriate accommodations for students needing supports for mathematics assessment. The results are the tool itself, yet also a description of the considerations in developing the tool, and the usability and feasibility found by participant-reviewers. Completion of the tool results in the formulation of a set of information--from educators, parents, and students--about students' academic engagement in terms of perceived academic task proficiency, barriers to that proficiency, and solutions for overcoming barriers. Reviewers assented that the information assembled by the tool was useful, and that the collection process was feasible and relatively brief and efficient. | M | |||||
| Klehm (2014) | Several findings were reported for several research questions. Most relevant to current use of accommodations, a slight majority of respondents (55%) indicated agreement that assessment accommodations are individualized to each student, but a slight majority (56%) disagreed with the statement that accommodations are designed to remove disabilities' impact on knowledge and skills tested, and a slight majority (54%) disagreed with the statement that all IEP accommodations are clear and implemented precisely. A larger majority (80%) disagreed with the statement that the actual effect of accommodations have been to eliminate the impact of disabilities on test results. Finally, there was an even agreement and disagreement (50-50) in response to the statement that accommodations permit more accurate test results due to removing disabilities' impact while not allowing the intended test constructs to change. | X | |||||
| Lee & Chen (2014) | Students with high prior geometry knowledge scored significantly higher on the geometry test when using virtual manipulatives than when using physical manipulatives. Students with low prior knowledge did not score significantly differently between the manipulative types. Students using virtual manipulatives who had high prior knowledge scored significantly higher than those with low prior knowledge. Students using physical manipulatives did not score significantly differently whether they had high prior knowledge or low prior knowledge. Finally, students with high prior knowledge who used virtual manipulatives also had more positive attitudes toward math than did students with low prior knowledge. | U | M | ||||
| Leppo et al. (2014) | This study sought to examine accommodations use patterns for students with deafness or hearing impairments who also have other disabilities in order to identify what, if any, differences there may be for these students, in comparison to students with deafness or hearing impairments who do not have additional disabilities. First, none of the accommodations categories were statistically significant to predict that the students with deafness or hearing impairments also had any additional disabilities. In other words, accommodations use patterns of students with deafness did not differ from patterns of students with deafness along with other disabilities. Further analyses yielded that the predictor variables ought to have reliably detected a meaningful effect if it had existed. However, when specifying which additional disability, different accommodations use patterns were detected. In fact, students with deafness or hearing impairments and ADHD demonstrated significant differences in their use of three accommodations categories: they were associated with less use of technology, greater use of extended-time for tests or assignments, and greater use of oral delivery during assessments. Also, students with deafness or hearing impairments and LD tended to have significantly greater use of oral delivery during testing. | X | |||||
| Lewandowski et al. (2013) | Analysis of the interaction hypothesis--that private postsecondary students with learning disabilities would attain significantly lower scores than students without disabilities in the standard administration condition, and that students with disabilities would attain similar scores as students without disabilities in the accommodated condition--showed that the interaction hypothesis was not supported. Instead, students with disabilities, who scored significantly lower during the standard administration condition, scored significantly lower than students without disabilities on the accommodated reading comprehension assessment. Both groups scored better, on average, when they were provided extended time, in comparison to their scores when they were not. The participants with learning disabilities scored lowest in the standard condition, significantly higher in the 150% time condition, and significantly higher than that in the 200% time condition. The number of items attempted was also measured, and showed the same pattern for students with disabilities. When calculating the percentage correct (correctly-answered items divided by total items attempted), there was little difference for students with learning disabilities across the three test conditions. For students without disabilities, there were also no significant differences between test scores across the testing conditions. Participants without disabilities improved even more than participants with disabilities, comparing the standard test condition to the two conditions with accommodations. In fact, the gap between the two participant groups widened from the standard condition to the 150% time condition to the 200% time condition, due to the larger average score gains for students without disabilities. However, a comparison of the scores of students with learning disabilities in the 150% time and 200% time conditions against the students without disabilities in the standard time condition showed that students without disabilities attempted more items and also got more items correct. The researchers observed that these results indicated that the extended-time accommodations of 150% and 200% time might challenge test validity, and estimated that providing 125% time for students with learning disabilities would permit sufficiently more items attempted to equalize their access with students without disabilities. | E | R | R | |||
| Lewandowski et al. (2014) | All respondents, both with and without disabilities, indicated that their performance would be improved when using (in decreasing popularity) extended time, separate exam rooms, extra breaks, and word processor. Also, accommodations were judged to be more helpful for high-stakes exams rather than classroom tests. For high-stakes tests, students with disabilities were significantly more positive (than students without disabilities) about separate room setting, reader, scribe, and word processing. A similar proportion (just over 2/3) of students with and without disabilities indicated that all students ought to have access to using accommodations. More than half (60%) of students without disabilities supported universally-designed exams, while just under half (48%) of students with disabilities supported the same. | S | X | ||||
| Lewis & Nolan (2013) | The three phases of the study provided various findings pertinent to testing settings, students with sensory defensiveness, and implications for quality practices. During the first phase, 102 students reported their evaluation of 16 University testing venues through a questionnaire, with about 87% of the participants indicating that they were excellent, and about 13% rating the venues as poor or unacceptable. During the second phase, an audit of the testing venues, two occupational therapists, along with students with sensory defensiveness, identified that most of the 16 testing spaces had auditory, visual, and proximity issues needing correction. In the third phase, and using those recommendations, two small-group testing spaces and two individual testing spaces were created. The testing spaces were piloted during University examinations, and Disability Services staff members and exam proctors also provided feedback. The perspectives of these stakeholder groups were primarily positive, explicating the accommodation's improvements. | S,E | |||||
| Li (2014) | This meta-analysis' performance data from students in grades K-12, both with and without learning disabilities, indicated benefits from read-aloud (or oral-delivery) accommodations. Further, the oral-delivery effect size for students with disabilities was significantly larger than that of students without disabilities. The researchers reported on the factors most strongly influencing oral-delivery accommodations' effects, including when oral delivery was provided by in-person human readers (compared to computer-synthesized voices and recordings of human voices), when academic content was reading (compared to math), when extra time was concurrently permitted along with oral delivery (compared with oral delivery alone), when the research design was independent groups (compared to repeated-measures), and when students were in elementary school (compared to students in middle school only, since the number of studies with high school participants was not deemed sufficient). | O | M,R | ||||
| Lin & Lin (2013) | Several significant score differences were found between and among comparison groups. English learners (ELs) with learning disabilities receiving setting accommodations were more likely to have lower performance scores than English learners without disabilities not receiving accommodations, who were more likely to have the highest performance scores. Native English speakers without disabilities using setting accommodations had low math test results. Students with learning disabilities--whether ELs or native English speakers--using setting accommodations did not perform better in number sense and numeration skills than all students with learning disabilities not using accommodations. These findings were shown in both the balanced and unbalanced data sets. The researchers concluded that there was no evidence of differential boost for students with LD, and also that it was not likely that construct validity was affected by setting accommodations. | SS | |||||
| Lin & Lin (2014) | The factors affecting differential item functioning (DIF) included accommodation status--specifically low-distraction setting--as well as gender, test-taker latent abilities, attitudes toward learning reading and math, and home languages, and the interaction among these factors. The latent class analyses (LCA) approach using multiple covariates was demonstrated to yield better fits to the observed data. The researchers showed that receiving setting accommodation was associated with being male, speaking a language other than English at home, and had less positive attitudes toward learning reading and math, in addition to latent abilities. | SS | |||||
| Lovett (2014) | In discussing the Department of Justice implementation guidelines for the Americans with Disabilities Act amendments of 2008, the researcher presents five major points pertaining to a review of accommodations research. IEP teams have been shown to have difficulties with disability determinations, and have tended to make accommodations decisions related more to potential benefit than equal access for testing. Private clinicians diagnosing postsecondary students have also demonstrated difficulties making disability determinations. When considering appropriate accommodations in the postsecondary setting, accommodations provided during students' K-12 education have been shown not to be particularly relevant. Finally, the researcher argued that evidence that adult students can feign disabilities to demonstrate need for accommodations has limited the validity of the process. | X | |||||
| Lovett & Leja (2013) | The researchers highlighted three conclusions of the literature review on the accommodations perceptions of students with various disabilities. Students with disabilities mostly reported their perceptions that accommodations benefited them in demonstrating their capabilities during tests. Students without disabilities also perceived accommodations as beneficial to them. Finally, when students did not experience benefits, the accommodations at issue were perceived as problematic, even distracting. The authors argued in support of seeking students' views and experiences of accommodations, and the value of this awareness in practice. | S | |||||
| Lyman (2013) | The researcher discerned seven themes across the interview data from 16 postsecondary students with disabilities. Three of the themes were considered simple and had no subthemes, and four of the themes were considerd complex, having several subthemes. The barriers to using accommodations that were uncovered that were considered straightforward included (a) negative experiences with professors; (b) fears of future ramifications, such as a worry that accommodations may limit the skills and benefits of having completed postsecondary education because the skills were not learned independent of these learning supports; and finally, (c) the eventuality that accommodations are not needed, at least not in every instance, in order for students to succeed in courses. The other four barriers to accommodations were complex and had many factors. (d) The desire for self-sufficiency was a source of pressure which resulted in students valuing independence to the exclusion of making use of accommodations to support their success. Students sought to be self-accommodating, and to think of accommodations as a backup to use only if their usual efforts were not enough for success. (e) Postsecondary students' desire to avoid negative social reactions was linked to students' reticence to be seen as different and treated in explicitly different ways, and especially to be judged as not deserving of, or taking advantage of, the special treatment that accommodations can appear to be. Another aspect of avoiding negative social reactions was students' desire not to place an undue burden on those who were helping them, which could result in students not using accommodations that they need. (f) Another barrier was insufficient knowledge about accommodations, such as students' concern that accommodations were not fair for them to receive and others not to receive, which the researcher linked to a limited understanding of students' own disabilities. Accommodations knowledge was influenced by the degree to which students were aware of Disability Support Services (DSS), and also associated with a sense that one was not disabled enough to receive accommodations. (g) The fourth complex theme was the quality and usefulness of DSS and accommodations. Underlying this theme was problematic experience with requesting and receiving accommodations, including instances in which specific accommodations were not available, and when accommodations do not prove to be helpful or effective. | S | X | ||||
| May (2013) | Twenty-one percent of nursing faculty respondents achieved a passing score (18 of 23 items correct) in their knowledge about the Americans with Disabilities Act (ADA); the group's mean score was about 14.5 out of 23 items. Faculty respondents, on average, indicated slightly positive (1.3 on a scale of -3 to +3) attitudes toward, and slightly positive (1.6) intent about, providing accommodations to students with disabilities. A moderate mean positive correlation was found between knowledge scores and attitude scores, and a nonsignificant mean correlation was found between knowledge scores and intent scores. Correlational analyses were also completed for demographic and experience and knowledge and attitude, showing a slightly more positive attitude toward students with disabilities by female faculty than male faculty, a nonsignificant relationship between years of experience and knowledge, and a weak positive relationship between years of experience and attitudes toward students with disabilities. | E | X | ||||
| May & Stone (2014) | Postsecondary students without disabilities scored similarly and took similar amounts of time per item in both the stereotype threat and reduced threat conditions. Postsecondary students with learning disabilities in the reduced threat condition had similar scores, and spent similar time per item, as students without disabilities. In the stereotype threat condition, students with learning disabilities spent more time per item yet scored no better or worse than in the reduced threat condition, on average, on the items they completed. This result was counter to researchers' expectations, which were that students with disabilities, when primed with stereotype expectation that they would not perform comparably when told that the task was ability-based, would meet the lower expectations. Other score patterns included that students with learning disabilities completed fewer items and skipped more items in both conditions than students without disabilities. This finding has implications on these students' possibly not benefitting from extended time accommodations--at least not with the ETS scoring approach, in that their test results were not significantly worse when not completing as many items as students without disabilities. | E | S | X | |||
| Meyer & Bouck (2014) | In comparison with participants' comprehension scores without receiving the text-to-speech accommodation, students did not seem to score significantly higher when receiving text to speech. They also did not seem to improve in terms of oral reading fluency; the researchers explained that all three participants had relatively high fluency scores without the support, so they suggested that the ceiling effect may have been operant in this nonsignificant difference. Task completion time did not differ without than with text to speech. In interviews, participants indicated their perceptions that they scored higher in comprehension and oral reading fluency, and took less time to complete the tasks, when using text-to-speech technology. | O | S | R | |||
| Miller et al. (2013) | Postsecondary students with attention-deficit hyperactivity disorder (ADHD) and without disabilities were comparable with one another in terms of their numbers of items they attempted and completed in standard, 150% time and 200% time conditions; they also had similar numbers of correct answers as one another in each of the time conditions. Comparing students with ADHD with extended-time accommodations against students without disabilities with standard administration time, yielded that students with ADHD attempted and completed significantly more items than students without disabilities, and that students with ADHD (with extended-time) scored significantly higher than students without disabilities (with standard-time) in reading comprehension. Students with ADHD did not differentially benefit under extended-time conditions to a greater degree than students without disabilities. | E | X | R | |||
| Nees & Berry (2013) | This literature review yielded findings about the current use of oral delivery accommodations for achievement assessments for students with visual impairments, and both the potential and problems associated with technological advances permitting text-to-speech testing formats, detailing technical concerns, attitudinal and training concerns for educators, and discussed related issues including construct validity. | X | |||||
| Newman & Madaus (2014) | Participants with disabilities in the National Longitudinal Transition Study-2 reported that they used accommodations at a rate of 95% when in high school, yet only 23% of those same people used accommodations or other supports when in postsecondary education. The most commonly used accommodations in both settings were testing accommodations, including extended time and separate setting. High school and postsecondary usage rates for reader for tests or assignments were 47% and 4%, and for special calculator use (including testing) were 33% and 6%. There were no significant differences in usage rate across different types of postsecondary institutions. Half of these postsecondary students indicated that they no longer considered themselves to have a disability; 35% disclosed having a disability to their disability services offices. | X | X | ||||
| Overton (2013) | Grade 5 students with reading-related difficulties and disabilities showed no significant performance differences, between the student-reads-aloud and silent reading conditions--in combination with unlimited time--and between narrative and expository text types. However, there were significant interaction effects when reading conditions and text types were considered simultaneously. Specifically, the mean scores for students reading narrative text silently were significantly lower than mean scores for students reading expository text aloud to themselves; however, there was little performance difference when comparing text types that students read orally. The researcher pointed out that a possible consideration of these results on practice was that use of student-reads-aloud accommodation could benefit students when material is narrative text, but may result in lower scores for expository text. | Agg | R | ||||
| Russell (2014) | The 2012 mean state math performance of students with math-related learning disabilities in grades 6 through 8 was significantly higher, after using the calculator accommodation for the 2011-2012 school year, in comparison with the previous year's mean performance after they did not use the calculator accommodation. The students in the inclusion group scored significantly higher than both the resource room students and the self-contained program students; these results were consistent with the different placements of students, in that students in the inclusion program also had the highest performance. However, there was no interaction effect, indicating that students' program placements were not associated with differing benefits from the calculator accommodation. | C | M | ||||
| Schreuer & Sachs (2014) | Postsecondary students with disabilities surveyed indicated that usage rates for examination-related accommodations included about 71 percent for extended time, with 62 percent reporting benefiting from it, and about 42 percent for alternative exam formats, with 41 percent benefiting. When examining the academic accommodation subscale as a whole with participation and participation satisfaction, the researchers found that there was a low degree of correlation; all other accommodation subscales (human, physical, and organizational) correlated to a greater degree with these participation measures. | S | X | ||||
| Smith (2014) | The researcher reported three superordinate themes, as findings for this interpretative phenomenological analysis of students' experiences of transition to the postsecondary setting: developing identity, desiring credibility, and controlling information. These themes were reflected in nested themes of seeking independence, transitioning between discrete environments, and valuing sameness; seeking understanding from others, and valuing respect and trust from others; and desiring concealment, and reluctantly embracing interdependence. These themes indicate the student participants' perceptions about seeking and receiving accommodations and thereby coming to terms with their disabilities and needs as well as their interdependence and competence. | S | X | X | |||
| Smith & Riccomini (2013) | Groupwise reading comprehension means for the four participant groups were compared for both the standard administration and accommodated condition. The average scores by group without accommodations were (in descending order): students without disabilities, at-risk students, students with other disabilities, and students with learning disabilities. When provided noise-reducing headphones, students without disabilities had the same average score (as without accommodations) as a group, at-risk students had a small effect size (improvement), students with other disabilities had a high-moderate effect size, and students with learning disabilities had a moderate effect size. Significance tests showed that students with other disabilities were the only group that scored significantly higher on average when using noise-reduction headphones. Measured another way, the largest proportion (57%) of students with learning disabilities improved their scores when using noise reduction, and the smallest proportion of students without disabilities (nearly 36%) improved their scores with the accommodation. Individual student comparisons showed that some students with disabilities using the headphones increased their scores by up to 60%. | U | R | ||||
| Stein (2013) | The researcher detailed participants' perceptions of the benefits and challenges of using academic accommodations, including during course exams. Participants reported that the most frequently used accommodations were accommodations during exams (e.g., extended time and distraction free setting) and note taker or access to instructors' notes. The challenges related to their disabilities included limits in ability to concentrate during classes, to complete testing in a set time or in a large group setting, and feeling anxious when attending certain classes. They noted the challenge regarding taking exams in a quiet space but without availability of the professor to clarify exam questions. | S | X | X | |||
| Stone et al. (2013) | The researchers confirmed that the two-stage condition-adaptive assessment format would facilitate measuring both decoding and comprehension components in a manner that addresses the needs of both supporting students with reading-based learning disabilities and obtaining valid scores not affected by construct validity concerns. In other words, the provision of oral delivery accommodations for reading passages (for assessing comprehension) did not complicate the capacity of the testing system to separately obtain oral reading fluency scores from students with reading-based learning disabilities (who read passages aloud using headsets with microphones). Students with reading-based learning disabilities who responded to the study survey indicated that the oral delivery accommodation provided via MP3 player met their needs, and about 70% of them reported having used oral delivery for the entire test (with about 16% using oral delivery for most test items). These students also indicated that they felt they scored better on the accommodated test than the non-accommodated test. | S | R | R | |||
| Szarko et al. (2013) | Comparisons between matched pairs of young students with autism or pervasive developmental disorder, based in part on demographics and on language functioning and instructional level, yielded that both performance and verbal subtests' mean scores for the students with familiar examiners were significantly higher than the students with unfamiliar examiners. The behavioral observation results showed no significant difference between the groups for the number of examiner prompts nor for the number of items refused; the number of atypical behaviors were significantly lower for the students with familiar examiners yet the researchers indicated that means of less than one per test (for both groups) seemed not significant in practice. | U | |||||
| Torres (2014) | The findings of the case studies yielded various details about the transition process from secondary to postsecondary education. Participants indicated the importance of academic and social supports, including the beneficial impact of accommodations provided during examinations, primarily extended time and separate low distraction setting. In interviews, participants noted exam accommodations that were helpful, and also the difficulties and importance of communication with faculty members regarding their challenges. The researcher also analyzed data across cases, and although several themes emerged, her examination of academic stress was most pertinent and informative regarding accommodations. | S,E,P | X | ||||
| Wadley & Liljequist (2013) | Postsecondary students with ADHD scored lower on average, and took longer, on the math placement exam than participants without ADHD. Students with ADHD also had a lower self-esteem score than students without ADHD. Participants with ADHD did not differ significantly across the accommodation conditions; further, they used about the same amount of time, on average, whether they were told they had the standard administration time or the extended-time accommodation. Finally, all participants, with or without ADHD, did not use all, or even nearly all, the time allotted (45 minutes in both conditions). | E | X | M | |||
| Wizikowski (2013) | Across both public and private universities, about 93% of student participants have received accommodations at some point during their postsecondary study. Regarding accommodations offered during course examinations, about 71% of responding public university students with disabilities received these, and about 76% of those at the private university received them, averaging 72.5% of student respondents overall. Exam-related accommodations were rated an average of 3.6 (with 3=useful, and 4=very useful). As for the degree of satisfaction about academic supports including accommodations, there were no differences between respondents' satisfaction based on university type. For instance, respondents indicated about a 3.55 average satisfaction score (with 3=satisfied and 4=very satisfied) regarding academic support office staff's accommodations knowledge. Other findings pertained to aspects of the study unrelated to accommodations, such as student self-advocacy and the manner by which students sought assistance with academic supports. | S | X | X | |||
| Worland (2014) | Grade 3 participants performed best on average in the informational report genre of writing in comparison with the persuasive and narrative genres, while grade 5 participants demonstrated no significant difference among average performances in the three genres. Writing quantity in terms of number of words was not a predictor of writing quality. Grade 3 participants also scored better on average when provided the oral delivery accommodation than without, while grade 5 participants performed no differently on average with or without the accommodation. In terms of genre, both grade 3 and grade 5 participants benefited most from oral delivery when producing narrative writing. | O | W | ||||
| Yakubova & Bouck (2014) | Grade 5 participants with mild intellectual disabilities (n=5) on average scored higher on math test-type tasks--both computation and word problem solving--when using calculators in comparison with when using paper and pencils to solve. Researchers reported that four students averaged 0% correct during baseline and 60-100% correct during intervention on word problems. Also, for four students, calculator use resulted in decreased response times on both item item types. Comparison of relative benefit of the calculators with one another indicated that two improved more with graphing calculators and two improved more with scientific calculators, and one student improved similarly with both calculators. Student preferences for one type of calculator over the other generally followed the same relative benefit pattern, except for one student who preferred the scientific calculator yet scored slightly better using the graphing calculator. Finally, the teacher indicated that students benefited from using calculators by learning to solve more advanced problems without having to use other strategies they knew, such as counting on number lines. However, the teacher indicated that these types of calculators had capabilities not applied at the students' current math level, and indicated that a basic four-function calculator would be sufficient. | C | M | ||||
| Young (2013) | Qualitative data yielded that advisors were familiar with process of students' accessing disability services offices for accommodations, yet not familiar with specific accommodations procedures. Survey (quantitative) data indicated that more than half of respondents were not trained about disability legislation and otherwise less than adequately prepared to advise students with disabilities. On the advisement scenarios in the surveys, just over half of respondents selected appropriate responses for six to nine of the 12 questions. When analyzing the survey respondents' characteristics and working circumstances, the researcher identified that full-time advisor status was associated with connecting students with disabilities to academic supports, and that private four-year institution respondents and those who use a prescriptive approach to advising were associated with failing to refer students with disabilities to disability services offices. | E | X | X | |||
| Zebehazy & Wilton (2014) | Emphasis in this summary was on large-scale assessment accommodations, and not the part of the study discussing accommodations in textbooks and classroom testing. Survey respondents, teachers of students with visual impairments from throughout the U.S. and Canada, reported on their perceptions of the quality and importance of graphic adaptations in large-scale assessments. When rating these graphics' appropriateness, fewer than half of the respondents agreed or strongly agreed that tactile and print graphics were appropriately adapted, with higher (at significant level) incidence of agreement ratings for print graphics over tactile graphics. However, more than half of the respondents indicated that they themselves were comfortable making tactile graphics both understandable and usable, and that they prepared students in class for tactile graphics on large-scale assessments. Nearly all respondents concurred that exposure to tactile graphics at an early age was important. Relatively few respondents (11%) agreed or strongly agreed that written descriptions assisted students' understanding better than tactile graphics; almost all respondents (89%) concurred that tactile graphics combined with written explanations were the best presentation format. When reporting instructional practices about graphics, only 22% of respondents expressed agreement about having adequate time. Further, about 38% of respondents concurred that they have skills teaching tactile graphics, while nearly all (97%) considered teaching tactile graphics as part of their jobs. Finally, about 67% of respondents reported that most of their students can independently understand print graphics, and 21% reported the same about tactile graphics. | E | X | ||||
| Zhang et al. (2014) | Students with geometry difficulties scored significantly better, on average, when using integrated object representation in comparison with the standard testing condition. Students without geometry difficulties scored a significantly lower mean when using the accommodation, compared to when they did not use the accommodation. Additional analysis indicated that there was an interaction effect in the results, in that the students with geometry difficulties differentially benefited from the accommodation. Further, students with geometry difficulties who scored relatively lower than their peers (also with geometry difficulties) on the standard test also scored higher than those same peers when using integrated object representation. | U | M | ||||
| TOTAL | 25 | 22 | 16 | 6 | 15 | 24 |
Effects: A=Accommodations in general, Agg=Aggregated grouping of accommodations, C=Calculator, E=Extended time, O=Oral delivery, SS=Separate/specialized setting, U=Unique/uncommon
Perceptions: E=Educators, P=Parents, S=Students
Validity: M=Math, R=Reading, S=Science, W=Writing
Content: M=Math, R=Reading, S=Science, W=Writing
Top of Page | Table of Contents
Table G-1. Study Limitations by Researchers and Limitations Category
Note. Direct quotes from the articles appear within quotation marks.
| Authors | Methodology | Sample Characteristics | Results | Test / Test Context | Other |
|---|---|---|---|---|---|
| Abedi & Ewers (2013) | ". . . this system needs to be constantly revised as new studies are added to the accommodation literature" (p. 13). | According to the researchers of this literature review article, ". . . there are not enough studies in the field to shed light and help with decisions on many of the accommodations currently used by the SBAC's member states. There is a need for and a current trend toward research that assigns accommodations based on individual student need so that some students with specific needs would receive the accommodation and others would not" (p. 13). | ". . . subjectivity involved in assigning accommodations to the different categories discussed above. Different reviewers of the literature may make different judgments particularly with the studies that provided inconsistent results" (p. 13). | ". . . accommodations that are identified by the system to be effective and valid may not be consistent with the policies of some SBAC's member states" (p. 13). | |
| Alkahtani (2013) | The relatively small number of participants limited generalizability to the general population of teachers. | ||||
| Barnhill (2014) | In the researcher's recruitment efforts, she noted, she found that the information accuracy on the current status of postsecondary programs and services designed for students with Asperger syndrome (AS) were problematic; some postsecondary institutions did not have them and others without relevant information were actually early in the process of beginning AS programs or services. "It was also determined that the majority of the current programs served students with ASD, including AS, rather than exclusively serving students with AS" (p. 11). | Follow-up with the study's participating postsecondary institutions to identify which supports, including accommodations, that they implemented based on findings. Investigate which accommodations and other supports could benefit postsecondary students with autism-related disabilities. | |||
| Berger & Lewandowski (2013) | The participating students with learning disabilities had documentation for their disabilities--"professional diagnoses that have been reviewed and approved by an accredited university" (p. 315). However, the researchers noted, the finding showed non-significant effect size differences between students with and without learning disabilities in writing fluency and essay quality and length. The researchers suggested that "[i]t could be that students in the LD group were not properly diagnosed in accordance with the DSM-IV criteria, particularly with regard to significant impairments in academic skill levels" (p. 315). | "It is possible that the LD diagnoses in this study were valid, yet the measures used in this study were not sensitive enough to detect group differences. The only evidence of a difference in group performance was GPA. It is possible that differences in GPA could have resulted from any number of reasons including lower academic expectations by the LD group or the effects of a heavy academic workload. It would have been ideal to have a large sample of LD students that actually demonstrated significant impairment in a particular aspect of writing, but we could not find such a group in a university of 12,000 students" (p. 315). | |||
| Botello (2014) | The participants in the study were elementary students, so teachers facilitated data collection and provided data regarding their observations of student participants; ". . . the researcher observed lack of teacher buy-in. Even though the teachers consented to participate in the study, teachers were not always consistent and prepared to test. . . . The researcher was suspicious of the results turned in, even though the tally marks were consistent with other benchmark observational sheets" (p. 103). | The researcher reported that testing conditions were not ideal: ". . . a number of interruptions during the testing of students. . . . These interruptions, associated with the elementary school computer laboratory setting were factors that could have limited the engagement of students, as well as affected the reading comprehension results" (pp. 103-104). | |||
| Brumfield (2014) | Small sample size; participants were students from one urban Georgia high school who had reading-related learning disabilities and who had no disabilities, and generalization beyond these students was characterized as limited. | The oral delivery accommodation was provided by test administrators, "increasing varying reader emphases" (p. 11). Test-takers could not pace the in-person oral delivery accommodation, which could have affected students' maintaining attention, described as "a variable that was not controlled for" (p. 11). The accommodated condition took longer than standard administration, indicating that both extended time and oral delivery were provided. | |||
| Buzick & Stone (2014) | "Our decision to treat grade level independently and include multiple comparisons from the same study in each of our six models may have contributed to a downward bias on the standard errors" (p. 23). "As with any meta-analysis, the influence of past studies on subsequent studies also may have caused a dependency among comparisons and biased standard errors" (p. 23). "While we minimized other dependencies across comparisons by estimating random effects models separately for students with and without disabilities by content area, the cost of this decision was that the number of studies was too small to perform statistical tests of the influence of moderator variables on the overall effect sizes from the six models" (p. 23). | ". . . unlike randomized trials or studies with national samples, most of the research on accommodations comes from convenience samples (e.g., students from several schools); consequently, the estimated average effects of read aloud may not generalize to all students in the United States" (p. 23). ". . . because of the limited number of comparisons within each level of the theoretically important moderator variables, we were not able to statistically test the impact of disability status, . . . or grade level on the effect of read aloud, nor were we able to model their interaction" (p. 23). | "Given the increased use of technology to deliver assessments, read aloud delivered via digital or human-based text-to-speech will likely be the most common delivery mode on future assessments--because of the limited number of studies on this mode, our results may not generalize to future uses of read aloud delivered via text-to-speech. However, as studies increasingly employ this delivery method, they should be incorporated into future meta-analyses. . . . because of the limited number of comparisons within each level of the theoretically important moderator variables, we were not able to statistically test the impact of . . . delivery mode . . . on the effect of read aloud, nor were we able to model their interaction" (p. 23). | ||
| Cawthon & Leppo (2013) | N/A -- literature review | N/A -- literature review | N/A -- literature review | N/A -- literature review | N/A -- literature review |
| Cawthon et al. (2013a) | ". . . from a study design perspective, this analysis evaluated item accessibility after the fact, using a tool that did not clearly match up with all of the criteria used for revision in the original process. Occastionally, TAMI-ARM [Test Accessibility and Modification Inventory-Accessibility Rating Matrix] scoring criteria did not fit apparent substantive changes in the item format. In other words, their item scores did not seem to reflect the item's accessibility because the feature that was changed was not clearly a part of the TAMI-ARM framework. This reflects a limitation of the tool, on one hand, although it allowed a different point of view that enhanced the analysis in this study on the other" (p. 94). ". . . more in depth background data for the SwD students were not collected, which could have given the study more information to contextualize the evaluation" (p. 94). | "This study carried with it many of the difficulties of a secondary data analysis. There were vastly uneven sample sizes across student groups, with a very small prevalence of students in the DHH [deaf or hard of hearing] group. This data set was reflective of the reality that DHH are a low-incidence population, a fact that poses as a challenge even when using large-scale assessment databases such as those at the state or national level. However, with uneven samples across the groups (control, ELL, LD, and DHH), analysis procedures were limited to those that could accommodate such different group sizes easily" (p. 94). | Due to technical difficulties gathering online survey responses, not all of the respondents' input was captured. | Limited number of content assessment items: "only 27 pairs of items across three grades, which of course limits the generalizability of the findings overall" (p. 94). Also, "the covariates chosen in this analysis, the statewide science and ELA [English language arts] achievement test scores, were an attempt to help account for variations within each group. However the state has acknowledged that they completed the original study precisely because they believed that their general test forms may not be accessible ‘enough,' so the statewide scores may already have a built in bias. In addition, although the scope of the ELA test, particularly for third grade, is partly a test of literacy skills, tests of this subject also include an assessment of literature and other skills only tangentially related to either science or reading or writing" (p. 94). | |
| Cawthon et al. (2013b) | Participants in the online survey might have had varying understandings of the questions, and response accuracy could not be verified. "While the directions were presented in ASL [American sign language] in a video format, the modularity and length of the survey precluded a full ASL version of the survey itself. We do not know how many individuals may have left the survey due to difficulties with the reading level required to finish it" (p. 447). | Survey respondents were likely to be people who were familiar with pepnet2; as such, they were not necessarily representative of all professionals. The research team gathered qualitative data from a small set of research participants, who might not have represented the population. The interview participants had "their own diverse reasons for wishing to contribute their perspective" (p. 447). | The data transcripts were coded by two or more team members, and the team met to discuss coding issues. However, "the codes and the implications drawn from these data were influenced by the perspectives of the team members and, as such, should be considered carefully" (p. 447). When participants were asked to discuss typical students, they might have had difficulties summarizing their varied experiences: "there is a limitation to asking professionals to mentally "average" the experience of their varied students and clients. For example, if one student had a very difficult accommodations experience and another had a very positive experience, the average of the two would be a moderate level of accommodations quality, masking potentially important dimensions of those two divergent experiences" (p. 448). | ||
| Crawford & Ketterlin-Geller (2013) | The relatively small number of participants, specifically only middle school teachers, limited generalizability to the general population of teachers across grade levels and student characteristics. | The professional development activities that the researchers proposed need to be viewed "as considerations, not empirically validated interventions" (p. 43). | |||
| Finch & Finch (2013a) | none | none | none | none | none |
| Finch & Finch (2013b) | ". . . the proportions of individuals with particular identified disabilities and accommodations were relatively low in this sample, though it should be noted that these rates are comparable to those in the general population. Given the large size of the sample overall, model parameter estimation was not compromised" (p. 992). | The assessment comprised two distinct constructs, math and reading, with the intention that despite challenges, participants would be more easily separated "into latent classes with distinct item response and test score mean patterns" (p. 992). | |||
| Fincher (2013) | Participation in the study was coordinated at the school level (rather than the individual test-taker level), for logistical simplicity reasons. "While this approach may have been less than desirable, the fact that the assignment of test condition at the school level was random reduces the threat to the conclusions drawn from the study" (p. 92). | The assessment had a ceiling effect for students with above average reading skills. | |||
| Freeman (2013) | The population data were examined for students taking the North Carolina alternate assessment based on modified achievement standards (AA-MAS; called NCEXTEND2) in mathematics, reading, and science in the 2010-2011 school year. "Results can be generalized across the entire population of students with disabilities participating on the NCEXTEND2 assessment; however results should not be generalized for specific areas of disability (e.g. autism, specific learning disability, other health impaired) as none of the data collected or analyzed focused on any one area of disability. . . . Given the level of variability in student behavior and characteristics within a single disability area, inferences made regarding the performance of students with specific disability designations would be invalid" (p. 84). | The focus of the study was on the number of response options, whether three or four. The effects of other accommodations were not examined separately: "While some students with disabilities were also allowed to use external test accommodations to improve their access to the assessment, the impact of these accommodations on their test performance was not a measurable factor in this research study" (p. 84). | |||
| Hawpe (2013) | "Even though the data collected were completely anonymous and teachers were reminded of that several times, some teachers might have not participated for fear that a job-related supervisor might have learned of their responses to the survey items" (p. 98). Participants might not have completed the survey because a) they did not know the researcher, b) they preferred to complete surveys in person or by mail (not online), or c) they did not respond to all items or failed to submit the completed survey. | ||||
| Higgins & Katz (2013) | Small sample sizes as a whole; "underrepresentation of students with vision needs" (p. 65). | ". . . focus on a very small sample of content types" (p. 65). | |||
| Huggins & Elbaum (2013) | ". . . test examinees had to be aggregated into large groups as opposed to divided further to better represent homogenous groups (e.g., SWDs and ELLs had to be grouped together by their commonalities in accommodation use). This led to the confounded nature of the groups of analysis; the subpopulations differed not only in SWD/ELL status and accommodations but also in their mean ability levels on the assessment. Even with these group adjustments to address the subpopulation size concerns, all other examinees from previous years who had been previously exposed to the anchor items had to be added to the analysis for anchor item calibration. These factors inhibited the use of an equating analysis that could reproduce the reported scores from the state" (p. 68). "An additional subpopulation size issue that had to be addressed by grouping students together was related to combining all accommodation types into dichotomous classifications assigning students as either having or not having accommodations. . . . there was no other way to divide students based on accommodations and still have adequate subpopulation sizes to complete the analysis. However, the limitation that this introduced should not be ignored; measurement comparability may be achieved for some types of accommodated testing situations but not for others, as accommodation types and the students who are in need of different accommodation types vary widely" (p. 69). | Accommodation use comprised information documented by test administrators and data managers at the time of testing. The relation of the information to "the actual needs of students and/or their actual use of the accommodation ... is unknown" (p. 69), and was reported as similar to test administrators' integrity of accommodations implementation. | |||
| Ketterlin-Geller et al. (2014) | ". . . we solicited feedback to document initial validity evidence; however, we sampled a small population of experts, and not all reviewers who agreed to participate submitted feedback" (p. 84). | ". . . to date the SAAT [Screening to Assign Accommodations Tool] has not been evaluated for accuracy of accommodation recommendations" (p. 84). "Simply identifying students who may be at risk for inaccurate measurement will not ensure that students receive appropriate accommodations; teachers may need targeted professional development focused on how to implement accommodations with fidelity" (p. 84). | |||
| Klehm (2014) | Although the schools in the study had the average Rhode Island demographics, findings ought to be generalized only to respondents with similar demographic features. | Due to content instruction conditions--that teachers in grades 5 and 6 taught several content areas--the Question 6 responses of teachers of grades 5 and 6 were not analyzed for more than one content area, but were linked to only one of the subjects that they taught. The effect was that these responses could not be analyzed for the "relationship between teachers' attitudes and practices and proficient assessment scores of SWD [students with disabilities] by grade level" (p. 237), and the interpretations about these data were limited. "... the potential response bias, as the instrument was a self-report survey. Due to the item content, it is possible that teachers wanted to provide socially desirable responses, rather than the most honest response. In this case, it is possible that the results may have actually been more pronounced. An attempt at avoiding response bias was through the assurance of confidentiality and that only group data would be reported" (p. 237). | ... "should focus on the types of training and professional development that would be most beneficial for teachers of inclusive programs. In addition, qualitative research should be conducted to investigate why teachers hold the dominant attitudes reported and use research-based practices to the extent that they do, and to determine the resources that they need to provide quality instruction that meets the needs of SWD [students with disabilities]. There is a pressing need for research in the area of providing AA [alternate assessments] to more SWD and to students who have diagnosed disabilities other than intellectual disabilities. Research is needed to determine if these students are better able to demonstrate their knowledge on these types of assessments. It is important to find out if AA-GLAS [alternate assessments based on grade-level achievement standards] are more valid measures than the current system of assessment for SWD, as the vast majority of teachers feel that current large-scale assessments are not a valid way to assess the achievement of SWD" (p. 237). | ||
| Lee & Chen (2014) | none | none | none | none | none |
| Leppo et al. (2014) | "... a very trying dilemma experienced by researchers seeking to study accommodations use within a particular disability group. When the student's disability is utilized as a grouping variable, it is acting as a proxy for a group of characteristics assumed to be homogeneous among that group of students by virtue of sharing the particular label. Realistically, this is not an assumption that can be assured when examining the accommodation use of deaf and hard-of-hearing students. However, in this case we sought to add a layer to traditional analysis, which examines SDHH [students who are deaf or hard of hearing] on the basis of that label alone, by examining students' additional disabilities. The results of the analysis bear out the importance of incorporating variables that further specifies the characteristics of student groups (e.g., SDHH+LD; SDHH+ADHD) when doing group-level analysis" (p. 199). Further, the students with deafness and hearing impairments with the least common additional disabilities, such as mental health concerns or deaf-blindness, were not sufficient in numbers for data analysis. Other individual differences among participants, such as degree of hearing loss, were also not examined, in terms of accommodations use. "It is unlikely that a larger sample of SDDH+ could be gathered, making large-scale accommodations package use analysis for other disability categories difficult" (p. 199). | ||||
| Lewandowski et al. (2013) | The sample of postsecondary students with learning disabilities were considered by researchers as unique--in high achievement and possible lower degree of impairment by disabilities--and not representative of all students with learning disabilities. The researchers also did not experimentally account for students' additional disabilities, besides learning disabilities. | Nelson-Denny Reading Test (NDRT; reading comprehension); "unlikely to generalize to tests with very liberal standard time limits" (p. 334). Researchers "could not simulate the high-stakes test atmosphere" (p. 335). | |||
| Lewandowski et al. (2014) | Participants' disabilities were not verified using additional assessment, but relied only on self-report. | The participants were sampled from three postsecondary institutions on a convenience basis; participants were mostly first year Caucasian women students, and so were not necessarily representative of all postsecondary students. The students with disabilities had mostly "'high incidence disabilities' such as ADHD, LD, and anxiety. Although these disabilities likely reflect most university demographics, the study results would likely be different if we had more students with low incidence disabilities (e.g., sensory and physical disabilities)" (p. 123). | |||
| Lewis & Nolan (2013) | The sample numbered only eight participants at one higher education institution, and the study was a pilot of low-distraction settings. | "Comparisons were not made with the students' academic performance" (p. 170). The results were not considered generalizable to all students with sensory processing difficulties, but rather were deemed useful to "provide an alternative approach" (p. 170). | The study used assessments and a questionnaire "designed specifically for this research" (p. 170). | ||
| Li (2014) | "A final note is to reflect on the methodological limitations involved in the present meta-analysis (Berk & Freedman, 2003; Briggs, 2005). As Hunter and Schmidt (2004) warned, the observed differences between effect sizes are produced in part by some unavoidable artifacts in a meta-analysis, such as statistical assumptions, instruments with different reliabilities, and coder reliability. For example, one assumption of the variance-known HLM approach to meta-analysis is that the included studies are regarded as a random sample drawn from the population. However, because we do not know the actual population, this assumption is not directly testable. Also, the variance-known HLM approach to meta-analysis relies on the assumptions underlying a typical HLM analysis (Raudenbush, & Bryk, 2002). Without access to the original raw data, we cannot directly test these assumptions either" (p. 12). | "The classification with disability versus without disability could act as a partial proxy for low reading proficiency versus high reading proficiency. Still, it is just an approximation. In fact, given the close relationship between decoding skills and read-aloud accommodations, if students' decoding skills were available in those studies, this would have been a more meaningful predictor than students' reading proficiency" (p. 11). ". . . disability category would have been a meaningful predictor as well. Because read-aloud accommodations help students decode words, it is reasonable to expect students with learning disabilities in reading (such as deficiencies in decoding) to benefit more from such accommodations than students with other categories of disabilities" (Crawford & Tindal, 2004) (pp. 12-13). | ". . . students' content knowledge in math may be confounded with the effects of read-aloud accommodations (Elbaum, 2007; Meloy et al., 2002); however, we were not able to include content knowledge as a predictor due to the lack of information on this point" (p. 11). | ". . . for math tests, despite the important role of students' reading proficiency in read-aloud accommodations, we were not able to include it as a predictor due to the lack of a universal criterion across studies" (p. 11). "The classification with disability versus without disability could act as a partial proxy for low reading proficiency versus high reading proficiency. Still, it is just an approximation. In fact, given the close relationship between decoding skills and read-aloud accommodations, if students' decoding skills were available in those studies, this would have been a more meaningful predictor than students' reading proficiency (p. 11). | |
| Lin & Lin (2013) | The math assessment was limited to six items including number sense and numeration content. | ||||
| Lin & Lin (2014) | none | none | none | none | none |
| Lovett (2014) | none | none | none | none | none |
| Lovett & Leja (2013) | N/A -- literature review | N/A -- literature review | N/A -- literature review | N/A -- literature review | N/A -- literature review |
| Lyman (2013) | The researcher did not involve postsecondary students with disabilities in the preparation and design of the study, although he did complete validity checks with research participants on the interview data. There was one researcher involved in data collection and analysis, and it is possible that this factor limits objectivity. | In this qualitative study, the researcher conducted interviews with students at one private religious postsecondary institution with students with disabilities who registered with disability services; the experiences of students with disabilities who had not registered with disability services were not discussed. | "Although most of the identified themes seemed to be supported broadly, regardless of disability type, one limitation of this study is that there wasn't a focus on looking at barriers according to specific disabilities, which could have provided greater insight and specificity regarding disability type" (p. 71). | ||
| May (2013) | Participants may not have participated due to not liking to use e-mail, the format for data collection. | Response sets might have been encouraged, such as "socially desirable responses that do not reveal personal beliefs" (p. 79). Potential participants might also exclude themselves based on lack of interest in disability-related issues, or because they were not positive about providing accommodations | |||
| May & Stone (2014) | "A second possible explanation for this study's failure to find the ST effect for students with LD may relate to the participant recruitment process. . . . It is therefore possible that those students with LD who were most likely to feel threatened by the prospect of taking a test would not respond to the participant-solicitation e-mail in the first place" (p. 101). | The sample size was relatively small, especially the number of participants with learning disabilities. | "One alternative explanation for the mixed findings regarding ST [stereotype threat] is that the GRE task used in the present study was not sufficiently sensitive (at least not in the 30-minute time limit employed here) to detect the subtle performance differences between the ST and RT [reduced threat] conditions that were originally predicted" (p. 101). | ||
| Meyer & Bouck (2014) | Data were gathered near the end of the school year; consequently, the timing of the study limited the intervention's length. | Due to being single-subject research, not necessarily generalizable beyond the study participants | The synchronized voice's mispronunciations reportedly distracted at least one participant; when the speed was increased, the voice increased in mispronunciations. When longer narrative passages were used for maintenance, the results might have been confounded. The comprehension assessment was based on "only six multiple-choice questions per passage, offering students fewer opportunities to demonstrate knowledge" (p. 31). "Reading expository passages outside the students' authentic curriculum might have affected motivation for performing at optimal levels" (p. 31). "Allowing students to reread parts of the passage as needed to find an answer may have impacted the comprehension results" (p. 31). | ||
| Miller et al. (2013) | ". . . the makeup of the ADHD group. As noted earlier, there are many factors that may suggest the students included in the study may not comprise a representative sample of all college students with ADHD. These factors include legitimacy of diagnosis, possible high IQs and other resources that insulate from certain negative outcomes of ADHD, and the presence of symptoms but lack of impairment. The results may have differed had the study included college students at a variety of higher education institutions, such as community college as well as individuals not attending school" (p. 7). The researchers noted that the study protocol relied on participant self-report of previous ADHD diagnoses. | ". . . that participants in the ADHD group were told to take their medication as they usually do. As a result, individuals in the ADHD who were treated with medication may have been on stimulant medication during testing. . . . However, the study protocol did not require participants to indicate whether the students took their medication on the day of study completion. Therefore, the possible effects of medication on performance could not be determined. Perhaps if students were not allowed to take medication that day, the ADHD group performance would have been lower" (p. 7). | ". . . in the measure used to test the reading comprehension abilities of the participants. . . . that the measure did not require students to maintain vigilance for a lengthy period of time. . . . The demands of this research study may not have been intense enough to bring out differences between the groups in terms of performance" (p. 7). The testing conditions were also not likely to have been experienced by participants as high-stakes, and therefore the test was unlike typical course examinations. | ||
| Nees & Berry (2013) | none | none | none | none | none |
| Newman & Madaus (2014) | "Information about receipt of accommodations, modifications, and supports was provided by different respondents at the high school and postsecondary school levels and in both cases could not be independently verified. At the high school level, school staff provided information about receipt, whereas postsecondary rates of receipt were based on parent and postsecondary student self-report. Thus, postsecondary rates may be underreported because parents and youth may be less aware of the types of postsecondary supports received. In addition, these findings do not report the frequency or extent of receipt of each type of accommodation, modification, and support at the high school or postsecondary level because they were not measured in NLTS2" (p. 8). | ||||
| Overton (2013) | Few student participants overall | No evidence record of the number of student participants who followed the test protocol of using the student-reads-aloud accommodation during the oral passages section, "thus negatively affecting the validity of the results" (p. 86). ". . . the decision to allow an informal training [of test administrators] rather than formal face to face training was an error that may have significantly affected the fidelity of implementation of the study" (p. 87). | . . . timing of the study . . . in the last two weeks of the school year when there was much less pressure on students to perform well (p. 84). ". . . amount of training of students in using the student-reads-aloud accommodation provided to the participating students . . . no measure was put in place to ensure the students were given opportunity to practice using the accommodation. . . . The lack of time for students to practice using the accommodation may have affected the performance outcomes" (p. 85). | ||
| Russell (2014) | "The researcher was unable to choose a different design due to ethical considerations, since accommodations cannot be refused to a student with disabilities for the sake of the experimental design" (p. 125). | Small sample size and unique sample characteristics, and the schools' geographic location (rural South Carolina) limited generalizability | "The researcher did not take into consideration change in teachers or curriculum when students moved from one grade level to another, but assumed that a standards based curriculum with appropriate special education services provided in both assessed years would allow for the comparison of the scores" (p. 124). "The researcher was in charge of providing the resource or inclusion special education program while the students were in sixth grade. To avoid any bias, the researcher chose an objective, quantitative, research design" (p. 125). | ||
| Schreuer & Sachs (2014) | While participants were students with disabilities from postsecondary institutions throughout Israel, the sample represented only Israel, which researchers noted "has been offering accommodations to students with disabilities for only about five years" (p. 35). | ||||
| Smith (2014) | In this qualitative (phenomenological) study, the researcher conducted interviews at one postsecondary institution with students with disabilities who registered with disability services; while deep meaning was sought about accommodations, the "relatively small number of participants included in the current study limits the findings from being broadly applicable to the general population" (p. 53). | ||||
| Smith & Riccomini (2013) | Most participants had little or no experience using noise-reducing headphones, and their scores may be influenced by the novelty of this accommodation. | The sample was drawn from only two schools and this small number of participants could be limited in their representativeness. | The study employed only the Qualitative Reading Inventory-5 (QRI-5) to test reading comprehension, which could have influenced the reliability and validity of the results of using noise-reducing headphones as the accommodation. | ||
| Stein (2013) | none | none | none | none | none |
| Stone et al. (2013) | Data analysis revealed low correlation between condition-adaptive routing test and students' state test scores. Possible explanations could include data reporting errors, the tests might have had different testing conditions, the tests' contents were not the same, or the students were not similarly motivated on the routing test (as state test) since it was not perceived as important. | ||||
| Szarko et al. (2013) | The sample was small; simultaneously, the students ranged widely in "severity of characteristic and degree of functioning" (p. 47). "Given the small sample size, the posttest-only control group design may have failed to control for preexisting group differences. Matching the children before random group assignment provided greater equivalence between the two experimental conditions, but did not allow for the evaluation of the effect of familiarity" (p. 47) based on these wide student differences. | The characteristics of the Psychoeducational Profile-Revised are also important (p. 47), as it was designed for students with autism. "The tasks are designed to be visually interesting and stimulating to children with autism and the format of the test is more flexible than traditional standardized tests. . . . [therefore] characteristics should produce fewer examiner effects than many tests, but caution should be exercised in generalizing the findings of the present study to other tests" (p. 48). ". . . the examiners in the current study were novices and had little or no experience testing children with autism before the experiment" (p. 48). | |||
| Torres (2014) | ". . . there are certain limitations related to bias that are inherent to qualitative research. . . . bias is possible in a research study that utilizes interviewing as the primary data collection because such factors as the emotional state of the interviewee at the time of the interview, personal bias, and the researcher's close role in the interview process can affect the partipant's response (Patton, 2002, p. 306)" (pp. 102-103). | In this qualitative case study, the researcher analyzed information from students with autism at one postsecondary institution with students with autism. The researcher noted that, "since postsecondary educational institutions offer such diverse services for students with disabilities, conducting the study at a different postsecondary educational institution could influence the study's findings (Dukes & Shaw, 2004)" (p. 102). | |||
| Wadley & Liljequist (2013) | ". . . diagnosis documentation was not required by the researchers to participate in the study, rather, verification of disability status by the SDS office was deemed sufficient; however, this means that the diagnoses were made by different professionals and interrater reliability of these diagnoses cannot be demonstrated" (p. 269). | "However, there were significant differences between the two student populations, students with and without ADHD, regardless of the testing condition. Students with ADHD were more likely to be taking stimulant medication . . . and were more likely to have other mental health diagnoses than students without ADHD. . . . While not surprising, and difficult to avoid, these differences between groups are limitations of the present study" (p. 269). ". . . students with ADHD used more time to complete the math test and were more likely to be upperclassmen than students without ADHD, although neither of these variables was related to test performance" (p. 269). "As some students with ADHD were taking stimulant medication to control their symptoms and others were not, the students were likely coping with varying symptom severity. Data regarding ADHD severity and the type of ADHD diagnosis were not collected or controlled for and this is a limitation of the study" (p. 269). | |||
| Wizikowski (2013) | Online survey "may have excluded potential respondents who did not have the necessary computer skills, access to the Internet, or a computer. The survey was created to be understandable and as impartial as possible, but there is the potential that there were unclear or biased items that would have affected the outcome of the responses" (p. 87). | Relatively small sample size, with 113 student survey respondents from two postsecondary institutions. Response rate was 10 percent. The sample was described as based on convenience. "Only students with disabilities who had identified themselves to their academic support office were included, excluding students at the universities who had chosen not to identify. This could have produced over or under representation of transition experiences for this particular sample of students with disabilities" (p. 87). | The data analyzed were based on survey respondents' self-report. "There is no manner to ensure that respondents answered each item honestly and to the best of their ability" (p. 87). | ||
| Worland (2014) | ". . . likelihood for selection bias and the influence of individual differences on the group comparisons requires additional research to generate conclusive findings" (p. 138). | ". . . sample size. . . . significant limits to my ability to disaggregate student performance across student subgroups such as students with LD, students who are EL, and students who are dually exceptional. . . . due to limits in sample size and its resulting effect on power, I was unable to run statistical analyses for all outcome variables that I collected data for" (p. 135). ". . . the population at my selected school setting is very unique. The combination of its urban setting, immersion program and the diversity of students may present threats to external validity factors such as generalizability of individuals" (p. 136). | ". . . very limited information available on students' baseline skills across grade levels and learner sub-groups" (p. 136). ". . . not able to isolate the potential effects of instruction due to limited access to teachers for follow-up interviews regarding their reading and writing instruction practices in the classroom. . . . Given the possibility of instructional effects on student performance, additional information on students' backgrounds and learning experiences in the classroom would have been helpful to contextualize the above findings" (p. 136). ". . . while the use of multiple assessment measures and multiple assessments helped to control for mono-method bias and mono-operation bias, it may have lead to threats to internal validity in the areas of fatigue, and history" (p. 136). | ||
| Yakubova & Bouck (2014) | The researchers asserted that their single subject study was designed to have a relatively small number of participants, yet also recognized that "[h]aving a large number of participants may have produced different results in identifying the more effective type of calculator . . ." (p. 124). | The test items, calling for computation and solving word problems, "did not specifically require the use of scientific or graphing calculators. Students used only basic operation buttons of both calculators to solve problems that could also be performed with a four-function calculator" (p. 124). | |||
| Young (2013) | Phase 1 (qualitative): limited to academic advisors in postsecondary institutions in Alabama, Louisiana, Mississippi, and Tennessee; may not be generalizable to other US regions. Phase 2 (quantitative): recruitment was limited to academic advisors who were members of two national and 25 state professional associations, or employed at 300 postsecondary disability or student support services offices. Because of these recruitment strategies, at least one factor may have introduced bias: professionals who work as full-time advisors and who are members of professional associations might also align themselves with a developmental approach to advising. | ||||
| Zebehazy & Wilton (2014) | Although the survey respondents were from various parts of the U.S. and Canada, the sample was not "sensitive to regional differences" (p. 15). | The survey employed an online delivery platform, so the respondents' interpretation of items could have been different than the researchers' intent. The survey used a rating scale which did not yield details such as reasons for respondents' concerns about assessments not being "appropriately adapted" (p. 15) | |||
| Zhang et al. (2014) | The sample of students with geometry difficulties (including both students with and without disabilities) was defined as those participants scoring less than 40% correct on the researcher-developed test that used items from the state's geometry curriculum. The study was conducted in the southwestern U.S. in a district with a large proportion of students from racial/ethnic minorities. | ||||
| TOTAL | 22 | 35 | 18 | 22 | 3 |
Table G-2. Future Research Directions by Researchers and Future Research Categories
Note. Direct quotes from the articles appear within quotation marks.
| Authors | Methodology | Sample Characteristics | Test / Test Context | Results | Other |
|---|---|---|---|---|---|
| Abedi & Ewers (2013) | none | none | none | none | none |
| Alkahtani (2013) | none | none | none | none | none |
| Barnhill (2014) | Explore research which answers these questions: ". . . what is the best way to balance the integration of these students into the general college population so that they are not segregated and isolated and at the same time provide them the needed supports that may require instruction in a more individualized manner?" (p. 11); ". . . is there a need to develop more structured admission criteria to these specific support programs to determine which students might be best served and is there a need to develop summer transition programs to assist students in developing the required skills to be successful at college?" (p. 11). | ||||
| Berger & Lewandowski (2013) | ". . . would be better served if LD diagnoses can be verified through direct testing, and LD participants actually demonstrate impairment in areas for which they receive accommodations (i.e., writing fluency or spelling)" (p. 315). ". . . we need research that is international or cross-cultural in design so that we can better understand the procedures and policies various countries use for verifying disabilities and granting test accommodations" (p. 315). | ". . . could explore the use of computers on classroom-wide exams and high-stakes tests across grade levels and types of students" (p. 315). | "Of course, there are many variables that can be explored with regard to computerized writing beyond length and quality measures. The value of a word processor for spelling, grammar, vocabulary, revising, and so on should be a focus of research for students with and without disabilities" (p. 315). | ||
| Botello (2014) | The researcher recommended that studies use different data collectors who also provided observation data: ". . . another individual, other than the classroom teacher, should tally the results for all groups of children throughout the testing window. . . . tighten up the procedures of the student engagement tally sheets by requiring more observations of students per session. Another way to implement this would be to videotape and record each child as the test was presented" (p. 106). | Increase sample size for studies: additional participant samples, including for groupwise comparisons, such as adding range of socioeconomic status diversity and race/ethnicity, and directly comparing performance scores of students with and without learning disabilities, as well as students with and without other disabilities and examining performance data for "potential gender differences" (p. 105). ". . . explore reading comprehension and student engagement differences of black computer screen displays versus white computer screen displays for these population subgroups of students . . ." (p. 105). | ". . . the procedures for the computer lab and the expectation for goal setting should be addressed . . . incentive motivated students to pay attention and perform their best. The researcher believes that all teachers should implement this incentive in the classroom to help students improve their reading comprehension and positively impact their student reading engagement. Internal motivation is another possible avenue to explore, and adding a qualitative measure in addition to the quantitative measures could possibly give some insight into student motivation and increases or decreases in reading comprehension scores and student reading engagement on a computerized benchmark assessment" (pp. 106-107). | ||
| Brumfield (2014) | Engage student participants with disabilities and average intelligence from various backgrounds, beyond the low-SES area in this study's sample. | ||||
| Buzick & Stone (2014) | ". . . it is important that researchers are as thorough as possible when describing their research designs. . . . some studies did not specify features such as disability subtype or read aloud mode, and this reduced our ability to identify possible trends" (p. 23). | "Because of the large percentage of variation in effect sizes, our understanding of the effect of read aloud would benefit from additional studies (e.g., an experimental study on text-to-speech and one that compares grade-level effects on the reading assessment) that replicate some of the factors in previous research" (p. 23). "In collecting validity evidence, it is also critical to know what parts of the test were read aloud in order to determine whether the accommodation changes the construct being measured. This information will be useful [end of p. 23] in collecting further evidence for evaluating the appropriateness of testing accommodations" (pp. 23-24). | |||
| Cawthon & Leppo (2013) | N/A -- literature review | N/A -- literature review | N/A -- literature review | N/A -- literature review | N/A -- literature review |
| Cawthon et al. (2013a) | Uncover how students with disabilities understand standard and adapted items through studies using think-alouds or other approaches. Also, "qualitative studies that focus in a fine-grain way on discourse or text/other semiotic representations differences and outcomes would also be helpful in refining why and how item features work or don't and for whom" (p. 95). | The researchers indicated, "Full assessments, with enough items to provide the kind of reliability and coverage needed to provide information about how well the test functions in a condition intended to retain the cognitive complexity of the standard items, and perhaps in a modified condition for diverse subgroups of students, is a next step in the research process" (p. 95). Investigate the effects of adaptations, such as adding graphics or reformatting information provided for test items, on other academic content assessments, "particularly those that both combine content area knowledge and have potentially varying demands on reading skills such as social studies or mathematics. . . . The original project revised test items for multiple subject areas across the elementary and middle grades, and future analyses will focus on how the effects of adaptations may differ between subject areas" (p. 95). | |||
| Cawthon et al. (2013b) | Directly investigate the experiences of students with deafness and hearing impairments about their views of accommodations quality (not their educators) | Investigate the individual characteristics of students with deafness and hearing impairments "and the match with accommodations in different settings" (p. 448). | |||
| Crawford & Ketterlin-Geller (2013) | ". . . compare schools with different demographics to determine continuity of the findings reported herein" (p. 43). | ". . . developing a quantitative measure of these constructs across a larger sample of schools and teachers to provide more conclusive data about what teachers know regarding assignment of test accommodations, and more importantly, what they need to know" (p. 43). | |||
| Finch & Finch (2013a) | none | none | none | none | none |
| Finch & Finch (2013b) | Increase sample size for each category of student participants, which would then "potentially [lead] to a clearer picture of which covariates were associated with latent trait membership" (p. 992). | ". . . expand this work by examining the performance of the MMMixRM [multidimensional multilevel mixture Rasch model] with a multidimensional scale designed to measure a more unitary construct, such as reading or math, as opposed to two clearly distinct constructs as was done here" (p. 992). "Given the increasing popularity of constructed response items in many assessments, . . . the extension of the MMMixRM [multidimensional multilevel mixture Rasch model] to the polytomous item case" (p. 992). | |||
| Fincher (2013) | none | none | none | none | none |
| Freeman (2013) | Examine the effect of number of response options for students with diverse demographic variables (e.g. gender, race/ethnicity, socioeconomic status). Examine the effect of number of response options for students with disabilities, by disability category. "There are several challenges presented with trying to create a universally designed, accessible assessment for students with such a wide variety of abilities. In better understanding the intricacies of these specific eligibility areas, test developers would be better equipped to meet and address these challenges" (p. 86). | ". . . to assess the impact of student performance over time. . . . analyze the test performance of same students with disabilities over several years. . . . This study could provide more information regarding how student performance changes as students have more opportunities to experience multiple choice testing" (p. 87). ". . . to assess the impact of external testing accommodations on student performance. . . . Some researchers argue that universal design for learning [principles], when properly implemented during the assessment development, should reduce the need for external accommodations. . . . certain external test accommodations, like read aloud, would alter the construct being assessed and provide an unfair advantage to a certain population of students. Evaluating the impact of testing accommodations would aid test developers in addressing these issues and provide more information regarding the utility and validity of these accommodations" (pp. 87-88). | |||
| Hawpe (2013) | Explore correlations between attitudes toward and willingness to provide accommodations and other individual teacher factors (e.g., teacher degree level, subjects taught, grade levels taught, years of teaching experience). ". . . replicate this research study at some point in the future in the WPS [Wichita Public Schools] and compare the results to the current research study. Teacher attrition and mobility rates may provide a different sample in the future as many staff placement changes occur every year" (p. 184). ". . . replicate the current research study in different school districts with similar and dissimilar characteristics to the WPS [Wichita Public Schools]. Similarities and differences in secondary teachers' attitudes and willingness to provide accommodations and modifications could be compared to a rural, suburban, and other urban school districts" (p. 184). | ". . . replicate the current research study with adjustments made to the language of the current survey. The language of the survey could be changed to reflect statements targeted toward individuals with specific types of disabilities such as learning disabilities or autism" (p. 184). | Use the survey as a pre- and post-test, with the intervention of providing professional development "related to attitudes toward persons with disabilities and willingness to provide accommodations and modifications" (p. 185). The purpose of the survey would be assess any changes in these variables, in order to "aid in identifying the relationships between the professional development provided, attitudes toward persons with disabilities, and willingness to provide accommodations and modifications" (p. 185). | ||
| Higgins & Katz (2013) | Increase sample size, including student participants with blindness and visual impairments "to understand how different audio representations should be developed for students with visual access needs" (p. 65). | ". . . researchers should consider bridging the gap between learning and assessment audio representations to ensure that students receive consistent audio support in the classroom and during assessment. Larger scale audio representation research has the potential to reveal more themes and lead to the development of comprehensive audio guidelines that can be applied to learning and assessment content consistently in order to create standardized audio representations. This will ultimately improve test reliability and, therefore, validity for students in need of audio support for assessment" (66). | "More research and development is needed to create comprehensive guidelines that educators and assessment item writers can use to make mathematics content accessible to students with different access needs (pp. 65-66). ". . . probe for understanding of differences between student performance and preferences" (p. 66). | ||
| Huggins & Elbaum (2013) | "Future studies using national or international data may have the capacity to divide groups by type of accommodation when performing SEA. Studies of this nature would be able to provide more nuanced information to practitioners about which types of accommodations are least likely to introduce measurement invariance concerns in reported test scores" (p. 69). | "This study demonstrated the utility of SEA for assessing this type of measurement comparability . . . Researchers are encouraged to apply this methodology consistently to inform validity concerns about reporting standardized test scores for students using test accommodations" (p. 70). | |||
| Ketterlin-Geller et al (2014) | Gather feedback on the Screening to Assign Accommodations Tool (SAAT) from additional professionals and others, beyond the "small population of experts" (p. 84) in this study. | Address misidentification of students as at risk of or having disabilities. | Evaluate the use of the Screening to Assign Accommodations Tool (SAAT) for its accuracy in making accommodations recommendations. Ascertain the consequential validity of the SAAT. | ||
| Klehm (2014) | Expand focus about alternate assessments beyond students with intellectual disabilities, to other disability categories; examine whether students with other disabilities demonstrate differently their knowledge on alternate assessments. | "It is important to find out if AA-GLAS are more valid measures than the current system of assessment for SWD, as the vast majority of teachers feel that current large-scale assessments are not a valid way to assess the achievement of SWD" (p. 237). | Investigate "the types of training and professional development that would be most beneficial for teachers of inclusive programs" (p. 237). ". . . qualitative research should be conducted to investigate why teachers hold the dominant attitudes reported and use research-based practices to the extent that they do, and to determine the resources that they need to provide quality instruction that meets the needs of SWD" (p. 237). | ||
| Lee & Chen (2014) | ". . . a qualitative research method can be adopted to understand how virtual manipulatives affect learning to provide a reference for the design of learning activities using virtual manipulatives" (p. 199). | Increase sample size; examine performance and data pertaining to various individual differences among students (e.g., learning style) when using virtual manipulatives | Applying the same research approach, investigate effects of virtual manipulatives on performance in other math content (such as algebra or probability) ot to other academic content (chemistry or physics) | ". . . although the virtual and physical environments had different features, both the virtual and physical manipulatives were effective in supporting students' delayed learning in different ways. This implies that simply replacing the physical materials with virtual materials does not affect students' delayed learning performance as long as the method of instruction is preserved. An in-depth examination of this issue should be conducted in the future" (p. 198). | Examine intervention effects of teaching strategies "(such as game-based learning)" (p. 199) on student performance using virtual manipulatives |
| Leppo et al. (2014) | none | none | none | none | none |
| Lewandowski et al. (2013) | Engage participants with learning disabilities but without other disabilities; alternately, compare effects with students with other disabilities, such as attention-deficit hyperactivity disorder or anxiety. | ||||
| Lewandowski et al. (2014) | ". . . should try to verify students with disabilities and match them to nondisabled students of similar age, sex, race, and educational attainment" (p. 123). ". . . combine quantitative and qualitative methods to better discern the perceptions of students about the use of test accommodations" (p. 123). | Recruit postsecondary student participants with various disabilities and compare the survey responses by disability groups regarding their accommodations perceptions. | ". . . investigate whether students' perceptions of benefits from accommodations are related to their actual degree of benefit" (p. 123). | ||
| Lewis & Nolan (2013) | ". . . investigate the prevalence of sensory defensiveness both within specific groups of college students with ADHD, Asperger's Syndrome and DCD and also with the overall student population" (p. 171). | Evaluate settings, for testing and otherwise, in which postsecondary students with sensory defensiveness have encountered difficulties; these study results could facilitate "the planning of college buildings as well as the development of other reasonable accommodations" (p. 171). Compare student performance effects when using types of low-distraction test setting | |||
| Li (2014) | Examine whether and how disability category might interact with effects of oral delivery accommodations | "In a preliminary exploration, we attempted to code whether the test items were multiple-choice, constructed-response questions, or both, hoping that this would at least partly indicate the readability of the test items. However, only a few studies used tests involving constructed response questions, and we were not able to include item type as a predictor. The interaction between test characteristics and read-aloud accommodations therefore is an important issue for further study (Cawthon, Ho, Patel, Potvin, & Trundt, 2009; Ketterlin-Geller, Yovanoff, & Tindal, 2007)" (p. 12). "Testing settings, for instance, whether the test is administrated to individuals, to small groups, or to an entire class, was another related factor that we were not able to include. . . . it would be advisable for researchers to control for potentially confounding factors in order to facilitate a better understanding of the effects of read-aloud" (p. 12). | |||
| Lin & Lin (2013) | "the adverse effects of setting accommodation" (p. 10) for students without disabilities | ||||
| Lin & Lin (2014) | ". . . future test development and research on examining accommodation-related DIF [differential item functioning] should consider examinees' latent abilities and characteristics that define the student populations in addition to their accommodation status" (p. 785). | ||||
| Lovett (2014) | none | none | none | none | none |
| Lovett & Leja (2013) | Investigate the role and effect of students' perspectives about accommodations on the decision-making process. Determine the degree to which students with disabilities have identified the actual impact of accommodations on assessment performance: "student perceptions should be accompanied, whenever possible, by an empirical examination of the actual effects of the accommodation on that student's test performance" (p. 86). | ||||
| Lyman (2013) | "Potentially rich information regarding barriers to accommodation use could be gained from using a population of SWD [students with disabilities] who are not registered with DSS [disability support services]. This potential research could reveal barriers that simply are not part of the experience of students that are aware of and have used DSS" (p. 72). | This study also suggests benefit in looking at barriers to accommodation use with more complexity and specificity (p. 72). The researcher noted that many contextual factors related both to students using accommodations and aspects of the provision of and results from accommodations could be investigated. He noted, "[a]though this type of research may be difficult, it could potentially provide DSS [disability support services] providers and SWD invaluable information in helping make decisions regarding if and when to utilize accommodations" (p. 73). | |||
| May (2013) | Because these faculty have roles of instructing as well as clinical practice, there were indications in the study results about difficulties in clarifying accommodations issues in instructing nursing students and accommodations needed when nursing students provide patient services in clinical settings; research is needed for identifying and differentiating these issues. The researcher pointed out that research could ". . . examine the validity of technical standards that nursing students are held to and to the development and testing of strategies amenable to accommodation. Fear and uncertainty could be replaced by evidence-based practice that could improve the clinical environment for both students and patients alike. . . . Additional research into best clinical practice would be an avenue to creating the ideal environment for learning in the clinical setting" (p. 116). | ". . . focus on the context of the social contact with people with disabilities (e.g., as peers, colleagues or patient) and the differences in attitudes associated with different types of social contact. . . . the manner in which people with disabilities are represented in the curriculum (e.g. from a health promotion and prevention perspective or from a medical or disease model) could be examined . . . This type of research would shed light on if and how nursing students are introduced to people with disabilities within nursing and could provide opportunities to assess and modify the place that disability content has in the curriculum. Further, qualitative studies that examine the experiences of people with disabilities and their perceptions of nurses, nursing care and the potential for a career in nursing could be explored. . . . Additionally, nursing research needs to address ways that the nursing profession can be more inclusive of people with disabilities" (pp. 116-117). ". . . explore avenues to remedy knowledge deficits and provide evidence-based professional development activities with the potential to better prepare faculty to identify their own learning needs related to students with disabilities. Opportunities for implementing creative teaching and learning strategies may be born from this type of faculty assessment and research" (p. 117). | |||
| May & Stone (2014) | ". . . it would be expected that, if ST [stereotype threat] does indeed impact students with LD, the potential study population would be limited further by the fact that few such students would want to participate in a study that would arouse the degree of discomfort typically associated with ST. One possible approach to addressing this issue would involve accessing potential participants via the graduation records of high school special education departments" (p. 102). | "Because ST [stereotype threat] is by default in the ‘on' position in undergraduate tests and because many students, even those with invisible differences, appear vulnerable to negative stereotypes regarding their performance, research on the test performance of all students should be undertaken to determine how factors such as ST may cause educators to underestimate the academic performance of many" (p. 102). | ". . . modifying the ST [stereotype threat] manipulation are to use an identity-priming manipulation or a test-bias manipulation instead of the task-reframing manipulation used in the present study. For instance, Vick et al. (2008) used the ST manipulation of telling female participants in their study that the challenging math test they were about to take had shown gender differences in performance in previous studies" (p. 102). | ||
| Meyer & Bouck (2014) | Investigate effects of text-to-speech of various types ". . . using programs with features designed to support readers with poor comprehension and good fluency, readers with good comprehension and poor fluency, and readers who need to improve both fluency and comprehension" (p. 31). | ". . . implementing a similar study in a general education setting with authentic curricular materials relevant to specific classroom materials and practices and address whether comprehension can be improved with supported eText offering online dictionaries, outlining or highlighting of main ideas and details, and/or performance feedback features" (p. 31). | |||
| Miller et al. (2013) | "This study should be replicated with a general, more representative ADHD sample that meets an impairment criterion. . . . include an ADHD sample that meets DSM-IV critera, including evidence of impairment. The sample ideally would control for comorbid disorders and examine for differences across ADHD subtypes" (p. 7). Increase sample size, including broadening the diversity of student participants "from different educational backgrounds with varying levels of academic demands" (p. 7). | ". . . to more carefully control for the use/nonuse of medication. It would be particularly interesting to conduct a study that compares performance on a timed high-stakes test for individuals receiving medication treatment versus those receiving only extended time" (p. 7). ". . . to examine some of the other common test accommodations (i.e., separate room, extra breaks, use of a computer) for students with and without ADHD" (p. 7). | |||
| Nees & Berry (2013) | none | none | none | none | none |
| Newman & Madaus (2014) | ". . . on student disability-related self-perceptions would be invaluable in clarifying these issues and enhancing student decision making related to disclosure and accommodation request. . . . related to the factors that drive who receives supports, who discloses a disability, and the impact of receipt of these supports on school completion and persistence" (p. 9). ". . . to understand the link between accommodations, supports, and help with schoolwork and postsecondary education outcomes for students with disabilities" (p. 9). | ||||
| Overton (2013) | Engage student participants from more than one school district; increase the number of participants; draw student participants from several counties; include students without disabilities as a comparison group. | . . . administer the assessment earlier in the school year when students are still focused on the academics needed to complete the school year (p. 84). Student participants need to be given opportunities to practice using accommodations prior to test day. "There should also be controls designed to ensure the students follow the instructions to read aloud when instructed to do so" (p. 86). ". . . focus on isolating the reading condition variable. . . . using either only narrative type or expository type text" (p. 92). Examine effects of student-reads-aloud accommodation on reading comprehension for different narrative genres; the current study used nonfiction text, yet fiction is common on state assessments. | The researcher indicated that test administrators need to have formalized training on the student-reads-aloud accommodation. An alternative approach would be making use of graduate students with formal assessment training, in order to "help ensure fidelity of treatment during the study" (p. 87). | ". . . address other questions. . . . if the student-reads-aloud accommodation is beneficial to student performance on only one text type, can students be taught to self-monitor their reading to recognize when there is a need to adjust their reading condition in order to demonstrate higher comprehension? In other words, can the students recognize the individual need to read silently when confronted with some material or read aloud when confronted with other material in order to improve their overall understanding of the material?" (p. 92). | |
| Russell (2014) | "Perform a similarly designed study, but focused on grade level differentiation instead of special education program grouping" (p. 162). Conduct a "longitudinal study to find the effects of using the calculator as an accommodation over time" (p. 163). "Could also attempt a mixed methodology or only qualitative methodology. Due to the fact that the researcher was employed in one of the schools and worked with some of the students, any methods that could have triggered subjectivity were excluded. An outside researcher could attempt interviews with teachers and survey for students to complete the picture on calculator effectiveness as accommodation" (p. 163). Conduct a qualitative study of surveying "people involved in the decision making and implementation process of this accommodation at various levels: administrators, teachers, and students using the accommodation, their parents and even peers to understand its overall effect, not only on student performance, but on the student self-esteem and/or peer acceptance" (163). | Increase sample size, selecting students from more districts or states. "If grouping based on type of special education services would also be investigated, larger sized subgroups would permit meaningful comparisons among subgroups as well" (p. 162). Examine effects of calculator accommodation on performance of students with other disabilities, "such as Other Health Impairment or Mild Mental Impairment . . . The findings of that study may guide IEP teams in choosing the right accommodation for the students featuring a particular type of disability" (p. 163). | "Develop a test-retest design conducted with an experimental framework that could compare performances on a state standardized assessment after the implementation of the accommodation with and without a calculator. This would possibly require the State Department of Education to perform the assessment twice or to supply a similar/retired assessment with two forms for a researcher to administer" (p. 162). | ||
| Schreuer & Sachs (2014) | "conduct similar comparative studies in other countries operating under different accommodation provision models" (p. 35). | ||||
| Smith (2014) | Investigate about the high school to college transition experience by inquiring about it with students with disabilities, their family members, and their secondary educators, and seeking their perspectives. ". . . identify students with disabilities who have chosen not to utilize accommodations at all, in order to better understand their perspectives and experiences" (p. 109). | ". . . explore students' experiences prior to utilizing accommodations, as well as their decision to use accommodations" (p. 108). | |||
| Smith & Riccomini (2013) | Participants could be provided more practice time using the noise-reduction headphones. | Increase sample size, including student participants from many schools, with broader demographic diversity | Investigate effects of noise-reduction devices on other academic content areas (other than reading) and on other assessments (other than reading comprehension) | ||
| Stein (2013) | ". . . to survey . . . regarding the accommodations and supports they receive from DSS [disability support services]" (p. 159), as the current study interviewed students. "It would also be interesting to explore the perceptions of students with disabilities enrolled in classes where the instructor adheres to the principles of UDI [universal design for instruction] (McGuire, Scott, & Shaw, 2003)" (p. 159). | Increase sample size of postsecondary students with psychological disabilities, as the current study had 16 participants, with the idea that "surveying a larger sample may provide additional insight into the supports and services beneficial to college students with psychological disabilities" (p. 159). ". . . explore the experiences of individuals with psychological disabilities attending postsecondary institutions who do not seek formal accommodations or other assistance from DSS [disability support services]. Specifically, what types of supports are they using? How are they coping with and managing the challenges presented by their disability? Do they seek accommodations informally, and if so, how do their professors respond? This could be done through a variety of research methods, including a mixed methods study involving a survey and individual interviews" (p. 159). | |||
| Stone et al. (2013) | The researcher suggested that the low correlation between condition-adaptive routing test and students' state test scores requires further investigation about possible reason: "Because one of the goals of the study was to investigate an assessment that realistically reflected the characteristics of a typical state assessment, these hypotheses should be pursued" (p. 29). "The adaptive nature can provide benefits for students who are performing in the tails of the proficiency distribution, but further investigation is required before some of the issues associated with using adaptive models with students with disabilities are resolved. In the case of the model used for this study, a key issue is how to provide a routing test that is on grade level but that is matched well enough to the ability level of the target group to provide scores that are reliable enough for routing purposes" (p. 29). | ||||
| Szarko et al. (2013) | Increased sample size of students with autism; "more focused samples of children with autism" (p. 47). | Examine whether there are assessment performance differences for other standardized testing; ". . . it is possible that more experienced examiners who were familiar with autism could have better overcome the effects of unfamiliarity" (p. 48). | Investigate the factors related to the effects of familiar examiners on student performance. | ||
| Torres (2014) | The researcher suggested using surveys to "explore the perceptions of students with ASD [autism spectrum disorders] of their postsecondary educational support" (p. 262); the current study used interviews. Another approach would be to extend the investigation into a longitudinal study, with analysis of how students' perceptions of accommodations and supports might change across the courses of their postsecondary education. | Increase sample size and broaden the inquiry to include students with autism spectrum disorders in postsecondary across the US. Expand the current study's approach ". . . to study the experience of students with ASD transitioning to postsecondary education in comparison groups alongside students with other disabilities and students without disabilities to see how similar or different their experiences are" (p. 262). | |||
| Wadley & Liljequist (2013) | General need to analyze effects of various accommodations on assessment performance. ". . . investigate factors that enhance performance for students with specific disabilities. For example, it may be that providing different or multiple testing accommodations results in improved performance. Further, this research may help us better understand how testing accommodations function to increase test scores in all academic settings. By understanding how accommodations affect students, we can better adjust them in the future to meet the needs of students in appropriate ways" (p. 269). | ||||
| Wizikowski (2013) | The researcher argued for "a need for expanded national data to be collected for students with disabilities. Current data are collected only from parents whose children received special education services in high school through longitudinal transition studies and colleges using the Postsecondary Education Quick Information System (PEQIS). These data exclude students who are identified with a disability after high school and have chosen not to identify to their college. As a growing demographic of students, researchers need comprehensive, student-centered data sets that show national trends over time for a variety of dimensions such as retention, disclosure patterns, employment outcomes, graduate school attendance, and time to graduation rates" (p. 90). | "The effectiveness of accommodations also needs to be studied on a large scale. Accommodations currently offered at colleges were created decades ago for a very different set of students with disabilities (e.g. transcription). Today, the demographic of students with disabilities looks very different and a review of available services is critical to making sure students are supported. Students expect a more specialized interaction with academic supports and do not see most accommodations as effective" (pp. 89-90). | Examine the potential relationship between postsecondary students' self-confidence / self-advocacy and retention rates / success rates, including the outcome implications for students who have little self-advocacy knowledge. | "Transition plans need to be studied in a more comprehensive manner. How these services are planned, coordinated between secondary and postsecondary settings, and how information is disseminated deserves study to ensure that all students understand the shift in services from one setting to the next (p. 89). Investigate self-disclosure to professionals by postsecondary students with disabilities, including "disclosure and non-disclosure patterns and motivations" (p. 89) and how the patterns "could connect with many other areas of future research as well, such as campus climate, accommodations, and services" (p. 89). | |
| Worland (2014) | "While in this study I did not use an analytic rubric that included a category on the use of evidence from text read, this is a category on both the PARCC and SBAC rubrics. Accordingly, adding this variable should be an area for future research as well" (p. 139). | Increase sample size and broaden participant diversity, such as students with learning disabilities and English learners. Investigate the effects of oral delivery on the performance of "developing readers and students with different learner characteristics" (p. 137). ". . . investigate the procedure for providing the read aloud accommodation to see if there is a differential effect for students depending on the population" (p. 138). | Investigate the same study purposes and goals as the current study, but with a different community setting, in order "to see if the findings above might be unique to urban and/or immersion classroom populations" (p. 137). ". . . consider testing the effects of each of these supports individually and conjointly within and across genres to identify the best possible combinations of supports for developing writers" (p. 139). "The new writing assessment formats also warrant further exploration. If the next generation writing assessments will all follow the read and respond type of structure, additional research into the effect of different types of texts and task environments are needed to ensure that these types of writing assessments can reliably assess the construct of writing as opposed to reading. In particular, further analysis of writing samples to determine the relationship between students' use of evidence from texts and their resulting writing quality is warranted" (p. 139). "In addition to exploring the effects of different types of accommodations and supports for struggling learners, specific attention should be directed to exploring how dually exceptional students who are EL and have LD write. Very little is known on how this growing population of students write and given their poor performance relative to all other peers in this study, this population deserves additional support and attention. Moving forward, qualitative analysis of the writing of the participants in this study could yield interesting insights into similarities and differences, as well as areas of strengths and needs in the writing of this sub-group of students" (p. 139). | ||
| Yakubova & Bouck (2014) | Increase student participant sample size, including students with mild intellectual disabilities in secondary schools | Compare effects of basic (four-function) calculator to other types of calculators with additional capabilities | ". . . examine the impact of graphing and scientific calculators on students' performance in solving more advanced problems using specific features of these calculators" (p. 125); in other words, the researcher suggested extending the inquiry beyond computation and word problems. | ||
| Young (2013) | "Through the use of the Postsecondary Academic Advisement Practices Questionnaire (Appendix B), institutions of higher education could evaluate advisors' knowledge of appropriate responses, as determined by disability law and accommodation requirements, to potential advisement scenarios involving students with disabilities" (pp. 148-149). ". . . evaluate existing academic advisor training programs or workshops to identify effective strategies for incorporating detailed information pertaining to the unique needs of students with disabilities, disability law, and accommodation requirements" (p. 149). | Conduct interviews with academic advisors from other regions of the US (not the southeastern region). Conduct interviews with advisors who might not have a developmental view of advising, that is, who would not necessarily be accessible using the researcher's strategies of inviting members of national or state academic advising associations and contacting disability services and student support services offices at higher education institutions. Conduct interviews with advisors who do not provide advising on a full-time basis, such as faculty members who also instruct. | "Data collection for the 2012 National Longitudinal Transition Study sponsored by the U.S. Department of Education will continue through Spring 2014. Future research could compare the results of this study with the findings from the 2002 National Longitudinal Transition Study-2 to identify trends related to students with disabilities in higher education and determine if a higher percentage of these students have been receiving the accommodations necessary for increasing their likelihood of success" (p. 149). | ||
| Zebehazy & Wilton (2014) | Include students with blindness and visual impairments--in addition to teachers of these students--in order "to provide additional insight into how professionals can best support students to effectively access, comprehend, and manipulate information included in graphics" (pp. 14-15). | ||||
| Zhang et al. (2014) | Include many assessment results for defining difficulties in geometry, "such as standardized geometry tests (e.g., Key Math), state standards-based assessments in geometry, and teachers' classroom observations" (p. 12) | Engage participants across many grade levels; "consider involving grade as a covariate" (p. 12). Include diverse demographic data in analysis. | |||
| TOTAL | 17 | 32 | 26 | 15 | 10 |
