Sheryl S. Lazarus, Deb Albus, and Martha L. Thurlow
February 2016
All rights reserved. Any or all portions of this document may be reproduced and distributed without prior permission, provided the source is cited as:
Lazarus, S. S., Albus, D., & Thurlow, M. L. (2016). 2013-14 publicly reported assessment results for students with disabilities and ELLs with disabilities (NCEO Report 401). Minneapolis, MN: University of Minnesota, National Center on Educational Outcomes.
Executive Summary
Overview
Method
Results
Summary and Conclusions
References
Appendix A: Material Used for the Verification Process
Appendix B: Data Tables
This is the seventeenth report by the National Center on Educational Outcomes (NCEO) that describes how states publicly report online assessment data for students with disabilities in K-12 schools in the United States. The Individuals with Disabilities Education Act (IDEA) and the Elementary and Secondary Education Act (ESEA) require states to disaggregate participation and performance data at the state level. The ESEA flexibility waivers that many states received also require states to report for the "all students" group as well as for all of the subgroups, including students in special education, as long as the number of students in a subgroup is equal to or above the minimum reporting number defined by the state.
This report presents information on publicly reported participation and performance data for the 50 regular states and the 11 unique states (American Samoa, Bureau of Indian Education, Commonwealth of Northern Mariana Islands, U.S. Department of Defense Education Activities, District of Columbia, Federated States of Micronesia, Guam, Palau, Puerto Rico, Republic of the Marshall Islands, and U.S. Virgin Islands).
For the 2013-14 school year, 45 of the 61 states reported participation and performance data for students with disabilities for all general assessments, and 48 states reported these data for all alternate assessments based on alternate achievement standards (AA-AAS) that were used for the Title I accountability system. Information about state assessments not used for Title I is also presented.
Information on public reporting for English Language Learners (ELLs) with disabilities is also included in this report. Only 4 states reported both participation and performance for ELLs with disabilities for the general assessment. But, as in previous years, more states (N=18) reported these same data for ELLs with disabilities on the AA-AAS.
A majority of states reported some participation and performance data by individual grade and test for students with disabilities, though a few only reported these data by merged grades or tests. Thirty-five of the regular states reported student performance by achievement level, and 33 reported the percent proficient. For all states including unique states, 37 states reported by achievement level and 36 states reported percent proficient.
This report also includes an analysis of the ease of finding these publicly reported assessment data for students with disabilities on states’ department of education websites. This involved counting the number of mouse clicks that it took to arrive at public reports for students with disabilities on the general assessment and AA-AAS. For 32 states it took 3-4 clicks to arrive at the general assessment data, and 5 to 7 clicks for 11 states. For AA-AAS data, 35 states required 3-4 clicks, and 5 to 7 clicks for 11 states. We note in this report that although shorter paths to data infer ease of use, that this is not always the case. States that use terms on their websites that do not explicitly refer to assessment data in order to locate data are harder to use than a state that is explicitly referring to assessment data, but that take a longer path to follow. Examples of these terms include names of report generator sites that may not be familiar to users, or other terms that infer data analysis but are not clear about what type of data are being provided.
Although states may make changes via waivers or other processes, the public reporting of data will continue to be an essential part of accountability systems. And, as states make transitions to new assessments based on common core standards, it will be important to continue to strive for clear reporting of student data. The following recommendations are offered to states for the public reporting of disaggregated data for students with disabilities:
Top of Page | Table of Contents
Under the Individuals with Disabilities Education Act (IDEA) and the Elementary and Secondary Education Act (ESEA), states that receive funding, including unique states, are required to report Reading, Mathematics, and Science assessment data to the federal government for all students and student subgroups. They are also to report these data to the general public. Also, the ESEA flexibility waivers that many states received require states to report on their report cards, for the "all students" group and for all of the subgroups, including special education (U.S. Department of Education, 2013). In addition to state reports, other types of public reports found online include state assessment reports, and customized reports on state education websites (Albus, Lazarus, & Thurlow, 2014).
The purpose of this report is to analyze the extent to which states report data for students with disabilities "to the public with the same frequency and in the same detail as it reports on the assessment of nondisabled children," as required by IDEA (Wiley, Thurlow, & Klein, 2005). It also describes how states report participation and performance data to the public, with additional analyses focusing on average performance gaps across years. The report also summarizes the extent to which states report participation and performance for English language learners (ELLs) with disabilities and the reporting of accommodated student data.
The National Center on Educational Outcomes (NCEO) has been tracking and analyzing public reporting for the special education subgroup since 1997. In 2012-13, the total number of regular and unique states reporting disaggregated participation and performance data online for students with disabilities was 52 states (Albus, Lazarus & Thurlow, 2015). This showed an increase of 3 states over 49 reported in the previous year, 2011-12. Before that, the number had been 46 states in 2007-08 and 2008-09 and 53 states in 2010-11 (Albus & Thurlow, 2013; Albus, Thurlow, & Bremer, 2009; Thurlow, Bremer, & Albus, 2011). From 2002-03 to 2006-07, the number of states reporting participation and performance varied between 35 states and 39 states (Klein, Wiley, & Thurlow, 2006; Thurlow, Bremer, & Albus, 2008; Thurlow & Wiley, 2004; Thurlow, Wiley, & Bielinski, 2003; Wiley, Thurlow, & Klein, 2005; VanGetson & Thurlow, 2007).
In 2012-13, the number of states that reported disaggregated participation and performance data for alternate assessments based on alternate achievement standards (AA-AAS) was 52. The number reporting for the AA-AAS had been as low as 36 states in 2006-07 and 2007-08.
Top of Page | Table of Contents
In February 2015, state department of education websites were searched for publicly available reports that disaggregated participation and performance data for students with disabilities for the 2013-14 school year (i.e., state assessment reports, state report cards, customized report generators, and other report formats). Annual Performance Report (APR) were not included in the analysis.
States included in the search were the 50 "regular" states and the 11 "unique" states (American Samoa, Bureau of Indian Education, Commonwealth of Northern Mariana Islands, U.S. Department of Defense Education Activities, District of Columbia, Federated States of Micronesia, Guam, Palau, Puerto Rico, Republic of the Marshall Islands, and U.S. Virgin Islands). Participation and performance data were collected, as well as information about how states reported those data. Data collection included all general and alternate assessments whether or not they are used for the Title I accountability system, including those assessments designed for bilingual students or ELLs that were either general or alternate assessments.
The information gathered about how states reported participation and performance data were then summarized into individual state summary tables for verification. Verification materials were sent to state assessment directors and state directors of special education in July 2015. Twenty-six regular states and one unique state responded to the verification requests. After the verification process was completed, the participation and performance data were analyzed as well as information on how states reported those data. Double checks of the data were completed for accuracy. See Appendix A for a sample email sent to the state directors and sample tables used in the verification process.
There are different types of assessments that states can give, each serving one or more purposes. For example, some are given for accountability, while others are for diploma or graduation purposes. Some assessments may serve dual purposes within a state. Although the data collected for this report included all state level administered assessments presented on state websites, this report focuses on how states publicly reported participation and performance data for students with disabilities on general assessments and AA-AAS. For this analysis the following terms are defined as follows.
General assessment: Any assessment intended for students without disabilities and most students with disabilities that is designed to measure content area performance for Title I accountability or for exit or diploma purposes. General assessments may include end-of-course assessments for states that have them.
Alternate assessment based on alternate achievement standards (AA-AAS): Any assessment intended for a very small percentage of students with disabilities who have significant cognitive disabilities to measure content area performance for Title I accountability, or for exit or diploma purposes. AA-AAS may include end-of-course assessments for states that have them.
This report also provides basic information on alternates based on other achievement standards, such as modified achievement standards and grade-level achievement standards, that were administered by a few states. Detailed information about these assessments is not provided in this report.
Changes in federal policies many years ago for reporting to the U.S. Department of Education, as well as our own criteria, which narrowed after 2004-05, likely affected the changes in the numbers of states reporting on the general and AA-AAS assessments across the years. APR data were not counted as publicly reported data after 2004-05 because these data were not necessarily reported with the same frequency and detail as public reporting for all students (see Thurlow et al., 2008).
Top of Page | Table of Contents
Results are presented in five sections. The first section presents information about how participation and performance data for students with disabilities were reported by states for general and alternate assessments within and outside of the Title I accountability system, and how these same data were reported for ELLs with disabilities. The second section describes the approaches states used to communicate participation data for general assessments. The third section describes the approaches states used to report performance data for general assessments. The fourth section presents select general assessment performance data at the elementary, middle school, and high school levels for reading and mathematics, including information about average achievement gaps. The final section provides information about the public reporting of students using accommodations on state assessments.
Figure 1 shows that 45 of the 61 regular and unique states reported participation and performance for all general assessments used for the Title I accountability system, for students with disabilities. Seventy-four percent of states reported participation and performance for all general assessments, 3 percent reported participation and performance for some general assessments, 21 percent had no publicly reported data, and 2 percent had no general assessments used for Title I.
Figure 2 portrays the participation and performance reporting for the general assessment by state. This map shows that the majority of states had full reporting of participation and performance for students with disabilities on the general assessments used for Title I accountability systems. For details, see Table B-1 in Appendix B.
Figure 1. Extent of Reporting of General Assessment Data for Students with Disabilities Used for Title I [N=61]
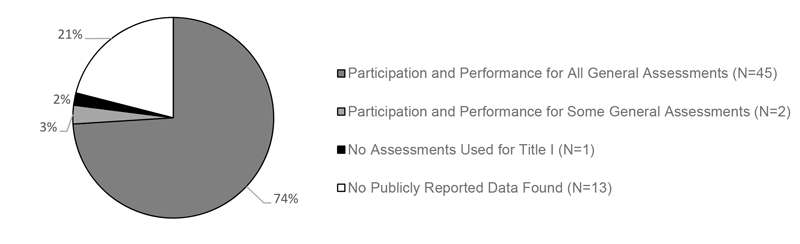
Figure 2. States Reporting 2013-14 Disaggregated Participation or Performance Data for Students with Disabilities on General State Assessments Used for Title I*
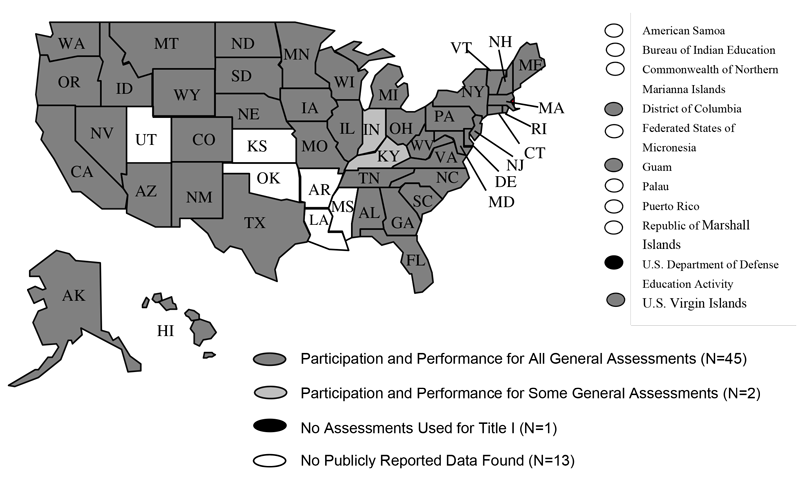
*Note: The figure does not include state APR data. A broad definition was used to determine whether a state had data. States were included if they had any data reported for the assessment (regardless of whether it was across all grades, by grade range, or for specific grades).
States also reported participation and performance for students with disabilities on general assessments not used for the Title I accountability system. Figure 3 shows that of the 22 states that had general assessments not used for Title I, 8 states reported participation and performance data for all tests, 3 reported these data for some tests, and 10 states did not publicly report data. Thirty-nine states had all assessments used for Title I.
Figure 3. Extent of Reporting of General Assessment Data for Students with Disabilities Not Used for Title I [N=61]
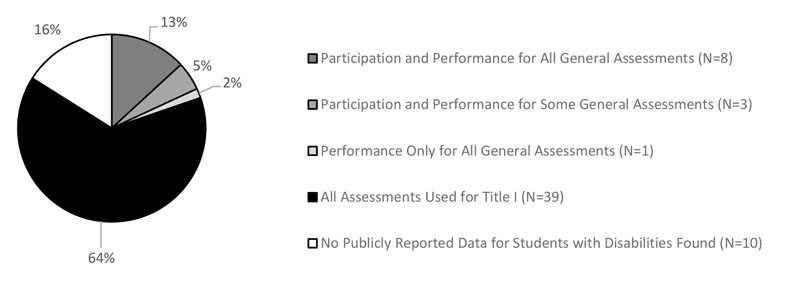
Figure 4 portrays the participation and performance reporting for general assessments not used for Title I by state. This map shows that only a few states publicly reported participation and performance for these assessments. For details, see Table B-2 in Appendix B.
Figure 4. States Reporting 2013-14 Disaggregated Participation or Performance Data for Students with Disabilities on General Assessments Not Used for Title I*
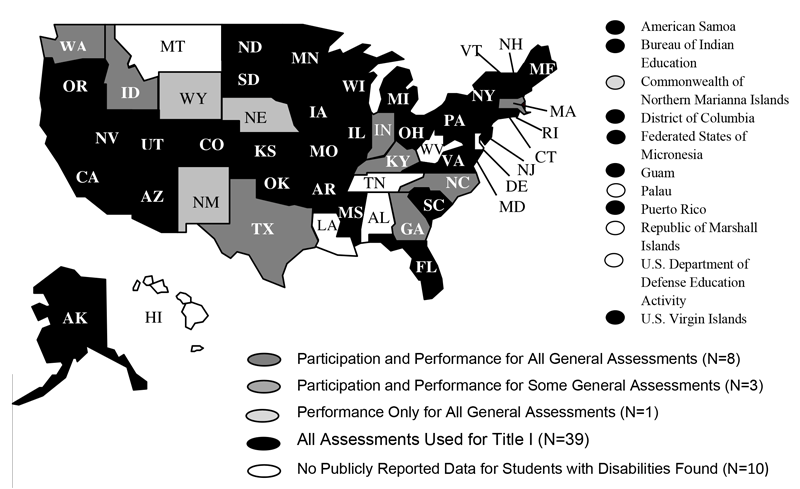
* Note: States were included if they had any data reported for the assessment (regardless of whether it was across grades, by grade range, or for specific grades).
This section addresses the extent to which states reported participation and performance data for students with disabilities on alternate assessments based on alternate achievement standards (AA-AAS) used for Title I. Figure 5 shows that 48 states reported data for the AA-AAS. This represents 79% of the states.
Figure 5. Extent of Reporting of AA-AAS Used for Title I [N=61]
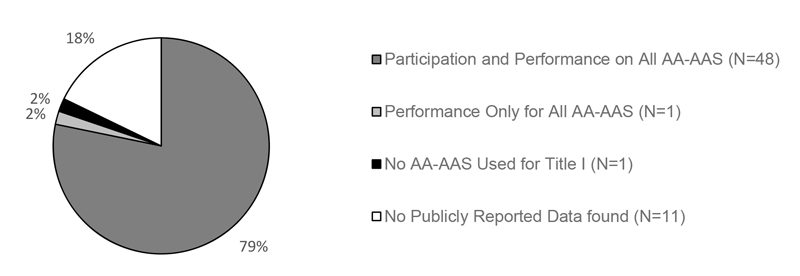
Figure 6 shows the states that reported participation and performance data for AA-AAS used for Title I accountability. The map shows that most states (N=48) publicly reported participation and performance for students with disabilities for these assessments. For details, see Table B-3 in Appendix.
Figure 6. States Reporting 2013-14 Participation or Performance Data for Students with Disabilities on AA-AAS Used for Title I*
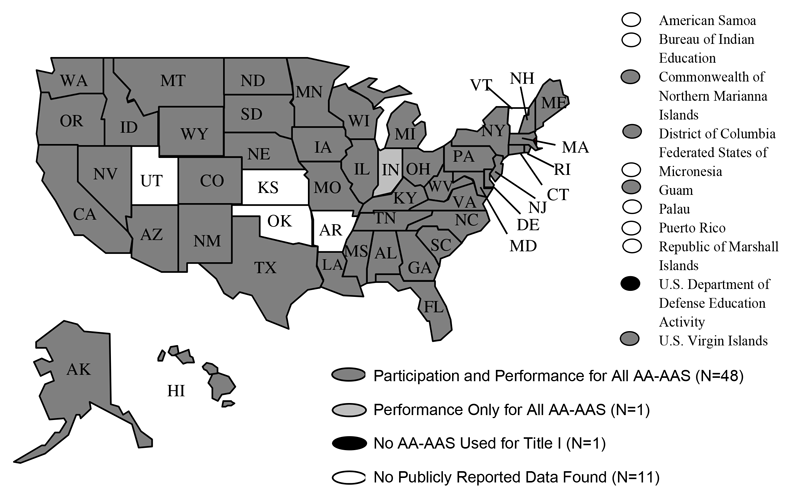
*Note: The figure does not include state APR data. A broad definition was used to determine whether a state had data. States were included if they had any data reported for the assessment (regardless of whether it was across grades, by grade ranges, or for specific grades).
Most ELLs with disabilities take general assessments; a small percentage take an AA-AAS. Figure 7 shows that 53 states did not report participation or performance for ELLs with disabilities on assessments used for Title I. Only 4 states reported both participation and performance data for all general assessments. This represents 6% of the states.
Figure 7. Extent of States Reporting Data for ELLs with Disabilities on General Assessments Used for Title I [N=61]
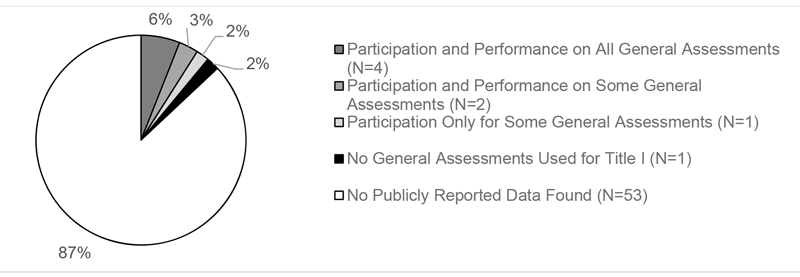
Figure 8 shows the states reporting participation and performance data for ELLs with disabilities on general assessments used for Title I. This map shows that only a few states publicly reported participation and performance for ELLs with disabilities. For example, four states reported participation and performance for all general assessments for ELLs with disabilities. For details, see Table B-4 in Appendix B.
For the 20 states that reported data on general assessments not used for Title I, only 1 state reported participation and performance for ELLs with disabilities (see Table B-5 in Appendix B for more details).
Figure 8. States Reporting 2013-14 Disaggregated Participation or Performance Data for ELLs with Disabilities on General Assessments Used for Title I
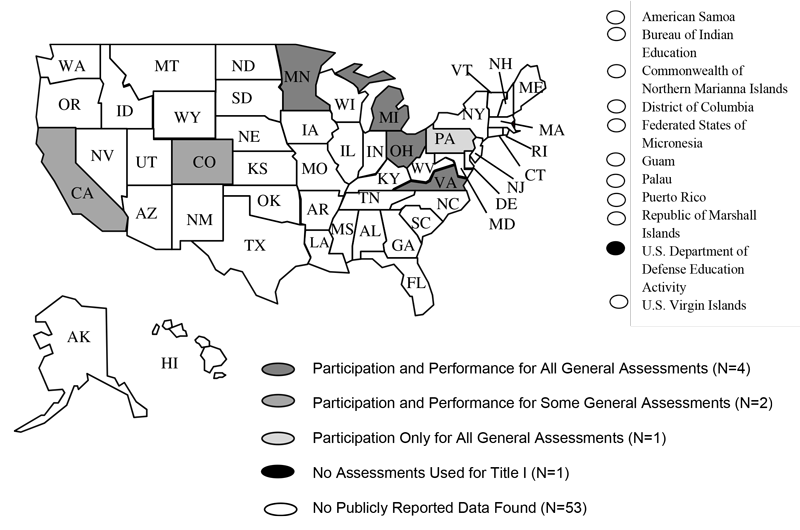
Figure 9 shows that 18 states, or 30% of states, reported data for participation and performance on AA-AAS for ELLs with disabilities. Forty-two states did not publicly report data for ELLs with disabilities who participated in an AA-AAS. One state that had an AA-AAS did not use it for Title 1.
Figure 9. Extent of States Reporting AA-AAS Data for ELLs with Disabilities for Title I [N=61]
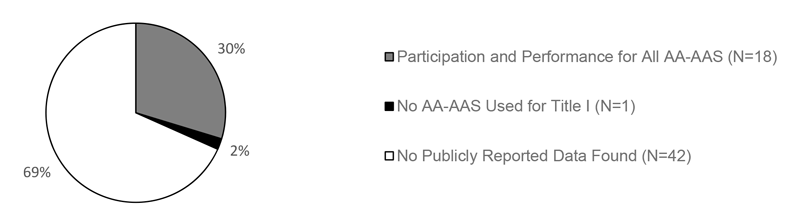
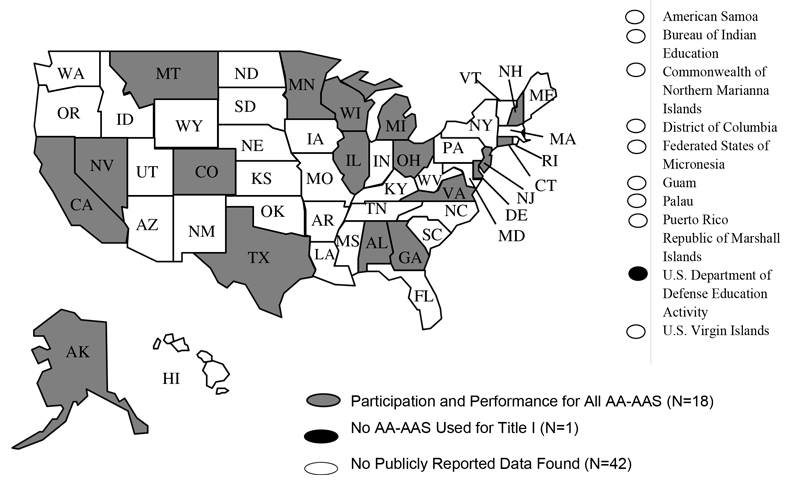
Figure 10 shows the 18 states that reported participation and performance for ELLs with disabilities on the AA-AAS used for Title I. This map shows that the states that reported these data either reported both participation and performance or did not report any data. For details, see Table B-6 in Appendix B.
Figure 10. States Reporting 2013-14 Disaggregated Participation or Performance Data for ELLs with Disabilities on AA-AAS Used for Title I
Alternate assessments based on modified achievement standards (AA-MAS) were an optional assessment used for Title I accountability until 2014-15. For students with disabilities, 10 of the 11 states with an AA-MAS in 2013-14 reported participation and performance data for that year for the grades in which they offered an AA-MAS (separately or merged with data for the general assessment). For ELLs with disabilities, 4 states reported both participation and performance for all AA-MAS. For details, see Table B-7 in Appendix B.
According to publicly available data, one state had an Alternate Assessment based on Grade- Level Achievement Standards (AA-GLAS). That state reported participation and performance data for students with disabilities and for ELLs with disabilities. For details see Table B-8 in Appendix B.
States reported participation data for general assessments in several ways. Figure 11 shows the approaches taken by the 47 states (of the total of 61 regular and unique states) that reported participation data. Thirty-seven states publicly reported the number of students tested and 30 states reported the percent of students participating in general assessments for the Title I accountability system. Only six states reported the percent of students with no scores; eleven states presented the number of students with no scores. Figure 11 includes data from states that used any method of reporting participation data (i.e., by grade and test, by merging grades and tests, by grade with tests merged, and by test with grades merged). For additional details see Table B-9 in Appendix B. For details about AA-AAS participation see Table B-10 in Appendix B.
Figure 11. States Reporting Participation by Students with Disabilities for General Assessments Used for Title I Accountability in 2013-14
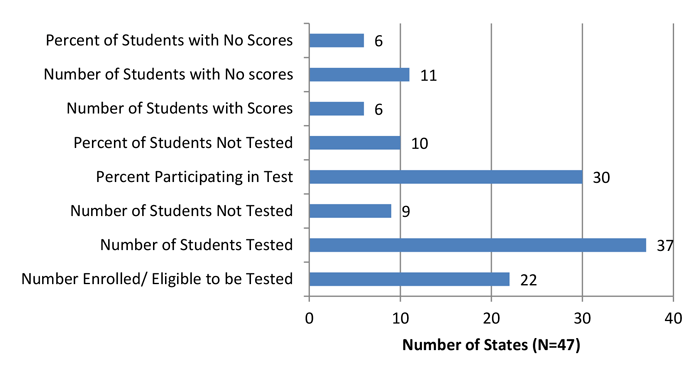
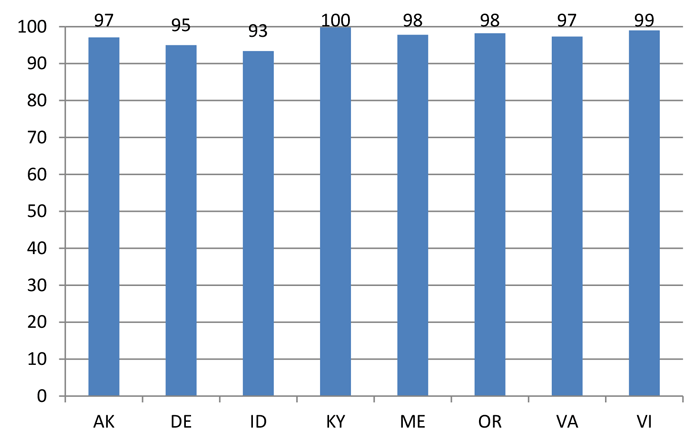
Figure 12 shows the participation rates for grade 8 mathematics for those states with this information reported by grade and test. Of the 30 states that reported on participation rates, 8 states reported these data with denominators based on students with disabilities in grade 8. See Appendix Table B-11 for the state abbreviation key.
Figure 12. Percentages of Students with Disabilities Participating in Middle School General Math Assessments in Those States with Reported Participation Rates1 in 2013-14
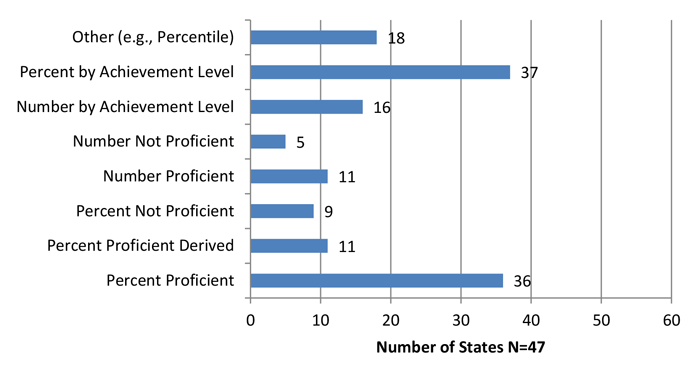
States also reported performance data in a variety of ways, such as the number or percent in each achievement level, percent proficient or not proficient, and scaled scores. Figure 13 shows that the most common way that states reported performance data was by percent in each achievement level (n=37). The next most frequent way was by percent proficient. This figure includes data from states that used any method of reporting participation data (i.e., by grade and test, by merging grades and tests, by grade with tests merged, and by test with grades merged). Also, states could be counted more than once for the type of data reported, so the number does not total to 61 states. For additional details see Table B-12 in Appendix B. For details about AA-AAS performance see Table B-13 in the Appendix.
Figure 13. General Assessments Used for Title I: Number of States Reporting Performance Categories for Students with Disabilities in 2013-14
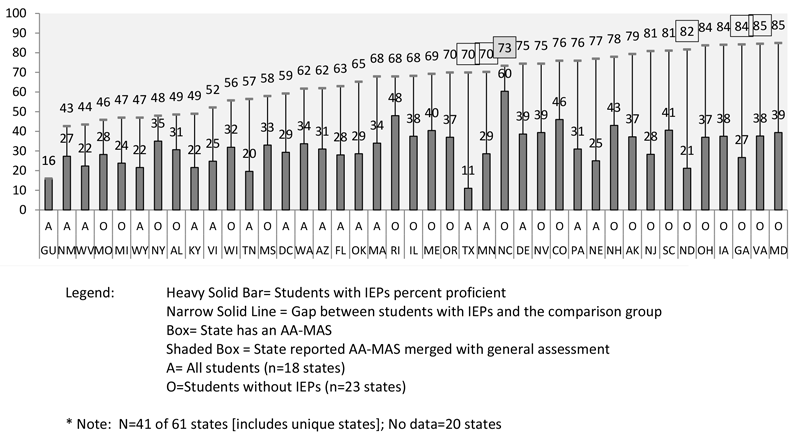
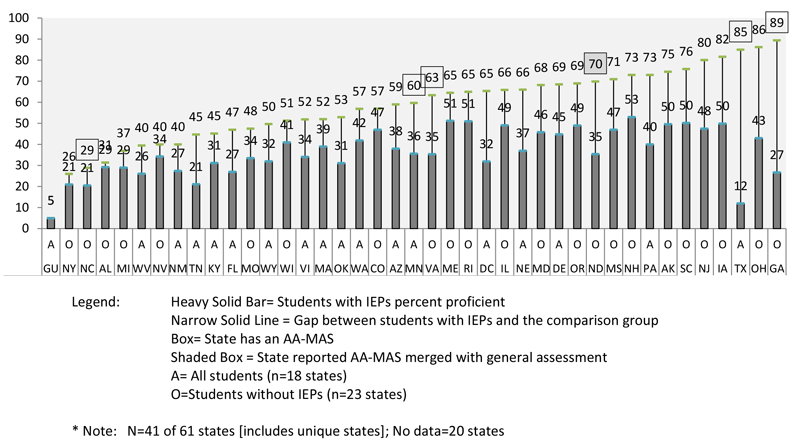
In this section the performance of students with and without Individualized Education Programs (IEPs) is compared for states that reported data for each of three representative grades (e.g., Grade 4, Grade 8, and Grade 10) by content area (i.e., reading, mathematics). Figures 14 to 19 show the gaps between students with disabilities and their comparison peer group. The solid line represents the gap between students with IEPs and the comparison group. The comparison peer group varied by state, with some states reporting the performance of students without IEPs and others reporting the total student population. Because the gaps were affected by whether a state included all students or students without disabilities, we indicate the group used by each state on the horizontal axis with an A if the state included all students and an O if the comparison group for the state was students who do not have IEPs. The students without IEPs group may include students with 504 plans depending on how a state defined its population. Of the 11 states with an AA-MAS, 6 states are noted in these figures because the state reported performance data for their general assessment by grade. Therefore, the gaps reported here could also vary based on how those states reported their performance data. States with an AA-MAS are indicated in the figures with a box around the percent proficient number for the comparison group. See Appendix Table B-11 for state abbreviation key.
Figures 14 and 15 present the results for Grade 4. Across the states, the smallest gap between students with IEPs and the comparison group for elementary reading was 12 percentage points, and the largest gap was 60 percentage points. For elementary mathematics, the gap ranged from 11 percentage points to 60 percentage points.
Figure 14. Percent Proficient for Elementary Reading*
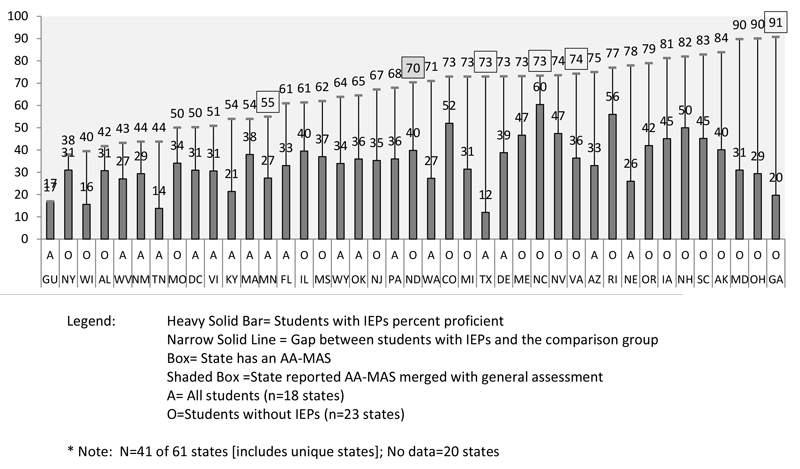
Figure 15. Percent Proficient Elementary Mathematics*
Figures 16 and 17 show the performance gaps for Grade 8 reading and mathematics. At the middle school level, for reading, gaps ranged from 15 percentage points to 53 percentage points. For mathematics, the gaps ranged from 5 percentage points to 53 percentage points.
Figure 16. Percent Proficient for Middle School Reading*
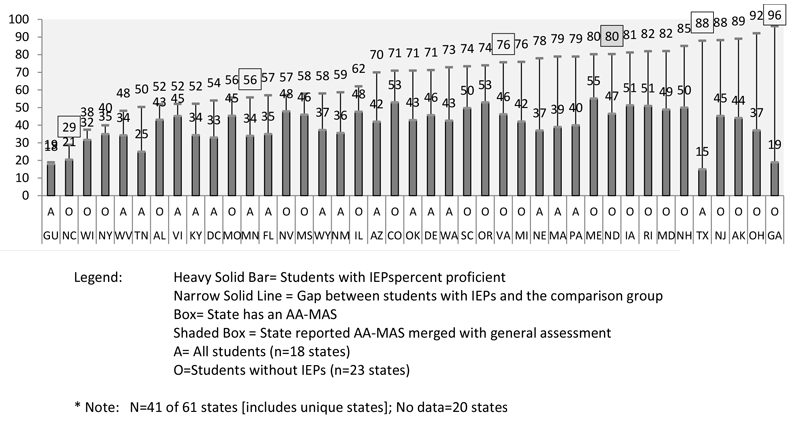
Figure 17. Percent Proficient Middle School Mathematics*
Figures 18 and 19 show gaps for high school reading and mathematics. For reading, the gaps ranged from 9 percentage points to 81 percentage points; for mathematics the range is from 1 percentage point to 79 percentage points.
Figure 18. Percent Proficient for High School Reading*
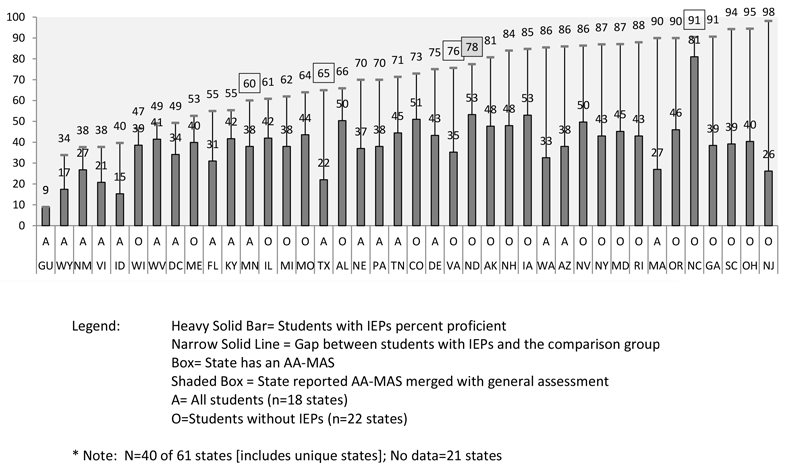
Figure 19. Percent Proficient for High School Mathematics*
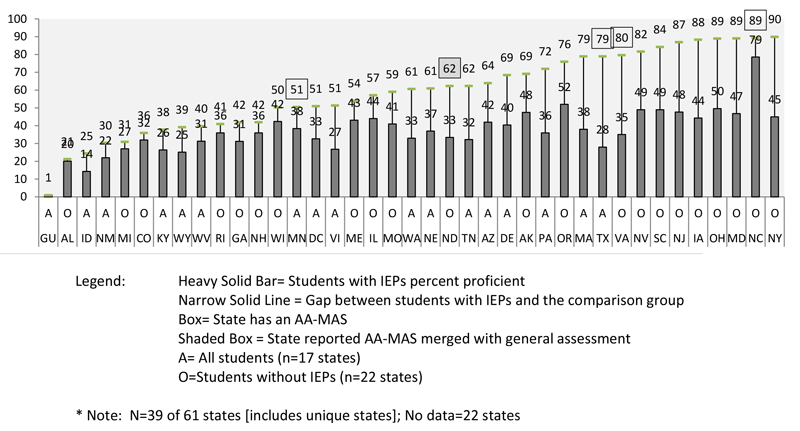
Table 1 summarizes the average achievement gaps between students with IEPs and the comparison peer group. The comparison peer group may or may not include students with IEPs depending on the reporting practices of each state. The table presents gaps by content and school levels across select years. A limitation of this analysis is that the number of states with data fluctuates from year to year and there are differences in how states report percent proficient for students with IEPs. For example, in some cases, states reported AA-MAS performance merged with general assessment performance.
Table 1 shows the mean gaps for every other year from 2006-2007 through 2012-13, as well as the current year. The average gap is presented with the number of states with data for each year. The gap sizes changed only slightly across grades and content areas in these data. For example, for elementary reading, the mean gap was 31 in 2006-07 and 2008-09, 34 in 2010-11, and 35 in 2012-13 and 2013-14.
Table 1. Gaps Between Students with IEPs and Comparison Peer Group on General Assessments: Biannually from 2006-07 to 2013-14
| Grade Ranges | Mean Gaps for All States with Data1 | |||||||||
|---|---|---|---|---|---|---|---|---|---|---|
| 2006-07 | 2008-09 | 2010-11 | 2012-13 | 2013-14 | ||||||
| Gap | Number of States | Gap | Number of States | Gap | Number of States | Gap | Number of States | Gap | Number of States | |
| Elementary Reading | 31 | 47 | 31 | 45 | 34 | 45 | 35 (34) | 45 (48) | 35 (34) | 38 (41) |
| Middle School Reading | 40 | 47 | 40 | 46 | 41 | 45 | 41 (41) | 45 (48) | 41 (41) | 38 (41) |
| High School Reading | 40 | 46 | 40 | 44 | 40 | 45 | 39 (38) | 46 (49) | 40 (39) | 37 (40) |
| Elementary Math | 29 | 47 | 28 | 46 | 30 | 45 | 32 (32) | 45 (48) | 32 (32) | 38 (41) |
| Middle School Math | 40 | 47 | 38 | 46 | 40 | 42 | 40 (39) | 45 (48) | 37 (36) | 38 (41) |
| High School Math | 38 | 44 | 37 | 44 | 40 | 43 | 37 (36) | 46 (49) | 38 (37) | 36 (39) |
1Data in parentheses include the unique states. Data including the unique states were available only for 2012-13 and 2013-14. Prior analyses did not include the unique states.
Publicly reported data for general and alternate assessments for students with disabilities are easier to find on some state websites than on others. This year, an analysis was again conducted on the number of mouse clicks it took to arrive at public reports for the general assessment and the AA-AAS on state department of education websites. The number of mouse clicks for each state did not take into account any potential short cuts through search engines that may have provided a link to parts of a state’s education website. As in previous analyses, we did not count the additional clicks needed to choose specific demographic or assessment characteristics on sites that allowed users to generate customized reports. For those sites, we only counted the number of clicks needed to arrive at the generator site and a final "submit" click.
This analysis was referred to as a "click" analysis in previous reports. Click data for general assessments are presented in Figure 20, and data for AA-AAS are presented in Figure 21. Compared to the most recent year of this analysis (2012-2013) for the general assessment, the number of regular states that required 7 clicks increased from 0 to 1 for 2013-14. States with 5-6 clicks (N=10) decreased by 5, the number of states with 3-4 clicks decreased from 34 to 32, and the number of states with 1-2 clicks increased by three states. We note also that the number of states with data decreased by three states from the previous year. For the AA-AAS, the click count also changed, with similar numbers as found for the general assessment. Compared to the prior year, the AA-AAS had the same number of states at 7 clicks (N=1), six fewer states requiring 5-6 clicks (N=10), and five more states requiring 3-4 clicks (N=35). The number of states requiring 1-2 clicks increased by two states (N=3).
Although this analysis suggests that fewer clicks indicate greater ease of finding data, this is not necessarily the case. States that use terms on their websites that do not explicitly refer to assessment data have data that are more difficult to find than states that explicitly refer to assessment data, even though it may take more clicks to get to those data. Examples of these terms include names of report generator sites that may not be familiar to users, or other terms that infer data analysis but are not clear about what type of data are being provided.
Figure 20. Number of Regular States in Each "Click" Category for Regular States Reporting General Assessments for 2013-14
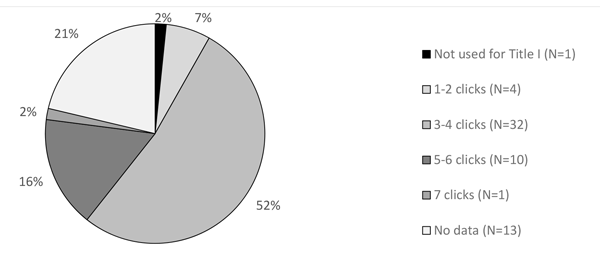
Figure 21. Number of States in Each Click Category for Regular States Reporting AA-AAS) for 2013-14 (Total N= 61 States)
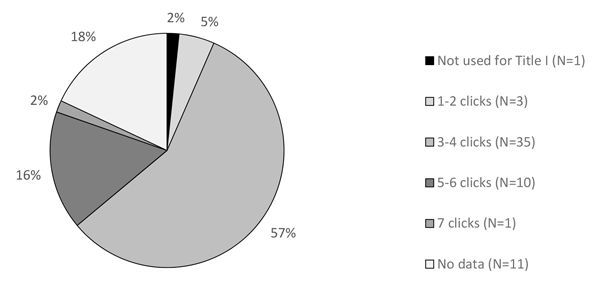
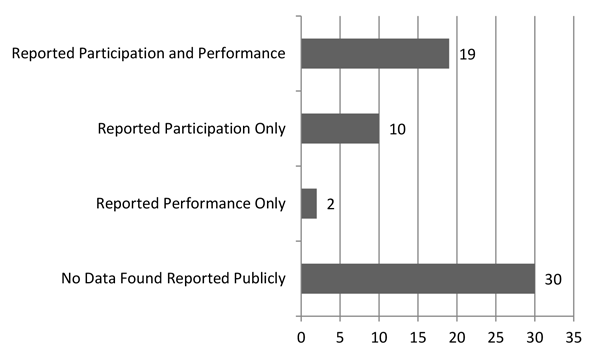
Figure 22 presents the number of regular and unique states that reported data of students with disabilities using accommodations on the general assessment, by whether the state reported participation, performance, or both. Thirty-one states had at least some accommodations data reported, with 19 states reporting participation and performance, 10 states reporting participation only, and 2 states reporting performance only. See Appendix B-14 for specific state information shown in Figure 22.
Figure 22. Number of Regular and Unique States Reporting Accommodations Data
Top of Page | Table of Contents
Forty-one regular states, and three unique states, reported participation and performance for all of their general assessments and alternate assessments based on alternate achievement standards (AA-AAS) used for Title I accountability purposes. Forty-five of the 61 states reported both participation and performance for all general assessments; 48 reported similar data for the AA-AAS. Of the 22 states with general assessments not used for Title I, only 8 states reported participation and performance for all assessments, and 3 additional states reported participation or performance for some general assessments. This is an increase from the previous report, where 6 states reported participation and performance for all general assessments not used for Title I, but in that year there were fewer assessments found (N=16) not to be used for Title I.
The number of states that reported both participation and performance for ELLs with disabilities decreased to four, down from seven states in the previous report. In addition, two states reported these data for some general assessments, and one other state for participation only. For AA-AAS, more states (N=18) reported participation and performance than for the general assessment, but overall the number was down from 21 states the previous year. It might be expected that more states would have reported disaggregated data for this assessment, given the requirements of ESEA to report by subgroup for each state assessment.
Among the regular states, the most common approaches for communicating participation and performance on general assessments and AA-AAS remained the same as in recent years. For participation in 2013-14, the most common way to report was in terms of the number assessed (37 states for the general assessment) and percent participating (30 states). For performance, the most common way regular states reported was the percent of students in each achievement level (35 states for general assessments) followed by percent proficient (33 states for general assessments). The total including unique states was 37 states reporting by achievement level and 36 states by percent proficient. Because states used different methods to report (e.g., merging assessments, grades, or both), the numerators and denominators used to report participation and performance data varied significantly across states. Adding to the complexity is the fact that some states reported public data using multiple methods across participation and performance, thus increasing the difficulty of making interpretations about participation and performance.
As in previous reports, this report presented participation rates for middle school mathematics as an example of how states report participation rates for students with disabilities. Eight states reported participation rates by grade with denominators based on students with disabilities. Additional states provided numbers that may possibly allow for rates to be calculated. However, in recent years participation data have become less transparent, in part because states that had alternates based on modified achievement standards (AA-MAS) sometimes opted to merge those data with the general assessment data in public reporting for participation and performance. Another reason that rates may be less straightforward is that states vary in the denominators used to calculate rates.
Achievement gaps between students with and without IEPs (or all students) in reading and mathematics persist. This report presented average achievement gaps for elementary, middle school, and high school levels. As in past reports, overall gaps were smaller in elementary reading and mathematics than at the middle school and high school levels. At the middle school and high school levels, for reading and mathematics, the average gaps across states spanned from 37 percentage points to 41 percentage points, nearly the same as 2012-13. Because states vary in the methods they use to publicly report data, this influences the achievement gaps reported. As would be expected, those states with "all students" as the comparison group tended to show smaller gaps compared to states using students without IEPs" as the comparison group. Other factors that influence the size of achievement gaps include whether a state has an AA-MAS, the percentage of students taking an AA-MAS in lieu of the general assessment, and how these data are reported.
State websites vary in the ease of use in finding publicly reported data about the participation and performance of students with disabilities. This report showed changes in the number of clicks required to find data for students with disabilities on the general assessment. The highest 7 click category gained one state, and the lowest click category gained three states. The middle click categories of 3-4 and 5-6 clicks decreased by 2 and 5, respectively. For the alternate assessment, there was an increase to one state in the 7 click category, a decrease of six states in the 5-6 category and a gain of two states in the lower 1-2 click category, and a gain of 5 states in the 3-4 click category. As in previous years, the majority of states required only 3 to 4 clicks to locate assessment data both for the general assessment (32 states) and AA-AAS (35 states). However, we have observed that a shorter path to data is not always easier to use if the terms on the website are not explicit about leading to assessment data for students. For example, some states use names of report generator sites that may not be familiar to users, or other terms that infer data analysis but are not clear about what type of data are being provided.
As states transition to new assessments based on college- and career-ready standards, there may be changes in how participation and performance data for students with disabilities and ELLs with disabilities are reported. It is important that states continue to publicly report data for students with disabilities with the same frequency and detail as for other students. As in the previous report (Albus, Lazarus, & Thurlow, 2015), the following recommendations are offered to states for public reporting of disaggregated data for students with disabilities:
Top of Page | Table of Contents
Albus, D., Lazarus, S. S., & Thurlow, M. L. (2015). 2012-13 publicly reported assessment results for students with disabilities and ELLs with disabilities (Technical Report 70). Minneapolis, MN: University of Minnesota, National Center on Educational Outcomes.Acknowledgments
Albus, D., Lazarus, S.S., & Thurlow, M.L. (2014). 2011-12 publicly reported assessment results for students with disabilities and ELLs with disabilities (Technical Report 69). Minneapolis, MN: University of Minnesota, National Center on Educational Outcomes.
Albus, D., & Thurlow, M. (2013). 2010-11 publicly reported assessment results for students with disabilities and ELLs with disabilities (Technical Report 68). Minneapolis, MN: University of Minnesota, National Center on Educational Outcomes.
Albus, D., Thurlow, M., & Bremer, C. (2009). Achieving transparency in the public reporting of 2006-2007 assessment results (Technical Report 53). Minneapolis, MN: University of Minnesota, National Center on Educational Outcomes.
Klein, J. A., Wiley, H. I., & Thurlow, M. L. (2006). Uneven transparency: NCLB tests take precedence in public assessment reporting for students with disabilities (Technical Report 43). Minneapolis, MN: University of Minnesota, National Center on Educational Outcomes.
Thurlow, M., Bremer, C., & Albus, D. (2008). Good news bad news in disaggregated subgroup reporting to the public on 2005-2006 assessment results (Technical Report 52). Minneapolis, MN: University of Minnesota, National Center on Educational Outcomes.
Thurlow, M. L., Bremer, C., & Albus, D. (2011). 2008-09 publicly reported assessment results for students with disabilities and ELLs with disabilities (Technical Report 59). Minneapolis, MN: University of Minnesota, National Center on Educational Outcomes.
Thurlow, M. L., & Wiley, H. I. (2004). Almost there in public reporting of assessment results for students with disabilities (Technical Report 39). Minneapolis, MN: University of Minnesota, National Center on Educational Outcomes.
Thurlow, M. L., Wiley, H. I., & Bielinski, J. (2003). Going public: What 2000-2001 reports tell us about the performance of students with disabilities (Technical Report 35). Minneapolis, MN: University of Minnesota, National Center on Educational Outcomes.
VanGetson, G. R., & Thurlow, M. L. (2007). Nearing the target in disaggregated subgroup reporting to the public on 2004-2005 assessment results (Technical Report 46). Minneapolis, MN: University of Minnesota, National Center on Educational Outcomes.
U.S. Department of Education (2013). ESEA flexibility: Frequently asked questions addendum. Washington, DC: author.
Wiley, H. I., Thurlow, M. L., & Klein, J. A. (2005). Steady progress: State public reporting practices for students with disabilities after the first year of NCLB (2002-2003) (Technical Report 40). Minneapolis, MN: University of Minnesota, National Center on Educational Outcomes.
Top of Page | Table of Contents
Re: NCEO verification request for public reporting
[Names],
The National Center on Educational Outcomes is examining states’ public reports for the 2013-2014 school year assessment results. Our goal is to:
(a) identify all components of each state’s testing system;
(b) determine whether each state reports disaggregated test results for students with disabilities and English language learners (ELLs) with disabilities; and
(c) describe the way participation and performance information is presented.
As in previous years, we are looking at assessment department reports and the equivalent of report cards used for Title I.
We have reviewed your Web site for this information and have enclosed tables summarizing that review. Please verify all included information. Specifically, please return the tables that we have attached, noting your changes to them. Also, if there is additional publicly reported information available for your state, please provide us with the public document and/or website that contains the information. Address your responses to Deb Albus via email albus001@umn.edu.
If you have any questions about our request, please email Deb Albus or call at (612) 626-0323. Please respond by September 1, 2015.
Thank you for taking the time to provide this information.
Martha Thurlow, Director NCEO
Deb Albus, Research Fellow, NCEO
a. Reporting in State Assessments Summary
Please check the information below for accuracy and make edits as needed.
| Assessments | Grade | Subject Areas | Disaggregated Data |
Used for Title I |
|||
|---|---|---|---|---|---|---|---|
| Special Education | ELLs with Disabilities | ||||||
| Participation | Performance | Participation | Performance | ||||
| ACT Aspire | 3-8, 10 | Reading, Math | Yes | Yes | No | No | Yes |
| The ACT College Readiness Test | 11 | English, Math, Reading, Science | No | No | No | No | No |
| Alabama Science | 5,7 | Science | Yes | Yes | No | No | Yes |
| Alabama Alternate Assessment | 3-8, 10-11 | Reading, Math Science (5,7) | Yes | Yes | Yes | Yes | Yes |
| ACT Plan | 10 | English, Math, Science | Yes | Yes | No | No | Yes |
b. Reporting on Students with Disabilities
How was participation and performance reported on the Title I assessments (general and alternate based on alternate achievement standards (AA-AAS))?
Note Yes, No, or NA (not applicable). If AA-AAS is merged with general, repeat the answer for general.
| For Title I Assessments: | Participation | Performance | |||
|---|---|---|---|---|---|
| Participation | General | AA-AAS | Performance | General | AA-AAS |
| Number Enrolled/ Eligible to be Tested | No | No | Percent Proficient | Yes | No |
| Number of Students Tested | Yes | No | Percent Proficient Derived | NA | Yes |
| Number of Students Not Tested | Yes | No | Percent Not Proficient | No | No |
| Percent Participating in Test | Yes | Yes | Number Proficient | No | No |
| Percent of Students Not Tested | No | No | Number Not Proficient | No | No |
| Number of Students with Scores | No | No | Number by Achievement Level | Yes | No |
| Number of Students with No scores | No | No | Percent by Achievement Level | Yes | Yes |
| Percent of Students with No Scores | No | No | Percentile Rank | NA | NA |
c. If your state had an alternate based on modified achievement standards in 2014, how was participation reported? Not applicable
d. Accommodated Status Reporting
Did your state report accommodated status data for any population? List assessments or note NA, then answer Yes or No. Please note the report name or provide link if different from below.
| List assessment and describe reporting | Reported Participation? | Reported Performance? | |
|---|---|---|---|
| On what assessment(s)? |
ACT Aspire and Alternate Assessment Reporting Number of Students Tested by accommodated and non-accommodated and percent in each performance level |
Yes | Yes |
Report name/Link to report/attach: 2013-2014 Participation and Performance of Students with IEPs Taking Assessments With and Without Accommodations
e. Disaggregated Data for the English Language Proficiency Assessment
Participation and Performance Data for Students with Disabilities, English Language Proficiency Assessment (ELPA)
| ELPA Name | Grade | Reports Data for All Students | Disaggregated Data for ELLs with Disabilities | |
|---|---|---|---|---|
| Participation | Performance | |||
| ACCESS for ELLs | K-12 | No | No | No |
Top of Page | Table of Contents
Table B-1. Participation and Performance Data for Students with Disabilities, Regular Assessment Used for Title I Accountability, 2013-2014
| State | Test | Grade | Subject Areas | Disaggregated Special Education Data on General Assessments Used for Title I | ||||||
|---|---|---|---|---|---|---|---|---|---|---|
| Partici-pation | Perform-ance | Reporting Summary By State | ||||||||
| Part. and Perf. All Tests | Part. and Perf. Some Tests | No Tests Used for Title I | No Publicly Reported Data Found | |||||||
| Regular States | ||||||||||
| Alabama | ACT Aspire | 3 to 8, 10-11 | Reading, Math | Yes | Yes | Yes | ||||
| Alabama Science Assessment (ASA) | 5,7 | Science | Yes | Yes | ||||||
| ACT Plan | 10 | English, Math, Science | Yes | Yes | ||||||
| Alaska | Standards Based Assessments | 3-10 | Reading, Writing, Mathematics, (3-10), Science (4,8,10) | Yes | Yes | Yes | ||||
| High School Graduation Qualification Exam | 10-12 | Reading, Writing, Mathematics | Yes | Yes | ||||||
| Arizona | Arizona’s Instrument to Measure Standards (AIMS) | 3-8 | Reading, Math, Science | Yes | Yes | Yes | ||||
| Arizona’s Instrument to Measure Standards (AIMS HS) | HS | Reading, Writing, Math, Science | Yes | Yes | ||||||
| Arkansas | Augmented Benchmark Exams (ABE) | 3-8 | Math, Literacy | No | No | X | ||||
| End of Course Exams | EoC | Algebra I, Biology, Geometry, Literacy | No | No | ||||||
| Iowa Tests (ITED) | 9 | Reading, Math and Language | Yes | Yes | ||||||
| California | California Standards Test Scores (CST) | 5, 8, 10 | Science | Yes | Yes | Yes | ||||
| Standards Based Tests in Spanish (STS) | 2-11 | English Language Arts | Yes | Yes | ||||||
| High School Exit Exam | 10 | English-Language Arts, Math | Yes | Yes | ||||||
| Colorado | Transitional Colorado Assessment Program (TCAP) | 3-10 | Reading, Math, Writing (3-10), Escritura, Lectura (3-4) | Yes | Yes | Yes | ||||
| Colorado Measures of Academic Success | 4-5, 7-8 | Science (5,8), Social Studies (4,7) | Yes | Yes | ||||||
| Connecticut | Connecticut Mastery Test (CMT) | 5, 8 | Science - This was field test year for other content on new assessment. | Yes | Yes | Yes | ||||
| Connecticut Academic Performance Test | 10 | Science - This was field test year for other content on new assessment. | Yes | Yes | ||||||
| Delaware | Delaware Comprehensive Assessment System (DCAS) | 3-10 | Reading, Math (3-10), Science (5,8,10), Social Studies (4,7) | Yes | Yes | Yes | ||||
| Florida | Florida Comprehensive Assessment Test (FCAT)/ FCAT 2.0 | 3-10 | Reading, Math (3 to 8), Science (5, 8), Writing (4, 8, 10) | Yes | Yes | Yes | ||||
| End of Course Assessment | EoC | Algebra I, Civics, U.S. History, Biology I, Geometry | Yes | Yes | ||||||
| Georgia | Criterion-Referenced Competency Test | 3-8 | Reading, English/ Language Arts, Math, Science (3-8), Social Studies (3-8) | Yes | Yes | Yes | ||||
| End of Course Test | EoC | Math I & II, GPS Algebra, GPS Geometry, United States History, Economics/Business/Free Enterprise, Biology, Physical Science, Ninth Grade Literature and Composition | Yes | Yes | ||||||
| Hawaii | Hawaii State Assessment Program | 3-8, 10 | Reading, Math, Science | Yes | Yes | Yes | ||||
| Idaho | General Assessment | 3-8, 10, 11 | English Language Arts (ELA) and Math(3-8, 11), Science (5,7, 10) | Yes | Yes | Yes | ||||
| Illinois | Illinois Standards Achievement Test (ISAT) | 3-8 | Reading, Math, Science (4, 7) | Yes | Yes | Yes | ||||
| Prairie State Achievement Examination (PSAE) | 11 | ACT Plus Writing (English, Math, Reading and Science, writing prompt), ISBE Science assessment, and two Workkeys sections –Applied Math and Reading for Information. | Yes | Yes | ||||||
| Indiana | Indiana State-wide Testing for Education Progress- Plus (ISTEP+) | 3-8 | English/Language Arts, Math, Science (4,6), Social Studies (5,7) | Yes | Yes | Yes | ||||
| End of Course Assessments (ECAs) | EoC | English, Algebra I, Biology I | No | No | ||||||
| Iowa | Iowa Assessment | 3-8,11 | Reading, Math | Yes | Yes | Yes | ||||
| Iowa Assessment Science | 5,8,11 | Science | Yes | Yes | ||||||
| Kansas | General Assessment | 3-8,11 | Reading, Math, Science (4,7,11) | No | No | X due to cyber attack | ||||
| Kentucky | Kentucky Performance Rating for Educational Progress (K-PREP) | 3-8, 10,11 | Reading, Math, Science (4, 7), Social Studies (5,8), Writing (5, 6, 8, 10, 11), Language Mechanics (4, 6, 10) | Yes | Yes | Yes | ||||
| End of Course | EoC | English II, Algebra II, Biology, US History | Yes | Yes | ||||||
| Stanford Achievement Test 10 (part of K-PREP) | 3-8 | Reading, Math (3-8) Science (4,7), Social Studies (5,8), Language Mechanics (4,6) | No | No | ||||||
| Louisiana | Louisiana Educational Assessment Program (LEAP) | 4,8 | English/Language Arts, Math, Science, Social Studies | No | No | X | ||||
| Integrated Louisiana Educational Assessment Program (iLEAP) | 3,5-7 | English/Language Arts, Math, Science, Social Studies | No | No | ||||||
| End of Course tests | EoC | English II, English III, Algebra I, Geometry, Biology, US History | No | No | ||||||
| Maine | New England Comprehensive Assessment Program (NECAP) | 3-8 | Reading, Math, Writing (5,8) | Yes | Yes | Yes | ||||
| Maine High School Assessment | 11, 3rd year HS | Reading, Writing, Math | Yes | Yes | ||||||
| Maryland | Maryland School Assessment (MSA) | 3-8 | Math, Reading, Science (5,8) Field testing affected Math and Reading Totals. | Yes | Yes | Yes | ||||
| High School Assessments (HSA) | EoC | Algebra/Data analysis, English, Biology, Government | Yes | Yes | ||||||
| Massachusetts | Massachusetts Comprehensive Assessment System (MCAS) | 3-8, 10 | English/Language Arts, Math, | Yes | Yes | Yes | ||||
| STE MCAS Tests | 5, 8-10 | Science (Biology, Chemistry, Intro Physics, and Technology/ Engineering, also used outside Title I) | Yes | Yes | ||||||
| Michigan | Michigan Education Assessment Program (MEAP) | 3-9 | Reading, Math, (3-8), Writing (4,7 ) Science (5,8 ), Social Studies (6,9) | Yes | Yes | Yes | ||||
| Michigan Merit Examination (MME) | 11 | Reading, Math, Writing, Science, Social Studies | Yes | Yes | ||||||
| Minnesota | Minnesota Comprehensive Assessment (MCA) –III | 3-8, HS | Reading (3 to 8, 10), Math (3 to 8, 11), Science (5, 8, HS) | Yes | Yes | Yes | ||||
| Mississippi | Mississippi Curriculum Test (MCT2) | 3-8 | Language Arts, Math | No | No | X | ||||
| Science Tests | 5,8 | Science | No | No | ||||||
| High school Subject Area Tests | EoC | Algebra I, Biology I, English II, US History | No | No | ||||||
| Missouri | Missouri Assessment Program (MAP) | 3-8 | Communication Arts, Math, Science (5,8) | Yes | Yes | Yes | ||||
| Online End of Course Assessments | EoC | English I and II, Algebra I and II, Geometry, Biology, American History, Government | Yes | Yes | ||||||
| Montana | Criterion Reference Test (CRT) | 3-8, 10 | Reading, Math, Science (4, 8, 10) | Yes | Yes | Yes | ||||
| Nebraska | Nebraska State Accountability (NeSA) | 3-8, 11 | Reading, Math, Science (5,8,11), Writing (4, 8,11) In 2014 students in gr 8 and 11 had technology issues with the online test. Valid results are not available for NeSA-Writing at these grades. | Yes | Yes | Yes | ||||
| Nevada | Criterion Referenced Test (CRT) | 3-8 | Reading, Math, Science (5,8) | Yes | Yes | Yes | ||||
| High School Proficiency Exam | HS | Reading, Math, Science, Writing | Yes | Yes | ||||||
| New Hampshire | New England Comprehensive Assessment Program (NECAP) | 3-8, 11 | Reading, Math, Writing (5,8,11), Science (4,8,11) | Yes | Yes | Yes | ||||
| New Jersey | New Jersey Assessment of Skills and Knowledge (NJASK) | 3-8 | Language Arts Literacy, Math, Science (4, 8) | Yes | Yes | Yes | ||||
| New Jersey Biology Competency Test | EoC | Biology | Yes | Yes | ||||||
| High School Proficiency Assessment (HSPA) | First time 11th graders | Math, Language Arts Literacy, | Yes | Yes | ||||||
| New Mexico | Standards Based Assessment (SBA) | 3-8,10-11 | Reading, Math, Science (3, 7-8, 11). And High School SBA serves as diploma also | Yes | Yes | Yes | ||||
| New York | New York State Testing Program (NYSTP) | 3-8 | English Language Arts, Math, Science (4,8) | Yes | Yes | Yes | ||||
| Common Core Regents | EoC | Algebra I, ELA (required to pass ELA only if entered gr. 9 in 2013-14) | Yes | Yes | ||||||
| Regents Competency Tests | EoC | Math, Science, Reading, Writing, Global Studies, US History and Government. Parts used for Title I and Diploma. | Yes | Yes | ||||||
| Regents Exams | EoC | Comprehensive English, US History &Gov’t, Global History & Geography, Alg2/ Trig, Geometry, Integ Alg, Living Envt, Physical etting/Physics, Physical Setting/ Chemistry, Physical setting/Earth Science. Parts used for Title I and Diploma. | Yes | Yes | ||||||
| North Carolina | End of Grade Multiple Choice Test | 3-8 | Reading, Math, Science (5,8) | Yes | Yes | Yes | ||||
| End of Course Multiple Choice | EOC | Math I, Biology, English II, | Yes | Yes | ||||||
| North Dakota | General Assessment | 3-8, 11 | Reading/Language Arts, Math, Science (4,8,11) | Yes | Yes | Yes | ||||
| Ohio | Ohio Achievement Assessments (OAA) | 3-8 | Math, Reading, Science (5,8), | Yes | Yes | Yes | ||||
| Ohio Graduation Tests (OGT) | HS | Reading, Math, Science, Social Studies, Writing | Yes | Yes | ||||||
| Oklahoma | Oklahoma Core Curriculum Tests (OCCT) | 3-8 | Math, Reading, Science (5,8), Geography (7), Social Studies (5), US History (8), Writing (5,8) For Title I, all used except for Geography, Social Studies, History and Writing | No | No | X | ||||
| End of Instruction | EoI | ACE Algebra I, ACE Algebra II, ACE Geometry, ACE English II, III (Writing included), ACE Biology I, ACE US History. For Title I, all used except for Alg II, Eng II, Geometry and US History | No | No | ||||||
| Oregon | Oregon Assessment of Knowledge and Skills (OAKS) Online | 3-8,11 | Reading, Math, Science (5,8,11), Writing (11) | Yes | Yes | Yes | ||||
| Pennsylvania | Pennsylvania System of School Assessment (PSSA) | 3-8, 11 | Reading, Math, Science (4,8,) Algebra, Biology and Literature (11) | Yes | Yes | Yes | ||||
| Keystone Exam | 11 | Algebra, Biology and Literature | Yes | Yes | ||||||
| Rhode Island | New England Education Assessment Program (NECAP) | 3-8,11 | Reading, Math, Writing (5,8,11), Science(4,8,11) | Yes | Yes | Yes | ||||
| South Carolina | Palmetto Assessment of State Standards | 3-8 | English Language Arts, Math, Science, Social Studies, Writing (5, 8) | Yes | Yes | Yes | ||||
| End of Course Examination | EoC | Algebra/Math for Technologies 2, Biology/ Applied Biology 2, English 1, US History and the Constitution | Yes | Yes | ||||||
| High School Assessment Program Test | 2nd year HS | English Language Arts, Math | Yes | Yes | ||||||
| South Dakota | South Dakota State Test of Educational Progress (DSTEP) and Field Testing for Smarter Balanced Assessment | 3-8,11 | Science (5,8,11) (other content areas not reported due to participation in SBAC field testing) | Yes | Yes | Yes | ||||
| Tennessee | Criterion Referenced Academic Achievement | 3-8 | Math, Reading/ Language, Social Studies, Science | Yes | Yes | Yes | ||||
| End of Course | EoC | Algebra I, Algebra II, English I, English II, English III, US History, Biology, Chemistry (Chemistry not reported for any students though listed) | Yes | Yes | ||||||
| Texas | State of Texas Assessments of Academic Readiness (STAAR) Includes Spanish versions | 3-8 | Math, Reading, Writing (4,7), Science (5,8) Social Studies (8) | Yes | Yes | Yes | ||||
| STAAR EoC | EoC | Algebra I, Biology, English I, Reading, English I Writing, US History | Yes | Yes | ||||||
| Utah | Student Assessment of Growth and Excellence (SAGE) | 3-11 | Reading, Language, Listening, Writing (3-11) Math (3-8), Secondary Math I, II, III, Science (4-8), Biology, Earth Science, Chemistry, Physics | No | No | X | ||||
| Vermont | New England Comprehensive Assessment Program (NECAP) | 3-8, 11 | Math, Reading, Science (4,8,11), Writing (5,8,11) | Yes | Yes | Yes | ||||
| Virginia | Standards of Learning (SOL) | 3-8 | Reading, Math, Science (3,5,8), History/Social Studies (3,5,8), Writing (5,8) | Yes | Yes | Yes | ||||
| End of Course Test | EoC | Reading, Writing, Algebra I, II, Geometry, Biology, Chemistry, Earth Science, Virginia and US History, World History I, II, World Geography, US History to 1865, US History from 1865 to present, Civics and Economics, Virginia Studies | Yes | Yes | ||||||
| Washington | Measurements of Student Progress (MSP) | 3-8 | Reading, Math, Writing (4,7), Science (5,8) | Yes | Yes | Yes | ||||
| High School Proficiency Exam (HSPE) | 10 | Reading, Writing | Yes | Yes | ||||||
| End of Course | EoC | Algebra 1/Integrated Math 1, Geo-metry/ Integrated Math 2, Biology - part also not used for Title I | Yes | Yes | ||||||
| West Virginia | West Virginia Educational Standards Test 2 | 3-11 | Math (3-11), Reading/ Language Arts (3-11) Science, Social Studies (3-6), World Geography (7), West Virginia Studies (8), Algebra I (9), Physical Science (9), World Studies to 1900 (9), Geometry (10), Biology, (10), US Studies to 1900 (10), Chemistry (11), 20th and 21st Centuries Studies (11) | Yes | Yes | Yes | ||||
| Wisconsin | Wisconsin Knowledge and Concepts Exams (WKCE) | 3-8, 10 | Reading, Math, Language Arts (4,8,10), Science (4,8,10), Social Studies (4,8,10) | Yes | Yes | Yes | ||||
| Wyoming | Proficiency Assessments for Wyoming Students (PAWS) | 3-8, 11 | Reading, Math, Science (4,8, 11) | Yes | Yes | Yes | ||||
| ACT Plus Writing | 11 | English, math, Reading, Writing, Science | Yes | Yes | ||||||
| Total Regular States (N=50) | 42 | 2 | 0 | 6 | ||||||
| State | Test | Grade | Subject Areas |
Disaggregated Special Education Data on General Assessments Used for Title I |
|||||
|---|---|---|---|---|---|---|---|---|---|
| Partici-pation | Perform-ance | Reporting Summary By State | |||||||
| Part. And Perf. All Tests | Part. And Perf. Some Tests | No Tests Used for Title I | No Publicly Reported Data Found | ||||||
| Unique States | |||||||||
| American Samoa | Stanford Achievement Test 10 | Elem to HS | Language Arts, Science, Math Problem Solving, History, Social Science | No | No | X | |||
| Bureau of Indian Education | Individual state administered assessments | Elem to HS | By State: Langauge Arts, Reading, Math, Science | No | No | X | |||
| Commonwealth of Northern Mariana Islands | Standards Based Assessment | 4, 6, 8 | Chamorro & Carolinian Language Heritage Studies | No | No | X | |||
| End of Course | EoC | NMI History | No | No | |||||
| U.S.Department of Defense Edu-cation Activity | No Assessments Used for Title I | Yes | |||||||
| District of Columbia | District of Columbia Comprehensive Assessment System Result | 2-10, HS | Reading, Math (3 to 8, 10 required: 2 and 9 optional), Science/ Biology (5, 8, HS), Composition (4,7,10) | Yes | Yes | Yes | |||
| Federated States of Micronesia | National Minimum Competency Standard-Based Test (NMCT) | 6,8, 10 | Reading, Math, Science (8) | No | No | X | |||
| Guam | Stanford Achievement Test, 10 | 1-12 | Reading, Language Arts, Math, Spelling, Environment/Science, Social Science. Only reported on Reading, Language Arts and Math. | Yes | Yes | Yes | |||
| Palau | No data reports found | X | |||||||
| Puerto Rico | Puerto Rican Academic Achievement Test | 3-8, 11 | Spanish, English, Math, Science (4,8,11) | No | No | X | |||
| Republic of Marshall Islands | No data reports found | X | |||||||
| U.S. Virgin Islands | General Assessment | 3-8, 11 | Reading, Math, Science (5, 8, 11) | Yes | Yes | Yes | |||
| Total Unique States (N=11) | 3 | 0 | 1 | 7 | |||||
| Total Regular and Unique States (N=61) | 45 | 2 | 1 | 13 | |||||
| Percent | 74% | 3% | 2% | 21% | |||||
Table B-2. Participation and Performance Data for Students with Disabilities, General Assessment Not Used for Title I Accountability, 2013-2014
| State | Test | Grade | Subject Areas |
Disaggregated Special Education Data on General Assessments Not Used for Title I |
||||||
|---|---|---|---|---|---|---|---|---|---|---|
| Partici-pation | Perform-ance | Reporting Summary By State | ||||||||
| All Used for Title I | Part. and Perf. All Tests | Part. and Perf. Some Tests | Perform-ance Only For All Tests | No Publicly Reported Data Found | ||||||
| Regular States | ||||||||||
| Alabama | The ACT College Readiness Test | 10 | English, Math, Reading, Science | No | No | X | ||||
| Alaska | No assessments found outside | - | - | Yes | ||||||
| Arizona | No assessments found outside | - | - | Yes | ||||||
| Arkansas | No assessments found outside | - | - | Yes | ||||||
| California | No assessments found outside | - | - | Yes | ||||||
| Colorado | No assessments found outside | - | - | Yes | ||||||
| Connecticut | No assessments found outside | - | - | Yes | ||||||
| Delaware | End of Course Exams | EoC | U.S. History (required), Biology, Algebra II, Integrated Mathematics III (not required) | No | No | X | ||||
| Florida | No assessments found outside | - | - | Yes | ||||||
| Georgia | Georgia High School Writing Assessment | 11 & retest | Writing | Yes | Yes | Yes | ||||
| Hawaii | End of Course | EoC | Algebra I, Algebra II, Biology I, Expository Writing I and/or U.S. History | No | No | X | ||||
| Idaho | Idaho Reading Indicator | K-3 | Reading | Yes | Yes | Yes | ||||
| Illinois | No assessments found outside | - | - | Yes | ||||||
| Indiana | Indiana Reading Evaluation and Determination (IREAD-3) | 3 | Reading | Yes | Yes | Yes | ||||
| Iowa | No assessments found outside | - | - | Yes | ||||||
| Kansas | No assessments found outside | - | - | Yes | ||||||
| Kentucky | Explore | 8 | English, Math, Reading, Science | Yes | Yes | Yes | ||||
| PLAN | 10 | English, Math, Reading, Science | Yes | Yes | ||||||
| ACT | 11 | English, Math, Reading, Science | Yes | Yes | ||||||
| Louisiana | Dibels Next | K to 3 | Reading | No | No | X | ||||
| Explore | 8 | English, Reading, Math, Science | No | No | ||||||
| Plan | 9 | English, Reading, Math, Science | No | No | ||||||
| ACT | 11 | English, Reading, Math, Science | No | No | ||||||
| Maine | Maine Educational Assessment (MEA) Science | 5,8, 11 | Science | Yes | Yes | Yes | ||||
| Maryland | No assessments found outside | - | - | Yes | ||||||
| Massachusetts | STE MCAS Tests | 10 | Science (Biology, Chemistry, Intro Physics, and Technology/ Engineering) | Yes | Yes | Yes | ||||
| Michigan | No assessments found outside | - | - | Yes | ||||||
| Minnesota | No assessments found outside | - | - | Yes | ||||||
| Mississippi | No assessments found outside | - | - | Yes | ||||||
| Missouri | No assessments found outside | - | - | Yes | ||||||
| Montana | ACT Plus Writing | HS | Reading, Language, Math, Science, Writing | No | No | X | ||||
| Nebraska | California Achievement Test (CAT) | 5,8 | Reading, Math | Yes | Yes | Yes | ||||
| Iowa Test of Basic Skills (ITBS) | 3-11 | Reading, Math | No | Yes | ||||||
| Iowa Test of Educational Development (ITED) | 10-11 | Reading, Math | No | Yes | ||||||
| Metropolitan Achievement Test | 4, 8 | Reading, Math | No | Yes | ||||||
| Terra Nova | 3-11 | Reading, Math | No | Yes | ||||||
| SAT | 4, 5, 7 to 9 | Reading, Math | No | Yes | ||||||
| Explore | 8 | Math, Reading | No | Yes | ||||||
| PLAN | 9 to 11 | Math, Reading | No | Yes | ||||||
| Nevada | No assessments found outside | - | - | Yes | ||||||
| New Hampshire | No assessments found outside | - | - | Yes | ||||||
| New Jersey | No assessments found outside | - | - | Yes | ||||||
| New Mexico | Standards Based Assessment High School Graduation Assessment | 10-11 | Reading, Math, Science (11) | Yes | Yes | Yes | ||||
| End of Course Exams | EoC/HS | Algebra II, Biology & Chemistry, Integrated Math III, English III, and US History. Spanish language version of English/Writing III. Writing and US History required for Diploma. | No | No | ||||||
| New York | No assessments found outside | - | - | Yes | ||||||
| North Carolina | ACT Benchmark | 11 | English, Math, Reading, Science, Writing. State requires taking in 11th grade. | Yes | Yes | Yes | ||||
| North Dakota | No assessments found outside | - | - | Yes | ||||||
| Ohio | No assessments found outside | - | - | Yes | ||||||
| Oklahoma | No assessments found outside | - | - | Yes | ||||||
| Oregon | No assessments found outside | - | - | Yes | ||||||
| Pennsylvania | No assessments found outside | - | - | Yes | ||||||
| Rhode Island | No assessments found outside | - | - | Yes | ||||||
| South Carolina | No assessments found outside | - | - | Yes | ||||||
| South Dakota | No assessments found outside | - | - | Yes | ||||||
| Tennessee | Writing | 3-11 | Writing | No | No | X | ||||
| ACT | HS | English, Math, Reading, Science, Composite | No | No | ||||||
| Texas | Texas Assessment of Know-ledge and Skills (TAKS) | 11, 12 (retest) | English Language Arts, Math, Science, Social studies | Yes | Yes | Yes | ||||
| Utah | No assessments found outside | - | - | Yes | ||||||
| Vermont | No assessments found outside | - | - | Yes | ||||||
| Virginia | No assessments found outside | - | - | Yes | ||||||
| Washington | End of Course (partially) | EoC | Algebra 1/Integrated Math 1, Geometry/Integrated Math 2, Biology | Yes | Yes | Yes | ||||
| West Virginia | Westest 2 Online Writing | 3 - 11 | Writing | No | No | X | ||||
| HEAP Health Assessment | 6, 8, HS | Health | No | No | ||||||
| Work Keys | 12 | Applied Math, Reading for Information, and Locating Information | No | No | ||||||
| Global 21 Career/Technical Education (CTE) | 9 - 12 | Career/Technical Education | No | No | ||||||
| Explore | 8 | English, Math, Reading, Science | No | No | ||||||
| Plan | 10 | English, Math, Reading, Science | No | No | ||||||
| Wisconsin | No assessments found outside | - | - | Yes | ||||||
| Wyoming | Explore | 9 | Math, Reading | No | No | Yes | ||||
| Plan | HS | Math, Reading | No | No | ||||||
| Student Assessment of Writing Skills (SAWS) | 3, 5, 7 | Writing | Yes | Yes | ||||||
| Student Assessments of Writing Skills –Alternate (SAWS-ALT) | 3, 5, 7 | Writing | Yes | Yes | ||||||
| Total Regular States (N=50) | 31 | 9 | 3 | 0 | 7 | |||||
| Unique States | ||||||||||
| American Samoa | No assessments found outside | - | - | Yes | ||||||
| Bureau of Indian Education | Unclear if any outside for states | - | - | Yes | ||||||
| Commonwealth of Northern Mariana Islands | Stanford Achievement Test, 10 | 3,5,6,8,9, 11 | Complete Battery: Reading, Math, Language, Spelling, Science, Social Science, Thinking Skills | No | Yes | Yes | ||||
| U.S.Department of Defense Education Activity | Terra Nova, Multiple Assessments, 3rd Edition | 3 - 11 | Reading/Language Arts, Mathematics, Science, Social Studies | No | No | X | ||||
| Terra Nova CAT Plus Mathematics Computation | 1 - 12 | Reading/Language/Mathemathematics/Science/Social Studies and Plus tests (Word analyses (1-3), Vocabulary (1-12) Language mechanics (2-12), Spelling (2-12) Administered to ELLs | No | No | ||||||
| Scholastic Reading Inventory TM (SRI) | 6, 9 | Reading Comprehension | No | No | ||||||
| STAMPS Standards-based measurements of proficiency | Unclear | Foreign Languge assessments (Arabic, Chinese, French, Italian, German, Japanese and Spanish) | No | No | ||||||
| Readistep | 8, 9 | College and Career integrated assessments | No | No | ||||||
| SAT | HS | Critical Reading, Math | No | No | ||||||
| District of Columbia | No assessments found outside | - | - | Yes | ||||||
| Federated States of Micronesia | No assessments found outside | - | - | Yes | ||||||
| Guam | No assessments found outside | - | - | Yes | ||||||
| Palau | No data reports found | - | - | Yes | ||||||
| Puerto Rico | No assessments found outside | - | - | Yes | ||||||
| Republic of Marshall Islands | No data reports found | - | - | Yes | ||||||
| U.S. Virgin Islands | No assessments found outside | - | - | Yes | ||||||
| Total Unique States (N=11) | 9 | 0 | 0 | 1 | 1 | |||||
| Total Regular and Unique States (N=61) | 39 | 8 | 3 | 1 | 10 | |||||
| Percent | 64% | 13% | 5% | 2% | 16% | |||||
Table B-3. Participation and Performance Data for Students with Disabilities, Alternate Assessments Based on Alternate Achievement Standards
(AA-AAS) Used for Title I Accountability System, 2013-2014
| State | Test | Grade | Subject Areas | Disaggregated Special Education Data For AA-AAS Used for Title I | |||||
|---|---|---|---|---|---|---|---|---|---|
| Partici-pation | Perform-ance | Summary by State | |||||||
| Partic. And Perf. For All Tests | Perf. Only for All Tests | No Test Used for Title I | No Publicly Reported Data Found | ||||||
| Regular States | |||||||||
| Alabama | Alabama Alternate Assessment (AAA) | 3-8, 11 | Reading, Math, Science (5,7) | Yes | Yes | Yes | |||
| Alaska | Alaska Alternate Assessment | 3-10 | Reading, Writing, Math (3-10) Science (4,8,10) | Yes | Yes | Yes | |||
| Arizona | Arizona Instrument to Measure Standards Alternate (AIMS-A) | 3-8, HS | Reading, Math, Science (4,8,HS) | Yes | Yes | Yes | |||
| Arkansas | Arkansas Alternate Portfolio | 3-11 | English Language Arts and Math (3-8,11), Science (5,7), Algebra I and Geometry (9), Biology (10) | No | No | X | |||
| California | California Alternate Performance Assessment (CAPA) | 2-11 | ELA (2-11), Math (2-11), Science (5,8,10), and these subjects in levels II to V. | Yes | Yes | Yes | |||
| Colorado | Colorado Alternate Assessment (CoAlt) | 3-10 | Reading, Math, Writing (3-10), Science (5, 8) | Yes | Yes | Yes | |||
| Connecticut | Skills Checklist | 3-8 | Access Skills, Math, Reading, Communication | Yes | Yes | Yes | |||
| Delaware | Delaware Comprehensive Assessment System (DCAS-Alt) | 3-10 | Reading, Math (3-10), Science (5,8,10), Social Studies (4,7,9) | Yes | Yes | Yes | |||
| Florida | Florida Alternate Assessment (FAA) | 3-11 | Reading, Math, Writing (4,8,10), Science (5,8,11) | Yes | Yes | Yes | |||
| Georgia | Georgia Alternate Assessment | 3-8, 11 | English/Language Arts, Math, Science, Social Studies | Yes | Yes | Yes | |||
| Hawaii | Alternate Assessment | 3-8,10 | Reading, Math, Science (4,8,10) | Yes | Yes | Yes | |||
| Idaho | Idaho Alternate Assessment (IAA) | 3-10 | English Language Arts (ELA) and Math (3-9), Science (5,7,10) | Yes | Yes | Yes | |||
| Illinois | Illinois Alternate Assessment (IAA) | 3-8,11 | Reading, Math, Science (4,7,11), Writing (11) | Yes | Yes | Yes | |||
| Indiana | Indiana Standards Tool for Alternate Reporting (ISTAR) | 3-8, 10 | English/Language Arts, Math, Science (4,6), Social Studies (5,7), Biology (10) | No | Yes | Yes | |||
| Iowa | Iowa Alternate Assessment (IAA) | 3-8,11 | Reading, Math | Yes | Yes | Yes | |||
| Iowa Alternate Assessment (IAA) Science | 5,8,11 | Science | Yes | Yes | |||||
| Kansas | Kansas Alternate Assessment (KAA) | 3-8, 11 | Reading, Math, Science (4,7, 11) | No | No | No data due to cyber attack | |||
| Kentucky | Alternate Kentucky Performance Rating for Educational Progress (K-PREP) | 3-12 | Reading (3-9), Math (3-8,10), Writing (4,5,6, 8,10,11), Science (4,7,11), Social Studies (5,8,12) | Yes | Yes | Yes | |||
| Louisiana | Louisiana Alternate Assessment 1 | 3-11 | English/Language arts, Math, Science | Yes | Yes | Yes | |||
| Maine | Maine Personalized Alternate Assessment Portfolio (MEPAAP) | 2-8, 10 & 11 | Reading, Math, Science (5,8), Writing (5,8) | Yes | Yes | Yes | |||
| Maryland | Alternate Maryland School Assessment (ALT-MSA) | 3-8,10 | Math, Reading, Science (5,8,10) | Yes | Yes | Yes | |||
| Massachusetts | Massachusetts Comprehensive Assessment System Alternate (MCAS-Alt) | 3-10 | English/Language Arts, Math, Science and Technology/ Engineering (5, 8-10) | Yes | Yes | Yes | |||
| Michigan | Michigan Access (MI-Access) Functional Independence | 3-8, 11 | Accessing Print, Math(3, 8, 11), Expressing Ideas (4, 7, 11), Science (5, 8, 11) | Yes | Yes | Yes | |||
| Michigan Access (MI-Access) Supported Independence | 3-8, 11 | English Language Arts, Math, Science (5, 8, 11) | Yes | Yes | |||||
| Michigan Access (MI-Access) Participation | 3-8, 11 | English Language Arts, Math, Science (5, 8, 11) | Yes | Yes | |||||
| Minnesota | Minnesota Test of Academic Skills III (MTAS III) | 3-8, HS | Reading and Math, Science (5, 8, HS) | Yes | Yes | Yes | |||
| Mississippi | Mississippi Alternate Assessment of the Extended Curriculum Frameworks | 3-8 | Language Arts, Math, Science (5,8) | Yes | Yes | Yes | |||
| Mississippi Alternate Assessment of the Extended Curricular Frameworks Secondary | HS | Language Arts, Math, Science | Yes | Yes | |||||
| Missouri | Missouri Assessment Program Alternate (MAP-A) | 3-8, 10, 11 | Communication Arts, (3 to 8, 11) Math (3 to 8, 10), Science (5, 8, 11) | Yes | Yes | Yes | |||
| Montana | Criterion Referenced Test (CRT) Alternate. No Reading or Math this year due to field testing. | 3-8, 10 | Science (4,8, 10) | Yes | Yes | Yes | |||
| Nebraska | Alternate Assessment | 3-8, 11 | Reading, Math, Science (5,8,11), Writing (8,11) | Yes | Yes | Yes | |||
| Nevada | Nevada Alternate Assessment (NAA) | 3-8, 11 | Reading, Math, Science (8), Writing (8) | Yes | Yes | Yes | |||
| New Hampshire | New Hampshire Alternate Learning Progression Assessment (NH ALPS) | 2-7, 10,11 | Reading, Math (2-7,10) Science (4,8,11), Writing (4,7,10) | Yes | Yes | Yes | |||
| New Jersey | Alternate Proficiency Assessment | 3-8, 11 | Language Arts Literacy, Math, Science (4, 8, EoC) | Yes | Yes | Yes | |||
| New Mexico | Alternative Performance Assessment (NMAPA) | 3-8, HS | Reading, Math | Yes | Yes | Yes | |||
| New York | New York State Alternate Assessment (NYSAA) | 3-8, HS | English Language Arts, Math, Science (4,8, HS), Social Studies (HS) | Yes | Yes | Yes | |||
| North Carolina | North Carolina Extend 1 (NCEXTEND1) | 3-8 | Reading, Math, Science (5,8) | Yes | Yes | Yes | |||
| North Carolina Extend 1 (NCEXTEND1) | 10 | Math I, Biology, English II | Yes | Yes | |||||
| North Dakota | North Dakota Alternate Assessment 1 (NDAA1) | 3-8, 11 | Reading/Language Arts, Math, Science | Yes | Yes | Yes | |||
| Ohio | Alternate Assessment for Students with Cognitive Disabilities (AASCD) | 3-8 | English/Language Arts, Math, Science (5,8) | Yes | Yes | Yes | |||
| Alternate Ohio Graduation Test (OGT-AASCD) | HS | English/Language Arts, Math, Science, Social Studies | Yes | Yes | |||||
| Oklahoma | Oklahoma Alternate Assessment Program (OAAP) | 3-8, EoI | Math, Reading, Science (5,8), Geography, Social Studies, Writing (5,8), Algebra I, English II/ Writing, Biology, US History (others if took Algebra II, Geometry, English III/ Writing) | No | No | X | |||
| Oregon | Oregon Assessment of Knowledge and Skills (OAKS) Extended | 3-8,11 | Reading, Math, Science (5,8,11), Writing (11) | Yes | Yes | Yes | |||
| Pennsylvania | Pennsylvania Alternate System of Assessment (PASA) | 3-8, 11 | Reading, Math, Science (4,8,11) | Yes | Yes | Yes | |||
| Rhode Island | Rhode Island Alternate Assessment (RIAA) | 3-8, 11 | Science (4,8,11), Transition year to NCSC for ELA, Writing and Math | Yes | Yes | Yes | |||
| South Carolina | South Carolina Alternate (SC-ALT) | 3-8, 10 | English Language Arts, Math, Science, Social Studies (and HS Biology) | Yes | Yes | Yes | |||
| South Dakota | Dakota State Test of Educational Progress Alternate (DSTEP A). State is transitioning to NCSC, so no data for either DSTEP A or NCSC in Reading or Math. | 3-8,11 | Science (5,8,11) (other content areas not reported due to participation in NCSC field testing) | Yes | Yes | Yes | |||
| Tennessee | Alternate Assessment | 3-12 | Math, Reading /Language, Science | Yes | Yes | Yes | |||
| Texas | State of Texas Assessments of Academic Readiness Alternate (STAARALT) | 3-8 | Math, Reading, Writing (4,7), Science (5,8) Social Studies (8) | Yes | Yes | Yes | |||
| STAARALT End of Course (EoC) | EoC | English I, English II, Algebra I, Biology, US History | Yes | Yes | |||||
| Utah | Utah Alternate Assessment (UAA) | 3-11 | Language Arts, Math, and Science | No | No | X | |||
| Vermont | Alternate Assessment | 3-8,11 | Math, Reading, Science (4,8,11) | No | No | X | |||
| Virginia | Virginia Alternate Assessment Portfolio (VAAP) | 3-8 | Reading, Math, History/Social Science, Science | Yes | Yes | Yes | |||
| Virginia Alternate Assessment Portfolio End of Course (VAAP EoC) | EoC | Reading, Math, History/Social Science, Science | Yes | Yes | |||||
| Washington | Washington Alternate Assessment System (WAAS Portfolio) | 3-8, 10 | Reading, Math, Writing (4, 7, 10), Science (5, 8, 10) | Yes | Yes | Yes | |||
| West Virginia | Alternate Performance Task Assessment (APTA) | 3-8, 10 | Math, Reading/Language Arts (3-8, 11), Science (4,6, 10) | Yes | Yes | Yes | |||
| Wisconsin | Wisconsin Alternate Assessment (WAA) | 3-8, 10 | Reading, Math, Language Arts (4,8,10), Science (4,8,10), Social Studies (4,8,10) | Yes | Yes | Yes | |||
| Wyoming | Proficiency Assessments for Wyoming Students Alternate (PAWS-ALT) | 3-8,11 | Reading, Math, Science (4,8, 11) | Yes | Yes | Yes | |||
| Total Regular States (N=50) | 44 | 1 | 0 | 5 | |||||
| Unique States | |||||||||
| American Samoa | Alternate Assessment | No information found | No | No | X | ||||
| Bureau of Indian Education | Merged with regular | Elem to HS | By state: Langauge Arts, Reading, Math, Science | No | No | X | |||
| Common-wealth of Northern Mariana Islands | Alternate Assessment | 3-8 | Reading, Math | Yes | Yes | Yes | |||
| Alternate End of Course | EoC | Reading, Math | Yes | Yes | |||||
| U.S. Department of Defense Education Activity | DoDEA Alternate Assessment. This assessment is not used for Title I purposes, but is listed in this table for convenience. | K to 12 | The Alternate Assessment is comprised of evidence of the student’s achievement, including but not limited to student work products, interviews, photographs, videos, etc. | No | No | X | |||
| District of Columbia | DC CAS-Alt | 3 to 8, 10 | Math, Reading (3 to 8, 10) | Yes | Yes | Yes | |||
| Federated States of Micronesia | Alternate Assessment on Alternate Achievement Standards | 6, 8, 10 | Reading, Math, Science (8) | No | No | X | |||
| Guam | Alternate Assessment | 1-12 | Reading, Math, Science. Only Reported Reading and Math. | Yes | Yes | Yes | |||
| Palau | No data reports found | No information found | No | No | X | ||||
| Puerto Rico | Puerto Rico Alternate Assessment | 3-8, 11 | Spanish, English, Math, Science (4,8,11) | No | No | X | |||
| Republic of Marshall Islands | No data reports found | No information found | No | No | X | ||||
| U.S. Virgin Islands | Alternate Assessment | 3-8, 11 | Reading, Math, Science (5, 8, 11) | Yes | Yes | Yes | |||
| Total Unique States (N=11) | 4 | 0 | 1 | 6 | |||||
| Total Regular and Unique States (N=61) | 48 | 1 | 1 | 11 | |||||
| Percent | 79% | 2% | 2% | 181 | |||||
1 Percentage is more than 100 due to rounding.
Table B-4. Participation and Performance Data for English Language Learners (ELLs) with Disabilities, General Assessments Used for Title I Accountability, 2013-2014
| State | Test | Grade | Subject Areas | Disaggregated Data for ELLs with Disabilities for General Assessment Used for Title I | ||||||
|---|---|---|---|---|---|---|---|---|---|---|
| Partici-pation | Perform-ance | Reporting Summary By State | ||||||||
| Part. and Perf. All Tests | Part. and Perf. Some Tests | Partici-pation Only For Some Tests | No AA-AAS Used for Title I | No Publicly Reported Data Found | ||||||
| Regular States | ||||||||||
| Alabama | ACT Aspire | 3 to 8, 10-11 | Reading, Math | No | No | X | ||||
| Alabama Science Assessment (ASA) | 5,7 | Science | No | No | ||||||
| ACT Plan | 10 | English, Math, Science | No | No | ||||||
| Alaska | Standards Based Assessments | 3-10 | Reading, Writing, Mathematics, (3-10), Science (4,8,10) | No | No | X | ||||
| High School Graduation Qualification Exam | 10-12 | Reading, Writing, Mathematics | No | No | ||||||
| Arizona | Arizona’s Instrument to Measure Standards (AIMS) | 3-8 | Reading, Math, Science | No | No | X | ||||
| Arizona’s Instrument to Measure Standards (AIMS HS) | HS | Reading, Writing, Math, Science | No | No | ||||||
| Arkansas | Augmented Benchmark Exams (ABE) | 3-8 | Math, Literacy | No | No | X | ||||
| End of Course Exams | EoC | Algebra I, Biology, Geometry, Literacy | No | No | ||||||
| Iowa Tests (ITED) | 9 | Reading, Math and Language | No | No | ||||||
| California | California Standards Test Scores (CST) | 5, 8, 10 | Science | No | No | Yes | ||||
| Standards Based Tests in Spanish (STS) | 2-11 | English Language Arts | Yes (not all ELL) | Yes (not all ELL) | ||||||
| High School Exit Exam | 10 | English-Language Arts, Math | No | No | ||||||
| Colorado | Transitional Colorado Assessment Program (TCAP) | 3-10 | Reading, Math, Writing (3-10), Escritura, Lectura (3-4) | Yes | Yes | Yes | ||||
| Colorado Measures of Academic Success | 4-5, 7-8 | Science (5,8), Social Studies (4,7) | No | No | ||||||
| Connecticut | Connecticut Mastery Test (CMT) | 5, 8 | Science - This was field test year for other content on new assessment. | No | No | X | ||||
| Connecticut Academic Performance Test | 10 | Science - This was field test year for other content on new assessment. | No | No | ||||||
| Delaware | Delaware Comprehensive Assessment System (DCAS) | 3-10 | Reading, Math (3-10), Science (5,8,10), Social Studies (4,7) | No | No | X | ||||
| Florida | Florida Comprehensive Assessment Test (FCAT)/ FCAT 2.0 | 3-10 | Reading, Math (3 to 8), Science (5, 8), Writing (4, 8, 10) | No | No | X | ||||
| End of Course Assessment | EoC | Algebra I, Civics, U.S. History, Biology I, Geometry | No | No | ||||||
| Georgia | Criterion-Referenced Competency Test | 3-8 | Reading, English/ Language Arts, Math, Science (3-8), Social Studies (3-8) | No | No | X | ||||
| End of Course Test | EoC | Math I & II, GPS Algebra, GPS Geometry, United States History, Economics/Business/ Free Enterprise, Biology, Physical Science, Ninth Grade Literature and Composition | No | No | ||||||
| Hawaii | Hawaii State Assessment Program | 3-8, 10 | Reading, Math, Science | No | No | X | ||||
| Idaho | General Assessment | 3-8, 10, 11 | English Language Arts (ELA) and Math(3-8, 11), Science (5,7, 10) | No | No | X | ||||
| Illinois | Illinois Standards Achievement Test (ISAT) | 3-8 | Reading, Math, Science (4, 7) | No | No | X | ||||
| Prairie State Achievement Examination (PSAE) | 11 | ACT Plus Writing (English, Math, Reading and Science, writing prompt), ISBE Science assessment, and two Workkeys sections –Applied Math and Reading for Information. | No | No | ||||||
| Indiana | Indiana State-wide Testing for Education Progress- Plus (ISTEP+) | 3-8 | English/Language Arts, Math, Science (4,6), Social Studies (5,7) | No | No | X | ||||
| End of Course Assessments (ECAs) | EoC | English, Algebra I, Biology I | No | No | ||||||
| Iowa | Iowa Assessment | 3-8,11 | Reading, Math | No | No | X | ||||
| Iowa Assessment Science | 5,8,11 | Science | No | No | ||||||
| Kansas | General Assessment | 3-8,11 | Reading, Math, Science (4,7,11) | No | No | X | ||||
| Kentucky | Kentucky Performance Rating for Educational Progress (K-PREP) | 3-8, 10,11 | Reading, Math, Science (4, 7), Social Studies (5,8), Writing (5, 6, 8, 10, 11), Language Mechanics (4, 6, 10) | No | No | X | ||||
| End of Course | EoC | English II, Algebra II, Biology, US History | No | No | ||||||
| Stanford Achievement Test 10 (part of K-PREP) | 3-8 | Reading, Math (3-8) Science (4,7), Social Studies (5,8), Language Mechanics (4,6) | No | No | ||||||
| Louisiana | Louisiana Educational Assessment Program (LEAP) | 4,8 | English/Language Arts, Math, Science, Social Studies | No | No | X | ||||
| Integrated Louisiana Educational Assessment Program (iLEAP) | 3,5-7 | English/Language Arts, Math, Science, Social Studies | No | No | ||||||
| End of Course tests | EoC | English II, English III, Algebra I, Geometry, Biology, US History | No | No | ||||||
| Maine | New England Comprehensive Assessment Program (NECAP) | 3-8 | Reading, Math, Writing (5,8) | No | No | X | ||||
| Maine High School Assessment | 11, 3rd year HS | Reading, Writing, Math | No | No | ||||||
| Maryland | Maryland School Assessment (MSA) | 3-8 | Math, Reading, Science (5,8) Field testing affected Math and Reading Totals. | No | No | X | ||||
| High School Assessments (HSA) | EoC | Algebra/Data analysis, English, Biology, Government | No | No | ||||||
| Massachusetts | Massachusetts Comprehensive Assessment System (MCAS) | 3-8, 10 | English/Language Arts, Math, | No | No | X | ||||
| STE MCAS Tests | 5, 8-10 | Science (Biology, Chemistry, Intro Physics, and Technology/ Engineering, also used outside Title I) | No | No | ||||||
| Michigan | Michigan Education Assessment Program (MEAP) | 3-9 | Reading, Math, (3-8), Writing (4,7 ) Science (5,8 ), Social Studies (6,9) | Yes | Yes | Yes | ||||
| Michigan Merit Examination (MME) | 11 | Reading, Math, Writing, Science, Social Studies | Yes | Yes | ||||||
| Minnesota | Minnesota Comprehensive Assessment (MCA) –III | 3-8, HS | Reading (3 to 8, 10), Math (3 to 8, 11), Science (5, 8, HS) | Yes | Yes | Yes | ||||
| Mississippi | Mississippi Curriculum Test (MCT2) | 3-8 | Language Arts, Math | No | No | X | ||||
| Science Tests | 5,8 | Science | No | No | ||||||
| High school Subject Area Tests | EoC | Algebra I, Biology I, English II, US History | No | No | ||||||
| Missouri | Missouri Assessment Program (MAP) | 3-8 | Communication Arts, Math, Science (5,8) | No | No | X | ||||
| Online End of Course Assessments | EoC | English I and II, Algebra I and II, Geometry, Biology, American History, Government | No | No | ||||||
| Montana | Criterion Reference Test (CRT) | 3-8, 10 | Reading, Math, Science (4, 8, 10) | No | No | X | ||||
| Nebraska | Nebraska State Accountability (NeSA) | 3-8, 11 | Reading, Math, Science (5,8,11), Writing (4, 8,11) In 2014 students in gr 8 and 11 had technology issues with the online test. Valid results are not available for NeSA-Writing at these grades. | No | No | X | ||||
| Nevada | Criterion Referenced Test (CRT) | 3-8 | Reading, Math, Science (5,8) | No | No | X | ||||
| High School Proficiency Exam | HS | Reading, Math, Science, Writing | No | No | ||||||
| New Hampshire | New England Comprehensive Assessment Program (NECAP) | 3-8, 11 | Reading, Math, Writing (5,8,11), Science (4,8,11) | No | No | X | ||||
| New Jersey | New Jersey Assessment of Skills and Knowledge (NJASK) | 3-8 | Language Arts Literacy, Math, Science (4, 8) | No | No | X | ||||
| New Jersey Biology Competency Test | EoC | Biology | No | No | ||||||
| High School Proficiency Assessment (HSPA) | First time 11th graders | Math, Language Arts Literacy, | No | No | ||||||
| New Mexico | Standards Based Assessment (SBA) | 3-8,10-11 | Reading, Math, Science (3, 7-8, 11). And High School SBA serves as diploma also | No | No | X | ||||
| New York | New York State Testing Program (NYSTP) | 3-8 | English Language Arts, Math, Science (4,8) | No | No | X | ||||
| Common Core Regents | EoC | Algebra I, ELA (required to pass ELA only if entered gr. 9 in 2013-14) | No | No | ||||||
| Regents Competency Tests | EoC | Math, Science, Reading, Writing, Global Studies, US History and Government. Parts used for Title I and Diploma. | No | No | ||||||
| Regents Exams | EoC | Comprehensive English, US History &Gov’t, Global History & Geography, Alg2/ Trig, Geometry, Integ Alg, Living Envt, Physical etting/Physics, Physical Setting/ Chemistry, Physical setting/Earth Science. Parts used for Title I and Diploma. | No | No | ||||||
| North Carolina | End of Grade Multiple Choice Test | 3-8 | Reading, Math, Science (5,8) | No | No | X | ||||
| End of Course Multiple Choice | EOC | Math I, Biology, English II, | No | No | ||||||
| North Dakota | General Assessment | 3-8, 11 | Reading/Language Arts, Math, Science (4,8,11) | No | No | X | ||||
| Ohio | Ohio Achievement Assessments (OAA) | 3-8 | Math, Reading, Science (5,8), | Yes | Yes | Yes | ||||
| Ohio Graduation Tests (OGT) | HS | Reading, Math, Science, Social Studies, Writing | Yes | Yes | ||||||
| Oklahoma | Oklahoma Core Curriculum Tests (OCCT) | 3-8 | Math, Reading, Science (5,8), Geography (7), Social Studies (5), US History (8), Writing (5,8) For Title I, all used except for Geography, Social Studies, History and Writing | No | No | X | ||||
| End of Instruction | EoI | ACE Algebra I, ACE Algebra II, ACE Geometry, ACE English II, III (Writing included), ACE Biology I, ACE US History. For Title I, all used except for Alg II, Eng II, Geometry and US History | No | No | ||||||
| Oregon | Oregon Assessment of Knowledge and Skills (OAKS) Online | 3-8,11 | Reading, Math, Science (5,8,11), Writing (11) | No | No | X | ||||
| Pennsylvania | Pennsylvania System of School Assessment (PSSA) | 3-8, 11 | Reading, Math, Science (4,8,) Algebra, Biology and Literature (11) | Yes | No | Yes | ||||
| Keystone Exam | 11 | Algebra, Biology and Literature | Yes | No | ||||||
| Rhode Island | New England Education Assessment Program (NECAP) | 3-8,11 | Reading, Math, Writing (5,8,11), Science(4,8,11) | No | No | X | ||||
| South Carolina | Palmetto Assessment of State Standards | 3-8 | English Language Arts, Math, Science, Social Studies, Writing (5, 8) | No | No | X | ||||
| End of Course Examination | EoC | Algebra/Math for Technologies 2, Biology/ Applied Biology 2, English 1, US History and the Constitution | No | No | ||||||
| High School Assessment Program Test | 2nd year HS | English Language Arts, Math | No | No | ||||||
| South Dakota | South Dakota State Test of Educational Progress (DSTEP) and Field Testing for Smarter Balanced Assessment | 3-8,11 | Science (5,8,11) (other content areas not reported due to participation in SBAC field testing) | No | No | X | ||||
| Tennessee | Criterion Referenced Academic Achievement | 3-8 | Math, Reading/ Language, Social Studies, Science | No | No | X | ||||
| End of Course | EoC | Algebra I, Algebra II, English I, English II, English III, US History, Biology, Chemistry (Chemistry not reported for any students though listed) | No | No | ||||||
| Texas | State of Texas Assessments of Academic Readiness (STAAR) Includes Spanish versions | 3-8 | Math, Reading, Writing (4,7), Science (5,8) Social Studies (8) | No | No | X | ||||
| STAAR EoC | EoC | Algebra I, Biology, English I, Reading, English I Writing, US History | No | No | ||||||
| Utah | Student Assessment of Growth and Excellence (SAGE) | 3-11 | Reading, Language, Listening, Writing (3-11) Math (3-8), Secondary Math I, II, III, Science (4-8), Biology, Earth Science, Chemistry, Physics | No | No | X | ||||
| Vermont | New England Comprehensive Assessment Program (NECAP) | 3-8, 11 | Math, Reading, Science (4,8,11), Writing (5,8,11) | No | No | X | ||||
| Virginia | Standards of Learning (SOL) | 3-8 | Reading, Math, Science (3,5,8), History/Social Studies (3,5,8), Writing (5,8) | Yes | Yes | Yes | ||||
| End of Course Test | EoC | Reading, Writing, Algebra I, II, Geometry, Biology, Chemistry, Earth Science, Virginia and US History, World History I, II, World Geography, US History to 1865, US History from 1865 to present, Civics and Economics, Virginia Studies | Yes | Yes | ||||||
| Washington | Measurements of Student Progress (MSP) | 3-8 | Reading, Math, Writing (4,7), Science (5,8) | No | No | X | ||||
| High School Proficiency Exam (HSPE) | 10 | Reading, Writing | No | No | ||||||
| End of Course | EoC | Algebra 1/Integrated Math 1, Geo-metry/ Integrated Math 2, Biology - part also not used for Title I | No | No | ||||||
| West Virginia | West Virginia Educational Standards Test 2 | 3-11 | Math (3-11), Reading/ Language Arts (3-11) Science, Social Studies (3-6), World Geography (7), West Virginia Studies (8), Algebra I (9), Physical Science (9), World Studies to 1900 (9), Geometry (10), Biology, (10), US Studies to 1900 (10), Chemistry (11), 20th and 21st Centuries Studies (11) | No | No | X | ||||
| Wisconsin | Wisconsin Knowledge and Concepts Exams (WKCE) | 3-8, 10 | Reading, Math, Language Arts (4,8,10), Science (4,8,10), Social Studies (4,8,10) | No | No | X | ||||
| Wyoming | Proficiency Assessments for Wyoming Students (PAWS) | 3-8, 11 | Reading, Math, Science (4,8, 11) | No | No | X | ||||
| ACT Plus Writing | 11 | English, math, Reading, Writing, Science | No | No | ||||||
| Total Regular States (N=50) | 4 | 2 | 1 | 0 | 42 | |||||
| Unique States | ||||||||||
| American Samoa | Stanford Achievement Test 10 | Elem to HS | Language Arts, Science, Math Problem Solving, History, Social Science | No | No | X | ||||
| Bureau of Indian Education | Individual state administered assessments | Elem to HS | By State: Langauge Arts, Reading, Math, Science | No | No | X | ||||
| Common-wealth of Northern Marianna Islands | Standards Based Assessment | 4, 6, 8 | Chamorro & Carolinian Language Heritage Studies | No | No | X | ||||
| End of Course | EoC | NMI History | No | No | ||||||
| U.S. Department of Defense Education Activity | No assessments used for Title I | NA | NA | X | ||||||
| District of Columbia | District of Columbia Comprehensive Assessment System Result | 2-10, HS | Reading, Math (3 to 8, 10 required: 2 and 9 optional), Science/ Biology (5, 8, HS), Composition (4,7,10) | No | No | X | ||||
| Federated States of Micronesia | National Minimum Competency Standard-Based Test (NMCT) | 6,8, 10 | Reading, Math, Science (8) | No | No | X | ||||
| Guam | Stanford Achievement Test, 10 | 1-12 | Reading, Language Arts, Math, Spelling, Environment/Science, Social Science. Only reported on Reading, Language Arts and Math. | No | No | X | ||||
| Palau | No data reports found | No | No | X | ||||||
| Puerto Rico | Puerto Rican Academic Achievement Test | 3-8, 11 | Spanish, English, Math, Science (4,8,11) | No | No | X | ||||
| Republic of Marshall Islands | No data reports found | No | No | X | ||||||
| U.S. Virgin Islands | General Assessment | 3-8, 11 | Reading, Math, Science (5, 8, 11) | No | No | X | ||||
| Total Unique States (N=11) | 0 | 0 | 0 | 1 | 11 | |||||
| Total Regular and Unique States (N=61) | 4 | 2 | 1 | 1 | 53 | |||||
| Percent | 6% | 3% | 2% | 2% | 87% | |||||
Table B-5. Participation and Performance Data for English Language Learners (ELLs) with Disabilities, General Assessments Not Used for Title I Accountability, 2013-2014
| State | Test | Grade | Subject Areas | Disaggregated Data for ELLs with Disabilities for General Assessment Not Used for Title I | ||||
|---|---|---|---|---|---|---|---|---|
| Partici-pation | Perform-ance | Reporting Summary By State | ||||||
| No Out-side Tests | Part. and Perf. All Tests | No Publicly Reported Data Found | ||||||
| Regular States | ||||||||
| Alabama | The ACT College Readiness Test | 10 | English, Math, Reading, Science | No | No | X | ||
| Alaska | No assessments found outside | - | - | Yes | ||||
| Arizona | No assessments found outside | - | - | Yes | ||||
| Arkansas | No assessments found outside | - | - | Yes | ||||
| California | No assessments found outside | - | - | Yes | ||||
| Colorado | No assessments found outside | - | - | Yes | ||||
| Connecticut | No assessments found outside | - | - | Yes | ||||
| Delaware | End of Course Exams | EoC | U.S. History (required), Biology, Algebra II, Integrated Mathematics III (not required) | No | No | X | ||
| Florida | No assessments found outside | - | - | Yes | ||||
| Georgia | Georgia High School Writing Assessment | 11 & retest | Writing | No | No | X | ||
| Hawaii | End of Course | EoC | Algebra I, Algebra II, Biology I, Expository Writing I and/or U.S. History | No | No | X | ||
| Idaho | Idaho Reading Indicator | K-3 | Reading | No | No | X | ||
| Illinois | No assessments found outside | - | - | Yes | ||||
| Indiana | Indiana Reading Evaluation and Determination (IREAD-3) | 3 | Reading | No | No | X | ||
| Iowa | No assessments found outside | - | - | Yes | ||||
| Kansas | No assessments found outside | - | - | Yes | ||||
| Kentucky | Explore | 8 | English, Math, Reading, Science | No | No | X | ||
| PLAN | 10 | English, Math, Reading, Science | No | No | ||||
| ACT | 11 | English, Math, Reading, Science | No | No | ||||
| Louisiana | Dibels Next | K to 3 | Reading | No | No | X | ||
| Explore | 8 | English, Reading, Math, Science | No | No | ||||
| Plan | 9 | English, Reading, Math, Science | No | No | ||||
| ACT | 11 | English, Reading, Math, Science | No | No | ||||
| Maine | Maine Educational Assessment (MEA) Science | 5,8, 11 | Science | No | No | X | ||
| Maryland | No assessments found outside | - | - | Yes | ||||
| Massachusetts | STE MCAS Tests | 10 | Science (Biology, Chemistry, Intro Physics, and Technology/ Engineering) | No | No | X | ||
| Michigan | No assessments found outside | - | - | Yes | ||||
| Minnesota | No assessments found outside | - | - | Yes | ||||
| Mississippi | No assessments found outside | - | - | Yes | ||||
| Missouri | No assessments found outside | - | - | Yes | ||||
| Montana | ACT Plus Writing | HS | Reading, Language, Math, Science, Writing | No | No | X | ||
| Nebraska | California Achievement Test (CAT) | 5,8 | Reading, Math | No | No | X | ||
| Iowa Test of Basic Skills | 3-11 | Reading, Math | No | No | ||||
| Iowa Test of Educational Development | 10-11 | Reading, Math | No | No | ||||
| Metropolitan Achievement Test | 4, 8 | Reading, Math | No | No | ||||
| Terra Nova | 3-11 | Reading, Math | No | No | ||||
| SAT | 4, 5, 7 to 9 | Reading, Math | No | No | ||||
| Explore | 8 | Reading, Math | No | No | ||||
| PLAN | 9 to 11 | Reading, Math | No | No | ||||
| Nevada | No assessments found outside | - | - | Yes | ||||
| New Hampshire | No assessments found outside | - | - | Yes | ||||
| New Jersey | No assessments found outside | - | - | Yes | ||||
| New Mexico | Standards Based Assessment High School Graduation Assessment | 10-11 | Reading, Math, Science (11) | No | No | X | ||
| End of Course Exams | EoC/HS | Algebra II, Biology & Chemistry, Integrated Math III, English III, and US History. Spanish language version of English/Writing III. Writing and US History required for Diploma. | No | No | ||||
| New York | No assessments found outside | - | - | Yes | ||||
| North Carolina | ACT Benchmark | 11 | English, Math, Reading, Science, Writing. State requires taking in 11th grade. | No | No | X | ||
| North Dakota | No assessments found outside | - | - | Yes | ||||
| Ohio | No assessments found outside | - | - | Yes | ||||
| Oklahoma | No assessments found outside | - | - | Yes | ||||
| Oregon | No assessments found outside | - | - | Yes | ||||
| Pennsylvania | No assessments found outside | - | - | Yes | ||||
| Rhode Island | No assessments found outside | - | - | Yes | ||||
| South Carolina | No assessments found outside | - | - | Yes | ||||
| South Dakota | No assessments found outside | - | - | Yes | ||||
| Tennessee | Writing | 3-11 | Writing | No | No | X | ||
| ACT | HS | English, Math, Reading, Science, Composite | No | No | ||||
| Texas | Texas Assessment of Know-ledge and Skills (TAKS) | 11, 12 retest | English Language Arts, Math, Science, Social studies | Yes | Yes | Yes | ||
| Utah | No assessments found outside | - | - | Yes | ||||
| Vermont | No assessments found outside | - | - | Yes | ||||
| Virginia | No assessments found outside | - | - | Yes | ||||
| Washington | End of Course | EoC | Algebra 1/integrated Math 1, Geometry/ Integrated Math 2, Biology | No | No | X | ||
| West Virginia | Westest 2 Online Writing | 3 - 11 | Writing | No | No | X | ||
| HEAP Health Assessment | 6, 8, HS | Health | No | No | ||||
| Work Keys | 12 | Applied Math, Reading for Information, and Locating Information | No | No | ||||
| Global 21 Career/Technical Education (CTE) | 9 - 12 | Career/Technical Education | No | No | ||||
| Explore | 8 | English, Math, Reading, Science | No | No | ||||
| Plan | 10 | English, Math, Reading, Science | No | No | ||||
| Wisconsin | No assessments found outside | - | - | Yes | ||||
| Wyoming | Explore | 9 | Math, Reading | No | No | X | ||
| Plan | HS | Math, Reading | No | No | ||||
| Student Assessment of Writing Skills (SAWS) | 3, 5, 7 | Writing | No | No | ||||
| Student Assessments of Writing Skills –Alternate (SAWS-ALT) | 3, 5, 7 | Writing | No | No | ||||
| Total Regular States (N=50) | 31 | 1 | 18 | |||||
| Unique States | ||||||||
| American Samoa | No assessments found outside | - | - | Yes | ||||
| Bureau of Indian Education | Unclear if any outside for states | - | - | Yes | ||||
| Commonwealth of Northern Marianna Islands | Stanford Achievement Test, 10 | 3,5,6,8,9, 11 | Complete Battery: Reading, Math, Language, Spelling, Science, Social Science, Thinking Skills | No | No | X | ||
| U.S. Department of Defense Education Activity | Terra Nova, Multiple Assessments, 3rd Edition | 3 - 11 | Reading/Language Arts, Mathematics, Science, Social Studies | No | No | X | ||
| Terra Nova CAT Plus Mathematics Computation | 1 - 12 | Reading/Language/Mathemathematics/Science/Social Studies and Plus tests (Word analyses (1-3), Vocabulary (1-12) Language mechanics (2-12), Spelling (2-12) Administered to ELLs | No | No | ||||
| Scholastic Reading Inventory TM (SRI) | 6, 9 | Reading Comprehension | No | No | ||||
| STAMPS Standards-based Measurements of Proficiency | Unclear | Foreign Languge assessments (Arabic, Chinese, French, Italian, German, Japanese and Spanish) | No | No | ||||
| Readistep | 8, 9 | College and Career integrated assessments | No | No | ||||
| SAT | HS | Critical Reading, Math | No | No | ||||
|
District of Columbia |
No assessments found outside | - | - | Yes | ||||
| Federated States of Micronesia | No assessments found outside | - | - | Yes | ||||
| Guam | No assessments found outside | - | - | Yes | ||||
| Palau | No data reports found | - | - | Yes | ||||
| Puerto Rico | No assessments found outside | - | - | Yes | ||||
| Republic of Marshall Islands | No data reports found | - | - | Yes | ||||
|
U.S. Virgin Islands |
No assessments found outside | - | - | Yes | ||||
| Total Unique States (N=11) | 9 | 0 | 2 | |||||
| Total Regular and Unique States (N=61) | 40 | 1 | 20 | |||||
| Percent | 65% | 2% | 33% | |||||
Table B-6. Participation and Performance Data for English Language Learners (ELLs) with Disabilities, Alternate Assessments Based on Alternate Achievement Standards (AA-AAS) Used for Title I Accountability System, 2013-2014
| State | Test | Grade | Subject Areas | Disaggregated Data for ELLs with Disabilities For AA-AAS Used for Title I | ||||
|---|---|---|---|---|---|---|---|---|
| Partici-pation | Perform-ance | Summary | ||||||
| Partic. And Perf. For All Tests | No AA-AAS Used for Title I | No Publicly Reported Data Found | ||||||
| Regular States | ||||||||
| Alabama | Alabama Alternate Assessment (AAA) | 3-8, 11 | Reading, Math, Science (5,7) | Yes | Yes | Yes | ||
| Alaska | Alaska Alternate Assessment | 3-10 | Reading, Writing, Math (3-10) Science (4,8,10) | Yes | Yes | Yes | ||
| Arizona | Arizona Instrument to Measure Standards Alternate (AIMS-A) | 3-8, HS | Reading, Math, Science (4,8,HS) | No | No | X | ||
| Arkansas | Arkansas Alternate Portfolio | 3-11 | English Language Arts and Math (3-8,11), Science (5,7), Algebra I and Geometry (9), Biology (10) | No | No | X | ||
| California | California Alternate Performance Assessment (CAPA) | 2-11 | ELA (2-11), Math (2-11), Science (5,8,10), and these subjects in levels II to V. | Yes | Yes | Yes | ||
| Colorado | Colorado Alternate Assessment (CoAlt) | 3-10 | Reading, Math, Writing (3-10), Science (5, 8) | Yes | Yes | Yes | ||
| Connecticut | Skills Checklist | 3-8 | Access Skills, Math, Reading, Communication | Yes | Yes | Yes | ||
| Delaware | Delaware Comprehensive Assessment System (DCAS-Alt) | 3-10 | Reading, Math (3-10), Science (5,8,10), Social Studies (4,7,9) | Yes | Yes | Yes | ||
| Florida | Florida Alternate Assessment (FAA) | 3-11 | Reading, Math, Writing (4,8,10), Science (5,8,11) | No | No | X | ||
| Georgia | Georgia Alternate Assessment | 3-8, 11 | English/Language Arts, Math, Science, Social Studies | Yes | Yes | Yes | ||
| Hawaii | Alternate Assessment | 3-8,10 | Reading, Math, Science (4,8,10) | No | No | X | ||
| Idaho | Idaho Alternate Assessment (IAA) | 3-10 | English Language Arts (ELA) and Math (3-9), Science (5,7,10) | No | No | X | ||
| Illinois | Illinois Alternate Assessment (IAA) | 3-8,11 | Reading, Math, Science (4,7,11), Writing (11) | Yes | Yes | Yes | ||
| Indiana | Indiana Standards Tool for Alternate Reporting (ISTAR) | 3-8, 10 | English/Language Arts, Math, Science (4,6), Social Studies (5,7), Biology (10) | No | No | X | ||
| Iowa | Iowa Alternate Assessment (IAA) | 3-8,11 | Reading, Math | No | No | X | ||
| Iowa Alternate Assessment (IAA) Science | 5,8,11 | Science | No | No | ||||
| Kansas | Kansas Alternate Assessment (KAA) | 3-8, 11 | Reading, Math, Science (4,7, 11) | No | No | X | ||
| Kentucky | Alternate Kentucky Performance Rating for Educational Progress (K-PREP) | 3-12 | Reading (3-9), Math (3-8,10), Writing (4,5,6, 8,10,11), Science (4,7,11), Social Studies (5,8,12) | No | No | X | ||
| Louisiana | Louisiana Alternate Assessment 1 | 3-11 | English/Language arts, Math, Science | No | No | X | ||
| Maine | Maine Personalized Alternate Assessment Portfolio (MEPAAP) | 2-8, 10 & 11 | Reading, Math, Science (5,8), Writing (5,8) | No | No | X | ||
| Maryland | Alternate Maryland School Assessment (ALT-MSA) | 3-8,10 | Math, Reading, Science (5,8,10) | No | No | X | ||
| Massachusetts | Massachusetts Comprehensive Assessment System Alternate (MCAS-Alt) | 3-10 | English/Language Arts, Math, Science and Technology/ Engineering (5, 8-10) | No | No | X | ||
| Michigan | Michigan Access (MI-Access) Functional Independence | 3-8, 11 | Accessing Print, Math(3, 8, 11), Expressing Ideas (4, 7, 11), Science (5, 8, 11) | Yes | Yes | Yes | ||
| Michigan Access (MI-Access) Supported Independence | 3-8, 11 | English Language Arts, Math, Science (5, 8, 11) | Yes | Yes | ||||
| Michigan Access (MI-Access) Participation | 3-8, 11 | English Language Arts, Math, Science (5, 8, 11) | Yes | Yes | ||||
| Minnesota | Minnesota Test of Academic Skills III (MTAS III) | 3-8, HS | Reading and Math, Science (5, 8, HS) | Yes | Yes | Yes | ||
| Mississippi | Mississippi Alternate Assessment of the Extended Curriculum Frameworks | 3-8 | Language Arts, Math, Science (5,8) | No | No | X | ||
| Mississippi Alternate Assessment of the Extended Curricular Frameworks Secondary | HS | Language Arts, Math, Science | No | No | ||||
| Missouri | Missouri Assessment Program Alternate (MAP-A) | 3-8, 10, 11 | Communication Arts, (3 to 8, 11) Math (3 to 8, 10), Science (5, 8, 11) | No | No | X | ||
| Montana | Criterion Referenced Test (CRT) Alternate. No Reading or Math this year due to field testing. | 3-8, 10 | Science (4,8, 10) | Yes | Yes | Yes | ||
| Nebraska | Alternate Assessment | 3-8, 11 | Reading, Math, Science (5,8,11), Writing (8,11) | No | No | X | ||
| Nevada | Nevada Alternate Assessment (NAA) | 3-8, 11 | Reading, Math, Science (8), Writing (8) | Yes | Yes | Yes | ||
| New Hampshire | New Hampshire Alternate Learning Progression Assessment (NH ALPS) | 2-7, 10,11 | Reading, Math (2-7,10) Science (4,8,11), Writing (4,7,10) | Yes | Yes | Yes | ||
| New Jersey | Alternate Proficiency Assessment | 3-8, 11 | Language Arts Literacy, Math, Science (4, 8, EoC) | Yes | Yes | Yes | ||
| New Mexico | Alternative Performance Assessment (NMAPA) | 3-8, HS | Reading, Math | No | No | X | ||
| New York | New York State Alternate Assessment (NYSAA) | 3-8, HS | English Language Arts, Math, Science (4,8, HS), Social Studies (HS) | No | No | X | ||
| North Carolina | North Carolina Extend 1 (NCEXTEND1) | 3-8 | Reading, Math, Science (5,8) | No | No | X | ||
| North Carolina Extend 1 (NCEXTEND1) | 10 | Math I, Biology, English II | No | No | ||||
| North Dakota | North Dakota Alternate Assessment 1 (NDAA1) | 3-8, 11 | Reading/Language Arts, Math, Science | No | No | X | ||
| Ohio | Alternate Assessment for Students with Cognitive Disabilities (AASCD) | 3-8 | English/Language Arts, Math, Science (5,8) | Yes | Yes | Yes | ||
| Alternate Ohio Graduation Test (OGT-AASCD) | HS | English/Language Arts, Math, Science, Social Studies | Yes | Yes | ||||
| Oklahoma | Oklahoma Alternate Assessment Program (OAAP) | 3-8, EoI | Math, Reading, Science (5,8), Geography, Social Studies, Writing (5,8), Algebra I, English II/ Writing, Biology, US History (others if took Algebra II, Geometry, English III/ Writing) | No | No | X | ||
| Oregon | Oregon Assessment of Knowledge and Skills (OAKS) Extended | 3-8,11 | Reading, Math, Science (5,8,11), Writing (11) | No | No | X | ||
| Pennsylvania | Pennsylvania Alternate System of Assessment (PASA) | 3-8, 11 | Reading, Math, Science (4,8,11) | No | No | X | ||
| Rhode Island | Rhode Island Alternate Assessment (RIAA) | 3-8, 11 | Science (4,8,11), Transition year to NCSC for ELA, Writing and Math | No | No | X | ||
| xSouth Carolina | South Carolina Alternate (SC-ALT) | 3-8, 10 | English Language Arts, Math, Science, Social Studies (and HS Biology) | No | No | X | ||
| South Dakota | Dakota State Test of Educational Progress Alternate (DSTEP A). State is transitioning to NCSC, so no data for either DSTEP A or NCSC in Reading or Math. | 3-8,11 | Science (5,8,11) (other content areas not reported due to participation in NCSC field testing) | No | No | X | ||
| Tennessee | Alternate Assessment | 3-12 | Math, Reading /Language, Science | No | No | X | ||
| Texas | State of Texas Assessments of Academic Readiness Alternate (STAARALT) | 3-8 | Math, Reading, Writing (4,7), Science (5,8) Social Studies (8) | Yes | Yes | Yes | ||
| STAARALT End of Course (EoC) | EoC | English I, English II, Algebra I, Biology, US History | Yes | Yes | ||||
| Utah | Utah Alternate Assessment (UAA) | 3-11 | Language Arts, Math, and Science | No | No | X | ||
| Vermont | Alternate Assessment | 3-8,11 | Math, Reading, Science (4,8,11) | No | No | X | ||
| Virginia | Virginia Alternate Assessment Portfolio (VAAP) | 3-8 | Reading, Math, History/Social Science, Science | Yes | Yes | Yes | ||
| Virginia Alternate Assessment Portfolio End of Course (VAAP EoC) | EoC | Reading, Math, History/Social Science, Science | Yes | Yes | ||||
| Washington | Washington Alternate Assessment System (WAAS Portfolio) | 3-8, 10 | Reading, Math, Writing (4, 7, 10), Science (5, 8, 10) | No | No | X | ||
| West Virginia | Alternate Performance Task Assessment (APTA) | 3-8, 10 | Math, Reading/Language Arts (3-8, 11), Science (4,6, 10) | No | No | X | ||
| Wisconsin | Wisconsin Alternate Assessment (WAA) | 3-8, 10 | Reading, Math, Language Arts (4,8,10), Science (4,8,10), Social Studies (4,8,10) | Yes | Yes | Yes | ||
| Wyoming | Proficiency Assessments for Wyoming Students Alternate (PAWS-ALT) | 3-8,11 | Reading, Math, Science (4,8, 11) | No | No | X | ||
| Total Regular States (N=50) | 18 | 0 | 32 | |||||
| Unique States | ||||||||
|
American Samoa |
Alternate Assessment | No information found | No | No | X | |||
|
Bureau of Indian Education |
Merged with regular | Elem to HS | By state: Langauge Arts, Reading, Math, Science | No | No | X | ||
|
Commonwealth of Northern Marianna Islands |
Alternate Assessment | 3-8 | Reading, Math | No | No | X | ||
| Alternate End of Course | EoC | Reading, Math | No | No | ||||
| U.S.Department of Defense Education Activity | DoDEA Alternate Assessment. This assessment is not used for Title I purposes, but is listed in this table for convenience. | K to 12 | The Alternate Assessment is comprised of evidence of the student’s achievement, including but not limited to student work products, interviews, photographs, videos, etc. | No | No | X | ||
| District of Columbia | DC CAS-Alt | 3 to 8, 10 | Math, Reading (3 to 8, 10) | No | No | X | ||
| Federated States of Micronesia | Alternate Assessment on Alternate Achievement Standards | 6, 8, 10 | Reading, Math, Science (8) | No | No | X | ||
| Guam | Alternate Assessment | 1-12 | Reading, Math, Science. Only Reported Reading and Math. | No | No | X | ||
| Palau | No data reports found | No information found | No | No | X | |||
| Puerto Rico | Puerto Rican Alternate Assessment | 3-8, 11 | Spanish, English, Math, Science (4,8,11) | No | No | X | ||
| Republic of Marshall Islands | No data reports found | No information found | No | No | X | |||
| U.S. Virgin Islands | Alternate Assessment | 3-8, 11 | Reading, Math, Science (5, 8, 11) | No | No | X | ||
| Total Unique States (N=11) | 0 | 1 | 10 | |||||
| Total Regular and Unique States (N=61) | 18 | 0 | 42 | |||||
| Percent | 30% | 2% | 69% | |||||
Table B-7. Participation and Performance Data for Students with Disabilities and ELLs with Disabilities, Genral and Alternate Assessments Based on Modified Achievement Standards (AA-MAS) Used for Title I Accountability, 2013-2014
| State | Test | Grade | Subject Areas | Disaggregated Data for AA-MAS | |||||
|---|---|---|---|---|---|---|---|---|---|
| Students with Disabilities Summary | ELLs with Disabilities Summary | ||||||||
| Participation & Performance | Perform. Only | No Data Found | Participation & Performance | Part. and Perform. for Some Tests | No Data Found | ||||
| Regular States | |||||||||
| California | California Modified Assessment (CMA) | 3-11 | Science (5,8, and 10 Life Science) | Yes | Yes | ||||
| Connecticut | Modified assessment | 3-8 | Math, Reading, Science | Yes | X | ||||
| Georgia | Criterion-Referenced Competency Test-Modified | 3-8 | Reading, English/Language Arts, Math | Yes | Yes | ||||
| Indiana | Indiana Modified Achievement Standards Test (IMAST) | 3-8 | ELA, Math, Science (4,6), Social Studies (5,7) | X (not state level) | X | ||||
| Louisiana | Louisiana Alternate Assessment 2 | 4-8, 10-11 | English/Language arts, Math, Science, Social Studies | Yes | X | ||||
| Minnesota | Modified Assessment III | 5-8, 10-11 | Math (5-8, 11), Reading (5-8, 10) | Yes | Yes | ||||
| North Carolina | North Carolina Extend 2 (NCEXTEND2) | 3-8 | Reading, Math, Science (5,8) | Yes | X | ||||
| North Carolina Extend 2 (NCEXTEND2) | EoC | Math I, Biology, English II | |||||||
| North Dakota | North Dakota Alternate Assessment 2 (NDAA2) | 3-8, 11 | Reading/Language Arts, Math, Science (4,8, 11) | Yes | X | ||||
| Oklahoma | OMAAP End of Instruction (Only for repeat testers with a previous OMAAP score in the same subject End-of-Instruction (EOI) Exam.) | EoI | Algebra I, English II (Writing included), Biology I, US History | Yes | X | ||||
| Texas | State of Texas Assessments of Academic Readiness Modified (STAAR M) | 3-8 | Math, Reading, Writing (4,7), Science (5,8) Social Studies (8) | Yes | Yes | ||||
| STAAR M EoC | EoC | Reading, Writing, Math, Science, Social Studies | |||||||
| Virginia | Virginia Modified Achievement Standards Test (VMAST) | 3-8, EoC | Math, Reading (3-8), Algebra I and Reading EoC | Yes | X | ||||
| Total Regular States with MAS (N=11) | 10 | 0 | 1 | 4 | 0 | 7 | |||
| Percent | 91% | 0% | 9% | 36% | 0% | 64% | |||
Table B-8. Participation and Performance Data for Students with Disabilities and ELLs with Disabilities, Alternate Assessments Based on Grade Level Achievement Standards (AA-GLAS) Used for Title I Accountability, 2013-2014
| State | Test | Grade | Subject Areas | Disaggregated Data for AA-GLAS | |||
|---|---|---|---|---|---|---|---|
| Students with Disabilities | ELLs with Disabilities | ||||||
| Partici-pation | Perform-ance | Partici-pation | Perform-ance | ||||
| Regular States | |||||||
| Virginia | Virginia Grade Level Alternate Assessment (VGLAA) and EoC. | 3-8, EoC | Reading, History/Social Science(3, EoC), Science (3,5,8, EoC) Writing (5,8, EoC) | Yes | Yes | Yes | Yes |
| Total Regular States with GLAS (N=1) | 1 | 1 | 1 | 1 | |||
| Percent | 100% | 100% | 100% | 100% | |||
Table B-9. How Participation was Reported in States for the General Assessments, 2013-2014
(Note: There is an asterisk after the state name if the state did not report data by grade and test.1)
| State | Participation Data Reported On General Assessments | |||||||
|---|---|---|---|---|---|---|---|---|
| Number Enrolled/ Eligible to be Tested | Number of Students Tested | Number of Students Not Tested | Percent Participating in Test | Percent of Students not Tested | Number of Students with Scores | Number of Students with No scores | Percent of Students with No Scores | |
| Regular States | ||||||||
| Alabama | - | X | X | X2 | - | - | - | - |
| Alaska | X | - | - | X | - | - | - | - |
| Arizona | - | - | - | X* | - | - | - | - |
| Arkansas | - | - | - | - | - | - | - | - |
| California | - | X | - | - | - | X | - | - |
| Colorado | - | X | - | - | - | - | X | X |
| Connecticut | - | X | - | - | - | - | - | - |
| Delaware | X | X | X | X | - | - | X | - |
| Florida | X* | X | - | X3 | - | - | - | - |
| Georgia | - | X | - | - | - | - | - | - |
| Hawaii | - | - | - | X* | - | - | - | - |
| Idaho | - | X | - | X | - | - | - | - |
| Illinois | X* | X | - | - | X | - | - | - |
| Indiana | - | X | - | - | - | - | - | - |
| Iowa | X | X | - | X4 | - | - | - | - |
| Kansas5 | - | - | - | - | - | - | - | - |
| Kentucky | X | X | - | X | - | - | - | - |
| Louisiana | - | - | - | - | - | - | - | - |
| Maine | X | X | - | X | X* | - | - | - |
| Maryland | - | X* | - | X* | - | - | - | - |
| Massachusetts | - | - | - | X6 | X* | - | - | - |
| Michigan | - | X | - | - | - | - | - | |
| Minnesota | X* | X | - | X* | - | X | - | - |
| Mississippi | - | - | - | - | - | - | - | - |
| Missouri | X* | X* | - | - | - | X* | X* | X* |
| Montana | - | - | - | - | X | - | - | - |
| Nebraska | - | X | X | X7 | X | - | - | - |
| Nevada | X | X | - | - | - | - | - | - |
| New Hampshire | X | X | X | X8 | - | - | X | - |
| New Jersey | X | - | X | - | - | X | X | - |
| New Mexico | - | X* | - | - | - | - | - | - |
| New York | X | X | - | X*9 | - | - | - | - |
| North Carolina | X* | X | X* | X10 | X* | - | X* | X* |
| North Dakota | X* | X | - | X* | X* | X* | X* | X* |
| Ohio | X* | X* | X* | X* | X* | - | - | - |
| Oklahoma | - | - | - | - | - | - | - | - |
| Oregon | - | X | - | X | - | - | - | - |
| Pennsylvania | X* | X* | - | X* | - | - | - | - |
| Rhode Island | X | X | X | X*11 | - | - | X | - |
| South Carolina | - | X | - | X* | - | - | - | - |
| South Dakota | - | X | - | - | X* | - | - | - |
| Tennessee | - | - | - | - | - | X* | - | - |
| Texas | - | X | - | - | - | - | - | - |
| Utah | - | - | - | - | - | - | - | - |
| Vermont | - | X | - | - | - | - | - | - |
| Virginia | - | X | - | X | - | - | X | - |
| Washington | X | - | X* | - | X* | - | X | X |
| West Virginia | - | - | - | X* | - | - | - | - |
| Wisconsin | - | - | - | X* | - | - | X | X |
| Wyoming | - | X | - | X* | - | - | - | - |
| Total Regular States (N=50) | 19 | 34 | 9 | 27 | 10 | 6 | 11 | 6 |
| Unique States | ||||||||
| American Samoa | - | - | - | - | - | - | - | - |
| Bureau of Indian Education | - | - | - | - | - | - | - | - |
| Commonwealth of Northern Marianna Islands | - | - | - | - | - | - | - | - |
| U.S. Department of Defense Education Activity | - | - | - | - | - | - | - | - |
| District ofColumbia | X* | X* | - | X* | - | - | - | - |
| Federated States of Micronesia | - | - | - | - | - | - | - | - |
| Guam | X | X | - | X* | - | - | - | - |
| Palau | - | - | - | - | - | - | - | - |
| Puerto Rico | - | - | - | - | - | - | - | - |
| Republic of Marshall Islands | - | - | - | - | - | - | - | - |
| U.S. Virgin Islands | X | X | - | X | - | - | - | - |
| Total Unique States (N=11) | 3 | 3 | 0 | 3 | 0 | 0 | 0 | 0 |
| Total All Regular and Unique States (N=61) | 22 | 37 | 9 | 30 | 10 | 6 | 11 | 6 |
1 Other methods (besides by grade and test) = merging grades and merging tests, by grade and merging tests, by test and merging grades
2 Alabama reported participation rate by grade, but denominator was unclear (e.g., 9.17%)
3 Florida reported participation rate by grade but by accommodated status.
4 Iowa reported participation rate by grade, but by accommodated status.
5 Kansas reported no data this year due to cyber attack.
6 Massachusetts reported participation rate by grade, but by accommodated status and percent not tested.
7 Nebraska reported participation rate by grade, but denominator is based on all students enrolled in grade.
8 New Hampshire reported participation data by grade, but as percentage of all students enrolled in grade.
9 New York reported percent participating as percent of of enrolled with valid scores.
10 North Carolina reported percent participating as percent of all students tested in grade (e.g., 10%)
11 Rhode Island reported participation data by grade, but as percentage of all students enrolled in grade.
Table B-10. How Participation was Reported in States for the Alternate Assessments based on Alternate Achievement Standards, 2013-2014
(Note: There is an asterisk after the state name if the state did not report data by grade and test.1)
| State | Participation Data Reported On AA-AAS | ||||||||
|---|---|---|---|---|---|---|---|---|---|
|
Number Enrolled/Eligible to be Tested |
Number of Students Tested | Number of Students Not Tested | Percent Participating in Test | Percent of Students Not Tested | Number of Students with Scores | Number of Students with No scores | Percent of Students with No Scores | ||
| Regular States | |||||||||
| Alabama | - | - | - | X | - | - | - | - | |
| Alaska | X | - | - | X | - | - | - | - | |
| Arizona | - | - | - | X* | - | - | - | - | |
| Arkansas | - | - | - | - | - | - | - | - | |
| California | - | X | - | - | - | X | - | - | |
| Colorado | - | X | - | - | - | X | X | - | |
| Connecticut | - | X | - | X | - | - | - | - | |
| Delaware | X | X | X | X | - | - | X | - | |
| Florida | X* | X | - | X | - | - | X | - | |
| Georgia | - | X | - | - | - | - | - | - | |
| Hawaii | - | - | - | X* | - | - | - | - | |
| Idaho | - | - | - | X* | - | - | - | - | |
| Illinois | X* | X* | - | - | X* | - | - | - | |
| Indiana | - | - | - | - | - | - | - | - | |
| Iowa | X | X | - | X* | - | - | - | - | |
| Kansas2 | - | - | - | - | - | - | - | - | |
| Kentucky | X | X | - | X | - | - | - | - | |
| Louisiana | - | X | - | - | - | - | - | - | |
| Maine | - | X | - | X* | - | - | - | - | |
| Maryland | - | X* | - | X* | - | - | - | - | |
| Massachusetts | - | X | - | X | X* | - | - | X | |
| Michigan | - | X | - | - | - | - | - | - | |
| Minnesota | X* | X | - | X* | - | X* | - | - | |
| Mississippi | - | X | - | - | - | - | - | - | |
| Missouri | X* | X* | - | - | - | X* | X* | X* | |
| Montana | - | - | - | - | X | - | - | - | |
| Nebraska | - | X | X | X | X | - | - | - | |
| Nevada | X | X | - | - | - | - | - | - | |
| New Hampshire | X | X | X | X | - | - | X | - | |
| New Jersey | X | - | X | - | - | X | X | - | |
| New Mexico | - | X* | - | - | - | - | - | - | |
| New York | X* | X | - | X*3 | - | - | - | - | |
| North Carolina | X* | X | X* | X* | X* | - | X* | X* | |
| North Dakota | X* | X | - | X* | X* | X* | X* | X* | |
| Ohio | X* | X* | X* | X* | X* | - | - | - | |
| Oklahoma | - | - | - | - | - | - | - | - | |
| Oregon | - | X | - | X | - | - | - | - | |
| Pennsylvania | X* | X* | - | X* | - | - | - | - | |
| Rhode Island | - | X | - | X* | - | - | - | - | |
| South Carolina | - | - | - | X* | - | - | - | - | |
| South Dakota | - | X* | - | - | X* | - | - | - | |
| Tennessee | - | - | - | - | - | X* | - | - | |
| Texas | X | X | X | X | X* | - | - | - | |
| Utah | - | - | - | - | - | - | - | - | |
| Vermont | - | - | - | - | - | - | - | - | |
| Virginia | - | X | - | X | - | - | X | - | |
| Washington | X | - | X* | - | X* | - | X | X | |
| West Virginia | - | - | - | X* | - | - | - | - | |
| Wisconsin | - | - | - | - | - | - | X | X | |
| Wyoming | - | X | - | X | - | - | - | - | |
| Total Regular States (N=50) | 18 | 32 | 8 | 28 | 10 | 7 | 11 | 6 | |
| Unique States | |||||||||
| American Samoa | - | - | - | - | - | - | - | - | |
| Bureau of Indian Education | - | - | - | - | - | - | - | - | |
| Commonwealth of Northern Marianna Islands | - | X | - | - | - | - | - | - | |
| U.S. Department of Defense Education Activity | - | - | - | - | - | - | - | - | |
| District of Columbia | X* | X* | - | X* | - | - | - | - | |
| Federated States of Micronesia | - | - | - | - | - | - | - | - | |
| Guam | X | X | - | X | - | X | - | - | |
| Palau | - | - | - | - | - | - | - | - | |
| Puerto Rico | - | - | - | - | - | - | - | - | |
| Republic of Marshall Islands | - | - | - | - | - | - | - | - | |
| U.S. Virgin Islands | X | X | - | X | - | - | - | - | |
| Total Unique States (N=11) | 3 | 4 | 0 | 3 | 0 | 1 | 0 | 0 | |
| Total All Regular and Unique States (N=61) | 21 | 36 | 8 | 31 | 10 | 8 | 11 | 6 | |
1 Other methods (besides by grade and test) = merging grades and merging tests, by grade and merging tests, by test and merging grades
2 Kansas reported no data this year due to cyber attack.
3 New York reportedPercent of Enrolled with Valid Scores, not by grade and test
Table B-11. State Abbreviation Key
| State Abbreviation | State’s Full Name | State Abbreviation | State’s Full Name | |
|---|---|---|---|---|
| AL | Alabama | NV | Nevada | |
| AK | Alaska | NH | New Hampshire | |
| AR | Arkansas | NJ | New Jersey | |
| AZ | Arizona | NM | New Mexico | |
| CA | California | NY | New York | |
| CO | Colorado | ND | North Dakota | |
| CT | Connecticut | OH | Ohio | |
| DE | Delaware | OK | Oklahoma | |
| FL | Florida | OR | Oregon | |
| GA | Georgia | PA | Pennsylvania | |
| HI | Hawaii | RI | Rhode Island | |
| ID | Idaho | SC | South Carolina | |
| IL | Illinois | SD | South Dakota | |
| IA | Iowa | TN | Tennessee | |
| KS | Kansas | TX | Texas | |
| KY | Kentucky | UT | Utah | |
| LA | Louisiana | VT | Vermont | |
| ME | Maine | VA | Virginia | |
| MD | Maryland | WA | Washington | |
| MA | Massachusetts | WV | West Virginia | |
| MI | Michigan | WI | Wisconsin | |
| MN | Minnesota | WY | Wyoming | |
| MS | Mississippi | |||
| MO | Missouri |
Table B-12. How Performance was Reported in States for the General Assessments, 2013-2014
(Note: There is an asterisk after the state name if the state did not report data by grade and test.1)
| State | Performance Data Reported for General Assessments | |||||||
|---|---|---|---|---|---|---|---|---|
| Percent Proficient | Percent Proficient Derived | Percent Not Proficient | Number Proficient | Number Not Proficient | Number by Achievement Level | Percent by Achievement Level | Other (e.g., Percentile) | |
| Regular States | ||||||||
| Alabama | X | - | - | - | - | X | X | - |
| Alaska | X | - | X | X | X | - | - | - |
| Arizona | X | - | - | - | - | - | X | X |
| Arkansas | - | - | - | - | - | - | - | - |
| California | - | X | - | - | - | - | X | - |
| Colorado | X | - | - | X | - | X | X | X |
| Connecticut | - | X | - | - | - | - | X | - |
| Delaware | X | - | - | - | - | - | - | X |
| Florida | - | X | - | - | - | - | - | - |
| Georgia | - | X | - | - | - | - | X | - |
| Hawaii | X* | - | - | - | - | - | X* | - |
| Idaho | - | X* | - | - | - | - | X* | X |
| Illinois | X | - | - | - | - | - | X | - |
| Indiana | X | - | - | X | - | - | - | - |
| Iowa | X | - | - | - | - | - | X* | - |
| Kansas2 | - | - | - | - | - | - | - | - |
| Kentucky | X | - | - | - | - | - | X | - |
| Louisiana | - | - | - | - | - | - | - | - |
| Maine | X* | - | - | - | X | X* | X | |
| Maryland | X* | - | - | X* | - | - | - | - |
| Massachusetts | X | - | - | - | - | - | X | - |
| Michigan | X | - | - | - | - | - | X | X |
| Minnesota | X | - | - | X | - | - | - | - |
| Mississippi | - | - | - | - | - | - | - | - |
| Missouri | X | - | X* | X* | X* | X* | X* | X |
| Montana | X | - | - | - | - | - | X | - |
| Nebraska | X | - | X | - | - | - | - | X |
| Nevada | X | - | - | - | - | - | X | X |
| New Hampshire | - | X | - | - | - | X | X | X |
| New Jersey | - | X | X | - | - | X | X | X |
| New Mexico | X* | - | - | - | - | - | X* | - |
| New York | X | - | - | - | - | X | X | X |
| North Carolina | X | - | - | X* | - | - | X | X |
| North Dakota | X* | - | X* | - | - | - | - | - |
| Ohio | X | - | - | - | - | X | X | - |
| Oklahoma | - | - | - | - | - | - | - | - |
| Oregon | X | - | - | X | - | X | X | - |
| Pennsylvania | X | - | - | - | - | - | X* | X |
| Rhode Island | X | - | - | - | - | X | X | X |
| South Carolina | X | - | - | - | - | - | X | X |
| South Dakota | - | X* | - | - | - | - | X* | - |
| Tennessee | X* | - | - | - | - | - | X* | - |
| Texas | - | X | X | - | X | X | X | X |
| Utah | - | - | - | - | - | - | - | - |
| Vermont | - | X | - | - | - | - | X | - |
| Virginia | X | - | X | - | - | X | X | - |
| Washington | X | - | X | X | X | X | X | - |
| West Virginia | X* | - | - | - | - | - | - | - |
| Wisconsin | - | X | - | - | - | X | X | - |
| Wyoming | X | - | - | - | - | - | X | - |
| Total Regular States (N=50) | 33 | 11 | 8 | 9 | 4 | 14 | 35 | 17 |
| Unique States | ||||||||
| American Samoa | - | - | - | - | - | - | - | - |
| Bureau of Indian Education | - | - | - | - | - | - | - | - |
| Commonwealth of Northern Marianna Islands | - | - | - | - | - | - | - | X |
| U.S. Department of Defense Education Activity | - | - | - | - | - | - | - | - |
| District of Columbia | X* | - | - | X* | - | X* | X* | - |
| Federated States of Micronesia | - | - | - | - | - | - | - | - |
| Guam | X | - | X | - | - | - | - | - |
| Palau | - | - | - | - | - | - | - | - |
| Puerto Rico | - | - | - | - | - | - | - | - |
| Republic of Marshall Islands | - | - | - | - | - | - | - | - |
| U.S. Virgin Islands | X | - | - | X | - | X | X | - |
| Total Unique States (N=11) | 3 | 0 | 1 | 2 | 0 | 2 | 2 | 1 |
| Total All Regular and Unique States (N=61) checked in tab import for figs and all matched | 36 | 11 | 9 | 11 | 5 | 16 | 37 | 18 |
1 Other methods (besides by grade and test) = merging grades and merging tests, by grade and merging tests, by test and merging grades
2 Kansas reported no data this year due to cyber attack.
Table B-13. How Performance was Reported in States for the Alternate Assessments Based on Alternate Achievement Standards Used for Title I Accountability, 2013-2014
(Note: There is an asterisk after the state name if the state did not report data by grade and test.1)
| State | Performance Data Reported for AA-AAS | ||||||
|---|---|---|---|---|---|---|---|
| Percent Proficient | Percent Proficient Derived | Percent Not Proficient | Number Proficient | Number Not Proficient | Number by Achievement Level | Percent by Achievement Level | |
| Regular States | |||||||
| Alabama | - | X | - | - | - | X | - |
| Alaska | X | - | X | X | X | - | - |
| Arizona | X | - | - | - | - | - | X |
| Arkansas | - | - | - | - | - | - | - |
| California | - | X | - | - | - | - | X |
| Colorado | X | - | - | - | X | X | |
| Connecticut | - | X | - | - | - | - | X |
| Delaware | X | - | - | - | - | - | - |
| Florida | X | - | - | X | - | X | X |
| Georgia | - | X | - | - | - | - | X |
| Hawaii | X* | - | - | - | - | - | X* |
| Idaho | - | X* | - | - | - | - | X |
| Illinois | X | - | - | - | - | - | X |
| Indiana | - | X | - | - | - | X | X |
| Iowa | X | - | - | - | - | - | X* |
| Kansas2 | - | - | - | - | - | - | - |
| Kentucky | X | - | - | - | - | - | X |
| Louisiana | - | X | - | - | - | X | X |
| Maine | - | X* | - | - | - | X | X* |
| Maryland | X | - | - | X* | - | X | X |
| Massachusetts | - | X | - | - | - | X | X |
| Michigan | X | - | - | - | - | - | X |
| Minnesota | X | - | - | X | - | - | - |
| Mississippi | - | X | - | - | - | X | X |
| Missouri | X | - | X* | X* | X* | X* | X* |
| Montana | X | - | - | - | - | - | X |
| Nebraska | X | - | X | - | - | - | - |
| Nevada | X | - | - | - | - | - | X |
| New Hampshire | - | X | - | - | - | X | X |
| New Jersey | - | X | X | - | - | - | X |
| New Mexico | X* | - | - | - | - | - | X* |
| New York | X | - | - | - | - | X | - |
| North Carolina | X | - | - | X* | - | - | X |
| North Dakota | X* | - | X* | - | - | - | X* |
| Ohio | X | - | - | - | - | X | X |
| Oklahoma | - | - | - | - | - | - | - |
| Oregon | X | - | - | X | - | X | X |
| Pennsylvania | X | - | - | - | - | - | X* |
| Rhode Island | X* | - | - | - | - | - | - |
| South Carolina | X* | - | - | - | - | - | - |
| South Dakota | - | X* | - | - | - | - | X* |
| Tennessee | X* | - | - | - | - | - | X* |
| Texas | - | X | X | - | X | X | X |
| Utah | - | - | - | - | - | - | - |
| Vermont | - | - | - | - | - | - | - |
| Virginia | X | - | X | - | - | X | X |
| Washington | X | - | X | X | X | X | X |
| West Virginia | X* | - | - | - | - | - | - |
| Wisconsin | - | X | - | - | - | X | X |
| Wyoming | X | - | - | - | - | - | X |
| Total Regular States (N=50) | 29 | 16 | 8 | 8 | 4 | 18 | 36 |
| Unique States | |||||||
| American Samoa | - | - | - | - | - | - | - |
| Bureau of Indian Education | - | - | - | - | - | - | - |
| Commonwealth of Northern Marianna Islands | - | - | - | - | - | X | - |
| U.S. Department of Defense Education Activity | - | - | - | - | - | - | - |
| District of Columbia | X* | - | - | X* | - | X* | X* |
| Federated States of Micronesia | - | - | - | - | - | - | - |
| Guam | - | - | - | - | - | X | - |
| Palau | - | - | - | - | - | - | - |
| Puerto Rico | - | - | - | - | - | - | - |
| Republic of Marshall Islands | - | - | - | - | - | - | - |
| U.S. Virgin Islands | X | - | - | X | - | X | X |
| Total Unique States (N=11) | 2 | 0 | 0 | 2 | 0 | 4 | 2 |
| Total All Regular and Unique States (N=61) | 31 | 16 | 8 | 10 | 4 | 22 | 38 |
1 Other methods (besides by grade and test) = merging grades and merging tests, by grade and merging tests, by test and merging grades.
2 Kansas reported no data this year due to cyber attack.
Table B-14. Accommodations Data Reported for Students with Disabilities on General Assessments 2013-2014
| Regular States | Reported Participation | Reported Performance |
Participation and Performance Reported |
Participation Only Reported |
Performance Only Reported |
No Publicly Reported Data Found |
|---|---|---|---|---|---|---|
| Alabama | Yes | Yes | X | |||
| Alaska | Yes | Yes | X | |||
| Arkansas | No | No | X | |||
| Arizona | No | Yes | X | |||
| California | Yes | No | X | |||
| Colorado | Yes | Yes | X | |||
| Connecticut | Yes | No | X | |||
| Delaware | No | No | X | |||
| Florida | Yes | Yes | X | |||
| Georgia | No | No | X | |||
| Hawaii | No | No | X | |||
| Iowa | Yes | Yes | X | |||
| Idaho | No | No | X | |||
| Illinois | No | No | X | |||
| Indiana | Yes | Yes | X | |||
| Kansas1 | No | No | X | |||
| Kentucky | Yes | Yes | X | |||
| Louisiana | No | No | X | |||
| Massachusetts | Yes | No | X | |||
| Maryland | Yes | No | X | |||
| Maine | No | No | X | |||
| Michigan | Yes | Yes | X | |||
| Minnesota | No | No | X | |||
| Missouri | No | Yes | X | |||
| Mississippi | No | No | X | |||
| Montana | No | No | X | |||
| North Carolina | Yes | Yes | X | |||
| North Dakota | Yes | No | X | |||
| Nebraska | Yes | No | X | |||
| New Hampshire | Yes | No | X | |||
| New Jersey | Yes | Yes | X | |||
| New Mexico | Yes | No | X | |||
| Nevada | Yes | Yes | X | |||
| New York | No | No | X | |||
| Ohio | Yes | Yes | X | |||
| Oklahoma | Yes | Yes | X | |||
| Oregon | Yes | Yes | X | |||
| Pennsylvania | Yes | No | X | |||
| Rhode Island | Yes | No | X | |||
| South Carolina | No | No | X | |||
| South Dakota | No | No | X | |||
| Tennessee | No | No | X | |||
| Texas | Yes | Yes | X | |||
| Utah | No | No | X | |||
| Virginia | No | No | X | |||
| Vermont | No | No | X | |||
| Washington | Yes | Yes | X | |||
| Wisconsin | No | No | X | |||
| West Virginia | No | No | X | |||
| Wyoming | Yes | Yes | X | |||
| Unique States | ||||||
| American Samoa | No | No | X | |||
| Bureau of Indian Affairs | No | No | X | |||
| Commonwealth of Northern Mariana Islands | No | No | X | |||
| District of Columbia | No | No | X | |||
|
U.S. Department of Defense Education Activity |
No | No | X | |||
| Federated States of Micronesia | No | No | X | |||
| Guam | Yes | Yes | X | |||
| Palau | No | No | X | |||
| Puerto Rico | No | No | X | |||
| Republic of Marshall Islands | No | No | X | |||
| U.S. Virgin Islands | Yes | Yes | X | |||
| Total States | 29 | 21 | 19 | 10 | 2 | 30 |
1 Kansas reported no data this year due to cyber attack.
