Studying Less Accurately Measured StudentsMoen, R. E., Liu, K. K., Thurlow, M. L., Lekwa, A. J., Scullin, S. B., & Hausmann, K. E. October 2010 All rights reserved. Any or all portions of this document may be reproduced and distributed without prior permission, provided the source is cited as: Moen, R. E., Liu, K. K., Thurlow, M. L., Lekwa, A. J., Scullin, S. B., & Hausmann, K. E. (2010). Studying less accurately measured students. Minneapolis, MN: University of Minnesota, Partnership for Accessible Reading Assessment. Table of Contents
IntroductionOne reason people assess student achievement is because they believe it will improve student learning. For example, a theory of action presented in a report by the National Research Council (1999) described how assessment used in conjunction with standards and accountability might lead to higher levels of learning. This was a general model that presumably would be applicable to all students. A related theory of action model considers the effects that assessment, standards, and accountability might have on learning for one particular group of students, that is students who have been identified as having disabilities. This model was described in a report by the National Center on Educational Outcomes (NCEO; Quenemoen, Lehr, Thurlow, & Massanari, 2001). That report described how input and linking factors such as setting standards, developing and administering assessments, and training staff might need to be adjusted when assessing students with disabilities. Quenemoen et al. (2001) also described how outcomes might be different for students with disabilities than for other students. Such outcomes include both intended positive consequences and potential negative consequences. One example of intended positive consequences for students with disabilities is that including these students in standards-based assessment and accountability systems would likely increase the access that these students have to the general curriculum and thus increase their opportunity to learn the same material as other students. These access benefits seem to be prerequisite outcomes if the goals of improving learning that we hold for other students are to apply equally to students with disabilities. Examples of possible negative consequences for students with disabilities are that if standards, assessments, or accountability practices are poorly executed, there could be increased criticism of students with disabilities or their teachers, and increased rates of retention, absenteeism, and dropout for these students. A challenge in the development and implementation of assessments for students with disabilities is finding ways to maximize positive consequences while minimizing negative consequences. One place this balancing act can be seen is in the work of a federally funded set of efforts collectively referred to as the National Accessible Reading Assessment Projects (NARAP). NARAP is made up of several projects that started work in late 2004 to conduct research to make large-scale assessments of reading proficiency more accessible for students who have disabilities that affect reading. The concern underlying research on accessible reading assessment is similar to that underlying most research on testing accommodations and principles of universal design for assessment. Some students, particularly students with disabilities, have characteristics that prevent typical tests from giving a clear picture of their skills; researchers seek assessment practices that give a clearer picture of these students’ skills. Regardless of how difficult it may be in practice to implement accommodations and universal design principles, conceptually most research in this area is pretty straight forward. The general paradigm is to improve assessment validity by reducing construct irrelevant variance. Studies typically compare test scores obtained when some proposed assessment practice is implemented with scores obtained when the practice is not implemented. The clearest evidence that an assessment practice improves validity for students with disabilities is a statistically significant difference in test scores between the two conditions for students with disabilities but no significant difference for other students. Much research following this paradigm has been reviewed by researchers at NCEO through a series of reports on trends in study methods and results over time (Cormier, Altman, Shyyan, & Thurlow, 2010;Johnstone, Altman, Thurlow, & Thompson, 2006; Thompson, Blount, & Thurlow, 2002; Zenisky & Sireci, 2007). The accessible reading assessment projects have attempted to build on and go beyond previous accommodations and universal design research. Some of the project research adheres closely to the typical paradigm. It involves working with sources of variance that are clearly construct irrelevant that have not yet been adequately addressed. For that work, the main challenges tend to be with practical issues of identifying new sources of construct irrelevant variance and finding new ways to reduce such variance. Some of the other research that project teams have worked on adds conceptual complications on top of the practical ones. This research puts a twist on the typical paradigm of reducing construct irrelevant variance by taking a closer look at the construct itself. It asks questions about whether the current definition of the construct and the ways it is commonly understood or operationalized need to be adjusted. The Standards for Educational and Psychological Testing (AERA, APA, & NCME, 1999) indicates that examining a construct in this way can be a legitimate line of inquiry, although it gives little guidance on how this is to be done. In the introduction to a NARAP report that summarizes principles of accessible reading assessment (Thurlow et al., 2009), the authors state that “it is possible that assessments that lead to better interpretations about the reading proficiencies of some students with disabilities are ones that have been changed in ways that are relevant to the construct of reading as it is typically understood” (p 1). An example of NARAP research that has been conducted along these lines addresses a distinction commonly made in reading research between decoding and comprehending. Decoding typically involves visually processing printed text at the level of letters and words. Comprehending involves extracting the meaning of sets of words from short phrases to massive tomes. Most reading assessments combine decoding and comprehension. Such tests would not let students who cannot decode well show whether they can comprehend well. An obvious example of when this might be an inappropriate obstacle is that of students who are blind. Clearly, these students could not, on a test that requires visual decoding, show what higher order reading comprehension skills they have developed. Pressing a bit further, consider whether students who struggle with decoding for reasons other than blindness, such as students who are described as having dyslexia, might also be inappropriately handicapped by assessments whose decoding requirements prevent the students from showing what they have learned about reading comprehension. This brings us to the issue of balancing potential positive and negative consequences of various assessment practices. Developing reading assessments that remove decoding as an obstacle to showing what else students have learned about reading could affect instruction and learning in multiple ways. A desirable outcome might be to free students who struggle with decoding from being trapped in “drill and kill” efforts to improve their decoding skills at the expense of time spent developing higher order reading comprehension skills. An undesirable outcome would be the risk that numbers of students might slide through with inadequate effort put into developing the word level fluency that is foundational to good reading comprehension for most people. Concern for this tension between potential positive and negative consequences is reflected in the NARAP report cited above about principles of accessible reading assessment (Thurlow et al., 2009). The statement in the Principles document about possibly changing assessments in ways that may be related to the construct is followed shortly by a statement that cautions against loosening assessments in ways that undermine their ability to reveal when students truly cannot do what is required:
This same concern for balancing potential positive and negative consequences is central to the study reported here. One of our goals was to find ways of increasing test scores for a select group of students without increasing them for other students. Our study differed from most others in the procedures we used to identify which students’ scores should increase. We defined our target population as students who are less accurately assessed than other students. We were not interested in increasing test scores for all students who have disabilities. Students with disabilities are in the same boat as students without disabilities. Tests should distinguish students who have benefited from reading instruction from students who have not. Getting rid of an obstacle to seeing a student’s skills should not increase test scores unless the student has skills that were being obscured. Presumably, some students with disabilities lack the skill that is being tested just as some students without disabilities lack it. A more extended discussion of viewing this challenge in terms of less accurately measured students is provided in an article by Moen, Liu, Thurlow, Lekwa, Scullin, and Haussmann (2009) that is a companion to the present report. The question is how to determine which students are less accurately assessed. We decided to see how feasible it was to use teachers to identify such students. The literature is replete with teachers’ objections that large scale tests do not adequately measure what teachers teach (Abrams, Pedulla, & Maduas, 2003; Cizek, 2001; Popham, 2007; Prime Numbers, 2006). If these objections have any substance, presumably teachers see evidence of students’ knowledge and skills that large scale tests miss. A series of informal conversations we initiated with teachers confirmed that each teacher was quickly able to generate examples of students who the teacher believed had reading abilities that the typical reading test would underestimate. If teachers could in fact identify likely candidates for accessible reading assessment, using teacher judgment could help improve research on and implementation of accessible reading assessment, even if follow-up individualized diagnostic assessments had to be added to bolster teacher judgments. A review of work that others have done that can be related to teacher judgment offers mixed support for this enterprise. Many assessment specialists are likely familiar with the debate that has continued since Meehl’s (1954) book pitted clinical versus statistical prediction in the field of counseling psychology. In a meta analysis of over half a century of research on this issue, Ægisdóttir and colleagues (2006) observed that “arguments in favor of the small, but reliable, edge of statistical prediction techniques are strong” (p. 373). This does not argue, as might be supposed, that clinical judgment is ineffective, merely that often statistical procedures can be developed that are more effective. When effective statistical procedures are not readily available, clinical judgment seems to be a reasonable option. A parallel in the field of industrial and organizational psychology might be the use of human judgment in assessment centers for the selection and development of managers and executives. An online publication by the American Psychological Association, Psychology Matters, said in 2008 that “standardized tests have not been widely accepted in selecting and evaluating managers and executives, in part because of the seeming gap between the simple skills measured by tests and the complex skills (especially people-oriented skills) believed to be critical for managers and executives” (¶ 4). Consequently, the publication goes on to say, assessment centers using human evaluators often are seen as the method of choice for these kinds of tasks. These examples from disciplines outside the field of education illustrate some of the complexities of determining how much reliance to place on human judgment. Within education, there is a long history of using accumulated teacher judgment in the form of grade point average or high school rank to predict success in college (Willingham & Breland, 1982). Research on using tests for predicting college success has typically assumed such teacher-based indices as foundational and attempted to show that tests added a worthwhile incremental improvement in prediction over and above such indices (Noble & Sawyer, 2002; Pike & Saupe, 2002; Price & Kim, 1976). As with clinical prediction and assessment centers, a complex set of factors affect academic success (Willingham, 1985). An argument can be made that teachers who spend many hours during the course of a year with the same students have more opportunity to see students’ skills than assessment center assessors or clinicians have to observe their clients’ characteristics. On the other hand, from issues of grade inflation to concerns about subjectivity including outright favoritism, skepticism about the credibility of teacher-based evaluations abounds (Bradley & Calvin, 1998; Cizek, Fitzgerald, & Rachor, 1995; Ornstein, 1994). Our examination of literature relating teacher judgment to test performance found that earlier research, much of it reviewed by Hoge and Coladarci (1989) and Perry and Meisels (1996), tended to support teacher judgments of student achievement. More recent studies seem to have highlighted questions about teacher judgment. For example, although several studies using curriculum-based measurement (CBM) found moderate to high correlations between teacher judgment and measures of reading fluency, Feinberg and Shapiro (2003) suggested that the correlational data may be masking some important issues such as a tendency for teachers to overestimate students’ performance when the reading materials were below or at-grade level (Eckert, Dunn, Codding, Begeny, & Kleinmann, 2006). In considering issues that come closer to the ability of teachers to make judgments about the test performance of students with disabilities, Coladarci (1986) and Demaray and Elliott (1998) reported studies that show teachers were somewhat less accurate when judging the achievement level of lower-achieving students than when judging average to high-achieving students. Coladarci (1986) worried that results pointed “tentatively to the disturbing implication that students who perhaps are in the greatest need of accurate appraisals made by the teacher in the interactive context are precisely those students whose cognition has a greater chance of being misjudged” (p. 145). Moving beyond general estimates of student performance, we find greater difficulties when teachers are asked to make finer distinctions. Gresham, MacMillan, and Bocian (1997), for example, found that although teachers could identify which students were at risk of performing poorly on a test, they were not successful in distinguishing among three types of at-risk students: those who were considered to have a learning disability, those who were considered to have low cognitive ability, and those who were simply low achieving. Similarly, when Bailey and Drummond (2006) asked teachers to nominate kindergarten and first-grade students whom they believed to be struggling readers, the teachers succeeded in nominating students who scored below their norm-group on the standardized measures, but the teachers did not always capture the specific areas of weakness that many students showed on the standardized measures including comprehension, vocabulary, and phonological awareness deficits. Studies of teachers’ success in determining which students would benefit most from which accommodations also cast doubt on teachers’ abilities to make distinctions finer than whether students’ performance will be high or low. Although teachers should be knowledgeable about students, about their access to the curriculum, and about what accommodations may be most useful to them (DeStefano, Shriner, & Lloyd, 2001), and although teachers frequently play a central role in determining appropriate accommodations, Fuchs, Fuchs, and Capizzi (2005) concluded that teacher decisions regarding accommodations are “often subjective and ineffective” (p. 7). Part of the problem seems to be that teachers’ knowledge of allowable accommodations has been questionable enough to put validity and reliability at risk. Hollenbeck, Tindal, and Almond (1998) found that large variability exists regarding what teachers perceive as being appropriate accommodations, that teachers have made inconsistent use of accommodations, and they have sometimes shown preference for particular accommodations regardless of state guidelines. Fuchs and Fuchs (2001) found that some teachers provided the same accommodations to most students regardless of students’ individual needs and that other teachers sometimes grant accommodations to students who do not benefit from them. In one study where teachers were found not to be effective in recommending which students would benefit from having a read aloud accommodation for a math test, teachers’ judgments were not more accurate than chance (Helwig & Tindal, 2003). Looking specifically at accommodations with reading tests, one study by Fuchs, Fuchs, Eaton, Hamlett, Binkley, and Crouch (2000) found that teacher judgments provided many more accommodations than did data-based standards and that the accommodations that teachers provided did not produce a greater differential boost for students who had the accommodations than for those students who did not have them. Effect sizes for the accommodations that teachers awarded were small, ranging from -.07 to .06. Despite the doubts regarding teacher judgment that some of the studies raise, there are three main reasons we have persisted in examining whether teachers might be used to identify students who may be less accurately assessed. First, many of the studies that call into doubt teachers’ judgment merely show some discrepancy between teacher judgment and some test result. Rarely is evidence offered that the reason for the discrepancy is error in teacher judgment. Bailey and Drummond (2006), for example, explicitly point out that they did not seek to determine which measure was correct but merely observe that there was substantial misalignment. It could well be that discrepancies are sometimes due to limitations of the test and that the teacher judgment is taking into account information that the test lacks. Many writers have discussed differences between what teachers pick up on in classroom evaluations and what gets measured in large scale tests (Brookhart, 2003; Moss, 2003; National Research Council, 2003; Shepard, 2000). This is in fact a key premise of our study; in cases where the test would produce a misleading picture of certain students, teacher judgment should diverge from test results. The second reason for pursuing the potential use of teacher judgment is that some weaknesses in teacher judgment may be due to lack of information or misaligned perspectives that can be improved through training or support tools. DeStefano et al. (2001), for example, reported that after teachers went through systematic training, testing accommodations and instructional accommodations were more similar in number and type, students were more likely to receive accommodations on an individual basis, there was a reduction in accommodations for target skills (such as a reading accommodation on a reading test), and teachers felt greater confidence when selecting accommodations. Efforts currently underway by states to develop materials and provide training to help teachers make better accommodations decisions (for example, Minnesota Department of Education, 2008; Washington Office of Superintendent of Public Instruction, 2008) are premised on the assumption that teachers who are given the right training and tools can learn to make better accommodations decisions. Finally, substantial benefits can accrue from working with teachers’ judgments. If they provide good information, using teacher judgments could be less expensive, obtrusive, and time consuming (Perry & Meisels, 1996) than other methods of assessing student achievement levels. They could provide the deeper insight into student performance that some are concerned is missing from typical tests (e.g., Abrams, Pedulla, & Madaus, 2003). And teacher judgment already greatly affects students’ lives through the feedback teachers give students (Black & Wiliam, 1998), and the impact that course grades have on students’ options (Willingham & Breland, 1982), so any work that helps improve teacher judgment is likely to benefit students. The present report describes a small-scale study that was designed to provide a preliminary look at the feasibility and advisability of using teacher judgment as part of the procedure for identifying students at most risk of being inaccurately measured by typical annual large-scale reading tests. The study used a close examination of a limited number of cases to shed light on several questions. A separate report summarized the main quantitative results from this study (Moen et al., 2009). The present report provides more anecdotal description of the teachers and students who participated in the study to give a richer picture than mere numbers can. Again the focus of this study was on understanding the characteristics of students who may be less accurately assessed than other students by typical reading tests. Throughout the rest of this paper, the acronym LAMS will be used to stand for less accurately measured students. Table of Contents | Top of Page MethodsWe started by developing a questionnaire suitable for use in a large-scale study. We drew on what we learned from the literatures on reading, assessment, and disabilities and from literacy experts working with the Partnership for Accessible Reading Assessment (PARA) to write a detailed questionnaire that could have been used to ask many teachers to rate students on a host of variables thought to affect reading test performance. The questionnaire and plans for its use were distributed to 18 nationally known experts in reading, assessment, and disabilities. Their feedback provided support for the general goal of using teachers to identify less accurately measured students. The feedback also endorsed, sometimes enthusiastically, many of the details of the questionnaire. Some experts raised concerns that resonated with our own reservations. In particular, we came to agree with those experts who suggested that at this early stage in this investigation we might learn more by examining in depth what a few teachers and students thought than we would by having many teachers respond superficially to a long questionnaire. As a result, we developed the more open-ended questionnaire and procedures for working with teachers and students that are the focus of the present study. ProceduresThe present study had four main data collection steps:
Audio recordings were made of all interview and assessment sessions. The study was run in two phases. The first phase was completed during the spring and summer of 2006 and the second phase in the spring and summer of 2007. For the questionnaire teachers completed during both phases, data have been combined. For the teacher and student interviews and student assessments, only data from the second phase are reported here because a review of data and experiences from the first phase led to changes in those procedures. ToolsA paper-and-pencil questionnaire was used to ask teachers to nominate students they thought were inaccurately measured by large scale reading tests and to rate the degree of inaccuracy. The questionnaire described four reasons a student’s reading test score might give an inaccurate picture of his or her reading skills. Teachers were directed to write each nominated student’s name under whichever reason using one of these four reasons or adding a reason of their own. They rated “how badly a typical annual test score would misrepresent the student’s reading” using a scale from 1 to 5, with 1 indicating “a little off” and 5 indicating “way off” (see Appendix A). Teachers also were directed to give a more complete description in their own words of why the reading test would misrepresent each student’s reading skills. The four reasons supplied on the questionnaire were:
A fifth option was listed as “Other reasons” to invite teachers to add their own reasons. A structured oral interview for teachers had five main questions. The questions encouraged the teacher to: (1) provide a more in depth description of the student and why the reading test misrepresented the student’s reading skills, (2) discuss and review evidence that could document the teacher’s description, (3) rate the impact that several variables might have on the student’s test performance, (4) describe the teacher’s level of confidence in the description of the student and in the particular reason given for why a student would be misrepresented by reading test scores, and (5) add any other comments the teacher wanted to give about reading tests or related issues. For the second interview question, we asked teachers to provide evidence that could include test scores, classroom work, running records kept by the teacher, or anecdotal observations by the teacher. For the third interview question, teachers were asked to use a five point scale to rate the impact of these seven variables: fluency limitations, comprehension limitations, low motivation for the test, keeping attention focused on the test, getting worn out by the test, anxiety, and other. A structured oral interview for students had six questions intended to establish rapport with the student, get a better picture of who the student is as a person, and learn about the student’s attitudes and experiences with regard to reading and reading tests. Students were asked to share their own opinions on the extent to which large scale reading tests show how well they can read. The last question students were asked had them give their opinions about how much certain changes to reading tests would affect their performance on the tests. Students used a five-point scale to rate the likely impact of these changes: (a) having shorter reading passages; (b) having more interesting passages; (c) taking the test on a computer instead of paper and pencil, (d) having the entire test read out loud by a tape, CD, or MP3 player; (e) using a computer that let you choose words to have pronounced or explained while you read the printed text; and (f) other ideas. Two assessment activities were used for each student. First, all students completed three curriculum-based measurement reading (CBM-R) probes. CBM-R is a quick assessment task targeting oral reading fluency in which students read grade-level narrative text for a duration of one minute (Shinn & Shinn, 2002). Probes produced by AIMSWeb for students in grades 4 and 8 were used. We followed typical CBM-R administration by marking the number of words read incorrectly, and subtracting that amount from the total number of words read. The median score was recorded; this was selected to avoid outlier effects. Each median score was compared to AIMSWeb nationally-normed mean and standard deviation words per minute for the appropriate grade. AIMSWeb means were used because the large sample size of the norming population was unlikely to be significantly affected by outliers. The second assessment activity varied depending on what the teacher had identified as the student’s primary barrier to accurate test scores. Students in all four categories read an approximately 250 word passage at the fourth or eighth grade reading level. For students placed by teachers in the first barrier category (having fluency limitations that obscure measurements of comprehension), the second activity required students to listen to the reading passage read aloud on tape. Students were able to replay the selection as many times as needed until they thought that they understood the passage well. Students orally retold as much of the passage as they could remember. Retellings were transcribed and then scored according to how many main ideas, sub-ideas, and details were recalled. For students from the second barrier category (comprehension limitations obscure other reading skills), the second assessment activity involved having students read on their own the approximately 250 word reading passage. They then immediately orally retold as much of the passage (both main idea and details) as they remembered. Each retelling was transcribed and then scored according to how many main ideas, sub-ideas, and details were recalled. For the students placed in the third barrier category (students who have strengths outside of what most reading tests cover), the second assessment activity entailed reading the short passage and answering corresponding multiple choice questions. Students were offered a choice of reading the passage silently or hearing it read out loud on tape. Students in the fourth barrier category (students who respond poorly to testing circumstances) read the passage and answered five corresponding multiple choice questions. During this testing, students were encouraged to “think aloud” about difficulties experienced with the text and the items or suggestions for improvement. ParticipantsWe recruited participants from 10 elementary and middle schools in urban, suburban, and rural locations in two states. Thirteen teachers completed questionnaires during the first phase of the study and eight during the second phase for a combined total of twenty-one teachers. The teachers taught grades ranging from 4 through 8 in both general and special education. Teachers in the first phase identified 57 students as less accurately measured and the teachers in the second phase identified 20 such students. We met with two teachers and six students in the first phase. During the second phase, we met with eight teachers and twenty students. All of the teachers and students who were interviewed were from a single Midwestern state. AnalysisQuantitative data were tabulated from the nomination questionnaire and from the teacher and student structured interviews. Results from these tabulations are presented as descriptive statistics with cautions about over-interpretation because of the small number of cases. Qualitative analyses integrated observational information gathered during the interviews and the assessments with data obtained from the questionnaire, the brief assessments, and teacher-provided evidence. In a series of weekly meetings that spanned three months, four of us met to review this information. We worked to reach consensus on the extent to which information from separate sources converged to support conclusions. When consensus was not easily reached from the summary information, more detailed examination was undertaken of original source materials, including transcripts of interview and assessment sessions. Situations where we could not reach consensus led us to conclude that a determination could not be made. The primary determinations sought were whether evidence supported: (1) the teacher’s assertion that a student is likely to be less accurately measured, and (2) the teacher’s assertions about the likely causes of measurement inaccuracy for the student. Table of Contents | Top of Page ResultsTeachers’ Identification of LAMSIn all, 21 teachers from 11 sites submitted questionnaire responses, nominating a total of 77 students as less accurately measured. Eight teachers and 20 students participated in the structured interviews and brief assessment sessions, for a total of 20 teacher-student pairs. Questionnaire results detailing teacher perceptions of less accurately measured students will be presented. Quantitative information obtained during teacher and student interviews regarding student reading performance and student attitudes toward reading are reported subsequently, followed by a description of each student who participated in phase II and researchers’ conclusions about student characteristics and measurement problems. On the phase I paper-and-pencil questionnaire, most teachers were able to classify their students into at least one of the four main categories proposed by researchers on the questionnaire: (1) fluency limitations obscure comprehension skills, (2) comprehension limitations obscure other reading skills, (3) weakness in tested skills hides non-test reading strengths, and (4) responds poorly to standardized testing circumstances or materials. Teacher classifications from the paper-and-pencil questionnaire are shown in Table 1. Note that teachers sometimes assigned one student to more than one category so there were more classifications than students. The two most commonly used categories were “Fluency limitations obscure comprehension skills” and “Responds poorly to standardized testing circumstances or materials,” with 30% and 29% of classifications respectively. “Some comprehension limitations obscure other skills” and “Has strengths outside of what most reading tests cover” trailed the first two with 20% and 17% of the classifications respectively. The catchall “Other” category had 5% of the classifications. Table 1. Reasons for Less Accurate Measurement
* Students could be classified under more than one reason category, thus the total responses are greater than 100%. Percentages are based on the total counts (n=108) rather than the total number of students. During the teacher interview that started phase II, one of the questions explicitly invited teachers to apply more than one explanation to each student by asking them to use a 1 to 5 rating scale to indicate how much impact several variables had on each student’s test performance. Table 2 shows results from this question. Bear in mind that these interview data are based on only 8 teachers rating only 20 students. The results for this group of teachers and students suggest patterns worth discussing that would be good to confirm with a larger sample. Table 2. Teacher Ratings of Barriers to Students’ Performance
The two factors rated as having the largest impact on a student’s reading test performance, aside from the teachers’ “other” explanations to be discussed below, were comprehension limitations and fluency limitations. The means on a 5-point scale for these two factors were 3.65 and 3.35 respectively. For both of these factors, over half of the students were rated in the top two categories indicating that these factors affected them quite a bit or a lot. All of the students were described as being at least a little affected by comprehension limitations. But for fluency limitations, three students were rated in the lowest category as being hardly at all affected. For the rest of the provided explanations, over half of the students were rated in the lowest two categories as hardly at all or only a little affected. Yet there were some students for each of these variables that received the highest possible rating indicating that some students were affected a lot by these variables. This pattern of ratings indicates some commonality in that all of the nominated students’ reading test scores are affected by multiple factors and in particular all are affected by comprehension limitations. At the same time, there is considerable diversity in that each of the listed factors affected some students only a little and other students a lot. The diversity found among this small number of students is perhaps best seen by looking at the descriptions of individual students later in this document. When missing values are left out, the highest mean rating (4.80) was for the “other” explanations that teachers supplied for 10 students. Some of the explanations that teachers added here seemed to us closely related to explanations we had offered such as motivation and anxiety. Several other explanations could have fit under the “testing circumstances or materials” used in the nominating questionnaire but that explanation had not been repeated in the interview as an option. In particular, teachers said for several students that test materials that relied on multiple choice tests or other written responses disadvantaged these students who performed better with oral responding. A couple of other teacher-generated explanations delved into issues such as background and family expectations that we judged had more to do with why a student might not have developed effective reading skills than with why a test might obscure effective reading skills. During these interviews, teachers provided a variety of evidence for their descriptions of the students they nominated as LAMS. They shared samples of class work, recent standardized test scores, reports of students’ participation in class literature conversations and informal reading assessments. The strength of the evidence varied by teacher and student. In some cases, the nature of the student’s characteristics limited the potential evidence for the teacher to provide. For example, it was easier for a teacher to provide tangible evidence of low fluency than evidence of responding poorly to testing situations. There was also variability across teachers in the nature of evidence provided. Some teachers were more thorough than others, providing both a greater quantity of evidence or evidence with greater depth in detail. Additionally, some teachers provided evidence that was specific to each student, whereas other teachers provided the same evidence (e.g., the same worksheet or test scores) for all students nominated as LAMS. Ratings from Students Who Teachers Nominated as LAMSStructured interviews and brief assessment sessions were completed for 20 students during phase II of the study. Interviews with students identified as LAMS by teachers provided information regarding student perception of reading and traditional assessments of reading, as well as possible alternative assessment methods. Student attitudes toward reading and reading assessments are displayed in Table 3. The majority of students interviewed reported reading at least “some” things on their own or outside of school; a smaller portion, four students, reported reading a great deal outside of reading for school. All students reported enjoying reading at least “some”, and about a third of the group indicated enjoying reading “quite a bit” to “a lot”. When asked about how difficult reading is for each, responses varied and were distributed somewhat more evenly between “hardly at all” and “quite a bit”; no students rated the difficulty of reading as “a lot.” Table 3. Student Attitudes Toward Reading and Tests
Table 4 shows student attitudes toward methods that could be employed in reading assessment that are alternative to the standard procedures normally used. The alternative methods students were asked to consider included shorter reading passages, more interesting passages, computerized test administration, test read out loud electronically, and assistive technology to aid decoding. Students favored shorter and more interesting reading passages and assistive technology to aid decoding over the other methods mentioned. Students rated having the test read aloud as the least helpful—several students indicated that they would prefer to have control over the pace of reading rather than have the test read to them. Table 4. Student Ratings of Alternative Methods
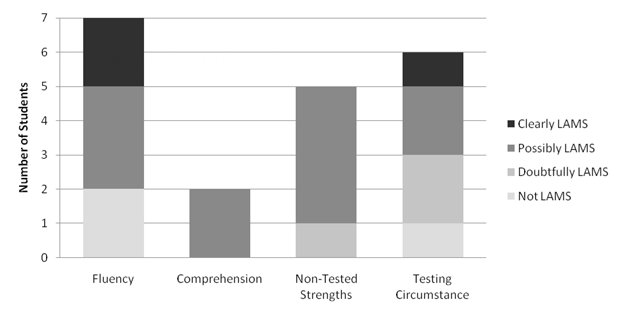
Researchers’ Conclusions About LAMS IdentificationsThe data yielded varying levels of converging evidence about the accuracy of teachers’ descriptions of students as being less accurately measured. Four broad groups of students emerged. For three of the twenty students, the evidence seemed clear that the problem was not with test accuracy. Their teachers described these as students who would perform poorly on reading tests because they lacked the requisite reading skills. The teachers explained that they had nominated a student because the tests were too hard for the student or the teachers described reasons why a student struggled with reading. These descriptions of student difficulties did not fit our definition of LAMS as students whose reading was being inaccurately measured by tests. Consequently, these three students were considered “Not LAMS.” A second group of three students was considered “Clearly LAMS.” For these students, there seemed to be strong converging evidence that they had reading and test-taking characteristics that would make them less accurately assessed. Researchers unanimously agreed with the teacher’s classification and description of these students. Three more students were classified as “Doubtfully LAMS.” The characteristics teachers described for these students would have made them appropriately identified as LAMS if evidence supported the descriptions, but the evidence researchers were able to observe seemed to contradict teachers’ assertions. The remaining 11 students fell at various points on a continuum between the “Clearly LAMS” and “Doubtfully LAMS” groups. These 11 students were considered “Possibly LAMS.” There were varying degrees of support for teachers’ assertions, but researchers concluded that the teachers’ judgments about these students seemed at least plausible. These 11 students could be further subdivided into three groups: students for whom anxiety was described as a major barrier to test performance, students whose barrier related to test method or modality, and students for whom no specific barrier could be confidently identified. Figure 1 displays the strength of evidence for reasons students might be classified as LAMS. The research protocols probably affected how much evidence could be identified that would support various reasons for identifying a student as less accurately measured. Students were most clearly identified as LAMS based on a report of fluency obscuring comprehension. This may well be because fluency is a straight-forward barrier to measure. A barrier for which researchers had difficulty finding evidence was that of non-tested strengths that are hidden by test weakness. This may indicate that this is a relatively minor barrier or it may reflect limitations in the study methodology. Similarly, a significant part of the problem with getting a clear determination for the 11 students identified as Possibly LAMS is that research protocols made little provision for gathering information about the characteristics that are most salient for these students. Figure 1. Strength of Evidence by Barrier Category
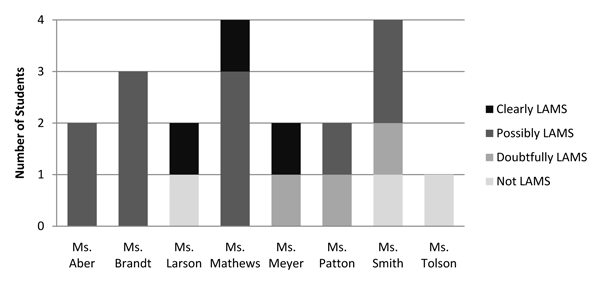
No patterns were discerned when the evidence was analyzed according to which teacher provided it (see Figure 2). For example, some teachers who nominated students who researchers considered to be clearly LAMS also nominated students who researchers concluded were doubtfully LAMS or were not LAMS. Figure 2. Strength of Evidence for Teachers’ Nominations
Note: The names used for teachers in this figure are pseudonyms, used only to facilitate communication in this report. Table of Contents | Top of Page Student DescriptionsStudents identified by researchers as “Not LAMS,” “Clearly LAMS,” “Doubtfully LAMS,” and “Possibly LAMS” are described here. The names used for teachers and students are pseudonyms. They are used only to facilitate communication in this report. Not LAMSTeachers nominated three students as LAMS candidates who clearly did not fit the model used in this research. In all of these situations, it appeared that the teachers were describing learning barriers rather than assessment barriers. For these students, standardized tests accurately reflect that the students were not meeting reading standards. MacMac was an African American male in fourth grade in a special education setting within a large urban school district. Mac’s teacher, Ms. Tolson identified Mac as a student for whom current state reading assessments do not produce valid information. She explained that because Mac reads at a first grade level, reading tests designed for the fourth grade could not measure the reading skills he had. This explanation does not fit with this study’s model of less accurately measured students. Although a state assessment would not likely show whatever reading skills Mac had, it was not an issue of test inaccuracy that needs to be overcome, but rather an issue of the test being designed to measure skills that Mac did not have. During the interview, Mac was hesitant to answer interview questions, but said that he reads a little and that all of the ideas researchers mentioned about testing alternatives would help make reading tests better except for having the entire passage read out loud. Mac read 11 words per minute (WPM) as compared to the national mean for grade four of 128. For the brief assessment protocol, Mac listened to a grade-level passage on tape and then orally retold the story. He retold roughly 1-2 ideas from the story. Information from both teacher and student interviews, a review of relevant school work, and a brief assessment session supported Mac’s teacher’s description of Mac as having low reading skills, but no information available suggested that Mac would perform any differently on a more accessible reading assessment than a traditional reading assessment. Therefore, Mac is not a LAMS. Although his standardized reading scores are not able to show what he can do because his skills are below the test’s lower threshold, those scores do indeed accurately represent Mac’s lack of the tested reading skills. RockyRocky was a Caucasian fourth grade male attending a small suburban elementary school. Rocky’s teacher, Ms. Smith identified Rocky as a LAMS due to fluency and motivation limitations and rated him a five (large effect) in “fluency limitations obscure comprehension skills.” She ascribed some of Rocky’s reading difficulty to his family having a weak educational background and low academic expectations. She provided a unit fluency test from the fall of 2006 on which Rocky scored in the 7th percentile. During his interview, Rocky said that he reads dialogue or text within video-games or the computer and that longer words and texts are harder. Rocky read 97 WPM as compared to the national mean of 128. After listening to an audio presentation of a grade-level passage, Rocky retold approximately 4 of 25 ideas from a story and was unresponsive to queries for further information. Available information suggested that motivational issues may well affect both the development of and the measurement of Rocky’s reading skills, but the primary conclusion was that Rocky showed pervasively low reading skills that would be accurately reflected in low test scores. His teacher’s explanations for why it might be that Rocky struggles with reading do not indicate that assessments would misrepresent his reading skills. JosephJoseph was an African American male in the fourth grade attending a small elementary school in a suburban setting. Joseph received part time special education services for reading instruction from a reading specialist at the school. Joseph’s reading teacher, Ms. Larson, identified Joseph as a LAMS whose true reading proficiency is obscured by comprehension limitations on traditional state assessments of reading. She suspected his comprehension limitations stemmed from an under-stimulating environment during early development. Ms. Larson seemed to provide reasons for why Joseph was struggling with reading, rather than why the test is an inaccurate measure for his reading. Joseph reported that he reads “some” that is not for school and that reading is not very difficult for him. Joseph obtained a median CBM-R score of 64 WPM compared to the national mean of 128. When Joseph was asked to read a grade-level passage to himself and answer five comprehension questions in the Think Aloud condition, he seemed to struggle with the concept of the Think Aloud, even after modeling and a practice run. Regardless of the impact of various environmental factors on the development of Joseph’s reading skills, no evidence was found that environmental factors or other factors would cause tests scores to give an inaccurate image of his reading skills. Clearly LAMSThere were three major similarities among students the researchers judged to be Clearly LAMS. First, we found strong, converging evidence across the initial teacher questionnaire, the teacher interview, teacher profile rating, teacher evidence, and researcher observations. Second, teachers were consistent in describing these students across the initial questionnaire and the interview. Finally, there was evidence of relatively large differences between the students’ ability and their scores on standardized tests. PaulPaul was a Caucasian male attending the fourth grade at an elementary school within a large school district in a suburban setting. He received special education services in reading that included a paraprofessional in the classroom and pull-out instruction from a reading specialist. On the initial questionnaire, Paul’s teacher, Ms. Larson, rated Paul a five out of five possible points (large effect) in “fluency limitations obscure comprehension skills” on the initial questionnaire. During the structured interview session, Ms. Larson reported that Paul was typically slow in task completion, possibly due to a medical condition (the nature of which was not revealed). She also reported that Paul showed excellent comprehension when read to but that it was difficult for him to memorize things. Ms. Larson provided Dynamic Indicators of Basic Early Literacy Skills (DIBELS) as evidence indicating that when read to, Paul’s comprehension as measured by multiple choice questions can range from 60% to 80%. After meeting with Ms. Larson, the researcher interviewed Paul and conducted a brief assessment session in which Paul was asked to read three CBM-R passages and to orally retell a story read out loud on a cassette tape player. During the structured interview, Paul reported that reading is somewhat difficult for him and that the hardest aspect of reading is sounding out words. He also specified that he needed to get faster in reading. Next, Paul completed the brief assessment session. During CBM, Paul obtained a median oral reading fluency of 11 WPM compared to the national mean for fourth grade students of 128. The second half of Paul’s brief assessment session entailed listening to a fourth grade level story read out loud and then retelling as many details as he could remember. His oral summary included 7 out of roughly 25 individual details of the story. The seven details retold were fairly representative of the narrative storyline, indicating at least basic comprehension of the causal chain of events. Because of the relatively unstructured nature of the oral retell task, the number of details should not be interpreted as existing along an equal interval scale, but rather as an ordinal estimation of a reader’s overall recall for a story. Although his incomplete oral summary may be an indication of less than proficient comprehension performance, it is substantially better performance than what could be expected if Paul had been required to read the story silently to himself. That is, with Paul’s low fluency of 11 WPM on CBM, it would be unlikely for Paul to demonstrate even minimal comprehension within a traditional standardized assessment format. The results of the interview and the brief assessment session were both congruent with Ms. Larson’s description of Paul, marking Paul as an example of a clear LAMS. IkeIke was a Caucasian male attending sixth grade at a private school for students with identified learning disabilities. No specific information about his diagnosed disability was obtained. Ike’s teacher, Ms. Mathews, rated him a four (relatively large effect) in “fluency limitations obscure comprehension skills” on the initial questionnaire. During the structured interview, she described Ike as having very slow “processing” and as often requiring twice the amount of time to complete a task as his peers. According to Ms. Mathews, after reading passages silently, Ike responds to comprehension questions fairly accurately when given ample time. Ms. Mathews argued that despite the fact that most state reading assessments are no longer timed, circumstances within the context of a school building still contribute an element of “speededness” to a reading assessment, thereby limiting Ike’s opportunity to perform on the test. To support her description of Ike’s reading, Ms. Mathews provided a Gray Silent Reading Test consisting of eight short stories (one or two paragraphs each) followed by multiple choice comprehension questions that took Ike four hours over four days to complete. In this case, Ike demonstrated fairly good comprehension; however, under more rigid timing, he reportedly would not be able to do so. During the structured interview, Ike reported that he reads every night—especially comics—and finds reading somewhat challenging. What Ike endorsed as most helpful in reading tests were shorter passages, computer-based tests, and having words pronounced or explained. Ike was assessed using CBM and then by asking Ike to orally recall a story that he listened to on tape. During CBM, Ike obtained a median oral reading fluency of 79 WPM compared to a national mean for sixth grade of 154. Ike also listened to an audio presentation of a reading passage and summarized the story orally afterward. His oral summary included 14 of roughly 25 possible points from the story, and covered most key events and main ideas. Researcher observations during the structured interview and the brief assessment session supported the teacher’s assertion that Ike’s slow oral reading fluency can obscure measures of his comprehension in typical assessment situations. However, the amount of time that Ike requires to complete a task may be a more salient factor. Ike’s oral reading fluency (79 WPM) is not nearly as low as Paul’s (11 WPM), but researchers noted that Ike was a fairly slow speaker, which seemed congruent with Ms. Mathews assertion that he is slower at completing tasks. Because Ike’s oral reading fluency was slow and because he showed adequate comprehension of an audio presentation of a passage, researchers concluded that Ms. Mathews was correct in classifying Ike as a LAMS due to limited fluency skills and slow task completion. MattMatt was a fourth grade Caucasian student from an outer ring suburban school. At the time of the study, Matt received a half hour of pull-out small group reading instruction per day. His teacher, Ms. Meyer, rated him a five (large effect) in “responds poorly to standardized testing circumstances or materials” on the initial questionnaire. Ms. Meyer was consistent throughout her discussion with researchers that Matt was a student who has low motivation and who performs better if he is engaged and interested. Ms. Meyer also reported that Matt veers off on tangents and resists finding support for comprehension answers in the text. She provided examples of Matt’s oral comprehension answers that showed he is able to remember, evaluate, analyze, and apply. During the interview, Matt reported that he does not read often and that more interesting and shorter passages would help make tests better. Matt’s median CBM score was 63 WPM compared to a national mean of 128. For the brief assessment, Matt read a passage to himself and answered comprehension questions in the Think Aloud condition. He answered four of five questions correctly. During the Think Aloud, Matt relied only on his own experiences and feelings to answer the questions. For example, when asked how a character of the passage felt when a large bird flew overhead, instead of referring to the text or what he read, Matt chose the answer based on how he would feel in that situation. Also, the researcher noted that Matt had a very difficult time staying on task and focusing. It appeared that Matt’s low engagement was less related to low fluency and more related to lack of attention. Matt’s interview responses indicating that he does not read often and that shorter, more interesting passages would help on reading tests supported Ms. Meyer’s description of him as a student with low motivation and for whom interest level affects performance. Additionally, Matt had difficulty staying on task during the brief assessment and answered comprehension questions based on his own experiences rather than finding support in the text as Ms. Meyer’s described. Thus, researchers agreed with Ms. Meyers and concluded that Matt was a clear case of a LAMS because of low motivation and engagement. Matt is student whose skill development, no doubt, suffers because of motivation and engagement issues but, whose test results are likely to show very little of what he can do unless he is engaged by the assessment task. Doubtfully LAMSSimilar to the three students who clearly were LAMS, the next three students could well have been LAMS based on teachers’ descriptions. The difference is that what the researchers were able to observe either conflicted with the teacher’s descriptions or suggested in some other way that test results would accurately reflect student reading skills. Accordingly, the researchers were doubtful whether these students should be classified as LAMS. BettyBetty was a Caucasian female fourth grade student in a small suburban elementary school. At the time of the study, Betty received special education services for reading. Her teacher, Ms. Smith, placed Betty in the “responds poorly to standardized testing circumstances or materials” category with a rating of four (relatively large effect). Her description of Betty’s reading suggested that Ms. Smith perceived Betty as a strong student who is misrepresented by results from reading assessments, but also that Ms. Smith did not have any specific hypothesis regarding why that would be the case. During the interview with a researcher, Ms. Smith reported that although Betty was an articulate and academically engaged student she consistently underperformed on standardized reading tests. Ms. Smith indicated that she believed that Betty was a proficient reader, but experienced difficulties responding to multiple choice test items. Ms. Smith provided two Scott Forseman Unit Benchmark tests (a measure of comprehension, grammar, and writing) as evidence to support her description of Betty. A researcher’s review of Betty’s performance on these tests did not reveal information that could support or contradict Ms. Smith’s description of Betty’s difficulty with multiple choice tests. The material the teacher submitted did not contain adequate samples of both her performance on multiple choice as well as constructed response question formats, so no pattern was observable in Betty’s performance. Samples of Betty’s performance on large scale, annual reading assessments could not be obtained. In her interview with a researcher, Betty reported reading regularly in her free time. She mentioned that reading is somewhat difficult for her, depending on what she’s reading. Betty obtained a median oral reading fluency of 80 WPM as compared to the national grade four mean of 128. Betty was given brief instructions and a demonstration of the Think Aloud activity. When Betty was instructed to think aloud while answering a set of multiple choice comprehension questions after reading a short story, she demonstrated use of the process of elimination in choosing a correct response. Betty answered all five multiple choice comprehension questions correctly. Betty demonstrated good test taking skills and fairly proficient reading, which seemed contrary to Ms. Smith’s description of Betty’s performance on reading assessments. Since the information obtained from this brief assessment session seemed at odds with the teacher description and because Betty’s state test scores were unavailable in order to confirm a discrepancy between her skill level and scores, the researchers judged it seemed doubtful that Betty was a LAMS. KevinKevin is a Caucasian sixth grade male from a suburban school. He received a half hour of pull-out small group reading services a day. Kevin’s teacher, Ms. Meyer, reported that Kevin had difficulties with multiple choice items and placed him in the category “responds poorly to standardized testing circumstances or materials.” Ms. Meyer provided several pieces of work as evidence: CBM results, miscue analysis results, notes on the reading strategies that Kevin uses, Think Alouds, Burke Reading Inventory, and oral answers to comprehension questions. As a whole, the evidence indicated good reading comprehension. During the student interview, Kevin reported that he reads a lot of fantasy books about dragons. He said that he likes reading a lot but that it is somewhat difficult for him. He reported that more interesting passages would make reading tests better while having the story read out loud would not. Kevin obtained a median CBM of 114 WPM as compared to the national mean for sixth graders of 154. After reading a fourth grade-level story to himself, Kevin answered five comprehension questions in the Think Aloud conditions—all correctly. Based on this short assessment, the evidence that researchers observed contradicted the notion that Kevin has difficulties with the multiple choice format. Consequently, researchers saw little evidence of a discrepancy between Kevin’s actual skill level and his test scores. The researchers struggled with how to classify Kevin but, because the evidence researchers could find seemed contradictory to Ms. Meyer’s descriptions, we eventually concluded that considering him as doubtfully a LAMS seemed to make the most sense. MorganMorgan was a Caucasian fourth grade male from a suburban district. His teacher, Ms. Patton, reported that Morgan rushes through tests and does not seem to care about them. Ms. Patton reported that Morgan shows good comprehension orally and that his test scores do not seem to be accurate because Morgan did not meet fourth grade goals. She classified Morgan in category 3, “Has strengths that are outside of what most reading tests cover.” Ms. Patton provided Northwest Evaluation Association (NWEA) test scores as evidence. The researcher who examined the NWEA sub-scores observed that the confidence interval around Morgan’s scores included the class mean. This suggests that Morgan was performing near the average level for his class on these tests. During the student interview, Morgan reported that he reads a little and likes it “some.” He said that shorter, more interesting passages would make reading tests better. Morgan obtained a CBM-R score of 124 WPM as compared to the national mean of 128 WPM. Morgan answered three of five comprehension questions correctly after reading a grade level passage to himself. Researchers noted that Morgan did seem to rush through the test, as described by Ms. Patton, but they saw no evidence that the tests measured Morgan’s skills inaccurately as a result of this rushing. Researchers hypothesized that Morgan’s good conversational skills may make him appear to have better reading skills than the specific skill domains that are targeted in state standardized tests and concluded that it was doubtful to consider Morgan a LAMS. Possibly LAMSFor the remaining 11 students, the researchers were inclined to agree with the teachers’ assertions that the student was likely to be less accurately measured on reading tests than other students. Although evidence to support teachers’ assertions about measurement inaccuracy was weak, ambiguous, or even missing for these students, we found nothing that would lead us to challenge the teacher’s assertions. Part of the reason we were disposed to give teachers the benefit of the doubt for these students is that characteristics the teachers described tended to be ones for which the research protocol had not been designed. It may well be that evidence could have been found to support teachers’ assertions if the study had been designed to provide that evidence. In the student descriptions that follow, factors that should receive more attention in future studies of less accurately measured students are highlighted. AnxietyAnxiety was identified as a factor that affects the performance of several students. But because our student interview and assessment procedures were designed to minimize student stress, we lacked the ability to observe a high level of anxiety during testing to confirm teacher assertions. CallieCallie is an example of a student for whom anxiety was described as a primary barrier. Callie was a Caucasian female in the sixth grade at a private school for students who have identified learning disabilities. Callie’s teacher, Ms. Aber, described Callie as a strong reader with good fluency and comprehension, but noted that Callie’s reading proficiency under anxiety-producing test circumstances appears to be substantially lower than under more comfortable conditions. Ms. Aber rated Callie a four in “responds poorly to standardized testing circumstances or materials.” Ms. Aber provided three consecutive years of Gray Silent Reading Test records. Ms. Aber reported that Callie took the tests from the first two years in conditions of unfamiliarity, and the third in a familiar environment. Researchers confirmed that Callie’s scores showed little growth from the first to second years, but immense growth from the second year to the third. Callie reported that she reads “some” that is not for school, enjoys reading quite a bit, and that reading is not difficult for her. Callie obtained a CBM-R fluency rate of 156 WPM compared to a national grade 6 mean of 154. Due to time limitations, Callie was not able to complete a brief assessment. Consequently, researchers were unable to obtain evidence that could conclusively demonstrate that a substantial increase in Callie’s reading test score between 2005 and 2006 was primarily due to a decrease in situational or test anxiety. Because our procedures aimed to limit anxiety, we were unable to directly test her teacher’s assertions. However, information obtained from a brief interview and assessment session with Callie did not contradict any of the teacher’s description. AnnaAnna is another example of a student whose reading test scores appear to be obscured by anxiety. Anna was an Asian American female in the fifth grade attending a private school in an urban setting for students with identified learning disabilities. Similar to Callie, Anna was described by her teacher, Ms. Mathews, as a student whose test related anxiety acted as a barrier to proficiency on reading tests. Ms. Mathews rated Anna a four in “responds poorly to standardized testing circumstances or materials.” As evidence, Ms. Mathews gave anecdotes of Anna being very stressed and anxious and engaged in a lot of fidgeting and erasing during tests. Additionally, Ms. Mathews shared a Gray Oral Reading Test on which Anna’s scores fell within the 68th percentile as compared to other fifth grade students. During the interview Anna shared that she was diagnosed with dyslexia and that she felt unfamiliar words in tests make it hard for her to show how well she can read. In order to assist her with reading in school, Anna described using a “reading pen”—a hand held optical character recognition device designed to help students read unfamiliar or difficult words (see Higgins & Raskind, 2005; Thurlow, Moen, Lekwa, & Scullin, 2010). Anna reported enjoying non-school related reading much better than school reading. She obtained a median oral reading fluency of 93 WPM, compared to the national grade five mean of 140. Due to time constraints, her brief assessment was incomplete. However, comparing Anna’s performance on the school’s annual standardized reading assessment to that on nonstandardized informal reading assessment tasks, it seemed plausible that fluency limitations or anxiety could negatively affect measures of her comprehension; because it is likely that she used a “reading pen” during her school’s annual testing, the effect of her low fluency may have been mitigated in that situation. Overall, the information available was not sufficient to conclude whether anxiety or fluency decreased Anna’s access to reading assessments or to conclude whether Anna was indeed a LAMS, however we have no reason to doubt her teacher’s assertions. BethBeth appeared to be affected by anxiety and additional factors such as lack of confidence and low fluency. Beth was a Caucasian female fourth grade student from an outer ring suburban school. At the time of the study, she was not receiving special education services. Beth’s teacher, Ms. Brandt, originally rated her with both a two (relatively little effect) in the “fluency obscuring comprehension” category and with a three (some effect) in “responding poorly to the test environment.” Ms. Brandt reported that Beth reads word by word and seems to be held back by fear. Ms. Brandt said that Beth lacks confidence in independent work. Additionally, Beth reportedly becomes overwhelmed with frustration during tests. Ms. Brandt’s description of Beth remained consistent throughout her participation in the study. She rated fluency, comprehension, getting worn out, keeping attention focused, and anxiety as high factors in Beth’s test scores. However, Ms. Brandt had difficulty placing Beth in one category because she found it challenging to decide whether fluency or anxiety was more salient in Beth’s test scores. Ms. Brandt chose category 1, “Fluency obscures comprehension skills”, because she believed that Beth’s low fluency likely caused her anxiety. Ms. Brandt provided evidence of a discrepancy between Beth’s ability and her standardized reading test scores. Ms. Brandt provided notes from literature circles showing correct answers to oral comprehension questions, records of oral reactions to stories, a biography, and a description of a character in book. All work samples provided evidence that Beth is capable of grade-level or above comprehension when measured in a non-test format. Additionally, Ms. Brandt provided Beth’s NWEA score of 204, which is at the national median. Ms. Brandt argued that a score of 204 underestimates Beth’s true ability. During the interview, Beth reported that she does not read much and that it is somewhat difficult. She said that shorter, more interesting passages, having specific words pronounced, and more breaks would help make reading tests better. Finally, Beth reported that she prefers paper and pencil tests to computer tests and that she would not want a test read aloud to her. Beth obtained a median CBM score of 104 compared to the national grade 4 mean of 128. For her brief assessment, Beth received an audio presentation of the passage and then completed an oral retell. She was able to accurately retell 14 of approximately 25 ideas and details. This was the highest oral retell score obtained by any students in the study. Researchers noted that Beth seemed hesitant and quiet throughout her participation in the study. The evidence that the researchers collected was consistent with the evidence and descriptions provided by Ms. Brandt. Beth is an example of a student whose reading strengths and weaknesses are difficult to capture within a categorical rating system. Specifically, it is difficult to ascertain whether fluency or anxiety had more influence on the apparent discrepancy between Beth’s ability and her standardized reading test scores. The researchers concluded that standardized reading tests likely underestimate Beth’s reading ability as a result of Beth’s fluency, anxiety, and lack of confidence. Based on the data collected, the researchers found no reason to challenge any of the teacher’s assertions about Beth. Test MethodAs was the case for the students whose reading scores appeared to be obscured by anxiety, our procedures limited our ability to confirm teacher descriptions for the following students. These students were nominated because they seemed to be less able to demonstrate their reading ability via certain test methodologies. Although our short assessments did not have the power to confirm or disconfirm teacher assertions as clearly as we would have liked, the teacher assertions seemed compatible with our evidence. JillJill was a Caucasian female fourth grader from an outer ring suburban school. At the time of the study, she did not receive special education services. Jill’s teacher, Ms. Brandt, rated Jill a three (some effect) in “fluency obscuring test scores” on the initial questionnaire. After discussion with the researcher, Ms. Brandt changed her mind and rated Jill a four (relatively large effect) in having strengths that are outside of tested reading skills (demonstrating comprehension orally) and weaknesses on tested reading skills (demonstrating comprehension through writing). Ms. Brandt reported that she understood the categories better after discussing them with the researcher and felt that her second ratings were a better description of Jill. When asked to use a scale of one through five to rate the extent to which different factors obscured test scores (five being the most) Ms. Brandt rated “fluency” a four and added “written answer”, rating it a five. Furthermore, Ms. Brandt described Jill as a motivated student who wants to learn but who has lower fluency. According to Ms. Brandt, Jill performs above her peers in vocalizing higher-level comprehension in class discussions. However, Jill reportedly struggles to show comprehension when required to write. Ms. Brandt shared Jill’s Northwest Evaluation Association (NWEA) score the preceding year as evidence of Jill’s performance on standardized, written tests. Jill’s score fell at the national mean score of 204, which Ms. Brandt argued was an underestimate of Jill’s true skill level. Ms. Brandt also provided examples of Jill’s contributions to class literature discussions and other in-class work. Jill’s work reflected good comprehension and a high level of engagement with the material. In giving an example, Ms. Brandt explained that she rates her students’ contributions to literature discussions on a scale of one through ten, with ten indicating the highest levels of comprehension. Based on Ms. Brandt’s notes, Jill usually received eight’s or nine’s. Further, the notes show that Jill was able to recall facts, clarify ideas, make judgments, and form opinions about the reading material. During the student interview, Jill reported that reading is a little difficult for her. She said that the following would help make reading tests better: Shorter, more interesting passages, having the test read out loud, having words pronounced, more breaks, and smaller groups. Assessment results show that Jill’s fluency is in the low average range at 106 WPM as compared to the national grade 4 mean of 128. Jill received an audio presentation of a short story and then answered five multiple choice comprehension questions that were presented via text on paper. Jill read and answered the comprehension questions quickly. She answered only two of five multiple choice comprehension questions correctly, which seemed consistent with Ms. Brandt’s assertion that Jill shows comprehension better orally than via traditional the test methods of written or multiple choice answers. Researchers concluded that standardized tests underestimate Jill’s comprehension skills because of the modality of response: written or multiple choice answers. There is evidence that Jill is able to show comprehension better verbally rather than via written response. Jill is an example of a student whose strengths and weaknesses may be described differently depending on one’s framework. That is, depending on one’s perspective, Jill either has other abilities that are not being measured by tests (oral comprehension; category 3) or responds poorly to testing situation (written response; category 4). Either way, it appears that Jill may be a student whose skills may be more accurately measured with verbal modality of response rather than written. StephanieStephanie was a Caucasian fourth grade female in a small suburban elementary school. On the questionnaire, Ms. Smith indicated that Stephanie is a voracious reader with adequate fluency and background knowledge and experience for comprehension of grade level text. She placed Stephanie in category 3, “Weakness in tested reading skills hides non-tested reading strengths” with a rating of four. Ms. Smith consistently described Stephanie as a student who, as a result of her motivation and independent engagement in reading, has strengths outside of what most reading tests are designed to measure. Ms. Smith also described Stephanie as a rote learner who struggles to answer questions requiring inference or synthesis. Furthermore, as a “concrete thinker,” Stephanie reportedly experiences difficulty with multiple choice questions on the state’s large scale reading assessment. In a sample of Stephanie’s homework provided for review by Ms. Smith, comparatively higher performance was noted in the areas of vocabulary and grammar than in comprehension. During her interview with a researcher Stephanie reported that she enjoys reading in her free time and reads at least one hour each weekend. She noted that reading is sometimes challenging for her, but that it had been getting easier with practice. She obtained a median CBM-R score of 121 WPM as compared to the national fourth grade mean of 128. For her brief assessment activity, Stephanie read a grade-level passage and answered three of five comprehension questions correctly. Depending on the way in which reading is defined and measured by a test, Stephanie may or may not be a less accurately measured student. Reading tests that include measures of higher levels of comprehension, such as inferential comprehension, could fail to reveal other reading strengths Stephanie has such as fluency, vocabulary, or engagement and therefore give inaccurate results. The difficulty is envisioning a goal of designing reading tests that would measure those skills without also measuring student’s comprehension skills. Accordingly, the researchers considered Stephanie to be a potential LAMS. Other FactorsIn addition to test anxiety and test method, teachers described students as having a variety of other characteristics that would limit the accuracy of reading tests. The researchers observed that evidence did not contradict the teacher, but it was also not clear or strong. Several of these students were nominated because a specific reading weakness hid other reading skills. Unlike the three students for whom we found clear, convergent evidence, these students did not have glaring disparities in abilities. Therefore, there were less pronounced differences between, for example, measures of reading fluency and reading comprehension. JaneJane was a Caucasian sixth grade female attending a private school for students with identified learning disabilities. Jane’s teacher, Ms. Mathews, rated Jane a three (some effect) in “weaknesses in tested skills hides non-test reading strengths” and remained consistent in her description of Jane throughout the study. Ms. Matthews described Jane as a student who makes effective use of tools and strategies during reading, such as highlighting or using a marker to keep her place. Ms. Mathews provided examples of Jane’s schoolwork as documentation of her use of tools such as highlighting. Jane reported that she does not read much outside of school and that reading is somewhat difficult for her. Jane said that shorter, more interesting passages, and being able to have specific words pronounced by a computer would make reading tests better. On the CBM, Jane demonstrated low fluency for her grade level at 79 WPM as compared to the national sixth grade mean of 154. The research protocol had Jane listen to a passage read out loud on a recording; she then answered five out of five comprehension questions correctly. It should be noted that Jane’s school allowed students to use tools such as listening to recorded passages during tests so researchers did not obtain evidence that the use of tools resulted in higher scores. Information regarding Jane’s performance without certain learning tools and strategies was not available, However, there is no reason to doubt Ms. Matthew’s assertions, so the assertion that Jane would likely be less accurately assessed without these tools was accepted as indicating that Jane may possibly be a LAMS. ValVal was a Caucasian female in the fifth grade at a private school for students with learning disabilities. Although no specific information regarding diagnoses was obtained for Val, her teacher, Ms. Matthews, reported that Val struggled with decoding at the expense of comprehension, resulting in test anxiety and frustration. Ms. Matthews indicated that Val puts forth strong effort initially, but makes many decoding errors and subsequently disengages from the task in frustration. She reported that when reading orally, Val often mispronounced words in a manner that suggested erroneous decoding of the text. Ms. Matthews initially rated Val a five (large effect) in “fluency limitations obscures comprehension skills,” a five in “comprehension limitations obscure other reading skills,” and a five in “responds poorly to standardized testing circumstances or materials.” During the interview with the researcher, Ms. Matthews decided that fluency was likely the most salient barrier to valid reading assessment for Val, and subsequently placed Val in category 1, “Fluency limitations obscure comprehension skills.” Ms. Matthews provided two sources of evidence to support her description of Val’s reading. First she shared literature tests with short answers and “fill in the blank” questions, and noted that Val often skips over difficult questions. Ms. Matthews also shared a sample of a Gray Oral Reading Test taken by Val, in which she scored at the 2nd percentile as compared to her peers. In an interview with a researcher, Val indicated that “long books freak me out,” that longer words are more difficult for her, and that she does not like reading in general because “it’s just hard.” On the CBM, Val obtained a median oral reading fluency of 97 WPM as compared to the fifth grade mean of 140. This measure of her reading fluency appeared to be affected more by inaccuracy than by reading rate because she had made numerous errors. After listening to an audio presentation of the reading passage taken from a state reading assessment, Val was instructed to summarize the story orally. Her oral summary included 10 out of the approximately 25 details potentially included, and touched on the main events in the progression of the narrative. Based on convergent evidence from the interview with the teacher, the interview with Val, CBM-R probes, and a brief assessment activity, researchers agreed with Ms. Matthew’s description of Val as a student whose fluency limitations obscure comprehension skills. Teacher descriptions of Val (from questionnaire and interview responses) were supported both by teacher-provided evidence indicating low scores in comprehension and by CBM scores indicating poor fluency and decoding. Val’s oral summary of a story read out loud indicated a substantially better level of comprehension than scores from teacher-provided reading tests would suggest. Nevertheless, the specific reason why Val is less accurately measured remains less clear. Val’s summary included most main points from beginning to end, but lacked other details relevant to the story (such as statements about character motives). It could be that Val had difficulties in comprehension that were not related to decoding and fluency; more information would be necessary in order to make that determination. NatalieNatalie is a Caucasian female in the fourth grade attending a suburban school. At the time of the study, Natalie was not receiving special education services. Natalie’s teacher, Ms. Patton, initially rated Natalie a one (little effect) in “fluency obscuring reading skills” and a three (some effect) in “responds poorly to testing circumstances.” However, after discussion with the researcher, Ms. Patton decided that low fluency was likely the most salient reason Natalie’s test scores underestimated her ability. Ms. Patton reported that Natalie performs well above her peers in discussing and comprehending literature, but below in fluency. Additionally, Ms. Patton reported that Natalie’s in-class quizzes and skill practices results do not show the high level of comprehension and insight that she shows orally in class. During the interview with a researcher, Ms. Patton rated fluency a four (relatively large effect) and comprehension a three (some effect) in factors contributing to low reading test scores. Ms. Patton rated all of the affective factors at two (relatively little effect) (motivation, keeping attention focused, getting worn out, and anxiety), indicating that these did not seem to be major concerns for Natalie. Ms. Patton provided Natalie’s NWEA scores as evidence of test inaccuracy. Natalie scored in the 34th percentile of her class, which appears to be an underestimate compared to Natalie’s reported verbal performance in class. During her interview, Natalie reported that she reads quite a bit, likes reading a lot, and that reading is not very difficult for her. Natalie’s median CBM score was 106, which is in the low average range compared to the national fourth grade mean of 128. For her brief assessment, Natalie received an audio presentation of a grade-level passage. She answered all five multiple choice comprehension questions correctly. The evidence gathered by researchers seems to converge with Ms. Patton’s descriptions of Natalie and evidence that she is a LAMS. It appears that Natalie’s low fluency (106 WPM) may obscure her comprehension as evidenced on low standardized test scores while an audio passage presentation resulted in her answering all comprehension questions correctly. However, the researcher made a mistake in giving Natalie the written comprehension questions. Protocol called for students who were classified in the fluency obscuring comprehension category to complete an oral retell. Because Natalie was required to read the comprehension questions that she successfully answered, the extent to which fluency obscures comprehension is unclear. The researchers tentatively concluded that Natalie’s teacher probably correctly identified her as a LAMS as a student whose low fluency obscures comprehension skills on tests. Although Natalie’s reading strengths and weaknesses in reading tests appeared to be fairly straight-forward, the discrepancy between her ability and her test scores appeared to be relatively small. More information is necessary to further examine the potential discrepancy between Natalie’s skills and test scores. SamSam was a fourth grade African American male attending a suburban elementary school. Initially, Sam’s teacher, Ms. Smith classified him as a LAMS due to the confounding effect of comprehension limitations on other tested skills. However, during an interview, Ms. Smith focused primarily on his motivational barriers to performance and low reading fluency. Ms. Smith noted that she believes she makes Sam nervous, and that his performance in the classroom may be affected by this anxiety. However, Ms. Smith remained consistent in classifying Sam as a student whose comprehension limitations obscure other reading skills. Ms. Smith provided two Scott Foresman Benchmark tests as evidence of Sam’s work. Sam’s performance on these measures was low in all tested skills: comprehension, vocabulary, grammar, and constructed response. Sam reported that he likes to read magazines. He said that long and unfamiliar words are hard for him and that more interesting passages, having the entire passage read out loud to him, and having the ability to choose specific words to be read out loud would make reading tests better. Sam obtained a median oral reading fluency rate of 119 WPM as compared to the national fourth grade mean of 128. During the brief assessment session, Sam read a grade-level passage and then retold the story. Sam’s retell was fairly thorough; he recalled roughly 14 out of 25 ideas and details. Some components of his retell indicated incomplete comprehension of the story, but his performance was slightly better than might have been expected based on the Scott Foresman Benchmarks tests provided by Ms. Smith. Sam’s performance on the oral retell may suggest that his reading skills are higher than his standardized reading test scores indicate. Additionally, because the brief assessment was relatively informal, Sam’s improved performance may be due to decreased anxiety. However, we did not obtain strong enough evidence to confidently conclude that Sam’s scores would be significantly different under ideally accessible conditions. Finally, it is difficult to ascertain to what degree Sam’s test anxiety and low comprehension serve as barriers to inaccurate scores. RodRod was a fourth grade Asian male student. Rod received a half an hour of pull-out reading instruction with a reading teacher every day. His homeroom teacher, Ms. Brandt, said that Rod performs better in material that is about topics he is familiar with and when he can show comprehension via oral responding. She argued that Rod had strengths outside of what most reading tests cover in that Rod is better at showing comprehension orally and has strong comprehension in material that interests him such as history. Ms. Brandt provided examples of Rod’s in-class verbal summaries of characters in reading assignments that showed Rod’s good comprehension and an NWEA test that showed that Rod scored below the national mean (197 compared to 204). During the interview, Rod said that he would do better on tests about history because he knew more about it and was more interested in it, consistent with Ms. Brandt’s description of him. Rod read 95 WPM, compared to the national fourth grade mean of 128. When Rod was given an audio presentation of a grade-level passage, he answered four out of five comprehension questions correctly. Although the researchers found evidence that Rod does respond better to material that he is interested in and familiar with, they did not find evidence that Rod shows comprehension better orally. It was difficult to discern what other factors may be obscuring Rob’s test scores because evidence suggests additional factors as possibilities (low fluency, low persistence). Furthermore, if there is a legitimate discrepancy between Rod’s true ability and his test scores, it does not appear to be large. Researchers concluded that Rod could be a LAMS, but such a characterization would be marginal and the specific reasons why might not be clear. JackieJackie was a Caucasian female in the sixth grade at a private school for students with identified learning disabilities in an urban setting. Jackie’s teacher, Ms. Aber, rated Jackie a five in “comprehension limitations obscure other reading skills” on the initial questionnaire. Ms. Aber reported that Jackie had strong fluency but rushed through comprehension questions without using strategies such as checking back in the text for information. Further, Ms. Aber reported that Jackie seemed to read for memorization versus inference generation. Ms. Aber provided a Gray Silent Reading test as evidence of her description. The test indicated that Jackie was performing at the 18th percentile but had fluency of between 107 and 144 WPM. In class reading comprehension questions showed that Jackie typically answered about 25% of the questions correctly. Pending corrective feedback from her teacher and an opportunity to make corrections, Jackie could significantly improve her score. During the interview, Jackie reported that reading is not challenging for her but can be boring if it is not challenging enough. She liked the idea of shorter passages, computer based reading tests, and technological assistance for word recognition. On the CBM, Jackie obtained a median of 171 WPM compared to the national sixth grade mean of 154. However, Jackie’s CBM score should be interpreted with caution because it was obtained while reading a passage at the fourth grade level instead of at the sixth grade level as was the case with the norm sample. After reading a fourth grade level text, Jackie retold approximately 11 of 25 elements of the story. Jackie appears to be very fluent and able to demonstrate at least adequate text-level comprehension, although her test scores do not reflect this. Her comparatively high rate of fluency and her lower performance on traditional tests of reading comprehension support Ms. Aber’s observation that Jackie ‘rushes through’ reading tasks. However, it is difficult to determine whether Jackie’s tendency to rush through reading tasks reflects impulsivity, a disability, or low motivation. Because Jackie could demonstrate fairly complete recall and comprehension orally after reading a short story, researchers generally agreed with Ms. Aber regarding her identification of Jackie as a LAMS, but did not necessarily agree that specific comprehension limitations obscure other tested skills. SummaryGiven the constraints of this study, we tended to agree with 14 out of 20 teacher nominations of students as LAMS and tended to disagree with 6 of the 20. For 3 of the 14 students about whom we agreed, we saw evidence that we found strong enough to conclude that the students were clearly LAMS. For 11 of the 14, we found the teachers’ descriptions persuasive enough, despite sometimes limited supporting evidence, that we concluded there was a reasonable possibility that those 14 students were LAMS. For three of the six students about whom we disagreed with teachers, although we saw evidence that supported the teachers’ descriptions of students’ characteristics, those characteristics did not fit our definition of a less accurately measured student. For the remaining three students, the characteristics that teachers described might have identified the students as LAMS, but the evidence we saw seemed to contradict that designation. Table of Contents | Top of Page DiscussionSeeking changes in assessment practices that might improve their impact on learning for some students runs the risk of introducing changes that might actually harm the learning for those or other students. In particular, assessment specialists need to avoid lowering standards in the effort to help more students show what they know. Research to date on accommodations and principles of universal assessment design has been able to find ways of accomplishing this by removing or reducing many sources of construct irrelevant variance. To push beyond what has been accomplished so far, research on accessible reading assessment needs to be able to make finer distinctions about which characteristics and which students require what kinds of changes in assessment practices. A way of thinking about which students need accessible reading assessment that provides a finer grain than gross categorizations such as “students with disabilities” is to focus on those students who seem most likely to be less accurately measured by typical assessment practices than other students. For convenience, these less accurately measured students have been referred with the abbreviation of “LAMS.” In theory, focusing on LAMS seems to be a sound strategy for research on accessible assessment. Being able to identify LAMS and clarify the reasons they are less accurately assessed should help improve assessment. The challenge is finding an efficient way to identify LAMS. Teachers’ attitudes reported in the literature about the limitations of assessment indicate that teachers claim to have insights into student achievement that assessments sometimes miss. On the other hand, the research literature indicates that there are questions about teacher judgments of student achievement. We concluded that the potential value of teachers providing at least a starting point in identifying LAMS merited a study to investigate this option. This study sought to probe teachers’ ability to identify LAMS and to see what might be learned from a small scale study about student characteristics that may be barriers to accurate reading measurement. For the most part, teachers were able to understand and complete the relatively novel task of nominating students who might be less accurately measured than other students by typical reading tests. The majority of the students they nominated as LAMS seemed to have characteristics that suggested the students might in fact be less accurately measured. On the other hand, there were some clear misses. In some cases, teachers had difficulty fitting their students into the study’s framework. That is, teachers demonstrated that they could understand and describe the student but found difficulty in determining which of the five barrier categories fit the student best. Researchers also noted that teachers working in the same building often described students using the same frameworks, possibly as a result of similar curriculum or training. Results suggest that the teachers were able to differentiate between the heterogeneous needs of different students. Of the seven teachers who nominated more than one student, six nominated students for different categories. There were not large discrepancies in the strength of evidence found for teachers’ descriptions across teachers. There were, however, discrepancies in the strength of evidence gathered for barrier category. This is probably both because it is easier to gather evidence on some characteristics than on others and because this study was initially designed to look most closely at certain characteristics so less provision was made for collecting evidence about others. We also hoped that despite the small sample size, this study would give an initial look at characteristics of students who may benefit the most from accessible reading assessments using teacher judgments. Our results suggest that LAMS are on a spectrum of varying degrees of test score accuracy and have different barriers. Most students appeared to have multiple barriers. For many students, a major barrier was either low fluency or low comprehension and another barrier was affective, such as anxiety or low motivation. It is likely that these cognitive and affective barriers frequently interconnected. In order to accurately measure these students, both barriers need to be addressed. Some of the strongest evidence suggests that fluency is a significant barrier for students on reading tests. Future research needs to develop assessment procedures that allow students to show comprehension independent of fluency. Possibilities include presenting text via audio and allowing students to access definitions of words. Another barrier that was not stipulated on our research tools but which a number of teachers brought up was assessment methods such the distinctions between multiple choice and open ended responses, written versus verbal response formats, and weakness in fictional material that has no pictures. Much can be learned from this study that might be used to improve future research in this area. First, some teachers provided inconsistent descriptions of students across the initial questionnaire and the interview. These teachers changed their classification of students or reported having difficulty choosing a category. Teachers had difficulty determining why the students were less accurately measured or teasing apart several factors—usually a combination of both academic and affective barriers. Additionally, some students’ barriers could be viewed within the research framework from multiple perspectives which made it difficult to determine which classification was the most appropriate. Providing this study as background information could help frame the task better for teachers. Also, having teachers rate students on a profile of characteristics at the outset instead of initially asking them to assign students to classifications should make it easier for teachers to do this task more consistently and successfully. Second, some of the assessment evidence obtained by the researchers was weak because the results were inconclusive or because information such as the student’s most recent standardized reading test score was not available. Also, locally normed CBM-R benchmark data were not available from the participating schools. Students’ oral reading fluency rates as measured by words read per minute (WPM) were compared to national norms which may not be consistent with local norms at each school. Third, methodology limitations weakened some of the evidence because in some cases, evidence available was not sufficiently aligned with the student’s characteristics. Future researchers should consider expanding the types of brief assessments administered to search for evidence of student barriers. For example, researchers should consider administering an assessment to evaluate student’s anxiety during the brief assessment procedures. Finally, it is recommended that researchers assess students who may have several barriers with multiple assessments to evaluate which barriers are the most salient. ConclusionThe possibility of using teachers to identify LAMS seems promising. Teachers seemed able to complete the task in this study; building on this study seemed likely to make teachers more successful in future efforts in this area. Future work is not expected to conclude that teacher judgment is sufficient as the final word in identifying students as LAMS. Rather, if future research supports this finding, teachers might be able to serve as an initial way of identifying students who are high probability of being LAMS but additional evidence would likely be gathered to confirm teacher nominations. We also have gained from this small sample of teachers and students a better understanding of some characteristics that might be barriers to accurate assessment. Confirming and refining our understanding of the interplay between cognitive and affective factors that hinder student performance on achievement tests could lead to assessment practices that give a clearer understanding of their reading strengths and weaknesses. Table of Contents | Top of Page ReferencesAbedi, J. (2006). Language issues in item-development. In S. M. Downing & T. M. Haladyna (Eds.), Handbook of test development (pp. 377-398). Mahwah, NJ: Erlbaum. Abrams, L. M., Pedulla, J. J., & Madaus, G. F. (2003). Views from the classroom: Teachers’ opinions of statewide testing programs. Theory Into Practice, 42(1), 18–29. Ægisdóttir, S., White, M. J., Spengler, P. M., Maugherman, A. S., Anderson, L. A., Cook, R. S., et al. (2006). The meta-analysis of clinical judgment project: Fifty-six years of accumulated research on clinical versus statistical prediction. The Counseling Psychologist, 34, 341–382. AERA, APA, & NCME (1999). Standards for educational and psychological testing. Washington, DC: American Psychological Association. American Psychological Association. (2008). Assessment centers help companies identify future managers. Psychology matters. Retrieved August 29, 2008, from http://psychologymatters.apa.org/ Bailey, A., & Drummond, K. (2006). Who is at risk and why? Teachers’ reasons for concern and their understanding and assessment of early literacy. Educational Assessment, 11(3 & 4), 149–178. Black, P., & Wiliam, D. (1998). Assessment and classroom learning. Assessment in Education, 5(1), 7–74. Bradley, D. F., & Calvin, M. B. (1998). Grading modified assignments: Equity or compromise? Teaching Exceptional Children, 31(2), 24–29. Brookhart, S. M. (2003). Developing measurement theory for classroom assessment purposes and uses. Educational Measurement: Issues and Practice, 22(4), 5–12. Campbell, D. T., & Fiske, D. W. (1959). Convergent and discriminant validation by the multitrait-multimethod matrix. Psychological Bulletin, 56, 81–105. Cizek, G. J. (2001). More unintended consequences of high-stakes testing. Educational Measurement: Issues and Practice, 20(4), 19–27. Cizek, G. J., Fitzgerald, S. M., & Rachor, R. A. (1995). Teachers’ assessment practices: preparation, isolation, and kitchen sink. Educational Assessment, 3(2), 159–179. Cleveland, L. (2007). Surviving the reading assessment paradox. Teacher Librarian. 35(2), 23–27. Coladarci, T. (1986). Accuracy of teacher judgments of student responses to standardized test items. Journal of Educational Psychology, 78, 141–146. Cormier, D. C., Altman, J. R., Shyyan, V., & Thurlow, M. L. (2010). A summary of the research on the effects of test accommodations: 2007-2008 (Technical Report 56). Minneapolis, MN: University of Minnesota, National Center on Educational Outcomes. Demaray, M. K., & Elliott, S. N. (1998). Teachers’ judgments of students’ academic functioning: a comparison of actual and predicted performances. School Psychology Quarterly, 13(1), 8–24. DeStefano, L., Shriner, J. G., & Lloyd, C. A. (2001). Teacher decision making in participation of students with disabilities in large-scale assessments. Exceptional Children, 68, 7–22. Dolan, R. P., &Hall, T. E. (2001). Universal design for learning: Implications for large-scale assessment. IDA Perspectives, 27(4), 22–25. Eckert, T. L., Dunn, E. K., Codding, R. S., Begeny, J. C., & Kleinmann, A. E. (2006). Assessment of mathematics and reading performance: An examination of the correspondence between direct assessment of student performance and teacher report. Psychology in the Schools, 43, 247–265. Feinberg, A. B., & Shapiro, E. S. (2003). Accuracy of teacher judgments in predicting oral reading fluency. School Psychology Quarterly, 18, 52–65. Fuchs, L. S., Fuchs, D., & Capizzi, A. M. (2005). Identifying appropriate test accommodations for students with learning disabilities. Focus on Exceptional Children, 37, 1–8. Fuchs, L. S., Fuchs, D., Eaton, S. B., Hamlett, C., Binkley, E., & Crouch, R. (2000). Using objective data sources to enhance teacher judgments about test accommodations. Exceptional Children, 67, 67–81. Fuchs, L., S., & Fuchs, D. (2001). Helping teachers formulate sound test accommodation decisions for students with learning disabilities. Learning Disabilities Research & Practice, 16, 174–181. Gresham, F. M., MacMillan, D. L. & Bocian, K. M. (1997). Teachers as “tests”: differential validity of teacher judgments in identifying students at-risk for learning difficulties. The School Psychology Review, 26(1), 47–60. Haladyna, T. M., & Downing, S. M. (2004). Construct-irrelevant variance in high-stakes testing. Educational Measurement: Issues and Practice, 23(1), 17–27. Helwig, R., & Tindal, G. (2003). An experimental analysis of accommodation decisions on large-scale mathematics tests. Exceptional Children, 69, 211–225. Higgins, E. L., & Raskind, M. H. (2005). The compensatory effectiveness of the Quictionary Reading Pen II on the reading comprehension of students with learning disabilities. Journal of Special Education Technology, 20(1), 31–40. Hoge, R. D., & Coladarci, T. (1989). Teacher-based judgments of academic achievement: A review of literature. Review of Educational Research, 59, 297–313. Hollenbeck, K., Tindal, G., & Almond, P. (1998). Teachers’ knowledge of accommodations as a validity issue in high-stakes testing. The Journal of Special Education, 32, 175–183. Johnstone, C. J., Altman, J., Thurlow, M. L., & Thompson, S. J. (2006). A summary of research on the eff ects of test accommodations: 2002 through 2004 (Technical Report 45). Minneapolis, MN: University of Minnesota, National Center on Educational Outcomes. Johnstone, C. J., Thompson, S. J., Bottsford-Miller, N. A., & Thurlow, M. L. (2008). Universal design and multi-method approaches to item review. Educational Measurement: Issues and Practice, 27(1), 25–36. McDonnell, L. M., & McLaughlin, M. J. (1997). Educating one & all: Students with disabilities and standards-based reform. Washington, DC: National Academy of Sciences, National Research Council. Meehl, P. E. (1954). Clinical versus statistical predication: A theoretical analysis and review of the evidence. Minneapolis: University of Minnesota Press. Minnesota Department of Education (2008). Minnesota manual of accommodations for students with disabilities in instruction and assessment – A guide to selecting, administering, and evaluating the use of accommodations: Training guide. Roseville, MN: Author. Moen, R., Liu, K., Thurlow, M., Lekwa, A., Scullin, S., & Hausmann, K. (2009). Identifying less accurately measured students. Journal of Applied Testing Technology, 10(2). Moss, P. A. (2003). Reconceptualizing validity for classroom assessment. Educational Measurement: Issues and Practice, 22(4), 13–25. National Research Council. (2003). Assessment in support of instruction and learning: Bridging the gap between large-scale and classroom assessment. Workshop report. Committee on Assessment in Support of Instruction and Learning. Board on Testing and Assessment, Committee on Science Education K-12, Mathematical Sciences Education Board. Center for Education. Division of Behavioral and Social Sciences and Education. Washington, DC: The National Academies Press. New England Compact. (2007). Reaching students in the gaps: A study of assessment gaps, students, and alternatives (Grant CFDA #84.368 of the U.S. Department of Education, Office of Elementary and Secondary Education, awarded to the Rhode Island Department of Education). Newton, MA: Education Development Center, Inc. Noble, J., & Sawyer, R. (2002). Predicting different levels of academic success in college using high school GPA and ACT composite score. ACT Research Report Series, 2002-4. Ornstein, A. C. (1994). Grading practices and policies: An overview and some suggestions. NASSP Bulletin, 78(561), 55–64. Perry, N. E., & Meisels, S. J. (1996). How accurate are teacher judgments of students’ academic performance? National Center for Education Statistics Working Paper Series [No. 96-08]. U.S. Department of Education, Office of Educational Research and Improvement. Perry, N. E., & Meisels, S. J. (1996). How accurate are teacher judgments of students’ academic performance? National Center for Education Statistics Working Paper Series [No. 96-08]. U.S. Department of Education, Office of Educational Research and Improvement. Pike, G. R., & Saupe, J. L. (2002). Does high school matter? An analysis of three methods of predicting first year grades. Research in Higher Education, 43(2), 187–207. Popham, W. J. (2007). Instructional Insensitivity of tests: Accountability’s Dire Drawback. Phi Delta Kappan, 89(2), 146–150. President’s Commission on Excellence in Special Education. (2002). A new era: Revitalizing special education for children and their families. Washington, DC: U.S. Department of Education, Office of Special Education and Rehabilitative Services. Price, F. W., & Kim, S. H. (1976). The association of college performance with high school grades and college entrance test scores. Educational and Psychological Measurement, 36, 965–970. Prime numbers. (2006). Teacher Magazine, 17(5), 5–10. Quenemoen, R. F., Lehr, C. A., Thurlow, M. L., & Massanari, C. B. (2001). Students with disabilities in standards-based assesment and accountability systems: Emerging issues, strategies, and recommendations (Synthesis Report 37). Minneapolis, MN: University of Minnesota, National Center on Educational Outcomes. Shepard, L. A. (2000). The role of assessment in a learning culture. Educational Researcher, 29(7), 4–14. Shinn, M. R., & Shinn, M. M. (2002). AIMSWeb training workbook. Eden Prairie, MN: Edformation, Inc. Sireci, S. G., Scarpati, S. E., & Li, S. (2005). Test accommodations for students with disabilities: An analysis of the interaction hypothesis. Review of Educational Research, 75(4), 457–490. Thompson, S., Blount, A., & Thurlow, M. (2002). A summary of research on the effects of test accommodations: 1999 through 2001 (Technical Report 34). Minneapolis, MN: University of Minnesota, National Center on Educational Outcomes. Thompson, S. J., Thurlow, M. L., & Malouf, D. (2004, May). Creating better tests for everyone through universally designed assessments. Journal of Applied Testing Technology in http:// www.testpublishers.org/atp.journal.htm Thurlow, M. L., Johnstone, C., & Ketterlin Geller, L. (2008). Universal design of assessment. In S. Burgstahler & R. Cory (Eds.), Universal design in post-secondary education: From principles to practice (pp. 73-81). Cambridge, MA: Harvard Education Press. Thurlow, M. L., Laitusis, C. C., Dillon, D. R., Cook, L. L., Moen, R. E., Abedi, J., & O’Brien, D. G. (2009). Accessibility principles for reading assessments. Minneapolis, MN: National Accessible Reading Assessment Projects. Thurlow, M. L., Moen, R. E., Lekwa, A. J., & Scullin, S. B. (2010). Examination of a reading pen as a partial auditory accommodation for reading assessment. Minneapolis, MN: University of Minnesota, Partnership for Accessible Reading Assessment. Thurlow, M. L., Moen, R. E., Liu, K. K., Scullin, S., Hausmann, K., & Shyyan, V. (2009). Disabilities and reading: Understanding the effects of disabilities and their relationship to reading. Minneapolis, MN: University of Minnesota, Partnership for Accessible Reading Assessment. Thurlow, M. L., Thompson, S. J., & Lazarus, S. S. (2006). Considerations for the administration of tests to special needs students: Accommodations, modifications, and more. In S. M. Downing & T. M. Haladyna (Eds.), Handbook of test development. Mahwah, NJ: Lawrence Erlbaum. Thurlow, M. L., Ysseldyke, J. E., & Silverstein, B. (1995). Testing accommodations for students with disabilities. Remedial and Special Education, 16 (5), 260-270. Washington Office of Public Instruction. (2008). Washington state’s accommodations guidelines for students with disabilities. Olympia, WA: Office of Superintendent of Public Instruction. Willingham, W. W. (1985). Success in college: The role of personal qualities and academic ability. New York: College Entrance Examination Board. Willingham, W. W., & Breland, H. M. (1982). Personal qualities and college admissions. New York: College Entrance Examination Board. Zenisky, A. L., & Sireci, S. G. (2007). A summary of the research on the effects of test accommodations: 2005-2006 (Technical Report 47). Minneapolis, MN: University of Minnesota, National Center on Educational Outcomes. Table of Contents | Top of Page Appendix A: Teacher QuestionnaireProblems with Reading Tests Some students may have reading skills that are not adequately measured by the typical annual reading test. Here are four reasons why a student’s score on an annual reading test might give an inaccurate or incomplete picture of the student’s reading: 1. Fluency limitations obscure comprehension skills. 2. Comprehension limitations obscure other reading skills. 3. Weakness in tested skills hides non-test reading strengths. 4. Responds poorly to standardized testing circumstances or materials. Completing the Questionnaire If you can describe one or more such students that you have this year on the other side of this page, please give us information about your school and yourself here: State: District: School: Your position: Your name: Now turn the page over to give information about students you have this year who may be inadequately measured by the typical annual reading test. Problems with Reading Tests Can you think of students you have this year whose reading skills would not be adequately measured by the typical annual reading test? If you can think of such students, make up a name (a pseudonym) for each of them that you can use to identify the student but that would not reveal who the student is to anyone else. For each of these students, write the pseudonym(s) under the reason listed below that would most affect that student’s reading test score. (Read the description of these reasons on the other side if you have not done that.) You may add your own reasons if our list seems to be missing something important. For each student you identify, rate on a scale from 1 to 5 how badly a typical annual test score would misrepresent the student’s reading. Use 1 to indicate that the test would be a little off and 5 to indicate that the test would be way off. Then describe the student to give a clearer understanding of why the typical annual test would be a poor measure of the student’s reading. 1. Fluency limitations obscure comprehension skills. 2. Comprehension limitations obscure other reading skills. 3. Weakness in tested reading skills hides non-test reading strengths. 4. Responds poorly to standardized testing circumstances or materials. 5. Other reasons: Table of Contents | Top of Page Appendix B: Teacher Interview Questions1. Tell me more about this student and why you think the state reading test is a poor measure of the student’s reading ability. 2. What evidence can you show or describe that could document what you have said about this student? 3. Please rate how much you think each of the following affects this student’s scores on the state reading test:
4. How confident are you about the answers you gave on the questionnaire regarding this student? Would a different category or explanation serve just as well or even better than the one you gave then?
5. Do you have anything else you would like to say about reading assessment for this student or a related topic?
Table of Contents | Top of Page Appendix C. Student Interview Questions1. Tell me a little about what you do when you are not at school. Use the scale shown below in answering the rest of the questions:
2. ____ How much do you read that is not for school?
3. ____ How much do you like reading?
Does it depend on what you are reading?
4. ____ How hard is reading for you?
What do you do to make reading easier?
Continue using the scale that is shown above.
5. ____ How well do reading tests that you take once a year show what your reading is like?
6. How much do you think the following things would help you on a reading test? Please comment on what you would like or not like about each of these ideas.
|
|||||||||||||||||||||||||||||||||||||||||||||||||||||||||||||||||||||||||||||||||||||||||||||||||||||||||||||||||||||||||||||||||||||||||||||||||||||||||||||||||||||||||||||||||||||||||||||||||||||||||||||||||||||||||||||||||||||||||||||||||||||||||||||||||||||||||||||||||||||||||||||||||||||||||||||||||||||||||||||||||||||||||||||||||||||||||||||||||||||||||||||||||||||||||||||||||||||||||||||||||||||||||||||||||||||||||