Prepared by John Bielinski, Martha Thurlow, Jane Minnema, and Jim Scott
March 2002
This document has been archived by NCEO because some of the information it contains may be out of date.
Any or all portions of this document may be reproduced and distributed without prior permission, provided the source is cited as:
Bielinski, J., Thurlow, M., Minnema, J., & Scott, J. (2002). Scale score comparability across two levels of a norm-referenced math computation test for students with learning disabilities (Out-of-Level Testing Project Report 8). Minneapolis, MN: University of Minnesota, National Center on Educational Outcomes. Retrieved [today's date], from the World Wide Web: http://cehd.umn.edu/NCEO/OnlinePubs/OOLT8.html
Out-of-level testing is the practice of giving students
a test intended for students in a lower (or higher) grade. Fourteen states
currently permit out-of-level testing in their statewide testing programs. This number has risen dramatically since
1999, despite growing concern about the implications for students who take an
out-of-level test instead of the on-grade level test. Among the concerns are the possibility that: (a) the
out-of-level test may not represent a sound measure of performance against state
standards, (b) out-of-level testing may result in lowered expectations, and (c)
the score a student receives on the out-of-level test may not be comparable to
the score the student would have obtained on the in-level test. The present study addresses the third concern using a
norm-referenced test and does not address the first two concerns.
In this study, special education teachers identified
students with learning disabilities who were working on math skills usually
taught two grades prior to the grade in which the student was enrolled. Each student took two levels of the
MAT/7 math computation test, an on-grade test and an out-of-level test intended
for students two grades below the grade in which the students in this study were
enrolled. All levels of the MAT/7 are
statistically linked to permit score comparisons across levels.
On average, the students in this study obtained a higher
scale score on the on-grade test (mean = 557) than on the out-of-level test
(mean = 541). When we made a
correction for random guessing, the mean scale score on the on-grade test (mean
= 535) was lower than the mean scale score on the out-of-level test (mean =
550), although the difference was not statistically significant.
More of the scores on the out-of-level test (N = 16) fell in the test’s reliable
score range (45%-75% correct) than did scores on the on-grade test (N=7).
After completing each test, we asked the students to
rate how hard and how frustrating the test was for them. Ratings of test difficulty and
frustration did not differ for the out-of-level and in-level tests.
Generally, the students rated both tests as being fairly easy.
Two preliminary conclusions can be drawn from this
study. First, it appears that the
on-grade test was too difficult for many of these students.
This suggests that these students probably had less exposure to the kinds of
skills assessed on the on-grade test than on the out-of-level test. The higher average scale score for the
on-level test compared to the out-of-level test probably was related to the
occurrence of guessing. Students appeared to guess more on the
on-grade level test than on the out-of-level test, even though we had instructed
them to skip questions they did not understand.
A second preliminary conclusion is that performance on the out-of-level test
appeared more often to be within the reliable range of the test.
These conclusions are considered preliminary because of the small number of
students in the study, complicated by the fact that to adjust for guessing we
had to exclude more than half of the sudents from our analyses.
Also, preliminary conclusions apply only to norm-referenced tests that are
vertically linked across levels.
It is important to pay attention to the suggestion that
students may have had less exposure to the skills assessed on the on-grade test.
As standards-based reform is fully implemented, the issue of students not having
exposure to grade-level content will need to be examined. One possible concern
is that students who fall behind are then provided remedial instruction that
limits their access to grade level content. Methods used to support students who
are struggling may need to change so that fewer students are missing essential
grade level content.
Prior to the 1994 reauthorization of the Elementary and
Secondary Education Act (ESEA), the effectiveness of Title I programs was
determined by performance gains from fall to spring testing. Growth generally was measured with
off-the-shelf norm-referenced tests.
In order to show growth, it was deemed important to measure students as closely
as possible to the grade level of the content on which they were being
instructed. For many
students, the test they took was intended to measure skills taught in a grade
below the student’s actual grade.
This practice of administering a level of a test to a student that is below the
level (or above the level) generally recommended by the test publisher for that
student based on his or her grade is called out-of-level testing (Study Group on
Alternate Assessment, 1999, p. 20).
The reauthorization of ESEA in 1994 shifted the focus of
program effectiveness from achievement score gains to performance against
standards. Under the
reauthorization, states were required to create academic standards and develop
tests that were aligned specifically to those standards.
Student performance was to be reported as a proficiency level, not just a test
score, and states were required to report results for students with disabilities
both in the aggregate as well as disaggregated.
From these requirements emerged statewide testing programs in which assessments
were designed to measure student performance on the state’s standards.
To date, results from these new standards-based assessments show that students
with disabilities are much more likely than their peers without disabilities to
perform below the state proficiency level (Ysseldyke, Thurlow, Langenfeld,
Nelson, Teelucksingh, & Seyfarth, 1998).
Furthermore, this finding has remained steady across years.
States have seen relatively small changes in the proportion of students with
disabilities scoring above proficiency.
This has led to a growing concern that the tests are not sensitive to
performance gains in the lowest proficiency levels.
In response to this and other concerns, several states have decided to allow
out-of-level testing (Minnema, Thurlow, & Scott, 2001).
The rationale for incorporating an out-of-level testing option in a state
assessment program seems to be that out-of-level testing will improve the
accuracy of measurement for low performing students and, thus, may also improve
the sensitivity of tests to performance gains.
Several issues emerge with the practice of out-of-level
testing. One is the possibility
that out-of-level testing will result in lower expectations for students. Another is the likelihood that testing
conditions may be more chaotic with groups of students taking a wide array of
different tests at the same time.
There is also concern that nearly all students with disabilities will be
assigned to lower levels of the test even when prior achievement indicates that
they should receive a higher level.
An emerging question is whether the scores from an
out-of-level test have the same meaning as the scores from the in-level test. Test score comparability is an essential
component of any large-scale assessment program.
At a minimum, out-of-level tests must be linked to the in-level test, ideally
with a high degree of overlap between the out-of-level and the in-level test of
concepts and skills, as well as the actual test items.
Linking studies should include a high percentage of students from the
populations likely to take the out-of-level test, such as students with
disabilities; otherwise, it may not be appropriate to generalize the adequacy of
the vertical scaling to students from these populations.
States that allow out-of-level testing generally have
not conducted linking studies.
Often, they rely on the test developer to provide the rationale for out-of-level
testing. In those states where an off-the-shelf
test is used, they rely on the linking studies conducted by the test publisher
during the national norming phase of test development.
Many other states incorporate a set of normed items into their standards-based
assessments, and thus – hypothetically – might use those links to apply to their
tests so that scores from all levels can be reported on a common scale.
One of the shortcomings of relying on the linking studies conducted by
commercial test developers is that students with disabilities comprise only a
small fraction of the participants in these studies (Harcourt Brace Educational
Measurement, 1997). Therefore, the adequacy of the linking
studies for students with disabilities is not completely known.
It is necessary to demonstrate scale score comparability across test levels for
students with disabilities, especially because it is likely that many students
with disabilities would be assigned to an out-of-level test.
Theoretically, when tests are vertically scaled so that
a single score scale spans the range of test levels, an examinee should obtain
the same scale score regardless of the level of the test he or she takes. If an examinee obtained a scale score of
150 on the Level 3 test, he or she should also obtain a scale score of 150 on
Level 5. There are several conditions limiting
the comparability of the scores.
Some conditions can be manipulated by the test developer.
For instance, the test developer can ensure that there is a high degree of
overlap of test items between adjacent levels.
The test developer can also employ the best statistical methods for linking
tests, and the developer can ensure adequate sampling of students in the linking
study for best results. Regardless of the procedures the test
developer employs, the assessments will still be imperfect measures of the
constructs. In other words, every examinee’s score
will contain error, called measurement error. Therefore, the best one can expect
is that the scores an examinee obtains from different levels of the test will
fall within some range determined by the magnitude of the measurement error.
Scale scores can be considered comparable if the two scores fall within the
range bounded by one unit of measurement error. As an example consider a test in
which the average measurement error is 10 scale score points.
If an examinee obtains a score of 100 on Level 5, then the score the examinee
obtained on another test would be comparable if it fell within the range 100 +
10 (i.e., 90 – 110).
In addition to measurement error, guessing can influence
the degree of scale score comparability across levels. Unlike measurement error, which is
considered random, guessing has a tendency to bias scores upward.
When a student takes a multiple-choice test, there is the possibility that some
of the correct responses were obtained by simple guessing. Guessing poses a problem because
examinees may be more likely to guess on the harder test than on the easier
test. It is easy to see why this is likely to
be true. If a test is too hard for an examinee as indicated by getting very few
items correct, it is likely that he or she does not have the skills to answer
many of the items. If the examinee attempts to answer the items he or she does
not know how to do, then he or she must be guessing. Guessing on more of the items on the hard test than on the
easy test would have the effect of increasing the difference between the scale
scores. Because the goal of this study was to evaluate scale score comparability
across two levels of a test, this study reports results with and without a
correction for guessing.
A question that
often emerges is, “why give an out-of-level test if the score would be the same
as the score on the in-level test?”
Several reasons may be offered, but the reason that is most relevant to the
present study is that performance on an out-of-level test for a student who
would otherwise get very few items correct on the in-level test is a more
reliable and accurate estimate of the student’s ability.
The explanation for this lies in the fact that measurement error increases at
the test score extremes. Most off-the-shelf tests are designed so
that test performance is most reliably measured for examinees getting between
40% and 70% correct. Outside of this range, the reliability
of the score decreases as the score moves farther from this range.
Very low scores, say less than 25% correct are so contaminated with measurement
error that it is nearly impossible to say with any degree of confidence what the
student’s true ability is. One
purpose of out-of-level testing is to ensure that the test is matched to the
student’s ability so that performance falls within the range that scores are
reliably estimated. If the purpose of administering the test is to obtain a
score, rather than just to indicate whether or not the student has met a
specific proficiency criterion, this is very important.
There is a small research base on score comparability of
out-of-level versus in-level test performance (Cleland & Idstein, 1980; Long,
Schraffran, & Kellogg, 1977; Slaughter & Gallas, 1978). Cleland and Idstein examined scale score
comparability on students with disabilities. In that study, test performance was
measured on the normal curve equivalent scale. Seventy-four 6th
grade special education students took two levels of the 1977 edition of the
California Achievement Test. One group took the in-level test and the
test one level below, another group took the in-level test and the test two
levels below, and the third group took the test one-level below and the test two
levels below grade level. They found that the average normal curve equivalent score was
significantly higher on the in-level reading test than on either of the
out-of-level reading tests. In
mathematics, they found a significant difference only between the in-level test
and the test two levels below grade level.
They also found that a significantly greater percentage of the students scored
above the floor level on the out-of-level test of reading than on the in-level
test of reading; the difference was not statistically significant on the math
test. The authors concluded that
the possible detrimental effects of depressed scores on self-concept and the
political ramifications of lower scores may outweigh any benefit of out-of-level
testing.
Cleland and Idstein (1980) did not consider the issue of
which score was a more valid representation of what the students knew and could
do. Because the validity of a
multiple-choice test score is compromised by the presence of random guessing,
the effects of guessing were likely to be larger for the students taking a test
that was too hard for them than they are for students taking a test that matches
their ability. It is important to ask whether the
scale scores remain statistically lower on the out-of-level test if random
guessing is factored out of both the in-level test and the out-of-level test.
Long, Schaffran, and Kellogg (1977) compared
grade-equivalent scores for students participating in a Title I reading program. The sample of 482 students included
children in grades 2-6. Each
student took two levels of the Gates MacGinitie Reading Test, one level
corresponding to his or her grade level and the other corresponding to his or
her “functional” level. A student’s functional level was
determined by his or her score on the Botel Word Opposites Test. The findings of Long et al. painted a
mixed picture of score comparability across levels.
For students in 2nd and 3rd grade, the functional level test resulted
in significantly higher grade equivalent scores, but for students in grades 4,
5, and 6, the functional level test resulted in significantly lower grade
equivalent scores. The study also found that achievement
gains were consistently larger for all grade levels on the functional level
tests than on the grade level tests.
It is worth noting that although Long et al. made no attempt to adjust for
guessing in their analyses, even though they acknowledged that one of the issues
spurring the use of out-of-level testing was the concern that in-level scores
for low achieving students were contaminated by guessing.
A score comparability study by Slaughter and Gallas
(1978) also found a significant difference in scale scores between the in-level
test and a test two levels below grade level.
In that study, they gave both an in-level and an out-of-level test to 101 6th graders enrolled in a Title I school. They reported that 73% of the students
in their study performed in the reliable range of the test, defined as a raw
score between 25% and 75% correct.
On the surface, these results appear to corroborate the results of the studies
summarized above. However, these results better
demonstrate why it is problematic to base assignment to out-of-level tests on a
student characteristic such as being enrolled in a Title I school as opposed to
using prior performance or instructional level to assign students to an
out-of-level test. The fact that 80% of the students
scored above the floor on the in-level test suggests that many of these students
should not be taking an out-of-level test in the first place.
Although some school systems may have a practice of giving all Title I students
or all special education students an out-of-level test, this practice is not recommended by the test publishers.
Prior research on scale score comparability across test
levels for students with disabilities lacks two important characteristics: (1)
participants were not appropriately identified as candidates for out-of-level
testing, and (2) there was no adjustment for random guessing.
The participants in the Cleland and Idstein study (1980) were chosen without
regard to whether they actually were appropriate candidates for out-of-level
testing. Many students with disabilities may be performing at a level
for which out-of-level testing would not be justified. Assurance that results can be generalized to the population
of students who may be appropriate candidates for out-of-level testing requires
that studies draw participants from such samples. Appropriate assignment to an out-of-level test requires
knowledge of the level of instruction and performance in the classroom.
Locator tests may be good proxies for this information; whether they are
requires further study.
The other shortcoming of prior studies on out-of-level
testing is that there was no accounting for the effects of random guessing. The presence of guessing reduces the
accuracy of performance estimates, and thereby also reduces the validity of
inferences from those scores.
Observing significantly higher scores on an in-level test does not necessarily
mean that the out-of-level test is biased against the participants; instead it
may be that the in-level scores were biased because more random guessing is
likely to occur when the test is too hard for the examinee. An assumption that can be made is that
an examinee is probably guessing if he or she does not skip items for which he
or she does not know the correct answer. Simple formula scoring methods can be
applied to both the in-level and out-of-level item responses to adjust for the
effects of random guessing.
The present study avoids the two major pitfalls of
previous studies. First, we used a
specific method to obtain a sample of students with disabilities for whom an
out-of-level test seems to be warranted.
Second, we conducted scale score comparability analyses on both the observed
scale score and on a scale score adjusted for random guessing.
It is important to remember that we conducted our study
using a norm-referenced test with vertical linking across levels. The findings do not answer questions
about out-of-level testing when criterion-referenced tests without
vertically-linked levels are being used.
Research Questions
In this study we explore scale score comparability
across two levels of an off-the-shelf math computation test for students with
learning disabilities. We examine
three research questions:
(1)
Will the average scale score on the in-level test be the same as the average
scale score on the out-of-level test?
(2)
Will the average scale score on the in-level test and the out-of-level test,
after adjusting both sets of scores for random guessing, be the same?
(3)
Will students rate their test experience as more positive on the out-of-level
test than on the in-level test?
Participants
A pool of potential participants was identified by
special education teachers from five elementary schools in an urban school
district. To be eligible for
participation in the study, the students had to be:
•
enrolled in either 5th
or 6th grade
•
working on math skills more typical of the curriculum two grades below the
student’s nominal grade level – based on the judgments of students’ special
education teachers
•
receiving Level III or Level IV special education services, a moderate level of
support in a system with levels I (consultation) to VI (residential placement).
•
classified as having a learning disability
•
able to read and comprehend simple sentences – based on teacher judgment
Most of the students were receiving math instruction in
a self-contained classroom, separate from their in-grade level peers. A few participants were receiving
instruction at grade level, but were also receiving remedial instruction on
content and skills more typical of the curriculum two grades below their
assigned grade level. Parental consent to participate was
obtained from 34 students; 33 students actually participated in the study. Ten (30%) of the participants were
female, and 16 (48%) were in the 5th grade.
Instruments
The Math Procedures subtest of the Metropolitan
Achievement Test/7 (MAT7) was used in this study. The MAT7 was chosen for several reasons. First, the levels of the test are
vertically scaled so that performance on any one of them can be reported on a
common scale. Second, 50% of the items on these tests
are computation items, and the other 50% are simple word problems. Choosing a math computation test reduces
the concern of interference due to verbal complexity.
This is particularly important because many of the students in this study were
not reading at grade level. Third,
these tests are used in the school district from which these participants were
chosen.
Four levels of the test were used: Elementary 1,
Elementary 2, Intermediate 1, and Intermediate 2. Each test had 24 multiple-choice items, 12 of the items
were simple word problems and the remaining items were straight computation
problems. The Elementary 1 test contained
single-digit, two-digit, and three-digit integer addition and subtraction,
mixed-digit multiplication, and division in which one of the numbers was a
single digit. The Elementary 2 test had fewer
single-digit whole number addition and subtraction items, and more addition
items with decimals. It also had two addition/subtraction
items involving fractions with a common denominator.
The Intermediate 1 test adds to these skills division with two-digit divisors
and quotients with remainders, as well as addition with fractions that requires
finding a common denominator. The
Intermediate 2 test adds more problems with fractions and decimals. The 5th
grade participants took the Elementary 1 and Intermediate 1 tests, whereas the 6th grade participants took the Elementary 2
and Intermediate 2 tests.
Students also completed a brief survey after completing
each test. The five questions in
the survey are included in Appendix A. Participants were asked to rate the
difficulty of the test, their degree of frustration, and how many items they did
not know how to do. Participants were also asked
specifically whether the word problems were hard and whether they found it hard
to understand what the word problems were asking.
These questions were included because teachers informed us that although many
students could do the computation and could read basic text, they probably would
struggle with the word problems.
Testing was conducted at five schools with groups
ranging from as few as four participants to as many as 14. The participants were assembled
into a self-contained classroom.
Each student was given a test packet that contained two levels of the Math
Procedures test and two follow-up surveys.
Tests were placed in packets so that the order of administration, in-level and
out-of-level, was counterbalanced.
Prior to beginning the test, the proctor briefed
students on the instructions for taking the test. The instructions generally followed those found in the
test manual (Psychological Corporation, 1993).
There were two principal differences in our instructions for this study. First,
students were instructed to provide their answer in the test booklet instead of
on a bubble sheet. It was hoped that this would
minimize recording mistakes. Second, students were told to skip the items they
did not know how to do. The
instructions read as follows:
Read each question and choose the best answer.
Then, mark the space for the answer you have chosen.
If you do not know how to do the problem, leave it blank and go on to the next
question. If you are pretty
sure how to do the problem, then mark the choice you think is best.
These directions were intended to limit random guessing,
while encouraging participants to make educated guesses when necessary. Participants were given as much time as
they needed to complete the test.
After all students completed the test, they were instructed to place the test
back into their folders and to take out the first follow-up survey.
Test booklets and surveys were color coded so that the results of the survey
could be matched to the results of the test.
The proctor read the survey questions and response options to the participants.
After the survey was completed, the procedures were repeated for the second
test.
The study was designed to examine whether the scale
score an examinee obtains on the out-of-level test would be comparable to the
score he or she obtains on the in-level test.
Scale score comparability was analyzed two ways.
First, we compared the mean scale score on the in-level and out-of-level test
using a paired t-test.
Second, we examined the number of students for whom the in-level test score fell
outside of the 95% confidence interval of their out-of-level test score.
A 95% confidence interval on an individual test score represents the range
within which the person’s true score likely falls.
It accounts for the presence of measurement error in the test – the smaller this
interval, the more reliably performance is estimated.
The lower bound of the 95% confidence interval is calculated by subtracting from
the observed score the value of two times the standard error of measurement; the
upper bound is calculated by adding to the observed score the value of two times
the standard error of measurement.
For instance, if an individual’s observed score was 100, and the standard error
of measurement for that test was 15, then the 95% confidence interval would
range from 70 to 130. The reason for looking at the result
this way is that the paired t-test, as with all hypothesis testing, does not
account for measurement error, and the probability of detecting a statistically
significant finding is a function of sample size.
The second method is not affected by sample size and it accounts for measurement
error. Because a 95% confidence interval is
used, one would expect that 5% of the examinee scores (N=2) should fall outside
this interval by chance.
The Multilevel Norms Book (Psychological Corporation,
1993) provides the standard error of measurement on the number-correct scale for
the Math Procedures test. The
standard error of measurement for the math procedures subtest was 2.06 for both
the Elementary 1 and Elementary 2 levels.
These values had to be translated onto the scale score metric because our
comparison uses scale scores, not the number correct score.
Using the raw score to scale score conversion tables, we determined that two
points on the number correct scale translates to about 14 points on the scale
score metric.
Controlling for Guessing
The methods for comparing scale scores described above
also were conducted after making an adjustment on both the in-level and
out-of-level tests for random guessing.
A popular approach for correcting observed multiple-choice scores for the
possibility of random guessing was described by Lord (1975).
The method, called formula scoring is based on the following formula:
Adjusted Score (AS) = Original Score (OS) –
Wrong Items (W)/(4-1)
AS represents the score adjusted for guessing; OS
represents the original score obtained on the test; W represents the number of
items answered incorrectly, and 4 indicates the number of alternatives for each
item. It is evident from the equation that the
correction applies only to the items for which the examinee gives an incorrect
response. Items that the examinee skips are not
included in the correction. The greater the number of items that an examinee
attempts, but gets wrong, the greater the correction.
When formula scoring is used, examinees are instructed NOT to guess on the items
that they do not know how to do.
Scale Score Comparability
Table 1 shows the mean percent correct by grade on the out-of-level test and the in-level test. The mean percent correct score for 5th graders on the out-of-level test was 48%, and .33% on the in-level test. The mean percent correct for 6th graders was 38% on the out-of-level test and 24% on the in-level test. The overall mean percent correct was 43% on the out-of-level test, and 28% on the in-level test. These findings seem consistent with what one would expect – that the mean percent correct would be higher on the out-of-level test because it is an easier test. However, it is inappropriate to compare performance across different levels of the tests this way (using percent correct) because these scores do not have the same meaning across different levels of the test. As indicated earlier, different levels of the test include different types of skills.
| Mean Percent Correct | |||
| Grade | N | In-Level Test | Out-of-Level Test |
| 5th grade | 15 | 33 | 48 |
| 6th grade | 18 | 24 | 38 |
| Overall | 33 | 28 | 43 |
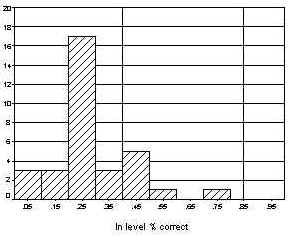
The distribution of scores on the in-level and out-of-level tests is shown in Figures 1 and 2, respectively. The x-axis represents the range of scores on the percent correct metric, and each bar indicates the number of students scoring in that range. The two solid vertical lines represent the range in which measurement is most reliable. This range is bounded by 40% correct and 85% correct, which represent performance of one standard deviation below the mean and one standard deviation above the mean. Seven participants (21%) scored within this range on the in-level test compared to 16 participants (48%) on the out-of-level test.
Figure 1. Numbers of Students Scoring in Various Percent Correct Ranges on the In-Level Test
Figure 2. Numbers of Students Scoring in Various Percent Correct Ranges on the Out-of-Level Test
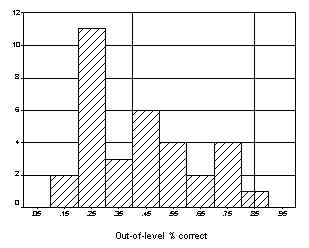
Table 2 shows mean scale scores by grade and test level. The mean scale score was higher on the in-level test than on the out-of-level test for 5th graders, 555 vs. 536 for the in-level and out-of-level tests respectively. The scale score was also higher on the in-level test for 6th graders with 558 and 554 for the in-level and out-of-level tests respectively. A paired t-test compared the overall mean score on the in-level and out-of-level tests; this test of significance indicated that the mean scale score on the in-level test was significantly higher (t = 3.3; p =.002).
Table 2. Mean Scale Score by Level of Test and Grade
| Mean Percent Correct | |||||
| Grade | N | In-Level Test | Out-of-Level Test | t | p |
| 5th grade | 15 | 555 | 536 | ||
| 6th grade | 18 | 558 | 544 | ||
| Overall | 33 | 557 | 541 | 3.3 | .002 |
Table 3 shows the number of examinees whose in-level score fell outside the 95% confidence band on their out-of-level score. It is expected that two scores (5% of the cases) would fall outside of this band by chance. The results indicated the nine scores fell outside the interval, and that all of them fell above the upper bound. This is strong evidence that performance estimates from the in-level test are not comparable, and are substantially higher then the performance estimates from the out-of-level test.
Table 3. Number of In-Level Scale Scores Falling Outside the 95% Confidence Band Around the OUt-of-Level Scale Score
| Mean Scale Scores Falling Outside Confidence Band | ||
| Grade | Above Band | Below Band |
| 5th grade | 4 | 0 |
| 6th grade | 5 | 0 |
| Overall | 9 | 0 |
Correction for Guessing
The adjusted number correct score was converted to a
scale score using the conversion table provided in the manual. For some of the students, this score was
less than or equal to zero, a situation that occurred when the student provided
an incorrect answer to more than four times as many items as he or she answered
correctly. For instance, if a student got six items
correct, but answered the other 18 items incorrectly, then his or her adjusted
number correct score would be zero (6 – 18/3 = 0). Adjusted number correct scores of zero
or less were excluded because there is no scale score corresponding to zero
correct; using the lowest score would artificially boost performance of floor
effects. Over half of the cases were excluded – 6
from grade 5 and 12 from grade 6.
Table 4 displays the mean adjusted scale score by grade and by test level. Note that only 15 cases had adjusted number-correct scores greater than zero. Among the 5th graders, the in-level and out-of-level scale scores differed by only one point. Among 6th graders, the in-level mean scale score was 38 points less than the out-of-level mean. Overall, the mean adjusted scale score for the in-level test was 15 points lower than the mean adjusted scale score on the out-of-level test. This result is the opposite of the result shown without the correction. It is important to note that the unadjusted scale scores for these 15 cases were similar across levels (in-level = 576; out-of-level = 568).
Table 4. Mean of the Adjusted Scale Score by Grade and by Level
| Mean Scale Score | |||||
| Grade | N | In-Level Test | Out-of-Level Test | t | p |
| 5th grade | 9 | 542 | 541 | ||
| 6th grade | 6 | 524 | 562 | ||
| Overall | 15 | 535 | 550 | -1.6 | .14 |
The number of adjusted in-level scale scores that fell
beyond the 95% of the adjusted out-of-level scale scores was also determined. Overall, five of the adjusted scores on
the in-level test fell below the lower bound of the adjusted out-of-level score,
whereas only one score fell above the upper bound.
It is unlikely that many scores would fall below the lower bound by chance;
therefore, it would appear that after adjusting for random guessing one could
expect the out-of-level score to result in a estimation of performance that is
substantially higher than that reflected the in-level score.
Follow-up Questions
Following the completion of each test, students were asked to complete a five-item survey (see Appendix A). The proctor read each item and response option to the participants. Table 5 shows the distribution of responses. When students were asked to rate the difficulty of the test, 61% indicated that the test was really easy or kind of easy for both of the tests. When students were asked to indicate how many items made them feel frustrated, 70% indicated that none or just a few of the items on the in-level test made them frustrated compared to 85% indicating this on the out-of-level test. When students were asked to indicate how many items they did not know how to do, for the in-level test, 76% indicated that they did know how to do just a few of the items, compared to 82% indicating this on the out-of-level test. None of these differences was statistically significant.
Table 5. Percent of Participants Choosing Each Category
| Percent Giving Response | ||
| Question | In-Level Test | Out-of-Level Test |
| How hard was the test? | ||
| Really easy – kind of easy | 61 | 61 |
| How many items made you frustrated? | ||
| None – a few of them | 70 | 85 |
| How many items asked you to do something you NOT know how to do? | ||
| None – a few of them | 76 | 82 |
| Did you find it hard to read the word problems? | ||
| No | 76 | 76 |
| Did you find it hard to understand what the word problems were asking? | ||
| No | 48 | 45 |
There was some concern that students would find the word
problems more difficult. Even
though criteria for eligibility required that the student could read at least at
a basic level, there was some sentiment that many students would struggle with
reading. When
asked whether they found it hard to read the word problems, 76% of the students
indicated that the word problems were not hard to read for either test.
When students were asked whether it was hard to understand what the word
problems were asking them to do, 48% indicated that the word problems on the
in-level test were not hard to understand compared to 45% on the out-of-level
test. Further analysis of the test data also
indicated that students did not seem to have more difficulty with the word
problems than with the other problems.
For those students with low scores on the out-of-level test (less than 40%
correct), about 25% correct was obtained for both the word problems and the
non-word problems. Reading
difficulties did not appear to influence the results of this study.
Testing Time
Another factor that could potentially influence the
scale score comparison was the degree to which students tried their best on both
test. We could not measure
students’ effort directly, but we could infer lack of effort for students who
spent very little time taking the test.
In this study, students were provided with as much time as they needed to
complete the test. The average test-taking time was 19.3
minutes on the first test and 15.8 minutes on the second test.
The test publisher recommends allowing 30 minutes to complete the 24-item Math
Procedures section. We suspected
that test taking time might have been shorter for the participants in our study
because they were instructed to skip the items that they did not know how to do.
On average, the participants responded to 22 items on the first test and 21
items on the second test. Students
spent an average of 54 seconds per item on the first test, counting only those
items for which they provided a response, and 46 seconds per item on the second
test.
It seemed reasonable to expect students to spend at
least 30 seconds per item on these tests, especially considering that the
in-level test was difficult for this group.
Furthermore, it seems highly unlikely that a student getting most of the items
wrong, and spending less than 30 seconds per item was giving much effort.
Four students spent less than 30 seconds per item while also getting fewer than
25% of the items that they responded to correct.
We reanalyzed the data for the scale score comparison
after removing these four cases.
Overall, the mean scale score on the in-level test for these 29 participants was
547 and the mean score on the in-level test was 557.
The measurement error band around the out-of-level score ranges from 533 to 561. The mean scale score on the in-level
test falls within this range. After
making an adjustment for random guessing the mean scale score was 537 on the
out-of-level test and 543 on the in-level test.
The primary purpose of this study was to evaluate scale
score comparability across two levels of a math computation test administered to
students with learning disabilities whose instruction was about two grade levels
below the grade in which they were enrolled. It was not designed to address
either the concern about whether out-of-level testing lowers expectations, nor
whether out-of-level testing represents a sound measure of performance against
standards. These are important concerns that must be addressed as
standards-based reforms continue to be implemented. Concerns about whether
students are having exposure to grade-level content must be examined. Remedial
work cannot sacrifice continued exposure to grade-level content.
This study was an attempt to extend the results of prior
comparability studies by imposing stricter criteria for eligibility, and by
making the comparison both with and without a correction for random guessing. The results demonstrated that the
average scale score on the in-level test was significantly higher than the
average score on the out-of-level test when there was no adjustment made for
guessing. In contrast, the out-of-level score was
higher than the in-level scale score when adjustments for guessing were made on
both tests. The difference in results occurred because the average number of
incorrect responses (excluding omitted responses) was greater on the in-level
test (Mean =14) than on the out-of-level test (Mean=12).
Because guessing represents systematic error, it has the effect of biasing
performance estimates upward; therefore, the performance estimate on the
out-of-level test generally represented a more accurate estimate of “true”
performance. This conclusion is still premiminary, however, because of small
numbers of students and the exclusion of over half of them in our adjustment for
guessing. It is unlikely that test publishers eliminate scores in the same way
that we did here.
Even though the out-of-level scores may have been less
contaminated by guessing, it does not necessarily follow that an out-of-level
score is more valid. Validity
depends on the purpose of the test and the inferences one wishes to draw from
the scores. The decision to use out-of-level testing
should be guided by the purpose of the test.
Most achievement tests are designed such that the items are representative of a
particular domain. Under certain
conditions, namely overlap of content and skills across levels, adequate
vertical scaling, and a sound mechanism for assigning students to test levels,
the out-of-level test score will generally result in a more precise performance
estimate and more accurate inferences for students for whom the in-level test is
too hard.
Better precision (i.e., more reliable measurement) is
almost guaranteed when students are appropriately assigned to test levels. On
most achievement tests, measurement precision is greatest for scores that fall
near the mean of the number correct distribution, and decreases exponentially in
the tails. This fact was one of the driving
forces behind out-of-level testing.
We found that more than twice as many participants scored in the reliable range
on the out-of-level test than on the in-level test; therefore, overall group
performance was more reliably estimated on the out-of-level test. Still, a
number of students (n = 7) did perform within the reliable range on the in-level
test, suggesting that teachers’ perceptions about their students’ levels of
performance might be inaccurate.
It is sometimes argued that out-of-level testing is not
appropriate for testing situations in which criterion-referenced inferences are
drawn from the scores (Arter, 1982).
A common example of a criterion-referenced inference is the determination of
whether a student is proficient on some pre-defined content standards. Most state testing systems are designed
for this purpose (Olson, Bond, & Andrews, 2000). If these state tests were actually developed in the same way
as norm-referenced tests, with vertically linked levels aligned to the same
standards, it is possible that inferences from out-of-level test scores would
still be valid. However, it is rare
even in states that allow out-of-level testing on their criterion-referenced
tests to have out-of-level tests that were designed to meet those conditions –
these states often use the test intended to measure standards in lower grades as
their out-of-level test (Minnema et al., 2001). Because most states do not test in every grade, this usually
means that a test designed for students at least two grades lower is used.
It is unlikely that a statistical or content link has been established in those
situations. Thus, the findings of our study on score
comparability do not apply to the standards-based criterion-referenced tests in
most states.
Increasing the reliability of measurement for students
with disabilities is a growing concern in statewide standards-based testing
programs. Concern that the tests
are not sensitive to improvements among the students falling in the lowest
proficiency levels is growing.
Students with disabilities score below the proficient level on state tests at a
much higher rate than do students without disabilities (Bielinski, Thurlow,
Callender, & Bolt, 2001). While some states have gone to
out-of-level testing, others have further divided their lowest proficiency
levels in the hope that this will refine measurement of student performance at
the lowest levels. Unfortunately, this latter approach will
not improve the sensitivity of the test for detecting real growth among the low
performing students. Measurement of performance in the lowest proficiency level
tends to be unreliable. Movement between “sublevels” within the lowest
proficiency level will be heavily influenced by random error, rather than real
growth. As such, one can expect large fluctuations (up and down) from year to
year in the percent of the students within each sublevel. If states are serious
about improving measurement for these students, they should consider adding more
easy items. Among the ways
that this might be done are (1) making the tests longer, (2) dividing the tests
into levels that differ in terms of difficulty, but that overlap sufficiently in
term of item content and skill, and (3) redistributing the difficulty so that
there are more of the easy items and less of the moderate and difficult items.
Our results suggest that the vertical linking studies
conducted by the test publisher of the norm-referenced test we used (MAT7) were
sufficiently robust to allow for testing students with disabilities on math
computation two grades below grade level under the caveats of our study, so long
as there is an adjustment made for random guessing.
This result is important, because students with disabilities for whom an
out-of-level test two levels below grade level is warranted, are probably
underrepresented in the linking studies conducted by test publishers
(Psychological Corporation, 1993). This finding should not be generalized to testing systems in
which adequate vertical scaling procedures have not been used, such as is the
case for most statewide standards-based testing systems.
The criteria for participation in this study were
probably more conservative and thorough than what is used in practice to assign
students to an out-of-level test.
We presented our criteria to and had discussions with the special education
teachers in order to ensure that the students they nominated met the eligibility
criteria. Despite our effort to ensure that
out-of-level testing was warranted for the students, there was still a handful
who obtained a score within the reliable range (i.e., more than 40% correct) on
the in-level test.
These students represent the false positives; that is, students for whom
out-of-level testing seemed to be warranted, but who performed well enough on
the in-level test that out-of-level testing might not have been most
appropriate. After the adjustment for guessing,
the scale score on the in-level test fell within the 95% confidence range of the
scores on the out-of-level tests, indicating that either score was fairly
accurate, as long as the test was like that used in our study – a test with
vertically equated levels. Still, the fact that students could be
possibly inappropriately identified as candidates for out-of-level testing even
with the strict eligibility criteria used in this study suggests that districts
and states that allow out-of-level testing should include multiple safeguards to
ensure access to the highest level of the test appropriate.
Arter, J.A. (1982).
Out-of-level versus in-level testing:
When should we recommend each?
Paper presented at the annual meeting of the American Educational Research
Association, New York.
Cleland, W.E., & Idstein, P.M. (1980). In-level versus out-of-level testing of sixth
grade special education students.
Paper presented at the annual meeting of the Naitonal Council on Measurement in
Education, Boston.
Harcourt Brace Educational Measurement (1997).
Stanford Achievement Test series, 9th
edition: Technical data report.
San Antonio, TX: Harcourt Brace.
Long, J.V., Schaffran, J.A., & Kellogg, T.M.
(1977). Effects of
out-of-level survey testing on reading achievement scores of Title I ESEA
students. Journal of Educational Measurement, 14
(3), 203-213.
Lord, F. M. (1975). Formula scoring and number-right
scoring. Journal of Educational
Measurement, 8, 147-151.
Minnema, J., Thurlow, M., & Scott, J. (2001). Testing students out-of-level in large-scale
assessments: What states perceive
and believe
(Out-of-Level Testing Report 5).
Minneapolis, MN: University of Minnesota, National Center on Educational
Outcomes.
Olson, J.F., Bond, L., & Andrews, C. (2000). Annual survey:
State student assessment programs.
Washington, DC: Council of Chief State School Officers.
Psychological Corporation (1993).
MAT/7 multilevel norms book: Spring.
San Antonio, TX: The Psychological Corporation.
Slaughter, H.B., & Gallas, E.J. (1978). Will out-of-level norm-referenced testing
improve the selection of program participants and the diagnosis of reading
comprehension in ESEA Title I programs? Paper presented at the annual meeting of the American
Educational Research Association, Toronto, Ontario, Canada.
Study Group on Alternate Assessment. (1999). Alternate assessment resource matrix: Considerations, options, and implications (ASES SCASS Report). Washington, DC: Council of Chief State School Officers.