1999 Report on
the Participation and Performance of Limited English Proficient Students on Minnesota's
Basic Standards Tests
Minnesota Report 30
Published by the National Center on
Educational Outcomes
Prepared by Kristin Liu, Michael
Anderson, and Martha Thurlow
August 2000
This document has been archived by NCEO because some of the
information it contains is out of date.
Any or all portions of this document may be reproduced and
distributed without prior permission, provided the source is cited as:
Liu, K., Anderson, M., & Thurlow, M. (2000). 1999
Report on the participation and performance of limited English proficient students on
Minnesota's Basic Standards Tests (Minnesota Report No. 30). Minneapolis, MN:
University of Minnesota, National Center on Educational Outcomes. Retrieved [today's
date], from the World Wide Web: http://education.umn.edu/NCEO/OnlinePubs/MnReport30.html
Overview
Title I of the Improving America’s Schools Act specifies
that all states must disaggregate statewide test data for limited English proficient (LEP)
students. However, to date, most states have not provided sufficient test data to make
judgments about the academic progress of LEP students (Lachat, 1999), particularly those
who are getting English as a Second Language or Bilingual Education services. Providing
such data would:
• Ensure
that groups of education stakeholders have a common vision for what education reform,
especially large-scale assessment, can accomplish and develop a unified way of supporting
reform efforts (Lachat, 1999).
• Support
the inclusion of English Language Learners (ELLs) in high standards instead of tracking
these students into lower-level courses that are not aligned with standards (Rothman &
Elmore, 1999)
•
Allow educators and policymakers to determine the factors that
are related to significant achievement differences between ELLs and their native
English-speaking peers. Programmatic changes could then be made to address these
differences (Kopriva, 2000)
•
Make certain that decisions made with large-scale assessment
data represent all students (Kopriva, 2000)
The purpose of this report is to examine data trends in
Minnesota’s Basic Standards Tests, statewide tests of reading and math, for the years
1996-99 for students with limited English proficiency. Data from the writing test are not
included in this report since this test was implemented much more recently and because
writing tests are administered at a different grade level.
Background on the Basic Standards Tests
Minnesota’s Basic Standards Tests (BSTs) in reading and math
were administered statewide for the first time in 1996. At that time, districts could
choose whether to participate. In 1997, participation in some type of large-scale testing
was mandatory, but districts could choose whether to use the BSTs or some other type of
standardized test. The test of Written Composition was administered for the first time in
1999 for students in 10th grade. Test results are used for school accountability purposes,
but are also used for high stakes decisions that affect individual students. All state
public high school students entering 9th grade in 1997 or later must pass these tests to receive a
diploma, with some exceptions for students with limited English proficiency (LEP) and
students with disabilities.
Those in the class of 2000 need 70% of the test items correct in
order to pass the test and receive a diploma. Students in the class of 2001 and subsequent
classes need 75% of the items correct. However, local public districts may set higher
passing scores for their students and some students with disabilities who have individual
education plans (IEPs) may have lower passing scores.
LEP students who have been in the United States one year or more
take the math and reading BSTs in 8th grade for school accountability purposes. Scores do not have to
count for graduation purposes until an LEP student has been in the United States 3 years.
LEP students who do participate in BSTs may take the test with accommodations or
translations and interpretations. In Minnesota’s accountability system, an
accommodation is defined as a change to the test format or test setting that does not
change the standard being tested, such as administering the test in a small or individual
setting. In addition to accommodations, translations or oral interpretations are available
to LEP students taking the math test. A student passing a translated math test would
receive a different notation on his or her transcript. Accommodations and translations
allowed for LEP students during the 1999 testing cycle are listed in Appendix A.
Method
The Minnesota Department of Children, Families and Learning (CFL)
collected the data compiled for this report through the Minnesota Automated Reporting
Student System (MARSS). The researchers at Minnesota Assessment Project ran descriptive
statistical analyses using the SPSS Information Analysis System. The development of this
system has been a great help to accountability system in the state because it allows
researchers and educators to better account for all students. In the past, students could
not be accounted for in the state system because of missing or inaccurate ID numbers. In
1999, less than 200 of the nearly 200,000 students tested have yet to be identified in the
system.
When interpreting the data and charts presented in this report,
there are several important considerations to keep in mind:
Use of the term LEP.
Fields in the MARSS database allow for an examination of only those students who are
designated as receiving ESL or Bilingual services as reported to the Department of CFL. In
this report, when the term “LEP” is used, it should be understood to mean those
students who are designated limited English proficient and who receive ESL or bilingual
services.
Date of enrollment.
In order to be consistent with participation rates calculated in previous years, the
enrollment numbers used are from enrollment numbers reported to the CFL as of October 1,
1998. Thus some of the participation rates may differ from reports using enrollment data
from the day of testing. The difference in the enrollment numbers from fall to the day of
testing was small for 1999 (see Table 1). However, due to the high mobility of LEP
students in general, the specific individuals enrolled may be very different at the
beginning of the school year than at the time of the test.
Table 1. Change in Enrollment Numbers from October
to Day of Test
|
Day
of Test |
Enrollment |
October 1, 1998
|
February
1999 |
All
8th grade students |
67,966 |
67,933 |
LEP
8th grade students |
2,034 |
2,050 |
Additional testing
opportunities. The data in this report reflect only the results from BSTs given during
the 1996 to 1999 school years. Students who do not pass a test have additional
opportunities to retake the test in the summer or at other points during the school year.
These retake results are not reported in this analysis.
Results
In an effort to gain a fuller picture of the participation of LEP
students in the BSTs, we have chosen to examine in depth the performance of eighth graders
in 1999, to look at the performance of eighth graders across the years that the test has
been given (1996-1999), and to look at the performance of students across the grades 8-11
for the 1999 testing cycle. The results of our analyses are divided into the following
sections: (1) participation of 8th graders from 1996-1999, (2) performance of 8th graders from 1996-1999, (3) mean BST performance in 1999, (4)
performance of 8-11th graders on 1999 BST, (5) accommodation use and performance by 8th graders in 1999, and (6) types of accommodations used by 8th graders in 1999.
Participation. The
participation rates for eighth graders taking the Basic Standards reading and math tests
from 1996 to 1999 are shown in Table 2. When looking at these participation rates it is
important to consider several factors that play a role in the interpretation of the data.
When the BSTs were first offered in 1996, they were optional and only about 80% of all
eligible students in the state took part in the testing. In 1997, school districts could
choose to administer the BSTs or another set of standardized of tests instead of the BSTs.
It was only in 1998 that all school districts across the state were required to administer
BSTs for accountability purposes. In this respect, it is only the last two years of
testing that can be compared on the same basis, although the data are presented for all of
the years in which the BST has been administered so far.
Table 2. Participation of 8th Grade Students in the Basic
Standards Tests
|
LEP
Students |
All
Students |
|
1996 |
1997 |
1998 |
1999 |
1996 |
1997 |
1998 |
1999 |
Enrolled
Oct. 1st |
997 |
753 |
1,784 |
2,034 |
65,647 |
65,934 |
66,526 |
67,966 |
Number
Tested in Math |
693 |
876 |
1,580 |
1,890 |
53,606 |
51,929 |
64,396 |
65,362 |
Percent
Tested in Math |
70% |
>100% |
89% |
93% |
82% |
79% |
97% |
96% |
Number
Tested in Reading |
657 |
852 |
1,574 |
1,887 |
51,780 |
50,386 |
64,401 |
65,405 |
Percent
Tested in Reading |
66% |
>100% |
88% |
93% |
79% |
76% |
97% |
96% |
By looking at the data presented in Table 2 and graphed in Figure
1, it is possible to compare the participation rates of LEP students to that of all
students over time. In this analysis, “All students” includes all students
taking the test, including LEP students and students with disabilities. Overall, the
participation rates show general increases from 1996 to 1999, although there is some
variation in certain years.
Figure 1. Participation Rates for the Minnesota
Basic Standards Tests 1996-99
Performance. When
looking at the performance data presented in Table 3, it should be noted that the passing
rates for 1997 to 1999 are figured on the number of students achieving a score of at least
75% correct on the reading or math test. For eighth graders in 1996 (those graduating in
2000), the passing rate was only 70%. After 1996, the passing rate was raised for all
students graduating after the year 2000. This difference in what constitutes a passing
score may account for the drop in the passing rates of eighth grade students for both the
math and the reading test between 1996 and 1997.
Table 3. Performance of 8th Graders 1996-99
|
|
LEP Students
|
All Students
|
|
|
1996 |
1997 |
1998 |
1999 |
1996 |
1997 |
1998 |
1999 |
Math |
#
Tested
|
693 |
876 |
1,580 |
1,890 |
53,606 |
51,929 |
64,396 |
65,362 |
|
#
Passing
|
172 |
184 |
362 |
457 |
41,462 |
36,092 |
45,489 |
45,911 |
|
%
Passing
|
25% |
21% |
23% |
24% |
77% |
69% |
71% |
70% |
Reading |
#
Tested
|
657 |
852 |
1,574 |
1,887 |
51,780 |
50,386 |
64,401 |
65,405 |
|
#
Passing
|
66 |
72 |
252 |
407 |
33,121 |
29,760 |
43,811 |
48,180 |
|
%
Passing
|
10% |
8% |
16% |
22% |
64% |
59% |
68% |
74% |
Since 1997, the math test scores for all students have stayed
about the same, with around 70% of the students passing the math test on the first try.
The percentage of LEP students passing has not changed much either, increasing slightly
from 21 percent in 1997 to 24 percent in 1999 (also see Figure 2). It should be noted,
however, that the number of LEP students taking the test in eighth grade has increased
dramatically over this time, from 876 students tested in math in 1997 to 1,890 students in
1999.
Figure 2. Percentage of 8th Graders Passing BSTs
1996-99
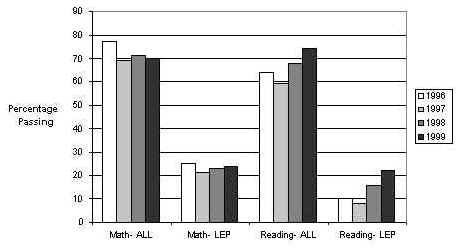
Like the percentage passing math, the percentage passing for the
reading test dropped a little between 1996 and 1997. Since 1997, however, the percentage
of all students passing the reading test has increased steadily from 59% to 74%. These
gains have mirrored the gains of LEP students on the reading test. The passing rate for
LEP eighth graders has risen from 8% in 1997 to 22% in 1999.
The percentage of LEP students passing is considerably lower on
both the reading and the math tests compared to the percentage of all students who pass.
The percentage of LEP students passing the math test has stayed fairly stable at around
25%. However, the percentage of LEP students passing the reading test is growing steadily.
In 1999 for the first time, nearly the same percentage (22%-24%) of LEP 8th graders passed the reading test and the math test on their first
attempt.
It is useful to look not only at the percent of students passing,
but also at student scores in order to determine whether students are improving over time
even if they are not passing the tests. Table 4 and Figure 3 show the mean percentages of
items correct on the math BST over the four year period 1996-99. The analyses do not
include the roughly 100 students with invalid test scores. The mean percentages correct
for both LEP students and all students have remained relatively constant over the four
years the test has been given (around 80% for all students and 57% for LEP students). The
mean percentage of items correct for LEP students is consistently about 23% lower than
that for all students on the math test.
Table 4. 1996-99 Mean BST Math Performance of 8th
Graders
|
LEP
8th Graders |
All
8th Graders |
|
1996
|
1997
|
1998
|
1999
|
1996
|
1997
|
1998
|
1999
|
Number
Tested |
693 |
876 |
1,580 |
1,890 |
53,606 |
51,929 |
64,396 |
65,362 |
Mean Percent Correct |
57% |
58% |
56% |
57% |
79% |
80% |
79% |
79% |
Figure 3. Mean Percentage of Math Items Correct
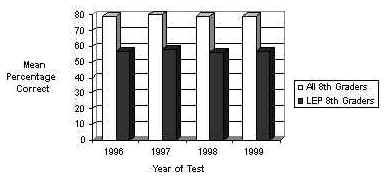
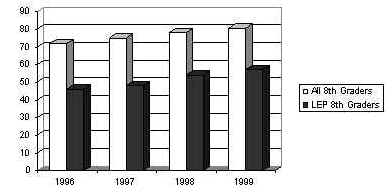
Table 5 and Figure 4 show similar data on the Basic Standards
reading test. The mean percentage of items correct has increased slightly for all students
in eighth grade over the four year period from 72% in 1996 to 81% in 1999. During the same
period, the mean percentage of items correct on the reading test for LEP students
increased from 46% in 1996 to 57% in 1999. Although LEP students typically start out with
lower scores on the reading test, they are making larger amounts of gain than on the math
test.
Table 5. 1996-99 Mean BST Reading Performance on
8th Graders
|
LEP
8th graders |
All
8th graders |
|
1996 |
1997 |
1998 |
1999 |
1996 |
1997 |
1998 |
1999 |
Number
Tested |
657 |
852 |
1,574 |
1,887 |
51,780 |
50,386 |
64,401 |
65,405, |
Mean
Percent Correct |
46% |
48% |
54% |
57% |
72% |
75% |
78% |
81% |
Figure 4.
Mean Percentage of Reading Items Correct
Performance in grades 8
-11 on 1999 BSTs. Students who do not pass one or both of the BSTs have additional
opportunities each year to take the tests, which they are required to pass in order to
graduate from high school. In addition, new students moving into the state also need to
pass the BSTs in order to be eligible to graduate from high school in Minnesota. For
mainly these reasons, students beyond eighth grade also take the BSTs. Table 6 shows the
results of all students and LEP students in grades 8-11 taking the BSTs in February 1999.
It is important to keep in mind that the passing score for 11th graders (the class of 2000) is 70% and for other students in the
table it is 75%. It is not clear from the data how many students represented in 9th through 11th grade are first time test takers and how many are taking the
test for a 2nd, 3rd or 4th time because of not passing one or both portions previously.
Table 6. Performance of 8-11th Graders on 1999 BST
|
LEP Students in 1999
|
All
Students in 1999 |
|
8th |
9th |
10th |
11th |
8th |
9th |
10th |
11th |
Number
Tested
Math |
1,890 |
1,367 |
1,056 |
602 |
65,362 |
18,511 |
11,422 |
5,669 |
Number Passed
Math |
457 |
249 |
241 |
131 |
45,911 |
6,056 |
3,552 |
2,184 |
Percent
Passed
Math |
24% |
18% |
23% |
22% |
70% |
33% |
30% |
39% |
Number
Tested
Reading |
1,887 |
1,527 |
1,174 |
714 |
65,405 |
19,727 |
11,833 |
5,808 |
Number
Passed
Reading |
407 |
344 |
279 |
233 |
49,180 |
9,637 |
5,699 |
2,960 |
Percent
Passed
Reading |
22% |
23% |
24% |
33% |
75% |
49% |
48% |
51% |
For all students in grades 9 through 11, about 50% of the
students in any grade passed the reading test compared to about 25% of LEP students. For
the math test, about one third of the students in grades 9 to 11 passed. LEP students
taking the math tests have passing rates lower than the rates for all students in the same
grades, ranging from 18 to 24 percent. Overall, LEP students in all grades have lower
passing rates than students in general.
Accommodations. The
way in which data are collected on the use of accommodations during the BSTs has changed
over time. In 1999, data on what particular accommodations were used by each student were
collected on a form that accompanied the test form. Table 7 summarizes the use of
accommodations in relation to performance by LEP students in 8th grade in 1999. It is important to note that in these data,
accommodations and translations of the test are not differentiated, so
“accommodated” means that the student was provided an accommodation, a
translation, or both. The data in Table 7 include all LEP students who were reported to
have received at least one accommodation or translation. Some of these students may have
also been students with disabilities and the accommodation received could have been an
accommodation based on their LEP status, their disability status, or both. Whatever the
case, very few LEP students were reported to have received accommodations or translations
in this testing cycle.
Table 7. Accommodation Use and Performance for LEP
8th Grade Students
Grade 8 LEP Students
|
Reading
Test |
Math
Test |
Accommodated |
Not
Accommodated |
Accommodated |
Not
Accommodated |
Number
of students taking the test |
51 |
1836 |
39 |
1851 |
Percent
of students taking the test |
2.7% |
97.3% |
2.1% |
97.9% |
Number
of students passing the test |
4 |
403 |
3 |
454 |
Percent
passing the test |
7.8% |
21.9% |
7.7% |
24.5% |
Number
of students not passing the test |
47 |
1433 |
36 |
1397 |
Percent
not passing the test |
92.2% |
78.1% |
92.3% |
75.5% |
Of the 8th grade LEP students taking the tests, only 2.7% used an
accommodation on the reading test and only 2.1% used an accommodation on the math test.
Over 97% of LEP students participating in each test took the test with no accommodation.
In terms of performance, just less than 8% of the accommodated
LEP students on the reading and math tests achieved a passing level. Of the unaccommodated
LEP students, 21.9% passed the reading test and 24.5% passed the math test. While the
passing rate is lower for the accommodated students, this should not be taken to mean that
the accommodations decrease student performance on the test. Students receiving
accommodations are usually students with lower proficiency levels in English, and thus
have more difficulty passing the tests (Albus, Liu, Thurlow, & Bielinski, 2000;
Anderson, Liu, Swierzbin, Thurlow, & Bielinski, 2000). Taking into consideration the
low numbers of students taking a test with accommodations it is possible that some of the
students in the unaccommodated group would have benefited from receiving accommodations,
or did receive accommodations that were not reported.
These data are in contrast to the accommodation usage data from
1997 when 12% of LEP students were reported to use some form of accommodation. Of LEP
students using accommodations in 1997, 83% passed the math test and 2% passed the reading
test (Liu & Thurlow, 1999). Even though the numbers of LEP eighth graders taking the
BSTs more than doubled between 1997 and 1999, the number of LEP students who were reported
as using accommodations on the tests fell by more than 50% for each. These numbers
indicate that either accommodation use by LEP students in Minnesota is drastically
declining or that it is not being reported accurately.
Types of accommodations
used. Test administrators also reported the specific accommodations students used when
taking the BSTs. The data were complied by CFL and merged with the MARSS file on test
participation. The accommodations used by LEP students are reported in Table 8. These data
reflect the number of LEP students who were reported to use each type of accommodation and
who also had a valid test score in the MARSS database.
Although we have questions about the validity of the
accommodations, the accommodation data for LEP students who had valid scores for each test
are reported in Table 8. Some of the students may have received multiple accommodations
and are counted in more than one category in the table.
Table 8. Accommodations Used by LEP 8th Grade
Students in 1999
Accommodation
|
Number
Tested Reading |
Percent
Tested Reading |
Number
Tested Math |
Percent
Tested Math |
Short
Segment Test Booklet |
23 |
1.2 |
21 |
1.1 |
Extended
Time |
22 |
1.2 |
12 |
0.6 |
Special
Setting |
21 |
1.1 |
12 |
0.6 |
Individual
or Small Group Administration |
16 |
0.8 |
13 |
0.7 |
Oral
Administration of Math Test in English |
15* |
0.8* |
11 |
0.6 |
Translation
of Directions |
8 |
0.4 |
7 |
0.4 |
Large
Print Test** |
6 |
0.3 |
7 |
0.4 |
Translation
of Test |
5* |
0.3* |
2 |
0.1 |
Clarification
or Translation of Directions |
0 |
0.0 |
0 |
0.0 |
Writing
Directly in the Test Booklet. |
0 |
0.0 |
0 |
0.0 |
*
This accommodation is not offered for the
reading test.
**
This accommodation is for students with disabilities.
Like the data presented in Table 7, the numbers of students reported as having received
accommodations is very low. Of the more than 1,800 eighth grade LEP students who took each
test, the number of students reported as receiving the most popular accommodation was 23.
The most frequently used accommodations for the reading test were short segment test
booklets, extended time, and special setting accommodations. The most used accommodations
for the math test were short segment test booklets, individual or small group
administration of the test, extended time, and special setting accommodations. Although
permitted, translations of tests were rarely offered for the math test, and no LEP
students were reported as having received clarification or a translation of the test
directions. More LEP students were reported as having received a large print version of
the test, an accommodation specific to students with disabilities, than a translation of
the math test.
Implications
Based on four years of Basic Standards Test data for LEP
students, we have observed the following:
• Participation
for LEP students in the Minnesota BSTs remains high.
• Performance
for LEP students remains low. There is an achievement gap of approximately 20%-25% between
mean scores for LEP students and mean scores for their native-English speaking peers on
both the reading and the math tests. This gap does appear to be narrowing a bit, but the
gap is not unexpected given the fact that these students are in the process of learning
the academic English needed to take the tests.
• Greater
gains in mean percentages of items correct are being made by LEP students taking the
reading tests than the math tests. This suggests that ESL teachers may be successful in
teaching reading skills needed on the BST. More detailed examination of the types of
remediation programs provided for students who do not pass the math test may give clues as
to why the gains are smaller for the math BST.
Based on the very limited data in this report pertaining to
students using accommodations and students retaking the BSTs in grades 9-11, several
observations can be made.
If approximately 25% of the LEP students who retake the reading
or math test each year in grades 9-11 pass it, there will be LEP students who do not pass
the tests by 12th grade and therefore do not receive a high school diploma. Future
BST analyses need to include those LEP students taking the tests in summer remediation
programs to gain an accurate picture of how many LEP students are not receiving diplomas
because they are not able to pass the tests.
Data on which accommodations are being used for the reading
versus the math test are not yet accurate enough to use to draw conclusions. Although the
specific accommodation data did allow for recording whether the accommodation was used for
the reading or the math test, all of the students in the file were listed as using the
same accommodations for both tests. This fact makes the data somewhat suspect considering
that some accommodations (e.g., oral administration of the test in English and
translation) are not allowed for the reading test. Most likely these accommodations were
not used for the reading test but are a result of not differentiating between the reading
and math tests on the accommodations form. In fact, some students who were not listed as
having been tested for a particular test in the MARSS database were reported as having
received an accommodation for the test. Clearly, if a student does not take a test, that
student did not receive an accommodation.
At the present time, data on accommodations use are only
collected for 8th graders. Test administrators are asked to fill out a separate
sheet for the reading and math tests telling what accommodations an individual student
uses. Anecdotal information from the test administrators suggests that the extra time and
effort required to fill in the separate sheets for large numbers of LEP students is a
burden. It appears that instead of two, only one sheet is filled out with information
about reading and math accommodations combined. There may be a way to collect
accommodations data so that it is less of a burden on test administrators and so that it
is easier to analyze. In Missouri, for example, accommodations information is collected on
the test answer sheet so that separate forms are not needed. If students using
accommodations were tested in small groups, it would be easier for test administrators in
this type of setting to accurately record accommodations information. Better
accommodations data would help researchers and policymakers determine which accommodations
are being used, and whether particular accommodations are having more benefit for LEP
students than others.
Finally, the numbers of LEP students using accommodations seems
low. Although accommodation usage varies among states with statewide accountability
systems, the numbers tend to be higher than found in the Minnesota data. In a recent
testing cycle in Missouri, about 10% of LEP students use accommodations on statewide tests
(J. Bielinski, personal communication, June 20, 2000). Reports of accommodation use by
students with disabilities in Rhode Island, another group for whom accommodations are
allowed, have shown up to 53% of these students using accommodations on statewide math
tests (Elliott, Bielinski, Thurlow, DeVito, & Hedlund, 1999). If the numbers of
students using an accommodation on the BSTs are fairly accurate, more research is needed
into why the numbers of accommodated LEP students are so low in comparison with states
like Missouri that have a smaller LEP student population and lower than other groups of
students who are allowed accommodations such as students with disabilities. Do educators
and school staff who make testing decisions need more training regarding the purpose of
accommodations and the benefit to LEP students? Are ESL and bilingual teachers included in
making accommodations decisions for LEP students? Are there more useful accommodations
than the ones currently offered? Do the students and their families not want to use
accommodations? Is the school worried about the legal ramifications of offering a
translation to one language group, but not offering it to another because of the financial
cost and the availability of translators? Answering these questions would help to make the
testing situation more equitable for LEP students.
References
Albus, D., Liu, K., Thurlow, M., & Bielinski, J. (2000). The effects of a simplified English dictionary
accommodation for LEP students taking large-scale reading assessments. (Delaware
Report). Minneapolis, MN: University of Minnesota, National Center on Educational
Outcomes.
Anderson, M., Liu, K., Swierzbin, B., Thurlow, M., &
Bielinski, J. (2000). Bilingual accommodations for
limited English proficient students on statewide reading tests: Phase 2. (Minnesota
Report 31). Minneapolis, MN: University of Minnesota, National Center on Educational
Outcomes.
Kopriva, R. (2000). Ensuring
accuracy in testing for English language learners. Washington, DC: Council of Chief
State School Officers.
Elliott, J., Bielinski, J., Thurlow, M., DeVito, P., &
Hedlund, E. (1999). Accommodations and the
performance of all students on Rhode Island’s Performance Assessment. (Rhode
Island Report 1). Minneapolis, MN: University of Minnesota, National Center on Educational
Outcomes.
Lachat, M. (1999). What
policymakers and school administrators need to know about assessment reform for English
language learners. Providence, RI: Brown University, Northeast and Islands Regional
Education Laboratory.
Liu, K., & Thurlow, M. (1999). Limited English proficient students’ participation
and performance on Minnesota’s statewide assessments: Minnesota Basic Standards
reading and math, 1996-1998 (Minnesota Report 19). Minneapolis, MN: University of
Minnesota, National Center on Educational Outcomes.
Rivera, C., Stansfield, C., Scialdone, L. & Sharkey, M.
(2000). An analysis of state policies for the
inclusion and accommodation of English language learners in state assessment programs,
1998-99. Arlington, VA: Center for Equity and Excellence in Education, George
Washington University.
Rothman, R., & Elmore, R. (1999). Testing, teaching and learning: A guide for states and
school districts. Washington, D.C.: National Academy Press
Thurlow, M., Liu, K., Erickson, R., Spicuzza, R., & El Sawaf,
H. (1996). Accommodations for students with limited
English proficiency: Analysis of guidelines from states with graduation exams
(Minnesota Report 6). Minneapolis, MN:
University of Minnesota, National Center on Educational Outcomes.
Accommodations and Translations Available to LEP Students
on the Minnesota Basic Standards Tests of Math and Reading 1999
Accommodations |
Test
|
Audiocassettes
in English |
Math |
A
script of the audiocassette in English |
Math |
Clarification
or translation of directions |
Math,
Reading |
Extended
time |
Math,
Reading |
Individual
or small group setting |
Math,
Reading |
Short
segment test booklet |
Math,
Reading |
Translations |
Test |
Translations |
Math |
Oral
interpretations |
Math |
Top of page |