1999 Report on
the Participation and Performance of Students with Disabilities on Minnesota's Basic
Standards Tests
Minnesota Report 29
Published by the National Center on
Educational Outcomes
Prepared by Sandra Thompson, Martha
Thurlow, and Richard Spiccuza
July 2000
This document has been archived by NCEO because some of the
information it contains is out of date.
Any or all portions of this document may be reproduced and
distributed without prior permission, provided the source is cited as:
Thompson, S., Thurlow, M., & Spiccuza, R. (2000). 1999
Report on the participation and performance of students with disabilities on Minnesota's
Basic Standards Tests (Minnesota Report No. 29). Minneapolis, MN: University of
Minnesota, National Center on Educational Outcomes. Retrieved [today's date], from the
World Wide Web: http://education.umn.edu/NCEO/OnlinePubs/MnReport29.html
Overview
The fourth statewide administration of Minnesota’s Basic
Standards Tests in Reading and Mathematics took place in the spring of 1999. The first
administration of the statewide Test of Written Composition for 10th graders also took place in 1999. Beginning with the class of
2000 (11th graders during 1999 testing), students are required to pass
these tests by the time they complete 12th grade in order to receive a high school diploma (there are
exceptions for some students with disabilities). This report examines the participation
and performance of students with disabilities on the Basic Standards Tests since the first
statewide administration in 1996, across grades 8 through 11. Data used in this report
were compiled by the Minnesota Department of Children, Families and Learning and analyzed
by the Minnesota Assessment Project, a collaborative effort between the Department of
Children, Families and Learning and the National Center on Educational Outcomes (NCEO) at
the University of Minnesota.
The 1997 reauthorization of the Individuals with Disabilities
Education Act (IDEA 97) requires states to report the number and percentage of students
participating in state assessments and the performance of those students in the same way
and with the same frequency as reported for other students. IDEA 97 has placed greater
emphasis on the access of students with disabilities to the general education curriculum
and their participation in it, and in the district and state assessments that drive the
curriculum. In Minnesota, as in most states, IDEA has set the stage for higher
participation rates (see Appendix A for assessment provisions of IDEA 97).
Minnesota is one of only 23 states able to report actual
assessment participation rates of students with disabilities (Thompson & Thurlow,
1999). Many states do not yet have the capacity to disaggregate statewide assessment data
by disability and if they do, they may not be able to calculate the percentage of students
with disabilities actually participating in their assessments. Although assessments have
been the primary means to evaluate educational accountability, students with disabilities
continue to be excluded to a great extent in many states (Thurlow, Elliott, &
Ysseldyke, 1998). As will be shown in this report, school districts across Minnesota are
to be commended for including over 90% of eighth graders with disabilities in state
testing in 1999.
Background Information about
Minnesota’s Basic Standards Tests
Minnesota’s Basic Standards Tests in Reading and Mathematics
were administered statewide for the first time in 1996. Districts could choose whether to
participate in the first testing year. In 1997, participation in testing was required, but
districts could choose to use the state-issued tests or different tests. In 1998, all
districts were required to give the state tests in both Reading and Mathematics beginning
in 8th grade. The Test of Written Composition was initially
administered in 1999 for students in 10th grade. All state public high school students entering 9th grade in 1997 or later must pass these tests before graduation.
Those in the class of 2000 need 70% of the test items correct to pass, while others will
need 75%. Local public school districts may set higher passing scores for their students.
In addition to the Basic Standards Tests, students in the class of 2002 (tenth graders in
school year 1999-2000) will be required to complete a set of 24 high standards within 10
learning areas to receive a high school diploma.
There are three levels of participation allowed on
Minnesota’s Basic Standards Tests for students with Individualized Educational
Programs or 504 Accommodation Plans. Students can either take the state tests as generally
administered, with accommodations as needed (see list of approved accommodations in
Appendix B), take a modified version of the tests and receive the notation
“pass-individual” on their high school transcript, or be exempt from testing all
together. The Minnesota Rule describing the participation of students with IEPs and 504
plans can be found in Appendix C. As of July 1, 2000, students who were previously exempt
from testing will be included through the provision of alternate assessments (see Appendix
A).
Method
The Minnesota Department of Children, Families and Learning
collected the data compiled for this report through the MARSS accounting system.
Descriptive statistical analyses were then run on these data by Minnesota Assessment
Project researchers. Finally, the analyses were translated into tables for discussion in
this report. Information contained in this report was reviewed by special education and
assessment consultants at the Minnesota Department of Children, Families and Learning.
In the past, there were many students whose test scores could not
be accounted for through the state system, because they had missing or inaccurate ID
numbers or changes in their names or locations from year to year. (For example, one year a
student might be listed as Steve Michaels, the next year Stephen Michaels, and maybe the
next year, Michael Stevens!) The data collection system has been refined to the point
that, in 1999, less than 200 of the nearly 200,000 students tested have yet to be
identified within the system. This is a monumental task, and leaders of the Data
Management Team at the Department of Children, Families and Learning are to be highly
commended for their careful and accurate work.
Important Considerations
There are several important considerations in the interpretation
of the data presented in this report. These considerations fall into six areas: reporting
by primary disability; students with Section 504 accommodation plans, date of child count,
additional testing opportunities, modifications and exemptions, and other considerations.
Reporting by primary
disability. Unduplicated child count data are essential for calculating participation
rates—these data become the denominator. Even though many students have multiple
disabling conditions, in order to reduce duplication of students, only a student’s
primary disability is reported. It is important to keep this caution in mind, since a
student’s secondary disability (e.g., learning disability) may affect test scores
more than his or her primary disability (e.g., speech impairment). In other words,
generalizations or conclusions about participation or performance cannot be based simply
on disability category.
Students with Section
504 accommodation plans. Some students are recognized as having disabilities under
another federal law—Section 504 of the Rehabilitation Act of 1973. In the past, only
students receiving special education services were included in these analyses. This year,
we have added the participation and performance of students with 504 accommodation plans.
The numbers are low, however, possibly indicating that some students are not reported as
having 504 plans, or that some students who could benefit from 504 accommodation plans do
not have them. In this report, the designation “students with disabilities”
includes students with 504 accommodation plans in addition to those receiving special
education services.
Date of child count. In
previous years, the number of students with disabilities who were eligible for testing was
determined through child count information reported to the U.S. Department of Special
Education Programs on December 1. This count was taken at least three months before the
actual testing date. Enrollment data for the 1999 tests were updated on the test
administration day, conceivably making it more accurate, since student attrition is not a
factor. The slight change in enrollment is shown in Table 1.
Table
1. Change in Enrollment from Dec. 1 Child Count to Test Day
Disability Category |
Dec. 1 Child Count |
Day of Test Enrollment |
Learning Disability |
4288 |
4141 |
Emotional/Behavioral Disorder |
2092 |
1994 |
Speech Impairment |
776 |
517 |
Other Health Impairment |
652 |
641 |
Mild/Moderate Mental Impairment |
632 |
597 |
Deaf/Hard of Hearing |
166 |
180 |
Visual Impairment |
34 |
28 |
Physical Impairment |
102 |
104 |
Autism |
95 |
80 |
Moderate/Severe Mental Impairment |
200 |
156 |
Additional testing
opportunities. School districts across Minnesota have an additional opportunity to
administer Basic Standards Tests in mid July to students who did not pass the previous
spring. Results of summer test administration are not included in this analysis.
Modifications and
exemptions. Data for this report include test scores, with “passing” defined
as a score at or above 75% (70% for students in the class of 2000). We do not have
information about students who were administered modified tests. In other words, if a
Reading test was read to a student and the student scored 78%, we have no way of knowing
that the test was modified, so we simply included the “78%” with all other test
scores. We also do not have information about the number of students who were formally
exempt from testing; all we know is the number of students who were not tested (for
whatever reason). These designations will be made at the district level on a
student’s final transcript.
Other considerations.
Other reporting considerations include the ongoing possibility of errors in data. There
are now about 1.2 million fields in the MARRS reporting system. As explained above, the
number of errors is far fewer than in initial testing years, but no system recording human
performance can be error free. Another consideration is that there are some students who
are included in the child count who are not tested because they receive their education in
private or home-schools. Finally, to protect the privacy of students, the participation
and performance of groups with less than 10 students are not reported. Cells in the tables
in this report with fewer than 10 students contain the designation “<10”.
Results
Because there are so many ways to look at data across four years
of testing, we have chosen to take several different “snapshots” of findings. We
decided to examine trends both within a single grade each year (8th graders from 1996 to 1999) and for a cohort of students from 8th grade through graduation (class of 2000). We also wanted to
examine the data by disability category, but found it too cumbersome to look at all
disabilities across all grades and years. We found that our “snapshot” of 8th graders in 1999 reflected similar trends across disabilities in
other grades and years, so those are the data included in this report. Since the test of
Written Composition was administered for the first time in 1999, we wanted to show the
participation and performance of 10th graders representing all disability categories on this test.
Finally, 1999 was the first year data were collected on accommodations with enough clarity
to be reported, so these data are also included in this report. In summary, the
“snapshots” examined in the following section include:
•
Participation of 8th graders from 1996 to 1999.
•
Participation of the class of 2000.
•
Participation of the 8th graders tested in 1999, by disability.
•
Performance of 8th graders from 1996 to 1999.
•
Performance of the class of 2000.
•
Performance of the 8th graders tested in 1999, by disability.
•
Participation and performance of 10th graders on the 1999 Test of Written Composition.
•
Testing accommodations used in 1999.
Participation of 8th Graders
from 1996 to 1999
The participation of 8th grade students with disabilities on the 1999 Basic Standards
Tests stands at 90%, the highest yet in the State of Minnesota, and one of the highest
large-scale test participation rates of students with disabilities in the country
(Thompson & Thurlow, 1999). As shown in Figure 1, this compares to an overall
participation rate of 96% for all students. If students with disabilities are removed from
the picture, the overall participation rate increases to 97%.
Figure 1. 1998 and 1999 Test Participation Rates
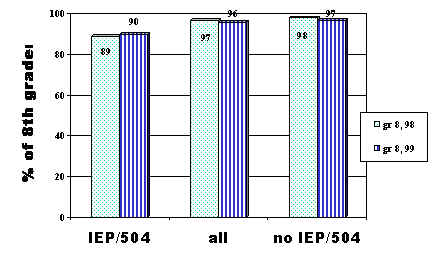
Table 2 shows participation rates for 8th graders with disabilities in Mathematics and Reading since
testing began statewide in 1996. As stated previously, districts were not required to use
state-issued tests in 1996 or 1997. This, in addition to the newness of the tests, may
partially account for the lower participation rates in those years.
Table 2. Participation of 8th
Graders in Basic Standards Tests from 1996 to 1999
|
Child Count |
No. Tested Math |
Percent Tested Math |
No. Tested Reading |
Percent Tested Reading |
1996 8th graders with
disabilities |
8846 |
6256 |
71 |
6132 |
69 |
1996 8th graders without
disabilities |
56801 |
47350 |
83 |
45648 |
80 |
1997 8th graders with
disabilities |
8022 |
4725 |
59 |
4620 |
58 |
1997 8th graders without
disabilities |
57912 |
47204 |
82 |
45766 |
79 |
1998 8th graders with
disabilities |
8426 |
7522 |
89 |
7529 |
89 |
1998 8th graders without
disabilities |
58100 |
56874 |
98 |
56872 |
98 |
1999 8th graders with
disabilities |
8576 |
7711 |
90 |
7708 |
90 |
1999 8th graders without
disabilities |
59357 |
57651 |
97 |
57697 |
97 |
Participation of the Class of 2000
Students in the class of 2000 are the first to be required to
receive a passing score on the Basic Standards Tests in order to receive a diploma. For
this group only, the passing score was set at 70%. Since 1996 was the first testing year,
many 8th graders were not tested, so the number of 9th graders tested for the first time in 1997 that still had not
taken the test was high (see Table 3). Also, the passing rates in 1996, as will be seen
later in this report, were lower than in later years, which may also have contributed to
higher participation rates for 9th graders in 1997. Of the 9th graders without disabilities, 22% were tested in Mathematics and
27% in Reading. The percentage of 9th graders with disabilities tested was much higher, about double
that of their nondisabled peers; 45% in Mathematics and 50% in Reading. In 10th grade, the percent of students without disabilities tested
dropped to 10% in Mathematics and 14% in Reading, and by 11th grade only 6% of the students without disabilities were tested
in Mathematics and 7% in Reading. The number of students with disabilities tested did not
drop as quickly, however. In 10th grade, 38% of the students with disabilities were tested in
Mathematics and 45% were tested in Reading. By 11th grade over a fourth of the students with disabilities had not
yet passed the tests (26% tested in Mathematics and Reading) and took them again, some for
at least the fifth time (since summer testing was offered in several districts).
Table 3. Participation of Students in the
Class of 2000
|
Child Count |
No. Tested Math |
Percent Tested Math |
No. Tested Reading |
Percent Tested Reading |
1996 8th graders with
disabilities |
8846 |
6256 |
71 |
6132 |
69 |
1996 8th graders without
disabilities |
56801 |
47350 |
83 |
45648 |
80 |
1997 9th graders with
disabilities |
7649 |
3427 |
45 |
3862 |
50 |
1997 9th graders without
disabilities |
60945 |
13711 |
22 |
17449 |
27 |
1998 10th graders with
disabilities |
7360 |
2794 |
38 |
3330 |
45 |
1998 10th graders without
disabilities |
61056 |
6059 |
10 |
8483 |
14 |
1999 11th graders with
disabilities |
7288 |
1901 |
26 |
1915 |
26 |
1999 11th graders without
disabilities |
58838 |
3767 |
6 |
3893 |
7 |
8th Grade
Participation by Disability
Participation varied little across most disability categories. In
1999, 8th grade test participation was 96% for students with 504
accommodation plans, and at least 90% for students receiving special education services
across six categories (see Table 4). The percentages of students participating in reading
or math (whichever was highest) were: speech impairments (97%), visual impairments (96%);
learning disabilities (95%); other health impairments (94%), emotional/ behavioral
disorders (91%), and traumatic brain injuries (91%). Students representing other
disability categories participated at a lower rate, with very few students with moderate
to severe mental impairments tested (<10%).
Table 4. 1999 8th Grade Participation by
Disability
|
Child Count |
No. tested
Math
|
Percent
tested
Math |
No. tested
Reading |
Percent
Tested Reading |
All students |
67933 |
65361 |
96 |
65405 |
96 |
Students
without Disabilities |
59357 |
57651 |
97 |
57697 |
97 |
Students with
Disabilities |
8576 |
7711 |
90 |
7708 |
90 |
504
Accommodation Plan |
115 |
110 |
96 |
109 |
95 |
Speech
Impairment |
517 |
495 |
96 |
499 |
97 |
Visual
Impairment |
28 |
27 |
96 |
26 |
93 |
Specific
Learning Disability |
4141 |
3913 |
94 |
3914 |
95 |
Other Health
Impairment |
641 |
601 |
94 |
596 |
93 |
Emotional/Behavior
Disorder |
1994 |
1809 |
91 |
1814 |
91 |
Traumatic
Brain Injury |
22 |
20 |
91 |
19 |
86 |
Deaf/Hard of
Hearing |
180 |
152 |
84 |
149 |
83 |
Physical
Impairment |
104 |
86 |
83 |
86 |
83 |
Mild/Moderate
Mental Impairment |
597 |
437 |
73 |
433 |
73 |
Autism |
80 |
50 |
66 |
54 |
68 |
Moderate/Severe
Mental Impairment |
156 |
10 |
6 |
<10 |
<10 |
Performance of 8th Graders
from 1996 to 1999
Beginning with the class of 2001, students need to complete 75%
of the test items correctly on both the Reading and Mathematics tests in order to meet the
passing level. Future cohorts will be required to pass the Test of Written Composition in
addition, and will be required to meet high standards as well. The performance of 8th graders without disabilities has increased in Reading from 69%
passing at the 70% level in 1996 to 81% passing at the 75% level in 1999 (see Figure 2),
and remained fairly stable across the four testing years in Mathematics (see Figure 3).
The performance of students with disabilities has decreased slightly on the Mathematics
test across each of the four years of testing, with only 27% of the 8th graders with disabilities who were tested in 1999 passing,
compared to 76% of their peers without disabilities (see Table 5).
Figure 2. Percent of 8th Graders Passing Reading
– 1997 through 1999
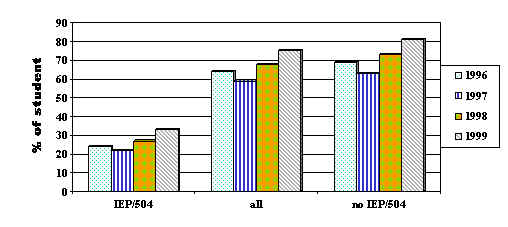
Figure 3. Percent of 8th Graders Passing
Mathematics – 1997 through 1999
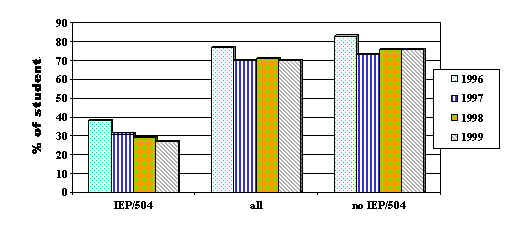
Table 5. Performance of 8th Graders from 1996 to
1999
|
No. Tested Math |
No. Passing Math |
Percent Passing Math |
No. Tested Reading |
No. Passing Reading |
Percent Passing Reading |
1996 8th graders with
disabilities |
6256 |
2352 |
38 |
6132 |
1476 |
24 |
1996 8th graders without
disabilities |
47350 |
39110 |
83 |
45648 |
31645 |
69 |
1997 8th graders with
disabilities |
4725 |
1463 |
31 |
4620 |
1016 |
22 |
1997 8th graders without
disabilities |
47204 |
34629 |
73 |
45766 |
28744 |
63 |
1998 8th graders with
disabilities |
7522 |
2193 |
29 |
7529 |
2054 |
27 |
1998 8th graders without
disabilities |
56874 |
43296 |
76 |
56872 |
41757 |
73 |
1999 8th graders with
disabilities |
7711 |
2096 |
27 |
7708 |
2545 |
33 |
1999 8th graders without
disabilities |
57651 |
43815 |
76 |
57697 |
46635 |
81 |
Performance of the Class of 2000
As would be expected, each year the number of students in the
class of 2000 still working on passing the Basic Standards Tests becomes significantly
smaller. For students without disabilities who were tested, 83% passed the Mathematics
test and 60% passed the Reading test as 8th graders. Of the students tested in 9th grade, the passing rate dropped to 55% in Mathematics and 51% in
Reading. About half of the students without disabilities tested in 10th grade passed and about half of the 11th graders tested also passed. This leaves 2,000 to 2,500 students
to be tested in the summer following their junior year, or during their senior year in
order to receive a diploma and graduate with the rest of their class.
Students with disabilities, however, have not fared quite as well
(see Table 6). Only 38% of the 8th graders passed the Mathematics test, and 24% passed the Reading
test. The number of students remaining to be tested dropped each year, along with the
percent passing. By 11th grade, of the 1,900 students tested, only 13% passed the
Mathematics test and 28% passed the Reading test. This leaves about 1,500 to 2,000
students with disabilities who need to pass the tests during the summer after their junior
year or sometime during their senior year in order to graduate at a “pass state”
level. Students with disabilities, however, have an option of passing a test with
modifications, that is, with changes in the test or allowances for “passing”
with a score set below 70%. Students with disabilities in the class of 2000 can also be
exempt from testing. In the future, students who have previously been exempt from testing
will participate in a state designed alternate assessment.
Table 6. Performance of Students in the Class of 2000
|
No. Tested Math |
No. Passing Math |
Percent Passing Math |
No. Tested Reading |
No. Passing Reading |
Percent Passing Reading |
1996 8th graders with
disabilities |
6256 |
2352 |
38 |
6132 |
1476 |
24 |
1996 8th graders without
disabilities |
47350 |
39110 |
83 |
45648 |
31645 |
69 |
1997 9th graders with
disabilities |
3427 |
669 |
20 |
3863 |
634 |
16 |
1997 9th graders without
disabilities |
13711 |
7526 |
55 |
17449 |
8854 |
51 |
1998 10th graders with
disabilities |
2794 |
502 |
18 |
3330 |
1016 |
31 |
1998 10th graders without
disabilities |
6059 |
2582 |
43 |
8483 |
5001 |
59 |
1999 11th graders with
disabilities |
1901 |
238 |
13 |
1915 |
534 |
28 |
1999 11th graders without
disabilities |
3767 |
1452 |
39 |
3893 |
2101 |
56 |
8th Grade
Performance by Disability
Tables 7 and 8 show the performance of 8th graders on the Basic Standards Tests in Mathematics and Reading
by disability category. Overall, 27% of all 8th graders with disabilities tested passed the Mathematics test.
However, students with 504 accommodation plans and students representing seven disability
categories passed at a higher rate: 504 accommodation plans (43% passed) speech
impairments (46% passed), visual impairments (41% passed), deaf/hard of hearing (38%
passed), autism (38% passed), other health impairments (32% passed), emotional/behavioral
disorders (31% passed), and physical impairments (27% passed). Students representing the
remaining four disability groups, passed at a rate of less than 25%: specific learning
disabilities (24% passing), traumatic brain injury (20% passing), mild/moderate mental
impairments (1% passing), and moderate/severe mental impairments (0 passing).
Table 7. 1999 8th Grade Performance in
Mathematics by Disability
|
No. tested
Math |
Mean Percent
items correct |
No. passing
Math |
Percent
passing Math |
All Students |
65361 |
79.1 |
45911 |
70 |
Students
without Disabilities |
57651 |
82.0 |
43815 |
76 |
Students with
Disabilities |
7710 |
57.1 |
2096 |
27 |
Speech Impairment
|
495 |
67.5 |
227 |
46 |
504
Accommodation Plan |
110 |
66.6 |
47 |
43 |
Visual
Impairment |
27 |
62.5 |
11 |
41 |
Deaf/Hard of
Hearing |
152 |
61.8 |
57 |
38 |
Autism |
50 |
60.5 |
19 |
38 |
Other Health
Impairment |
601 |
59.8 |
191 |
32 |
Emotional/Behavioral
Disorder |
1809 |
59.7 |
561 |
31 |
Physical
Impairment |
86 |
57.5 |
23 |
27 |
Specific
Learning Disability |
3913 |
56.9 |
952 |
24 |
Traumatic
Brain Injury |
20 |
56.1 |
<10 |
20 |
Mild/Moderate
Mental Impairment |
437 |
30.8 |
<10 |
1 |
Moderate/Severe
Mental Impairment |
<10 |
28.2 |
<10 |
0 |
Table 8. 1999 8th Grade Performance in Reading
by Disability
|
No. tested
Reading |
Mean Percent
items correct |
No. passing
Reading |
Percent
passing Reading |
All students |
65405 |
81.0 |
49180 |
75 |
Students
without Disabilities |
57697 |
83.7 |
46635 |
81 |
Students with
Disabilities |
7708 |
60.6 |
2545 |
33 |
504
Accommodation Plan |
109 |
73.4 |
62 |
56 |
Visual
Impairment |
26 |
70.2 |
13 |
48 |
Physical
Impairment |
86 |
68.6 |
45 |
52 |
Speech
Impairment
|
499 |
68.5 |
224 |
45 |
Autism |
54 |
66.4 |
25 |
50 |
Other Health
Impairment |
596 |
65.4 |
236 |
39 |
Deaf/Hard of
Hearing |
149 |
65.0 |
68 |
45 |
Emotional/Behavioral
Disorder |
1814 |
64.9 |
743 |
41 |
Specific
Learning Disability |
3914 |
59.1 |
1120 |
29 |
Traumatic
Brain Injury |
19 |
54.8 |
<10 |
20 |
Mild/Moderate
Mental Impairment |
433 |
36.3 |
<10 |
1 |
Moderate/Severe
Mental Impairment |
<10 |
28.0 |
<10 |
0 |
The passing rate for 8th graders with disabilities was higher on the Reading test than
the Mathematics test, with a 33% passing rate overall. As with the Mathematics test,
students with 504 accommodation plans and students representing seven disability
categories passed the Reading test at a higher rate: 504 accommodation plans (56% passed),
physical impairments (52% passed), autism (50% passed), visual impairments (48% passed),
speech impairments (45% passed), deaf/hard of hearing (45% passed), emotional/behavioral
disorders (41% passed), and other health impairments (39% passed). Students representing
the remaining four disability groups passed at a rate of less than 30%: specific learning
disabilities (29% passing), traumatic brain injury (20% passing), mild/moderate mental
impairments (1% passing), and moderate/severe mental impairments (0 passing).
Participation and Performance on the Test
of Written Composition
1999 was the first year that all Minnesota public school 10th graders were required to be tested in written composition.
Scores were based on the overall quality of a written composition with results scored
across four performance levels:
More than
adequate composition (4) |
Meets state
standard (passing) |
Adequate
composition (3 or 3.5) |
Meets state
standard (passing) |
Inadequate
composition (2) |
Below state
standard (not passing) |
Very
inadequate composition (1 or 1.5) |
Below state
standard (not passing) |
In order to meet the state standard, student compositions were
required to be related to the assigned topic and have a clear central idea, with some
supporting detail and development. Compositions needed to be well organized with only
minor errors in mechanics or spelling.
About 10% fewer students with disabilities were tested in Written
Composition (79%) than in Reading (90%) or Mathematics (90%). This rate was about 15%
lower than the participation rate of students without disabilities (94%). Students with
504 accommodation plans were tested in Written Composition at a rate nearly as high as
that of students without disabilities (93%). Students representing four disability
categories participated at rates higher than 80% (see Table 9), including: visual
impairments (90%), other health impairments (88%), specific learning disabilities (84%),
and deaf/hard of hearing (83%). Students from all other disability groups participated in
the test of Written Composition at a rate of less than 75%, with the smallest number of
participants being students with moderate/severe mental impairments.
Table 9. 1999 10th Grade Participation and
Performance on the Test of Written Composition
|
Child Count |
No. Tested Writing |
Percent
Tested Writing |
Mean
performance level (1-4) |
All Students |
68411 |
63112 |
92 |
3.1 |
Students
without Disabilities |
60167 |
56566 |
94 |
3.2 |
Students with
Disabilities |
8244 |
6546 |
79 |
2.4 |
504
Accommodation Plan |
138 |
129 |
93 |
2.8 |
Visual
Impairment |
20 |
18 |
90 |
3.0 |
Other Health
Impairment |
508 |
445 |
88 |
2.6 |
Specific
Learning Disability |
3725 |
3120 |
84 |
2.4 |
Deaf/Hard of
Hearing |
143 |
119 |
83 |
2.5 |
Emotional/Behavioral
Disorder |
2202 |
1632 |
74 |
2.6 |
Physical
Impairment |
107 |
70 |
65 |
2.9 |
Traumatic
Brain Injury |
23 |
15 |
65 |
2.6 |
Mild/Moderate
Mental Impairment |
635 |
371 |
58 |
2.0 |
Speech
Impairment |
444 |
205 |
46 |
2.6 |
Autism |
69 |
32 |
46 |
2.5 |
Moderate/Severe
Mental Impairment |
229 |
<10 |
3 |
1.7 |
About 90% of the 10th grade test takers without disabilities passed the test of
Written Composition at a performance level of 3 or 4. Forty-one percent of the 10th grade test takers with disabilities reached these performance
levels. The mean performance level of students without disabilities on the test of Written
Composition was 3.1. The mean performance level of students with disabilities ranged from
3.0 (students with visual impairments) to 1.7 (students with moderate/severe mental
impairments). The performance levels of students with 504 accommodation plans and students
representing each disability category are shown in Table 9.
Discussion
Participation of students with disabilities in Minnesota’s
Basic Standards Tests has been maintained at a high rate over four years. At the same
time, there has been general low performance of these students on the tests. This remains
a critical concern. As testing continues over the next few years, there are several
important issues to address and areas to continue to improve. This discussion focuses on
four of these issues: increased referrals for special education and Section 504
accommodation services, lack of coordination in the use of test accommodations, overuse of
alternate assessments by students who could participate in the general assessments, and
inequitable access to instruction toward high standards for students with disabilities.
Each of these issues is addressed below.
Increased Referrals for Special Education
and Section 504 Accommodation Services
Watch for increased referrals for special education and 504
accommodation services by students, parents, and teachers looking for ways to graduate
students who do not pass the Basic Standards Tests. At this time, there are little data
available across the state to show any recent change in referral rates for these services,
and in districts where data are available, referral rates at the high school level have
not increased (Minnema, Thompson, Thurlow, & Barrow, 2000). Whether this finding
indicates that there really will not be increased referrals, or that there will not be in
places that collect data and track referral rates is unknown. Still, this is an area that
needs to be watched carefully over the next few years. New referrals at the high school
level may not be all bad news, however, as long as the numbers do not become large. There
may be students who should have been receiving special education services all along, and
who “slipped through the cracks” by not receiving the help they needed. With
statewide testing, individual needs that may have been missed along the way could be
brought to light.
Lack of Coordination in the Use of Test
Accommodations
There is evidence that making decisions about needed
accommodations and actually providing accommodations is still an emerging area (Fuchs,
Fuchs, Eaton, Hamlett, & Karns, in press;
Thompson & Thurlow, 1999). As the use of test accommodations among students with
disabilities increases, it will be important to improve information and coordination at
five important stages:
1. Students
need many opportunities to discover how they learn best and which accommodations are most
helpful for them in testing, instructional, and general life settings.
2. Accommodations
need to be addressed by each student’s IEP or 504 team, recorded on the IEP or 504
accommodation plan, and updated at least annually.
3. Students
need to be able to advocate for the accommodations they need across all life settings.
4. Accommodations
listed on each student’s IEP or 504 accommodation plan need to be documented on a
district-wide database that is used for ordering special test booklets (i.e.,
short-segment, large print) and used by test administrators to make sure that students get
needed accommodations on test day.
5. There
needs to be a way to compile a list of the number of students who actually used each
accommodation for each test. This list needs to be aggregatable at the state level in
order to make more informed decisions about allowable testing accommodations and policies
statewide.
Overuse of Alternate Assessments by
Students Who Could Participate in General Assessments
There is some concern that once the alternate assessment is in
place and as students reach the point in their school careers where they still have not
passed tests at the “state level,” a number of students who may be able to
participate in the general assessment will be placed in the alternate assessment instead.
Some believe that students should not be “forced” to take tests that no one
thinks they will do well on anyway. Others fear that including students with potentially
low scores will make schools, programs, or teachers “look bad.” At this time, it
is estimated that no more than two percent of all students at a grade level (15 to 20
percent of students with disabilities) will participate in alternate assessments. If this
level begins creeping up, it will be important to look at the reasons why and address the
issues surrounding those reasons.
Inequitable Access to Instruction Toward
High Standards for Students with Disabilities
There is some concern that students who perform poorly in basic
academic areas need extra instruction in separate settings by special educators, at the
expense of important instruction toward high standards. Schools that are successfully
including students with disabilities in instruction toward high standards have found that
good support in general education settings, with accommodations as needed, and lots of
hands-on, practical instruction, raises expectations that students with disabilities can
meet high standards (Thompson, Thurlow, Parson, & Barrow, 2000).
Summary
Many important gains have been made in the meaningful
participation of students with disabilities in Minnesota’s Basic Standards Tests.
These gains, along with ongoing discussion about tough issues and challenges, have
propelled Minnesota closer to the important goal of having an inclusive accountability
system, a system that truly “measures what we treasure.” For this reason, it
will be critical to continue to compile and report annually on the participation and
performance of students with disabilities on Minnesota’s Basic Standards Tests.
Beyond reporting, it will also be essential to carefully evaluate the meaning and
implications of the data.
References
Fuchs, L. S., Fuchs, D., Eaton, S. B., Hamlett, C., & Karns,
K. (in press). Supplementing teacher judgments of test accommodations with objective data
sources. School Psychology Review.
Minnema, J., Thompson, S. J., Thurlow, M. L, & Barrow, S.
(2000). Unintended consequences of the Minnesota
Basic Standards Tests: Do the data answer the questions yet? (Minnesota Report 23).
Minneapolis, Minnesota: University of Minnesota, National Center on Educational Outcomes
Thompson, S. J. & Thurlow, M. L. (1999). 1999 state special education outcomes: A report on
state activities at the end of the century. Minneapolis, Minnesota: University of
Minnesota, National Center on Educational Outcomes.
Thompson, S. J., Thurlow, M. L., Parson, L., & Barrow, S.
(2000). Initial perceptions of educators as they
work toward including students with disabilities in Minnesota’s high standards
(Minnesota Report 25). Minneapolis, Minnesota: University of Minnesota, National Center on
Educational Outcomes.
Thurlow, M. L., Elliott, J. L. & Ysseldyke, J. E. (1998). Testing students with disabilities: Complying with
district and state requirements. Thousand Oaks, CA: Corwin Press.
Appendix A
IDEA Requirements: Participation in Assessment
Section 612 – State Eligibility (a) (17)
(A) in general
Children with disabilities are included in general
State and district-wide assessment programs, with appropriate accommodations, where
necessary. As appropriate, the State or local educational agency –
(i) develops guidelines
for participation of children with disabilities in alternate assessments for those
children who cannot participate in State and district-wide assessment programs; and
(ii) develops and, beginning not later than July 1, 2000, conducts those alternate
assessments.
(B) Reports
The State educational
agency makes available to the public, and reports to the public with the same frequency
and in the same detail as it reports on the assessment of nondisabled children, the
following:
(iii) (I) the performance of
those children on regular assessments (beginning not later than July 1, 1998) and on
alternate assessment (not later than July 1, 2000), if doing so would be statistically
sound and would not result in the disclosure of performance results identifiable to
individual children.
(II) data
relating to the performance of children described under subclause (I) shall be
disaggregated –
(aa) for assessments conducted after July 1, 1998; and
(bb) for
assessments conducted before July 1, 1998, if the State is required to disaggregate such
data prior to July 1, 1998.
Section 614 – Individualized education program
The term
‘individualized education program’ or ‘IEP’ means a written statement
for each child with a disability that is developed, reviewed, and revised in accordance
with this section and that includes –
(v) (I) a statement of any
individual modifications in the administration of State or districtwide assessments of
student achievement that are needed in order for the child to participate in such
assessment; and
(II) if
the IEP Team determines that the child will not participate in a particular State or
districtwide assessment of student achievement (or part of such an assessment), a
statement of –
(aa) why that assessment is not appropriate for the child; and
(bb) how the child will be assessed.
Appendix B
Accommodations Allowed on Minnesota's Basic Standards Tests
Guidelines for accommodations:
An accommodation is defined as any change in
testing conditions which does not alter the validity or reliability of the state standard.
Accommodations may not compromise the security of the test and should be consistent with
the goals of the student's IEP or 504 plan. Students who have accommodations will have
their tests scored according to state scoring procedures.
Typically, accommodations allow a change in one or
more of the following areas:
· presentation format
· test setting
· scheduling or timing
· response format
Since the testing requirements vary, not every
accommodation is appropriate or permitted for every test. Specific accommodations are
indicated for specific subject areas.
Accommodations, which require alternate test
booklets, testing materials or special handling, are noted. Alternate materials must be
requested on the Statewide Testing Registration/Order form.
When selecting accommodations for students, IEP or
504 teams should consider the needs of the student in daily instructional situations as
well as any additional needs that might arise in a secure testing situation. Students may require multiple accommodations such as
interpreted directions and extended time. The following is a suggested list of
accommodations. If you wish to provide an accommodation not listed, please check with
either the division of Special Education or the Office of Graduation Standards at the
Minnesota Department of Children, Families and Learning.
Alternate Presentation Formats
Accommodation |
Test |
Directions
may be given in any format necessary to accommodate students (signing, auditory
amplification, repeating, etc.) Test administrators must use the script in the testing
manual to explain the task to students. They will not be allowed to go beyond the script
in giving or clarifying directions.
Directions are found in the test
administration manual. These are non-secure documents and may be received prior to test
administration. |
Mathematics
Reading
Written
Composition |
Large-print
is an enlarged copy of the test. Students who use the large-print edition will be
allowed to mark their answers on the large-print test booklets. (Large print is in Times
Roman and is available in 14, 18, 24 and 36-point font size.)
Answers must be transferred to a
scannable answer sheet by school testing personnel. Transfer of answers must be documented
(including the names of the school personnel involved) on the Testing Report form. Be sure
to check the accuracy of any transferred answers. |
Mathematics
Reading
Written
Composition
*Special Order Materials |
Braille
versions of all tests are available to students who are blind or partially sighted,
and are trained in this system. Student responses may be recorded in one of the following
ways:
·
recorded by a
proctor,
·
marked in the
booklet by the student,
·
recorded with a
typewriter or word processor,
·
dictated to a
scribe, or
·
recorded by the
student using a Braillewriter or a slate and stylus.
A copy of Braille tests will be
provided in regular print to test administrators or proctors working with students at the
time of testing.
Answers must be transferred to a
scannable answer sheet by school testing personnel. Transfer of answers must be documented
(including the names of the school personnel involved) on the Testing Report form. Be sure
to check the accuracy of any transferred answers. |
Mathematics
Reading
Written
Composition
*Special Order Materials |
Magnification
or low vision aids may be used by visually impaired students to read tests. |
Mathematics
Reading
Written
Composition |
Templates
to reduce visual print field may be used by students to read tests. |
Mathematics
Reading
Written
Composition |
Audiocassettes
may be provided for students who have difficulty with printed words or numbers and/or who
acquire knowledge primarily through the auditory channel. (Materials must be ordered
separately).
Note: Cassettes should be ordered for
each student and administered using headphones or in individual stations. |
Mathematics
*Special Order Materials |
A
script of the audio cassette may be provided for testing personnel to read or
interpret the Mathematics test for any student who has difficulty with printed words or
numbers and for whom the audio cassette is not appropriate. |
Mathematics
*Special Order Materials |
Interpretation of the Mathematics test may be provided for deaf or hard
of hearing students. The audiocassette or the audiocassette script must be used for
interpreting as it has been carefully prepared to maintain the validity of the test. Only
literal interpretation of the script is acceptable as an accommodation. |
Mathematics
*Special Order Materials |
Large
print answer booklets may be provided for students who, due to the size of their
handwriting, require more space for Written Composition. |
Written
Composition
*Special Order Materials |
Short
segment test booklets may be ordered for students who are unable to take the entire
test in one sitting. These tests may be administered only on the official date during the
designated instructional test day. (These are only available for the Basic Standards
Test.) |
Mathematics
Reading
*Special Order Materials |
Alternate
Scheduling and Setting Formats
Accommodation |
Test |
Extended
time may be provided to any student. While each test has a suggested amount of time
for test administration, there is no limit to the amount of time a student may be allowed
with in the officially designated instructional test day. Every student should be given
sufficient time to respond to every test item. |
Mathematics
Reading
Written
Composition |
Individual or small group
administration may
be provided to students who may need to take a test alone in a room or with a small group
of students. For example, students who will need additional time, use an audiocassette
version of the Mathematics, etc. should be allowed to test in a separate room. |
Mathematics
Reading
Written
Composition |
Special
settings may be provided for students. tests may be administered in rooms with special
lighting, acoustics, or furniture to accommodate needs. |
Mathematics
Reading
Written
Composition |
Testing time during instructional day may be adjusted according to the
needs of the student. Students may test at any time during the officially designated
instructional test day. |
Mathematics
Reading
Written
Composition |
Alternate Response Formats
Accommodation |
Test |
BrailleWriters
may be used by students who are trained to use them. Since BrailleWriters include
"spellcheckers" which cannot be removed from the machine, a monitor must verify
that the student has not activated this portion of the BrailleWriter program.
Answers must be transferred to a
scannable answer sheet by school testing personnel. Transfer of answers must be documented
(including the names of school personnel involved) on the Testing Report form. Be sure to
check the accuracy of any transferred answers. |
Mathematics
Reading
Written
Composition |
Word
processors or similar assistive devices may be used if the IEP or 504 team determines
it would be appropriate. Students may not have access to the following features of word
processing programs: spell check, thesaurus, grammar check, or other reference or
preparation materials.
Student responses to the Test of
Written Composition, which are produced by word processors, must be attached to the
scannable Writing booklet. Personal information must be filled in by testing personnel in
the district. (Answer documents require special handling for return to NCS.)
Answers for the Reading and Mathematics
tests must be transferred to a scannable answer booklet by school personnel. Transfer of
answers must be documented (including the names of school personnel involved) on the
Testing Report form. Be sure to check the accuracy of any transferred answers. |
Mathematics
Reading
Written
Composition |
Voice-activated
computers may be used by students who are trained to use them. Students may not have
access to the following features of word processing programs: spell check, thesaurus,
grammar check, or other reference or preparation materials.
For the test of Written Composition,
dictated spelling and punctuation must be verified by the student author. Students must
spell out every word and give punctuation for a scribe to write following the dictation of
the composition. Scribes must be impartial and should be experienced in transcription.
They must write EXACTLY what the student dictates. Students may be given scripted
responses for editing purposes.
Student responses to the test of
Written Composition, which are produced by voice-activated computers, must be attached to
the scannable Writing booklet. Answers for the Reading and Mathematics tests must be
transferred to a scannable answer sheet by school personnel. Personal information must be
filled in by testing personnel in the district.
Transfer of answers must be documented
(including the names of school personnel involved) on the Testing Report form. Be sure to
check the accuracy of any transferred answers. |
Mathematics
Reading
Written
Composition |
Writing
directly in the test booklet is permitted for any student. For example, students may
wish to use a highlighter on the Reading selections or write out calculations next to
Mathematics problems.
Note: Grade 5 test booklets are not
scored. Answers must be transferred to the answer document. (See the section below.) |
Mathematics
Reading
Written
Composition |
Mark
answers in the test booklets. Students may record answers directly onto the test
booklets. School testing personnel must transfer answers to the scannable answer sheet.
For grade 5, the transfer of answers must be documented (including the names of school
personnel involved) on the Testing Report form. Be sure to check the accuracy of any
transferred answers. Grade 3 students have scannable test booklets. |
Mathematics
Reading
|
Tape
recorders may be used to record answers if the student is unable to mark a scannable
answer sheet.
Answers must be transferred to a
scannable answer booklet by school testing personnel. Transfer of answers must be
documented (including the names of school personnel involved) on the Testing Report form.
Be sure to check the accuracy of any transferred answers. |
Mathematics
Reading
|
Tape recording of the Reading Test may be done in individual testing
settings. The student may read the Reading test into a tape recorder. The tape may be
replayed by the student as the test is taken. |
Reading
|
Tape
recording of pre-Writing is permitted in individual testing settings. Students may
record their ideas to assist in pre-Writing organization. The students may replay their
dictation as they organize their compositions. |
Written
Composition |
Scribes
may be provided for students whose visual motor responses inhibit their ability to write
answers. Scribes must be impartial and should be experienced in transcription. They must
write EXACTLY what the student dictates. Students must spell out every word and give
punctuation for a scribe to write following the dictation of the composition. Students may
be given scripted responses for editing purposes.
Personal information must be
transferred to a scannable answer sheet by school testing personnel. The transcription
must be documented (including the names of school personnel involved) on the Testing
Report form. |
Written
Composition |
An
Abacus may be used in place of a calculator on the calculator portion of the
Mathematics test. |
Mathematics |
Appendix C
Minnesota Assessment Provisions for Students with IEPs and
504 Accommodation Plans
3501.0090 STUDENTS WITH INDIVIDUALIZED
EDUCATION PLANS OR SECTION 504 ACCOMMODATION PLANS.
Subpart 1. Considerations for students
with IEPs or section 504 accom. plans
A. The IEP or section 504 accommodation plan for a student with a disability
shall identify one of the following decisions for each of the Basic requirements:
1.
the student is expected to achieve the statewide
standard with or without testing accommodations;
2.
the student is expected to achieve the statewide
standard at an individually modified level of difficulty; or
3.
the student is exempt from the statewide standard.
An exemption from the statewide standard shall be granted to a special needs
student when the student cannot demonstrate the required degree of learning with
appropriate accommodations or modifications if:
1.
the student's IEP or section 504 accommodation plan
does not and never has included the requirements on which the tests are based; or
2.
the student is enrolled in special education classes
for the subject matter included in the test, but the student's IEP or section 504
accommodation plan does not include a majority of concepts tested.
B. Adoption of modifications or exemptions for a student as stated in item A,
shall occur concurrently with the adoption of transition goals and objectives as required
in Minnesota Statutes, section 120.17, subdivision 3a, clause (1).
Subp. 2. Testing students with IEPs
or section 504 accommodation plans.
A. All students shall be tested under standard conditions as specified by the
developer of the test except those students whose IEPs specify other decisions consistent
with subpart 1, item A.
B. Decisions regarding appropriate testing conditions including a decision to
provide accommodations for a student with special needs shall be made by the local school
district through the IEP process or the section 504 accommodation plan process and shall
be reviewed annually.
C. Where subpart 1, item A, subitem (2), applies, the student's IEP or
section 504 accommodation plan shall define an appropriate assessment of the statewide
standard at a modified level of difficulty. Achievement of the individually modified
standard shall be certified only through documented student performance of the defined
assessment.
Top of page |