Relationships Between a Statewide Language Proficiency Test and Academic
Achievement Assessments
LEP Projects Report 4
Published by the National Center on
Educational Outcomes
Prepared by Kentaro Kato,
Debra Albus, Kristin Liu, Kamil Guven, and Martha Thurlow
August 2004
Any or all portions of this document may be reproduced and
distributed without prior permission, provided the source is cited as:
Kato, K., Albus, D., Liu, K., Guven, K., &
Thurlow, M. (2004). Relationships between a statewide language proficiency test and academic
achievement assessments (LEP Projects Report 4). Minneapolis, MN: University of Minnesota,
National Center on Educational Outcomes. Retrieved [today's date], from the World Wide
Web: http://education.umn.edu/NCEO/OnlinePubs/LEP4.html
Executive Summary
Minnesota is one of many states
that began development of an English proficiency test before federal
requirements were in place to do so. It had decided to put into place a test
that would provide the state with a better and more uniform gauge of how its
population of English language learners (ELLs) was doing in their acquisition of
academic English language skills. Minnesota chose to adapt its test, the Test of
Emerging Academic English (TEAE), from the Illinois Measure of Academic Growth
in English (IMAGE). The TEAE is designed to gauge the growth of emerging
academic English language skills across all grades, including three forms
spanning grades 3-4, 5-6, and 7-8. The 7-8 form is also designed for use with
students above grades 7-8.
This report focused on state ELL performance on the TEAE, in comparison to ELL
and fluent English student performance on Minnesota’s Comprehensive Assessment
(MCA) in reading in 3rd and 5th grade, and Minnesota’s Basic Skills Test (BST)
in reading in 8th grade. The TEAE is designed to measure the basic English
proficiency required for pursuing higher-level academic achievement, while the
MCA is designed to measure academic achievement toward the state standards. The
Basic Skills Test in reading measures the basic skills needed to be able to
graduate. Across these comparisons, our guiding research questions were to find
out what levels of the TEAE best predicts success on the MCA and BST, and
whether the state decision to count as proficient those ELLs who achieve at
level 4 on the TEAE has a sound base of support from an assessment perspective.
Study 1 addresses the questions related to the TEAE and the MCAs. Study 2
addresses the same questions for the TEAE and the BST.
Key Findings:
Study 1: TEAE and the MCA
-
ELLs in TEAE level 4 are likely
to do as well as native English speakers on the MCA, recognizing that there
is a range of performance among native speakers.
-
Although the specific
predictive relationship (i.e., what TEAE score corresponds to what MCA
score) can differ, the positive relationship between students’ performance
on the two tests is stable across years and grades.
-
For students with TEAE scores
below about 110, there is less ability to predict MCA scores.
-
Most students in TEAE level 3
fall into MCA levels 2A, 2B, or 3 and therefore although it is likely that
many within this group score as proficient (i.e., 2B or 3) others may not
(2A).
Study 2: TEAE and the BST.
-
TEAE scale scores had moderate
predictive power for BST performance. However, the predictability is not as
good as for the MCA.
-
To predict that a student would
be likely to pass the BST, he or she must score at least 260 (i.e., achieve
level 3) on the TEAE.
In conclusion, there might be
stronger relationships between the MCA and 3rd and 5th grade reading skills on
the TEAE because the academic language skills measured on the TEAE fit those
elementary grades better. Other factors besides potential discrepancies between
secondary grade level skills and basic academic language skills may also account
for differences in performance between the tests. These include differences in a
learner’s age upon entering Minnesota schools, differences based on student
familiarity or lack of familiarity with topical content and vocabulary for
individual passages encountered on the tests, and teachers’ own anecdotal
evidence which suggests that some students who take the TEAE do not take the
test seriously. Any combination of these and other individual student factors
could contribute to the TEAE not predicting success on the BST as well as on the
MCA.
Overview
Minnesota is one of many states that
began development of an English proficiency test before federal requirements
were in place to do so. It had decided to put into place a test that would
provide the state with a better and more uniform gauge of how its population of
English language learners (ELLs) was doing in their acquisition of academic
English language skills. Minnesota chose to adapt its test, the Test of Emerging
Academic English (TEAE), from the Illinois Measure of Academic Growth in English
(IMAGE). The TEAE, begun before Title III legislation required an annual growth
measure for English proficiency under the No Child Left Behind Act of 2001, is
now used to serve accountability purposes at federal and state levels, and is
the official measure to provide on-going identification of English language
learners in Minnesota for the purpose of state funding. This said, a student’s
proficient scores on the TEAE reading and writing tests do not prohibit him or
her from receiving on-going ESL/bilingual support as deemed feasible by local
districts.
The TEAE is designed to gauge the
growth of emerging academic English language skills across all grades, including
three forms spanning grades 3-4, 5-6, and 7-8. The 7-8 form is also designed for
use with students above grades 7-8. Gauging growth in academic English, and even
defining it, is a challenge for language acquisition specialists and assessment
specialists alike. The different viewpoints on what constitutes academic English
(Bailey, Butler, LaFramenta, & Ong, 2004; Chamot & O’Malley, 1994; Cummins,
1979; Scarcella, 2003; Solomon & Rhodes, 1995; Stevens, Butler, & Castellon-Wellington,
2000), makes the design, implementation, and interpretation of such a
proficiency test complex at best, especially when translating back the results
into what academic language skills a student truly needs for success across
content classrooms such as reading and mathematics.
This report focuses on state ELL
performance on the TEAE, in comparison to ELL and fluent English student
performance on Minnesota’s Comprehensive Assessment (MCA) in reading in 3rd and
5th grade, and Minnesota’s Basic Skills Test in reading in 8th grade (BST). The
TEAE is designed to measure the basic English proficiency required for pursuing
higher-level academic achievement, while the MCA is designed to measure academic
achievement toward the state standards. The Basic Skills Test in reading
measures the basic reading skills needed to be able to graduate. Across these
comparisons, our guiding research questions are to find out what levels of the
TEAE best predicts success on the MCA and BST, and whether the state decision to
count as proficient those ELLs who achieve at level 4 on the TEAE has a sound
base of support from an assessment perspective. Study 1 addresses the questions
related to the TEAE and the MCAs, Study 2 addresses the same questions for the
TEAE and the BST.
Study 1: TEAE and MCA
Method
In Study 1, we use the Minnesota
state test data of third and fifth graders in school year (SY) 2001-02 and
2002-03. Although the TEAE consists of reading and writing tests, we focus only
on the reading test and its relationship with the MCA reading test. Hereafter,
they are simply denoted by TEAE and MCA, respectively. The MCA data include test
scores of all students who participated in the state assessment. The TEAE data
consist of test scores of ELLs. The TEAE data originally contained 5,161 third
graders and 4,688 fifth graders in SY 2001-02, and 5,123 third graders and 4,683
fifth graders in SY 2002-03. The MCA data originally contained 61,922 third
graders and 64,408 fifth graders in SY 2001-02, and 60,018 third graders and
63,350 fifth graders in SY 2002-03. The data files for the same school year were
merged using the student ID as the key variable. At this step, students with
invalid or no student ID number were flagged so that they would not be used in
the subsequent analyses. The merged data were then screened to exclude students
who had any missing value on variables related to test scores (i.e., raw scores,
subscale scores, and scaled scores; if any of these is missing, then other
scores are not reliable even if they are recorded). Students who are recorded as
“not tested” on MCA were also excluded. The resulting sample sizes are shown in
the third column in Table 1.
Table 1. Descriptive
Statistics for TEAE and MCA Data
|
Year |
Grade |
N |
TEAE Reading
Scale Score |
MCA Reading
Scale Score |
r |
|
Mean |
SD |
Min |
Max |
Mean |
SD |
Min |
Max |
|
01-02 |
3 |
4361 |
186.22 |
35.26 |
14 |
383 |
1309.11 |
178.22 |
870 |
2050 |
.72 |
|
02-03 |
3 |
4541 |
181.94 |
39.31 |
5 |
408 |
1348.70 |
163.21 |
390 |
2060 |
.71 |
|
01-02 |
5 |
3983 |
227.94 |
44.05 |
25 |
377 |
1334.35 |
197.35 |
710 |
2060 |
.73 |
|
02-03 |
5 |
4238 |
216.60 |
39.85 |
9 |
425 |
1378.74 |
179.44 |
540 |
2220 |
.73 |
Note. N is sample size, SD
is standard deviation, and r is sample correlation between TEAE and MCA.
Next, we examined the relationship
between the two tests. English proficiency as measured by the TEAE is considered
to be prerequisite to minimal performance on the MCA. Thus, we expect that
performance on the two tests is positively related, but detailed analysis will
reveal more specifically the degree to which they are related. We analyzed the
data in three ways based on how the results of these tests may impact practice.
The first analysis examines the
relationship between the two tests at the scale score level. The scale scores of
the TEAE and the MCA represent English proficiency and academic achievement
toward the state standards, respectively. Every year performance on both tests
is converted from raw scores so that they have similar distributions across
years irrespective of changes in test items. Based on our research questions, we
inspected scatter plots of the MCA and TEAE, and then applied regression
analysis to examine the extent to which the MCA scale score is predicted by the
TEAE scale score.
The second analysis focused on the
relationship between the two tests by the proficiency or achievement level. The
MCA has five achievement levels, I, IIa, IIb, III, and IV, based on cutoff
points set on the scaled score. Students who are in level IIb or above are
counted as “achieved” for accountability purposes in Minnesota. The TEAE has
four levels to represent English language proficiency based on the scale score.
On both the MCA and the TEAE, each level is associated with a specific
description of progress toward the state standards (MCA) or English proficiency
(TEAE), and thus gives a brief and clearer interpretation of a test result.
Also, using such levels makes the results less sensitive to measurement errors
on scale scores. Examining the relationship between the two tests by the
proficiency or achievement level leads to relating a specific level of English
proficiency to a specific achievement level.
The third analysis is motivated by
the regulation that ELLs who have achieved the highest proficiency level (level
4 on reading and level 5 writing) on the TEAE are no longer eligible for funding
for LEP programs because they are regarded as having English proficiency
sufficient to access the academic content in the mainstream without further
language support. If results of the TEAE reflect this reasoning, then the
distribution of MCA scores of ELLs who are in the highest English proficiency
level are comparable to those of students who are not ELLs. In other words, the
means of the MCA score distributions of both groups of students should be almost
the same and the ranges of the distributions should substantially overlap.
Accordingly, the distribution of MCA scale scores for each of the TEAE
proficiency levels will be compared with the distribution of native English
speakers. Test scores of native English speakers were taken from the Minnesota
state test data as well, and those data were screened in the same manner as for
the TEAE.
Results
Descriptive Statistics for the Entire Sample
Descriptive statistics by grade and year were shown in Table 1. Within each
school year, fifth graders had higher mean scores on both the TEAE and MCA as
expected. Fifth graders had larger variability on the MCA than third graders in
both school years. Fifth graders had larger variability than third graders also
on the TEAE in 2001-02, while there is little difference in 2002-03.
Correlations between the TEAE and MCA are larger than .70 for all grades and
years. This indicates an overall stable, positive relationship between the TEAE
and MCA. Still, it is worthy of more detailed examination.
Analysis of Scale Scores
Scatter plots.
Scatter plots of MCA scale scores and TEAE scale scores by grade and year are
shown in Figures 1 through 4. These plots consistently indicate that the
majority of points are positively correlated. However, there is a group of
points that do not follow that major pattern in the region where TEAE scale
scores are less than a given point. For third graders in 2001-02, for example,
data points with TEAE scores less than about 100 seem to have almost no
correlation while the majority of data points are positively correlated. For
these "irregular" points, MCA scores looked highly unpredictable based on TEAE
scores. Thus, it is better to separate these points in order to investigate the
relationship that applies to the majority of students in the data set. The
question is, however, at what point we should separate regular and irregular
cases; there is no indicator variable that separates these two types of points
in the data files.
Figure 1. Scatter plot of MCA and TEAE
scale scores (2001-02, Grade 3)
Figure 2. Scatter plot of
MCA and TEAE scale scores (2002-03, Grade 3)
Figure 3. Scatter plot of
MCA and TEAE scale scores (2001-02, Grade 5)
Figure 4. Scatter plot of
MCA and TEAE scale scores (2002-03, Grade 5)
To estimate a cut off point for the
scale scores for each grade and year, the following simple linear regression
model is applied to the regular group of students (i.e., students with TEAE
scores greater than the cutoff point) to assess the predictability of the TEAE
on the MCA:
MCA = (Intercept) + b1
(TEAE) + e
Although there probably are multiple
ways to estimate the cutoff point, a change point analysis is used for this
purpose. It searches for the best cutoff point by fitting two different linear
regression models for regular and irregular groups, respectively.
It should be noted that the TEAE
scale scores show some discreteness in the score range above 300 (i.e., there
are big jumps between two adjacent possible scale scores) in the score range
above 300. This is more apparent for fifth graders, because more students marked
scores close to the maximum possible scale score. This discreteness results from
the scaling, which depends on the distribution of raw scores in each grade and
year.
Estimation of Cutoff Scores
Estimated cutoff scores are shown in
the third column in Table 2. The mean squared errors of MCA scores in the
irregular group estimated by the change point analysis were 167.97 and 163.53
for grade 3 (2001-02 and 2002-03, respectively), and 132.15 and 201.24 for grade
5 (2001-02 and 2002-03, respectively). These are almost the same as the
unconditional standard deviations listed in Table 1 except for fifth graders in
2001-02. Thus, we can conclude that MCA scores of students with TEAE scores less
than the cutoff points are not well predicted by the TEAE. Although these cutoff
points vary across years and grades, the unpredictability is likely to occur
when the TEAE score is less than about 110.
Table 2. Estimates of cutoff
scores and regression coefficients
|
Year |
Grade |
Cutoff |
N |
Intercept
(b0) |
Slope
(b1) |
R2 |
|
01-02 |
3 |
124.87 |
4217 |
501.46 |
4.29 |
.58 |
|
02-03 |
3 |
114.39 |
4417 |
739.63 |
3.31 |
.54 |
|
01-02 |
5 |
131.93 |
3953 |
561.85 |
3.38 |
.54 |
|
02-03 |
5 |
130.71 |
4161 |
593.82 |
3.60 |
.56 |
Note. Intercepts and slopes
are for the “regular” group of students with TEAE scores greater than the cutoff
point. N is the number of students included in the regular group, and R2
is the squared multiple correlation.
Regression Analysis for the Regular Group
In the fourth through seventh
columns in Table 2 are shown the number of students in the regular group,
estimated intercept, slope, and R squared for the regular group of students
(i.e., students with TEAE scores greater than the cutoff point). The slopes
range from 3.31 to 4.29, and the corresponding R2s range from
.54 to .58. These results indicate that more than 54% of variation of the MCA
scale score can be accounted for by the TEAE scale score for the regular group
of students. This is a strong positive relationship. The results also indicate,
however, that slopes vary to some extent across years and grades. The estimated
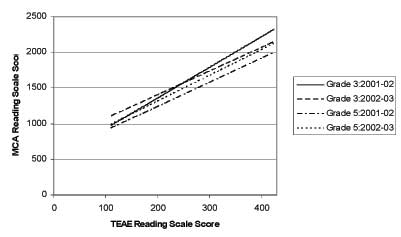
regression lines are plotted in Figure 5. As the slope estimates indicate, the
lines are almost parallel except for grade 3 in 2001-02, where the regression
line is slightly steeper than the others. Also, vertical locations of the lines
vary in the 200 range for the MCA score scale. The lines for grade 3 are higher
than those for grade 5 in Figure 5, but more longitudinal data would be required
to infer systematic effects of grade levels on regression lines. Overall,
although the specific predictive relationship (i.e., what TEAE score corresponds
to what MCA score) can differ, the positive relationship between the two tests
is stable across years and grades. Thus, we expect that increased English
proficiency is associated with progress toward the state academic standards.
Figure
5. Comparison of Estimated Regression Lines
Relationship by Proficiency or Achievement Level
Grade 3 TEAE Level and MCA Level Correspondence
Tables 3 and 4 show the number of
third graders cross-classified by TEAE proficiency levels and MCA achievement
levels in 2001-02 and 2002-03. Level 1 of the TEAE includes the “irregular”
group of students found in the analysis of scale scores.
Both 2001-02 and 2002-03 results
consistently indicated the following. First, students in TEAE level 1 are likely
(about 80%) to be in level 1 on the MCA, and thus to be counted as "not
proficient" for accountability purposes. This is a clear indication that basic
English proficiency is a prerequisite to achieving higher-level academic reading
skills. Second, students in TEAE level 4 are likely to achieve level 3 or 4 on
MCA, and thus to be counted as proficient for accountability purposes (the
result for 2001-02 may not be reliable due to the small sample size of 24 in
TEAE level 4). Thus, proficient English learners can do well on the MCA.
Finally, TEAE levels 2 and 3 seem to have no single corresponding level on the
MCA. Most students in TEAE level 2 fall in MCA level 1, 2A, or possibly 2B,
although they are unlikely to be proficient (2B) on the MCA. Also, most students
in TEAE level 3 fall into MCA levels 2A, 2B, or 3. They are likely to be
proficient on the MCA but there is still some possibility that they would not be
proficient.
Although there is no clear
one-to-one correspondence between the TEAE proficiency levels and the MCA
achievement levels, ELLs who are in TEAE level 3 or 4 are likely to be
proficient (i.e., scoring in level 2B or above) on the MCA.
Table 3. Correspondence
between TEAE Proficiency Levels and MCA Achievement Levels (2001-02, Grade 3)
|
|
|
|
MCA Reading
Achievement Level |
Total |
|
|
|
|
1 |
2A |
2B |
3 |
4 |
|
|
TEAE Reading
Proficiency Level |
1 |
Count |
1406 |
274 |
51 |
23 |
1 |
1755 |
|
|
Row% |
80.1 |
15.6 |
2.9 |
1.3 |
0.1 |
100.0 |
|
|
Column% |
73.1 |
23.2 |
7.7 |
4.5 |
1.1 |
40.2 |
|
|
Total% |
32.2 |
6.3 |
1.2 |
0.5 |
0.0 |
40.2 |
|
|
2 |
Count |
515 |
864 |
519 |
311 |
25 |
2234 |
|
|
|
Row% |
23.1 |
38.7 |
23.2 |
13.9 |
1.1 |
100.0 |
|
|
|
Column% |
26.8 |
73.1 |
78.6 |
61.2 |
28.7 |
51.2 |
|
|
|
Total% |
11.8 |
19.8 |
11.9 |
7.1 |
0.6 |
51.2 |
|
|
3 |
Count |
3 |
43 |
89 |
167 |
46 |
348 |
|
|
|
Row% |
0.9 |
12.4 |
25.6 |
48.0 |
13.2 |
100.0 |
|
|
|
Column% |
0.2 |
3.6 |
13.5 |
32.9 |
52.9 |
8.0 |
|
|
|
Total% |
0.1 |
1.0 |
2.0 |
3.8 |
1.1 |
8.0 |
|
|
4 |
Count |
0 |
1 |
1 |
7 |
15 |
24 |
|
|
|
Row% |
0.0 |
4.2 |
4.2 |
29.2 |
62.5 |
100.0 |
|
|
|
Column% |
0.0 |
0.1 |
0.2 |
1.4 |
17.2 |
0.6 |
|
|
|
Total% |
0.0 |
0.0 |
0.0 |
0.2 |
0.3 |
0.6 |
|
Total |
|
Count |
1924 |
1182 |
660 |
508 |
87 |
4361 |
|
|
|
Row% |
44.1 |
27.1 |
15.1 |
11.6 |
2.0 |
100.0 |
|
|
|
Column% |
100.0 |
100.0 |
100.0 |
100.0 |
100.0 |
100.0 |
|
|
|
Total% |
44.1 |
27.1 |
15.1 |
11.6 |
2.0 |
100.0 |
Note. Dark gray cells indicate that the row proportion is larger than 50% (i.e.,
more than 50% of MCA scores were at this level or these levels when the TEAE
score was the one in the row), and light gray cells indicate that the row
proportion is larger than 20% (i.e., more than 20% of MCA scores were at this
level or these levels when the TEAE score was the one in the row).
Table 4:
Correspondence between the TEAE Proficiency Levels and the MCA Achievement
Levels (2002-03, Grade 3)
|
|
|
|
MCA Reading
Achievement Level |
Total |
|
|
|
|
1 |
2A |
2B |
3 |
4 |
|
|
TEAE Reading
Proficiency Level |
1 |
Count |
323 |
58 |
21 |
4 |
0 |
406 |
|
|
Row% |
79.6 |
14.3 |
5.2 |
1.0 |
0.0 |
100.0 |
|
|
Column% |
21.7 |
4.4 |
2.4 |
0.5 |
0.0 |
8.9 |
|
|
Total% |
7.1 |
1.3 |
0.5 |
0.1 |
0.0 |
8.9 |
|
|
2 |
Count |
1081 |
747 |
255 |
82 |
4 |
2169 |
|
|
|
Row% |
49.8 |
34.4 |
11.8 |
3.8 |
0.2 |
100.0 |
|
|
|
Column% |
72.6 |
57.0 |
28.7 |
10.5 |
5.2 |
47.8 |
|
|
|
Total% |
23.8 |
16.5 |
5.6 |
1.8 |
0.1 |
47.8 |
|
|
3 |
Count |
84 |
495 |
561 |
523 |
29 |
1692 |
|
|
|
Row% |
5.0 |
29.3 |
33.2 |
30.9 |
1.7 |
100.0 |
|
|
|
Column% |
5.6 |
37.8 |
63.2 |
67.2 |
37.7 |
37.3 |
|
|
|
Total% |
1.8 |
10.9 |
12.4 |
11.5 |
0.6 |
37.3 |
|
|
4 |
Count |
1 |
10 |
50 |
169 |
44 |
274 |
|
|
|
Row% |
0.4 |
3.6 |
18.2 |
61.7 |
16.1 |
100.0 |
|
|
|
Column% |
0.1 |
0.8 |
5.6 |
21.7 |
57.1 |
6.0 |
|
|
|
Total% |
0.0 |
0.2 |
1.1 |
3.7 |
1.0 |
6.0 |
|
Total |
|
Count |
1489 |
1310 |
887 |
778 |
77 |
4541 |
|
|
|
Row% |
32.8 |
28.8 |
19.5 |
17.1 |
1.7 |
100.0 |
|
|
|
Column% |
100.0 |
100.0 |
100.0 |
100.0 |
100.0 |
100.0 |
|
|
|
Total% |
32.8 |
28.8 |
19.5 |
17.1 |
1.7 |
100.0 |
Note. Dark gray cells indicate that the row proportion is larger than 50% (i.e.,
more than 50% of MCA scores were at this level or these levels when the TEAE
score was the one in the row), and light gray cells indicate that the row
proportion is larger than 20% (i.e., more than 20% of MCA scores were at this
level or these levels when the TEAE score was the one in the row).
Grade 5 TEAE Level and MCA Level Correspondence
Results are shown in Tables 5 (for
the 2001-02 data) and 6 (for the 2002-03 data). Fifth graders showed results
similar to those of third graders for both academic years. There is a clearer
indication than for third graders that TEAE level 4 corresponds to MCA level 3.
Also, TEAE level 2 corresponds to MCA levels 1 or 2A, and TEAE level 3 to MCA
levels 2A, 2B, or 3. These observations are consistent in both school years.
Again, we can conclude that increased English proficiency of English learners is
associated with higher performance on accountability measures.
Table 5.
Correspondence between TEAE Proficiency Levels and MCA Achievement Levels
(2001-02, Grade 5)
|
|
|
|
MCA Reading
Achievement Level |
Total |
|
|
|
|
1 |
2A |
2B |
3 |
4 |
|
|
TEAE Reading
Proficiency Level |
1 |
Count |
362 |
24 |
3 |
2 |
0 |
391 |
|
|
Row% |
92.6 |
6.1 |
0.8 |
0.5 |
0.0 |
100.0 |
|
|
Column% |
24.5 |
2.0 |
0.6 |
0.3 |
0.0 |
9.8 |
|
|
Total% |
9.1 |
0.6 |
0.1 |
0.1 |
0.0 |
9.8 |
|
|
2 |
Count |
1002 |
672 |
126 |
99 |
6 |
1905 |
|
|
|
Row% |
52.6 |
35.3 |
6.6 |
5.2 |
0.3 |
100.0 |
|
|
|
Column% |
67.8 |
56.2 |
27.1 |
14.2 |
4.1 |
47.8 |
|
|
|
Total% |
25.2 |
16.9 |
3.2 |
2.5 |
0.2 |
47.8 |
|
|
3 |
Count |
111 |
451 |
280 |
393 |
61 |
1296 |
|
|
|
Row% |
8.6 |
34.8 |
21.6 |
30.3 |
4.7 |
100.0 |
|
|
|
Column% |
7.5 |
37.7 |
60.2 |
56.2 |
41.8 |
32.5 |
|
|
|
Total% |
2.8 |
11.3 |
7.0 |
9.9 |
1.5 |
32.5 |
|
|
4 |
Count |
2 |
49 |
56 |
205 |
79 |
391 |
|
|
|
Row% |
0.5 |
12.5 |
14.3 |
52.4 |
20.2 |
100.0 |
|
|
|
Column% |
0.1 |
4.1 |
12.0 |
29.3 |
54.1 |
9.8 |
|
|
|
Total% |
0.1 |
1.2 |
1.4 |
5.1 |
2.0 |
9.8 |
|
Total |
|
Count |
1477 |
1196 |
465 |
699 |
146 |
3983 |
|
|
|
Row% |
37.1 |
30.0 |
11.7 |
17.5 |
3.7 |
100.0 |
|
|
|
Column% |
100.0 |
100.0 |
100.0 |
100.0 |
100.0 |
100.0 |
|
|
|
Total% |
37.1 |
30.0 |
11.7 |
17.5 |
3.7 |
100.0 |
Note. Dark gray cells indicate that the row proportion is larger than 50% (i.e.,
more than 50% of MCA scores were at this level or these levels when the TEAE
score was the one in the row), and light gray cells indicate that the row
proportion is larger than 20% (i.e., more than 20% of MCA scores were at this
level or these levels when the TEAE score was the one in the row).
Table 6.
Correspondence between TEAE Proficiency Levels and MCA Achievement Levels
(2002-03, Grade 5)
|
|
|
|
MCA Reading
Achievement Level |
Total |
|
|
|
|
1 |
2A |
2B |
3 |
4 |
|
|
TEAE Reading
Proficiency Level |
1 |
Count |
411 |
63 |
10 |
14 |
1 |
499 |
|
|
Row% |
82.4 |
12.6 |
2.0 |
2.8 |
0.2 |
100.0 |
|
|
Column% |
41.2 |
4.7 |
1.2 |
1.5 |
0.7 |
11.8 |
|
|
Total% |
9.7 |
1.5 |
0.2 |
0.3 |
0.0 |
11.8 |
|
|
2 |
Count |
458 |
531 |
108 |
55 |
0 |
1152 |
|
|
|
Row% |
39.8 |
46.1 |
9.4 |
4.8 |
0.0 |
100.0 |
|
|
|
Column% |
45.9 |
39.4 |
13.2 |
5.9 |
0.0 |
27.2 |
|
|
|
Total% |
10.8 |
12.5 |
2.5 |
1.3 |
0.0 |
27.2 |
|
|
3 |
Count |
125 |
723 |
643 |
577 |
58 |
2126 |
|
|
|
Row% |
5.9 |
34.0 |
30.2 |
27.1 |
2.7 |
100.0 |
|
|
|
Column% |
12.5 |
53.7 |
78.6 |
62.0 |
40.0 |
50.2 |
|
|
|
Total% |
2.9 |
17.1 |
15.2 |
13.6 |
1.4 |
50.2 |
|
|
4 |
Count |
3 |
30 |
57 |
285 |
86 |
461 |
|
|
|
Row% |
0.7 |
6.5 |
12.4 |
61.8 |
18.7 |
100.0 |
|
|
|
Column% |
0.3 |
2.2 |
7.0 |
30.6 |
59.3 |
10.9 |
|
|
|
Total% |
0.1 |
0.7 |
1.3 |
6.7 |
2.0 |
10.9 |
|
Total |
|
Count |
997 |
1347 |
818 |
931 |
145 |
4238 |
|
|
|
Row% |
23.5 |
31.8 |
19.3 |
22.0 |
3.4 |
100.0 |
|
|
|
Column% |
100.0 |
100.0 |
100.0 |
100.0 |
100.0 |
100.0 |
|
|
|
Total% |
23.5 |
31.8 |
19.3 |
22.0 |
3.4 |
100.0 |
Note. Dark gray cells indicate that the row proportion is larger than 50% (i.e.,
more than 50% of MCA scores were at this level or these levels when the TEAE
score was the one in the row), and light gray cells indicate that the row
proportion is larger than 20% (i.e., more than 20% of MCA scores were at this
level or these levels when the TEAE score was the one in the row).
Comparability of MCA Scores
Grade 3 TEAE Level by MCA Scale Scores
Mean MCA scale scores by TEAE
proficiency level were compared with the mean MCA scale score of native English
speakers, and similar comparisons were made for dispersion of test scores (see
Table 7). Also, boxplots were drawn (see Figures 6 and 7). In these, the box
represents the middle 50% of the data, the top line represents the 75th
percentile and the bottom line represents the 25th percentile. A line
segment in the box indicates the median. The length of whiskers outside the box
is usually taken 1.5 times as large as the interquartile range, which is the
height of the box. All values outside the range of the whiskers are marked as
outliers and represented as dots in the plot. As in the comparison by the
proficiency or achievement levels, the irregular group of students was included
in the data. In the subsequent tables and figures, the group of native English
speakers is designated as "No TEAE."
Table 7. Mean MCA Scale Score by TEAE Proficiency Level (Grade 3)
|
|
2001-02 |
2002-03 |
|
Mean |
SD |
N |
Mean |
SD |
N |
|
TEAE Level 1 |
1176.83 |
134.23 |
1803 |
1169.46 |
140.41 |
429 |
|
TEAE Level 2 |
1374.23 |
129.56 |
2246 |
1275.52 |
129.68 |
2174 |
|
TEAE Level 3 |
1544.89 |
132.37 |
352 |
1448.44 |
103.66 |
1694 |
|
TEAE Level 4 |
1711.67 |
152.53 |
24 |
1575.96 |
106.47 |
275 |
|
No
TEAE |
1500.56 |
201.61 |
54263 |
1531.90 |
180.25 |
53556 |
Note. The group of native English speakers is designated as “No TEAE.”
Figure 6. Boxplots of Mean MCA Scale Scores by TEAE Proficiency Level (2001-02,
Grade 3)
Figure 7. Boxplots of
Mean MCA Scale Scores by TEAE Proficiency Level (2002-03, Grade 3)
In the 2001-02 school year, ELLs in
TEAE levels 3 and 4 had higher mean scores than native English speakers. The
result for TEAE level 4, however, is not reliable due to the small sample size;
the mean and standard deviation for that group are both too high. Dispersion of
scores is almost the same for all TEAE proficiency levels except for TEAE level
4, and they are much smaller than the dispersion for No TEAE. This is a natural
result because TEAE levels are correlated to the MCA scale scores.
Figure 6 shows that the ranges
indicated by whiskers (i.e., the lines extending from the box) for TEAE levels
2, 3, and 4 are completely within the whisker range of No TEAE (and the
interquartile ranges of these levels indicated by boxes also substantially
overlap that of No TEAE). Yet, the location of the distribution of TEAE level 2
is substantially lower compared with No TEAE. These results indicate that ELLs
in TEAE levels 3 or 4 can perform as well on the MCA as native English speakers.
In SY 2002-03, the pattern of score
distributions is somewhat different from that of SY 2001-02. The mean score in
2002-03 is lower than in 2001-02 at each TEAE proficiency level, whereas the
mean score of No TEAE in 2002-03 is higher than in 2001-02 (see Table 7). Also,
the score dispersion tends to be smaller as the TEAE level goes up, unlike in
2001-02. TEAE level 4 has a higher mean score than No TEAE as well as in
2001-02, but TEAE level 3 does not.
Figure 7 shows that the score
distributions of TEAE levels 3 and 4 are completely within the range of No TEAE,
but the distribution of TEAE level 3 is located relatively low to that of No
TEAE with little overlap of the interquartile range. Thus, the 2002-03 data
indicate that while ELLs in TEAE level 4 can perform as well on the MCA as
native English speakers, this may not be the case for those in TEAE level 3.
Grade 5 TEAE Level by MCA
Scale Scores
A summary of the MCA scale scores by
TEAE proficiency level is shown in Table 8, and boxplots are shown in Figures 8
and 9. Fifth graders in both 2001-02 and 2002-03 school years consistently show
a distributional pattern similar to third graders in 2001-02. In each school
year, the distribution of MCA scale scores of TEAE level 4 has almost the same
mean as the No TEAE group, and the range of the distribution is completely
within that of the No TEAE group. The range of TEAE level 3 is also within that
of No TEAE, but its mean is substantially lower than that of No TEAE in both
school years. Thus, for fifth graders, students in TEAE level 4 are comparable
to native English speakers.
Table 8. Mean MCA Scale Score by TEAE Proficiency Level (Grade 5)
|
|
2001-02 |
2002-03 |
|
Mean |
SD |
N |
Mean |
SD |
N |
|
TEAE Level 1 |
1092.51 |
170.12 |
438 |
1145.44 |
156.01 |
515 |
|
TEAE Level 2 |
1265.09 |
139.54 |
1934 |
1284.62 |
118.88 |
1157 |
|
TEAE Level 3 |
1445.88 |
144.26 |
1315 |
1440.35 |
125.87 |
2137 |
|
TEAE Level 4 |
1575.86 |
150.46 |
399 |
1593.39 |
134.78 |
463 |
|
No
TEAE |
1567.84 |
211.23 |
57147 |
1580.66 |
196.60 |
57104 |
Figure 8. Boxplots of
Mean MCA Scale Scores by TEAE Proficiency Level (2001-02, Grade 5)
Figure 9. Boxplots of
Mean MCA Scale Scores by TEAE Proficiency Level (2002-03, Grade 5)
Study 2: TEAE and BST
Method
The data used in these analyses,
like those used for the MCA analyses, are from 2001-02 and 2002-03. With state
eighth grade performance, we again focus on the TEAE reading test in comparison
to the BST reading test (hereafter, referred to as TEAE and BST). The TEAE data
originally contained 4,019 eighth graders in SY 2001-02, and 3,865 in SY
2002-03. The BST data originally contained 61,922 eighth graders, 66,769 in SY
2001-02, and 66,975 in SY 2002-03. The data were screened in the same manner as
for the TEAE-MCA analysis: excluding students who (a) had any missing value on
variables related to test scores, (b) were recorded as “not tested” on the BST,
and (c) had the minimum possible score on the TEAE. The resulting sample sizes
are shown in Table 9.
Table 9. Descriptive
Statistics for TEAE-BST Data
|
Year |
Grade |
N |
TEAE Reading
Scale Score |
BST Reading
Scale Score |
r |
|
Mean |
SD |
Min |
Max |
Mean |
SD |
Min |
Max |
|
01-02 |
8 |
3315 |
247.77 |
42.19 |
59 |
417 |
589.89 |
42.62 |
434 |
750 |
.71 |
|
02-03 |
8 |
3331 |
243.87 |
39.00 |
28 |
437 |
585.50 |
44.04 |
456 |
750 |
.66 |
Note. N is the sample size, SD is the standard deviation, and r is
the sample correlation between TEAE and BST.
The purpose of this analysis was to
examine how basic English proficiency measured by the TEAE relates to (a)
acquisition of basic academic reading skills, and (b) the reading skills needed
to pass the BST as needed for graduation. We therefore analyzed the data in two
ways.
The first analysis examined how
English proficiency affects acquiring basic academic skills. This was done by
examining the relationship of the TEAE and BST at the scale score level. We used
scatterplots and regression analysis to examine the extent to which the BST
scale score is predicted by the TEAE scale score.
The second analysis focused on how
English proficiency affects passing rates. The criterion for graduation is a BST
scale score greater than 600. In this analysis, the TEAE scale score is used as
a predictor of the passing rate. Since the criterion variable for each student
is binary (i.e., passed or failed), the logistic regression analysis is employed
to predict passing rates. Passing rates are also compared across proficiency
levels of the TEAE.
Results
Descriptive Statistics for the Entire Sample
Means and standard deviations of
test scores are very similar in both academic years. The correlations between
the TEAE and BST were .71 and .66 in SY 2001-02 and SY 2002-03, respectively.
They are slightly smaller than the correlations between the MCA and TEAE. Also,
the correlation in 2002-03 is smaller than that in 2001-02.
Analysis of Scale Scores
Scatter plots.
BST scale scores were plotted against TEAE scale scores for each school year.
These plots, however, showed that the BST scale score increases exponentially
rather than linearly as the TEAE scale score increases. This seemed to be a
result of scaling of the BST scale score. The distribution of the BST raw scores
peaked close to the maximum possible score. Then, on the resulting scale, raw
score points close to the maximum were stretched out, that is, intervals between
these scale scores were much longer than those between scale scores from lower
raw scores. In order to apply linear regression models, the BST scale score was
log-transformed so that the relationship between the BST and TEAE was more
linear. The resulting scatter plots for 2001-02 and 2002-03 school years are
shown in Figures 10 and 11.
Figures 10 and 11 show that the TEAE
scale score and the log-transformed BST scale score is positively related, and
the relationship is almost linear. However, we do observe a small number of data
points that lie outside the central region in which most of the data points
concentrate. These observations will negatively affect the predictability of the
BST scale score. Unlike the MCA, these points are distributed across almost the
entire range of the TEAE scale score. Also, higher TEAE or BST scores show
discreteness due to the scaling, although the discreteness of the BST has been
weakened by the log-transformation. With the information currently at hand, we
have no basis for removing these data points. Thus, all of these data points
were used for the regression analysis.
Regression Analysis
The following linear regression
model, was applied by school years in order to assess the predictability of the
BST:
log(BST) = (Intercept) + b1(TEAE)
+ e
The results are shown in Table 10.
The estimated regression lines are almost the same, but R2 for
2002-03 is smaller than for 2001-02. Also, these R2s are
smaller than those for the MCA. Thus, the BST scale score can be predicted by
the TEAE scale score to a moderate degree, because English proficiency affects
acquiring basic academic skills in reading. However, the predictability is not
as good as for the MCA.
The relationship between the BST and
TEAE seems to be stable across years, as shown in Figure 12 in which the
estimated regression curves from both school years are plotted (the log-BST
scale score is transformed back to the original scale score). TEAE scores that
give the predicted value of the BST score of 600 (i.e., 600 corresponds to 6.4
on log scale in Figures 10 and 11) are 263.81 and 265.18 for 2001-02 and 2002-03
school years, respectively. Thus, students with TEAE scores greater than these
values are expected to have BST scores greater than 600.
Table 10.
Estimates of Regression Coefficients
|
Year |
Grade |
Intercept(b0) |
Slope(b1) |
R2 |
|
01-02 |
8 |
6.07 |
.0012 |
.52 |
|
02-03 |
8 |
6.06 |
.0013 |
.45 |
Note. R2 is the
squared multiple correlation.
Figure 10. Scatter
plot of BST scale scores (log-transformed) and TEAE scale scores (2001-02, Grade
8)

Figure 11.
Scatterplot of BST Scale Scores (log-transformed) and TEAE Scale Scores
(2002-03, Grade 8)
Figure 12. Comparison
of Estimated Regression Curves

Predicting Passing Rates
Logistic Regression Analysis
The following logistic regression
model was applied by school years in order to assess the predictability of the
BST passing rate:
logit[Pr(Passing on BST)] =
(Intercept) + b1(TEAE) + e
The term logit(p) denotes the
logarithm of odds in terms of probability p, that is, logit(p) =
log[p / (1 - p)]. The logistic regression model assumes that the
logit of the target proportion (i.e., the passing rate in this context) is
linearly related to the predictor (i.e., TEAE scale score). The results are
shown in Table 11. Because the slopes are positive, the passing rate increases
as the TEAE scale score increases. However, Cox-Snell R2s are
small (.33 and .29, respectively), so the predictability is low. In fact,
correct classification rates are not very high (78.0% and 75.1%, respectively).
These rates were computed as follows. First, a predicted passing rate is
computed using the estimated regression curve and the TEAE score for each
student. Next, each student was classified as "passed" if the predicted passing
rate is greater than .5 and as "failed" otherwise. The correct classification
rate is then computed as the proportion of students whose predicted and actual
pass/fail values are the same. Thus, predicting passing or failing on the BST
using the TEAE is more difficult than simply predicting BST scores.
The median effective levels, which
give the TEAE scores the predicted passing rate of .50, are 263.43 and 260.71.
Thus, in order to predict that a student would likely pass the BST, they must
score at least 260 on the TEAE.
Table 11. Estimates of
Regression Coefficients
|
Year |
Grade |
Intercept
(b0) |
Slope
(b1) |
R2 |
|
01-02 |
8 |
-12.25 |
.047 |
.33 |
|
02-03 |
8 |
-11.26 |
.043 |
.29 |
| |
|
|
|
|
|
Note. R2 is
Cox-Snell squared multiple correlation, which is an analogue of ordinary R2
in linear regression.
Although the relationship in terms of the passing rate is
relatively weak, it is considered to be stable across years. In Figure 13, the
estimated regression curves are plotted. They are almost identical.
Figure 13. Comparison
of Estimated Regression Curves

Passing Rates by Proficiency Level
Passing rates were also compared by
TEAE proficiency level. The passing rates are shown in Table 12, and
corresponding graphs displayed in Figures 14 and 15 for each school year. Table
12 indicates that in both school years, (a) passing rates in levels 1 and 2 are
very low (less than 10%), and (b) only level 4 had reasonably high passing
rates. Level 1 has slightly higher passing rates than level 2, but the reason is
not clear. Although the results are similar across years, passing rates in
2002-03 were slightly lower than in 2001-02 for all levels as well as overall.
These results indicate that in order to pass on the BST, students must be at
least in level 3 on the TEAE. But we reiterate that only students in level 4 had
reasonably high passing grades.
Table 12. Estimates of
Regression Coefficients
|
Year |
Grade |
TEAE Reading Proficiency Level |
Overall |
|
1 |
2 |
3 |
4 |
|
2001-02 |
8 |
.066 |
.057 |
0.44 |
0.87 |
0.39 |
|
2002-03 |
8 |
.063 |
.046 |
0.38 |
0.80 |
0.37 |
Figure 14. Passing
rates by TEAE Proficiency Level (2001-02)

Note. The numbers
indicated in the graphs are the number of students.
Figure 15. Passing
Rates by TEAE Proficiency Level (2002-03)
Note. The numbers
indicated in the graphs are the number of students.
Discussion
The Study 1 results show that
although the specific predictive relationship (i.e., what TEAE score corresponds
to what MCA score) can differ, the positive relationship between the two tests
is stable across years and grades. Also, the results suggest that ELLs in TEAE
level 4 would do as well as native English speakers on the MCA. This finding
indicates that those students in level 4 are more able to excel in academic
achievement assessments in reading toward the state standards, and thus supports
the state’s decision to count English learners who have achieved the highest
proficiency level on the TEAE as fluent English proficient. However, the
different distributional pattern for third graders in 2001-02 implies that there
may be some fluctuations across year and grade.
For students with scores below the
cut point (110), there is less ability to predict MCA scores. Most students in
TEAE level 3 fall into MCA levels 2A, 2B, or 3 and therefore although it is
likely that many within this group score as proficient (i.e., 2B or 3) others
may not (2A). Although there is no clear one-to-one correspondence between the
TEAE proficiency levels and the MCA achievement levels, ELLs who are in TEAE
level 3 or 4 are likely to be proficient (i.e., scoring in level 2B or above) on
the MCA.
Results of Study 2 showed that TEAE
scale scores had moderate predictive power for BST performance. However, the
predictability is not as good as for the MCA. In order to predict that a student
would likely pass the BST, he or she must score at least 260 (i.e., achieve
level 3) on the TEAE. Thus, we see the effect of acquiring basic English
proficiency on acquiring basic academic skills in reading.
In conclusion, there might be
stronger relationships between the MCA and 3rd and 5th grade reading skills on
the TEAE because the academic language skills measured on the TEAE addressed the
skills taught in those elementary grades. Yet, students in the middle and high
school grades face increasing demands in terms of academic language. This
suggests that the TEAE, although providing a basic picture of academic language
skills, may not detect as well the academic skills of students at the higher
grades. However, this requires further research.
Other factors besides potential
discrepancies between secondary grade level skills and basic academic language
skills may also account for differences in performance between the tests. These
include differences in a learner’s age upon entering Minnesota schools. It is
possible that the relationship of the tests may differ for learners who started
schooling in America in 10th grade as opposed to learners who had
been in the educational system from 4th grade. Also, the relationship
between tests may be affected by individual student performance based on
familiarity or lack of familiarity with topical content and vocabulary for
individual passages encountered on the tests. Although the match varies between
content tested and background knowledge for every reading test, it still has the
potential to affect student results. For example, a student may be familiar with
the language and content on the TEAE reading test, but may lack familiarity with
language or content needed to successfully apply similar skills to a BST reading
passage, or vice versa. Finally, Minnesota teachers’ own anecdotal evidence
suggests that some students who take the TEAE do not really try, or do not take
the test seriously. Any combination of these and other individual student
factors could contribute to the TEAE not predicting success on the BST as well
as on the MCA.
References
Bailey, A., Butler, F., LaFramenta,
C., & Ong, C. (2004). Towards the characterization of academic language in
upper elementary science classrooms (CSE Report 621). Los Angeles, CA:
University of California, National Center for Research on Evaluation, Standards,
and Student Testing.
Chamot, A. U., & O'Malley, J. M.
(1994). The CALLA handbook: How to implement the Cognitive Academic Language
Learning Approach. Reading, MA: Addison-Wesley.
Cummins, J. (1979)
Cognitive/academic language proficiency, linguistic interdependence, the optimum
age question and some other matters. Working Papers on Bilingualism, No. 19,
121-129.
Scarcella, R. (2003). Academic
English: A conceptual framework. Irvine, CA: University of California,
Linguistic Minority Research Institute.
Solomon, J., & Rhodes, N. (1995).
Conceptualizing academic language (Research Rep. No. 15). Santa Cruz:
University of California, National Center for Research on Cultural Diversity and
Second Language Learning.
Stevens, R. A., Butler, F. A., &
Castellon-Wellington, M. (2000). Academic language and content assessment:
Measuring the progress of English language learners. Los Angeles, CA:
University of California, National Center for Research on Evaluation, Standards,
and Student Testing.
Top of page |