Prepared by:
Deb Albus • Manuel Barrera • Martha Thurlow • Kamil Guven • Vitaliy Shyyan
June 2004
Any or all portions of this document may be reproduced and distributed without prior permission, provided the source is cited as:
Albus, D., Barrera, M., Thurlow, M., Guven, K. & Shyyan, V. (2004). 2000-2001 Participation and performance of English language learners with disabilities on Minnesota standards-based assessments (ELLs with Disabilities Report 4). Minneapolis, MN: University of Minnesota, National Center on Educational Outcomes. Retrieved [today's date], from the World Wide Web: http://education.umn.edu/NCEO/OnlinePubs/ELLsDisReport4.html
More attention has been given to English language learners, and students with disabilities, following the legislative changes that require states to include these students in assessments and accountability systems. However, a knowledge gap exists where these two groups overlap in the student population. Although assessment documents include more data for limited English proficient1 students (Albus, Thurlow, & Liu, 2002) and students with disabilities (Thurlow, Wiley, & Bielinski, 2003) there is very little data reported for students with limited English proficiency who also have disabilities (Thurlow, & Liu, 2001). Given that these students are among those facing the biggest challenges within current education systems, it is important to examine how they are doing. This report is an effort to focus attention on the progress being made by these students in state assessments. The analyses conducted to produce this report are a part of a larger project examining instruction of limited English proficient students with disabilities and its relation to large scale and classroom assessment information.
In this report we focus on the performance of students with disabilities and limited English proficiency on the Minnesota Comprehensive Assessments (MCAs). The MCAs are used for accountability purposes at the district level for grades 3 and 5 in Reading and Mathematics. Newly developed MCAs in grades 10 (reading) and 11 (mathematics) that were introduced in the 2000-2001 school year are not the focus of this study. The grade 3 and 5 tests are used for tracking progress toward the high academic content standards. Therefore, focusing attention on the performance of this group of students on these tests is important in order to gauge how well they are progressing towards the high grade level standards set for all students.
As with many assessment systems, Minnesota’s has evolved over time. An analysis of the performance of limited English proficient students with disabilities on the 1999-2000 MCAs in grades 3 and 5 (Albus, Thurlow, Barrera, Guven, & Shyyan, 2004) indicated that participation was about 81-84% in grade 3 and 82-85% in grade 5. Most of these students performed at the lowest proficiency level, in both mathematics and reading, although more spread across the proficiency levels was evident in mathematics than in reading.
In the past, the former Minnesota Department of Children, Families and Learning (CFL), now Minnesota Department of Education, reported test scores for the MCAs according to four proficiency levels (I, II, III, IV). Beginning in 2000-2001, the state changed its reporting procedures so that scores were reported on five levels instead of four (I, IIa, IIb, III, IV). A brief definition and description of these five levels were provided in a parent brochure (Minnesota Department of Education, 2001) and are reproduced as follows:
Level IV - Students at this level demonstrate superior performance, knowledge and skills well beyond what is expected at the grade level.
Level III - Students at this level are working above grade level and demonstrate solid performance in the knowledge and skills necessary for satisfactory work in the state’s content standards. Many are proficient with challenging subject matter.
Level IIb - Most students in this level are working on-grade level material and are on track to achieve satisfactory work in the state’s content standards.
Level IIa - Students in this level have partial knowledge and skills necessary for the state’s content standards. They typically are working on slightly below grade-level material in one or more content areas.
Level I - Students at this level have gaps in the knowledge and skills necessary for satisfactory work in the state’s content standards. These students typically are working significantly below grade level and typically need additional instruction to progress beyond finding obvious answers and simple details.
The four and five level systems are similar in that they are both tied to a student’s long-term achievement of high standards. These are the standards that were in place during 2000-2001 and prior to that. (The standards were replaced in 2003-2004.)
The purpose of this study was to examine the participation and performance of limited English proficient students with disabilities on the 2000-2001 Minnesota Comprehensive Assessments. We wanted to do this as a function of language group (Hmong, Somali and Spanish) and as a function of disability (the 12 Minnesota categories not including 504 status). In addition, we wanted to examine performance across years, from 1999-2000 to 2000-2001.
1Students
with limited English proficiency are increasingly referred to as English
language learners or ELLs. We recognize that a number of terms are used in the
field related to learners of English as a new or second language. We have
adopted some of those terms for reference, but have chosen to use language and
acronyms compliant with “person first” protocol and to minimize lengthy terms
where possible. In this document we use the term "students with limited English
proficiency."
The data analyzed in this report were provided by the Minnesota Department of Children, Families, and Learning (CFL), now the Minnesota Department of Education, through the Minnesota Automated Reporting Student System (MARSS), Minnesota’s data management system. Descriptive statistical analyses were conducted using SPSS after the file was organized and unusable data were excluded.
The data file we received from the state was organized by the previous year’s four level system, even though the state had already begun to convert to a five level system of reporting the data, splitting Level II into IIA and IIB. Thus, we manually converted the four levels of reporting to five levels. This was done by adding a column to the data set so that the data from the four level system was preserved. Although Level II was the only level affected by the change, there was a need to determine the range of scores for every proficiency level to ensure accuracy of reporting. An online table we retrieved from the Web page provided score ranges for the five levels. However, with recent changes to Minnesota’s Web site, this table is no longer available online. Because the data had already been run using the database derived levels, these ranges may differ slightly from reports produced elsewhere. These procedures were used with both the 2000-2001 data and the 1999-2000 data so that we could look at participation and performance across years.
The information provided to us by the state explained that the only level that needed adjusting was Level II. Students within Level II who scored below 1420 were Level 2A and students at or above 1420 were Level 2B. All other levels remained the same. This information helped us set the cut points between Level II A and Level IIB. However, other complications developed from trying to reconcile an online table with the score ranges in the actual database. Students in the database achieved scale scores that according to the chart boundaries would not be clearly placed into any level. These “grey areas” required us to rely on the database to guide the placement of these students.
Using the database, we sorted the reading and mathematics scores by grade level and achievement level indicated under the four level system. Using the sorted data, we obtained the score ranges (the upper and lower boundaries) for levels I, II and IV. After comparing these score ranges to information provided by the state we arrived at the score ranges for achievement levels as shown in Table 1.
Table 1. MCA Cut Score Levels
|
|
Four Level Ranges |
|
Five Level Ranges |
||||
|
Grade |
Content |
Level |
Range |
Grade |
Content |
Level |
Range |
|
3 |
Mathematics |
Level 1 |
70-1190 |
3 |
Mathematics |
Level 1 |
70-1190 |
|
Level II |
1210-1490 |
Level IIA |
1210-1410 |
||||
|
Level IIB |
1420-1490 |
||||||
|
Level III |
1510-1720 |
Level III |
1510-1720 |
||||
|
Level IV |
1790-2390 |
Level IV |
1790-2390 |
||||
|
Reading |
Level I |
440-1260 |
Reading |
Level I |
440-1260 |
||
|
Level II |
1280-1490 |
Level IIA |
1280-1410 |
||||
|
Level IIB |
1420-1490 |
||||||
|
Level III |
1510-1670 |
Level III |
1510-1670 |
||||
|
Level IV |
1710-2050 |
Level IV |
1710-2050 |
||||
|
5 |
Mathematics |
Level I |
170-1230 |
5 |
Mathematics |
Level I |
170-1230 |
|
Level II |
1240-1490 |
Level IIA |
1240-1410 |
||||
|
Level IIB |
1420-1490 |
||||||
|
Level III |
1510-1670 |
Level III |
1510-1670 |
||||
|
Level IV |
1710-2280 |
Level IV |
1710-2280 |
||||
|
Reading |
Level I |
310-1240 |
Reading |
Level I |
310-1240 |
||
|
Level II |
1260-1480 |
Level IIA |
1260-1410 |
||||
|
Level IIB |
1420-1480 |
||||||
|
Level III |
1510-1680 |
Level III |
1510-1680 |
||||
|
Level IV |
1720-2190 |
Level IV |
1720-2190 |
||||
During the analysis process of 1999-2000 data we realized that the sum of the students across achievement Levels I thru V was sometimes larger than the number of the total tested students in certain categories. The reason for this was that there were some students in the data base who were marked as “did not take test” who had performance indicated by a scale score or achievement level. This problem was not nearly so evident (approximately 180 students in grade 3, and 150 students in grade 5) for the 2000-2001 mathematics and reading data. Across both years, all of these types of students were excluded from the data analysis.
There are several areas where caution should be exercised in interpreting the findings of this report. These areas include how a student’s grade level, primary disability category, and primary language are reported.
Children are counted in different ways for different purposes. For example, federal requirements base counts on age rather than grade level for total numbers of students enrolled with special education status. Therefore, totals reported in a grade here may be different from other reported totals. In addition, student mobility may influence yearly counts if they are calculated at a time when students are less likely to be present (e.g., migrant students).
There are positives and negatives to reporting by primary disability for students in special education. While doing so reduces errors of double counting, important information about whether students have multiple disabilities is then lost. For example, a student with a single disability such as a sensory impairment may be well accommodated by enlarging a text. However, another student counted within this same primary disability may have an additional learning disability not reflected in the available data. This information could be influential in interpreting participation and performance data, but we are unable to address these issues.
Categorizing students by primary language group is necessary in this report. We acknowledge that this sometimes simplifies the reality of student experiences with multiple languages, dialects, or variants. Also, we did not have access to native language fluency information; this is likely to be a crucial factor in interpreting the data of students with limited English proficiency.
Due to small numbers and the need to maintain confidentiality of individual student performance, we have used an asterisk to mark those performance categories with fewer than 10 students tested. If there were no students tested, these are marked with a “0.” Categories with dashes indicate that there were no students in that category.
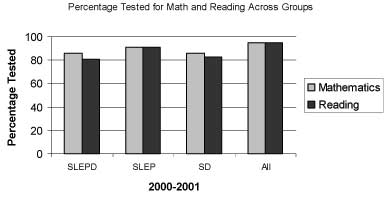
We examined participation in the 2000-2001 MCAs for four groups: students with limited English proficiency who also have disabilities, students with only limited English proficiency, students with disabilities, and all grade 3 students (including those in the previous groups). Table 2, summarizes the numbers and percentages participating in the grade 3 mathematics and reading results during 2000-2001. As shown in the table, there is little difference in percentage of students participating across groups. Students with disabilities (SD), as well as students with limited English proficiency and disabilities (SLEPD) had slightly lower percentages participating in both content areas. For these two groups, slightly more students were tested in mathematics than reading. These results are also presented in Figure 1 where it is evident that the All students group had participation rates 4-14 percentage points higher than for the other groups. Participation rates for students with disabilities (SD) and students with limited English proficiency and disabilities (SLEPD) were in the 80s, whereas students with limited English proficiency had participation rates at 91% and All students had rates at 95%.
Table 2. 2000-2001 MCA Participation, Grade 3
|
|
Number Enrolled* |
Mathematics |
Reading |
||
|
Number Tested |
Percent Tested |
Number Tested |
Percent Tested |
||
|
Grade 3 SLEPD SLEP SD All students |
279 3794 7183 63002 |
239 3467 6177 59695 |
86 91 86 95 |
225 3460 5984 59652 |
81 91 83 95 |
Key: SLEPD =
Students with limited English proficiency with disabilities; SLEP = Students
with limited English proficiency without disabilities; SD = Students with
disabilities without limited English proficiency.
Figure 1. 2000-2001 MCA Participation, Grade 3
Table 3 and Figure 2 summarize grade 3 MCA participation by language group. Although participation by Hmong, Spanish, and Somali speaking students was generally similar for mathematics and reading, the Hmong and Spanish speaking students with disabilities had a slightly greater percentage of students (3-8%) tested in mathematics than reading. A slight difference across language groups for reading was also evident with 77% of Spanish-speaking students with disabilities tested compared to 84% and 87% of their Hmong and Somali peers. Among All students, regardless of English proficiency or disability, Somali students participated at a rate of 78% compared to a range of 86% to 95% of their Hmong and Spanish-speaking peers.
Table 3. 2000-2001 MCA Participation by Language, Grade 3
|
Number Enrolled |
Mathematics |
Reading |
||||
|
Number Tested |
Percent Tested |
Number Tested |
Percent Tested |
|||
|
SLEPD |
Hmong |
101 |
88 |
87 |
85 |
84 |
|
Spanish |
120 |
102 |
85 |
92 |
77 |
|
|
Somali |
8 |
7 |
87 |
7 |
87 |
|
|
All1 |
Hmong |
1828 |
1732 |
95 |
1733 |
95 |
|
Spanish |
1566 |
1383 |
88 |
1355 |
86 |
|
|
Somali |
224 |
177 |
79 |
174 |
78 |
|
SLEPD = Students
with limited English proficiency with disabilities.
1All
students in this table includes the population of all Hmong, Spanish, and Somali
speaking students regardless of language proficiency.
Figure 2. Percentage of Students Tested in Three Language Groups with Disabilities, Grade 3
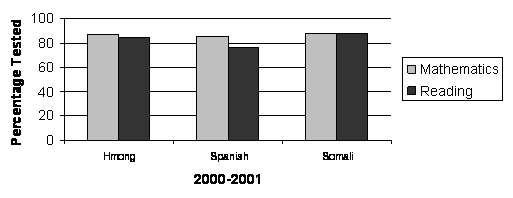
Table 4 shows the participation of students with limited English proficiency and disabilities (SLEPD), according to the students’ primary disability. The numbers of students in many categories are quite small. One category within this group did not have any students: Deaf-Blindness. The largest category of students enrolled and tested for this group was in Speech/Language Impaired and Specific Learning Disabilities, with a range of 76% to 99% tested in mathematics and reading. Students with limited English proficiency and disabilities (SLEPD) had a higher percentage (98-99%) tested in the Speech/Language Impaired category than the All students with disabilities group (47-52%, n = 50) of the same category. Visually Impaired students with limited English proficiency participated at rates of 57% to 71% in reading and math (n=4 to 5) and physically impaired students with limited English proficiency participated at rates of 50 to 60% (n= 6 to 5), whereas the percentages of All students with disabilities for these categories ranged from 71 to 80% (n ranged from 31 to 32 for Visually Impaired and 103 to 95 for Physically Impaired).
Table 4. 2000-2001 Grade 3 MCA
Mathematics Participation for Students with Disabilities and Limited English
Proficiency and All Students with Disabilities by Disability Group
|
|
Disability Group |
Enrolled |
Tested in Mathematics |
Tested in Reading |
||
|
N |
% |
N |
% |
|||
|
SLEPD |
Speech/Language Impaired |
96 |
95 |
99 |
94 |
98 |
|
Mentally Impaired: Mild-Moderate |
16 |
7 |
44 |
5 |
31 |
|
|
Mentally Impaired: Moderate-Severe |
2 |
0 |
0 |
0 |
0 |
|
|
Physically Impaired |
10 |
6 |
60 |
5 |
50 |
|
|
Deaf-Hard of Hearing |
19 |
17 |
89 |
14 |
74 |
|
|
Visually Impaired |
7 |
4 |
57 |
5 |
71 |
|
|
Specific Learning Disabilities |
97 |
82 |
84 |
74 |
76 |
|
|
Emotional/Behavioral Disorders |
15 |
13 |
87 |
12 |
80 |
|
|
Deaf-Blindness |
0 |
- |
- |
- |
- |
|
|
Other Health Impaired |
13 |
12 |
92 |
13 |
100 |
|
|
Autistic |
2 |
1 |
50 |
1 |
50 |
|
|
Traumatic Brain Injury |
2 |
2 |
100 |
2 |
100 |
|
|
All SD
|
Disability Group |
Enrolled |
Mathematics |
Reading |
||
|
N |
% |
N |
% |
|||
|
Mentally Impaired: Mild-Moderate |
507 |
264 |
52 |
237 |
47 |
|
|
Mentally Impaired: Moderate-Severe |
130 |
7 |
5 |
7 |
5 |
|
|
Physically Impaired |
133 |
103 |
77 |
95 |
71 |
|
|
Deaf-Hard of Hearing |
154 |
134 |
87 |
126 |
82 |
|
|
Visually Impaired |
40 |
32 |
80 |
31 |
77 |
|
|
Specific Learning Disabilities |
2301 |
2074 |
90 |
1986 |
86 |
|
|
Emotional/Behavioral Disorders |
878 |
764 |
87 |
718 |
82 |
|
|
Deaf-Blindness |
6 |
5 |
83 |
5 |
83 |
|
|
Other Health Impaired |
534 |
449 |
84 |
442 |
83 |
|
|
Autistic |
274 |
167 |
61 |
158 |
58 |
|
|
Traumatic Brain Injury |
18 |
16 |
89 |
14 |
78 |
|
SLEPD = Students with limited English proficiency
with disabilities; All SD = All students with disabilities including SLEPD; 0 =
No students tested; Dashes = No students were in that category.
In this section, we examine student performance based on five levels of proficiency. In the five level system, Levels IIB and above are considered “on track” for achieving academic standards in upper grade levels.
In Table 5, the performance data for mathematics and reading for 2000-2001 show that the majority of students in each group, except for All students, were in Levels I and IIA, with slightly more students in Level I for reading than for mathematics, for these same three student groups. Limited English proficient students with disabilities had the highest percentage of students in Level I for mathematics (63%) and reading (77%). This is approximately double the percentage of All students in Levels I and IIA combined. See Figure 3 for a graph of these data.
Table 5. 2000-2001 MCA Performance Levels, Grade 3
|
|
Total Tested |
Level I |
Level II A |
Level II B |
Level III |
Level IV |
|||||
|
# |
% |
# |
% |
# |
% |
# |
% |
# |
% |
||
|
Mathematics SLEPD SLEP SD All students |
239 3467 6177 59695
|
151 892 1757 5704 |
63 26 28 10 |
54 1382 2051 14903 |
23 40 33 25 |
11 398 709 7668 |
5 12 12 13 |
21 675 1318 23295 |
9 20 21 39 |
2 120 342 8125 |
1 4 6 14 |
|
Reading SLEPD SLEP SD All students |
225 3460 5984 59652 |
174 1535 2742 9535 |
77 44 46 16 |
33 957 1151 10084 |
15 28 19 17 |
7 514 775 10814 |
3 15 13 18 |
9 392 950 19592 |
4 11 16 33 |
2 62 366 9627 |
1 2 6 16 |
Key: SLEPD = Students with limited English
proficiency with disabilities; SLEP = Students with limited English proficiency
without disabilities; SD = Students with disabilities without limited English
proficiency.
Figure 3. 2000-2001 MCA Performance Across Groups, Grade 3
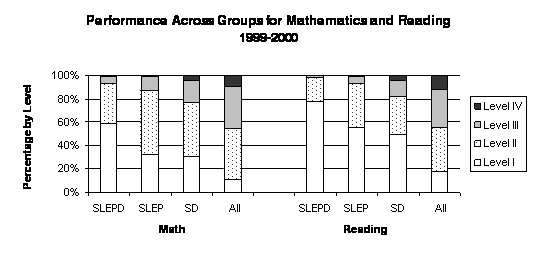
Table 6 presents the mathematics data for limited English proficient students with disabilities from Hmong, Spanish, and Somali language backgrounds compared to all students from these language backgrounds. The majority of students with disabilities across language groups were in Levels I or IIA. Hmong students with disabilities had a slightly higher percentage in Level IIA than in Level I. In comparison, although 63-83% of the All students were also in these lower two levels for mathematics, there was more spread across these groups into higher performance levels.
Table 6. 2000-2001 Mathematics Performance Levels by Language Group, Grade 3
|
|
Number Tested |
Level I |
Level II a |
Level II B |
Level III |
Level IV |
||||||
|
# |
% |
# |
% |
# |
% |
# |
% |
# |
% |
|||
|
SLEPD |
Hmong |
88 |
51 |
58 |
23 |
26 |
4 |
4 |
10 |
11 |
0 |
0 |
|
Spanish |
102 |
72 |
71 |
20 |
20 |
6 |
6 |
4 |
4 |
0 |
0 |
|
|
Somali |
7 |
5 |
71 |
1 |
14 |
1 |
14 |
0 |
0 |
0 |
0 |
|
|
All1 |
Hmong |
1732 |
414 |
24 |
673 |
39 |
220 |
13 |
363 |
21 |
62 |
3 |
|
Spanish |
1383 |
427 |
31 |
575 |
42 |
137 |
10 |
207 |
15 |
37 |
3 |
|
|
Somali |
177 |
90 |
51 |
56 |
32 |
11 |
6 |
19 |
11 |
1 |
1 |
|
SLEPD = Students with limited
English proficiency with disabilities.
1All
students in this table includes the population of all Hmong, Spanish, and Somali
speaking students regardless of language proficiency
*Indicates fewer than 10 students tested.
Table 7 presents the reading data for the same groups of students. Here, even more students with disabilities were in Level I (76-100%). In comparison, 46-63% of the All group were in Level I and 74-81% of the All group were in the lowest two levels. Therefore, a slightly higher percentage of students were in the lowest levels for reading than for mathematics.
Table 7. 2000-2001 Reading Performance Levels by Language Group, Grade 3
|
|
Number Tested |
Level I |
Level II a |
Level II B |
Level III |
Level IV |
||||||
|
# |
% |
# |
% |
# |
% |
# |
% |
# |
% |
|||
|
SLEPD |
Hmong |
85 |
65 |
76 |
13 |
15 |
3 |
4 |
3 |
4 |
1 |
1 |
|
Spanish |
92 |
72 |
78 |
15 |
16 |
2 |
2 |
3 |
4 |
0 |
0 |
|
|
Somali |
7 |
7 |
100 |
0 |
0 |
0 |
0 |
0 |
0 |
0 |
0 |
|
|
All1 |
Hmong |
1733 |
806 |
46 |
492 |
28 |
252 |
14 |
160 |
9 |
23 |
1 |
|
Spanish |
1355 |
623 |
46 |
353 |
26 |
189 |
14 |
154 |
11 |
36 |
3 |
|
|
Somali |
174 |
109 |
63 |
31 |
18 |
21 |
12 |
12 |
7 |
1 |
1 |
|
SLEPD = Students
with limited English proficiency with disabilities.
1All
students in this table includes the population of all Hmong, Spanish, and Somali
speaking students regardless of language proficiency.* Indicates fewer than 10
students tested.
Figure 4 shows these data graphed. It should be noted that the Somali numbers should be interpreted with caution because there was only a small number tested.
Figure 4. 2000-2001 Performance of Limited English Proficient Students with Disabilities by Language Group
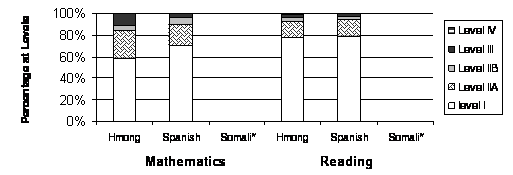
Table 8 shows the MCA performance of limited English proficient students with disabilities (SLEPD) and all students with disabilities (SD) by disability category. We have used an asterisk to mark those categories with fewer than 10 students tested. If there were no students tested, these are marked with a “0.” Categories with dashes all the way across indicate that there were no students in that category.
Table 8. 2000-2001, MCA Mathematics Performance by Disability Category, Grade 3
|
SLEPD by Disability Category |
Mathematics On track: Level IIB & above |
Reading On track: Level IIB & above |
||||
|
Tested |
N |
% |
Tested |
N |
% |
|
|
Speech/Language Impaired |
95 |
22 |
23 |
94 |
16 |
23 |
|
Mentally Impaired: Mild-Moderate |
7 |
* |
* |
5 |
* |
* |
|
Mentally Impaired: Moderate-Severe |
0 |
0 |
0 |
0 |
0 |
0 |
|
Physically Impaired |
6 |
* |
* |
5 |
* |
* |
|
Deaf-Hard of Hearing |
17 |
1 |
1 |
14 |
0 |
0 |
|
Visually Impaired |
4 |
* |
* |
5 |
* |
* |
|
Specific Learning Disabilities |
82 |
5 |
1 |
74 |
0 |
0 |
|
Emotional/Behavioral Disorders |
13 |
1 |
1 |
12 |
0 |
0 |
|
Deaf-Blindness |
- |
- |
- |
- |
- |
- |
|
Other Health Impaired |
12 |
1 |
1 |
13 |
0 |
0 |
|
Autistic |
1 |
* |
* |
1 |
* |
* |
|
Traumatic Brain Injury |
2 |
* |
* |
2 |
* |
* |
|
All SD by Disability Category |
Level IIB & above |
Level IIB & above |
||||
|
Tested |
N |
% |
Tested |
N |
% |
|
|
Speech/Language Impaired |
2401 |
1344 |
56 |
2390 |
1317 |
55 |
|
Mentally Impaired: Mild-Moderate |
264 |
8 |
3 |
237 |
4 |
2 |
|
Mentally Impaired: Moderate-Severe |
7 |
* |
* |
7 |
* |
* |
|
Physically Impaired |
103 |
30 |
29 |
95 |
33 |
35 |
|
Deaf-Hard of Hearing |
134 |
44 |
33 |
126 |
37 |
29 |
|
Visually Impaired |
32 |
14 |
44 |
31 |
13 |
42 |
|
Specific Learning Disabilities |
2074 |
519 |
25 |
1986 |
285 |
14 |
|
Emotional/Behavioral Disorders |
764 |
264 |
35 |
718 |
249 |
35 |
|
Deaf-Blindness |
5 |
* |
* |
5 |
* |
* |
|
Other Health Impaired |
449 |
121 |
27 |
442 |
106 |
24 |
|
Autistic |
167 |
56 |
34 |
158 |
61 |
39 |
|
Traumatic Brain Injury |
16 |
2 |
12.5 |
14 |
2 |
14 |
SLEPD = Students with limited
English proficiency with disabilities; All SD = All students with disabilities
including SLEPD; 0 = No students tested; Dashes = No students were in that
category; *Indicates fewer than 10 students tested.
For mathematics and reading, the percentages of limited English proficient students with disabilities achieving Level IIB and above were very small. Most categories only showed 0-1% “on track,” with the exception of Speech/Language Impaired, which had 23% “on track” for mathematics and reading. Although this 23% looks better in comparison to the other percentages among this group of students, they are still performing only about half as well as this same category for All students with disabilities, which had 55-56% “on track.”
Even for those categories with larger numbers of limited English proficient students with disabilities tested (e.g., Speech/Language Impaired, Deaf-Hard of Hearing, Specific Learning Disabilities, and Other Health Impaired), the difference in percentages of these students “on track” were well below those of All students with disabilities. Figures 5 and 6 present the percentages of this subset of students at the performance levels for mathematics and reading. These graphs include the percentage of students not tested at the lowest level. Categories without data either did not have students in that category or had fewer than 10 participating in the test.
Figure 5. 2000-2001 MCA Mathematics Performance for Limited English Proficient Students with Disabilities, Grade 3
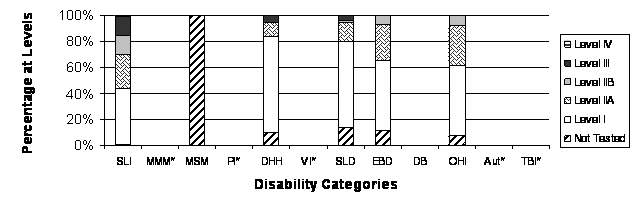
Figure 6. 2000-2001 MCA Reading Performance for Limited English Proficient Students with Disabilities, Grade 3
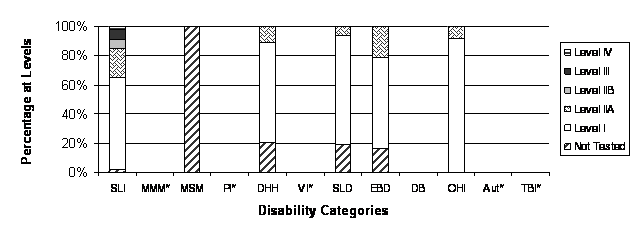
Table 9 shows participation for fifth graders for 2000-2001 by student groups: students with limited English proficiency and disabilities (SLEPD), students with limited English proficiency (SLEP), students with disabilities (SD), and All students, which refers to the total population of students enrolled in grade 5 in the state. Participation rates were fairly consistent across groups for both content areas. Further, both groups with disabilities (SLEPD and SD) were comparable in their percentages tested, slightly below that of the other two groups. Figure 7 also shows these data.
Table 9. 2000-2001 MCA Participation Across Groups, Grade 5
|
Grade 5 |
Number Enrolled* |
Number Tested Mathematics |
Percent Tested Mathematics |
Number Tested Reading |
Percent Tested Reading |
|
SLEPD SLEP SD All students1 |
413 3439 9002 66560 |
352 3185 7729 62687 |
85 93 86 94 |
350 3196 7710 63126 |
85 93 86 95 |
Key: SLEPD = Students with limited
English proficiency with disabilities; SLEP = Students with limited English
proficiency without disabilities; SD = Students with disabilities without
limited English proficiency.
1All
students in this table refers to the total population of students enrolled in
grade 5 in the state.
Figure 7. 2000-2001 MCA Participation Across Groups, Grade 5
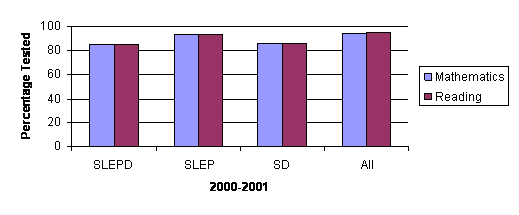
Table 10. 2000-2001 MCA Participation by Language, Grade 5
|
Number Enrolled |
Number Tested Mathematics |
Percent Tested Mathematics |
Number Tested Reading |
Percent Tested Reading |
||
|
SLEPD |
Hmong |
181 |
158 |
87 |
156 |
86 |
|
Spanish |
138 |
115 |
83 |
116 |
84 |
|
|
Somali |
13 |
8 |
61 |
9 |
69 |
|
|
All1 |
Hmong |
1857 |
1807 |
97 |
1807 |
97 |
|
Spanish |
1421 |
1234 |
87 |
1251 |
88 |
|
|
Somali |
286 |
226 |
79 |
234 |
82 |
|
SLEPD = Students with limited
English proficiency with disabilities.
1All
students in this table includes the population of all Hmong, Spanish, and Somali
speaking students regardless of language proficiency.
Figure 8. 2000-2001 MCA Participation for Limited English Proficient Students with Disabilities by Language Group, Grade 5
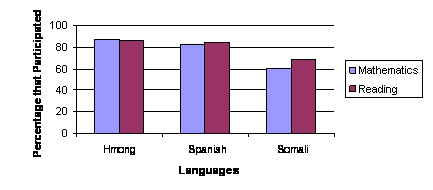
Table 11 presents the 2000-2001 participation data for fifth grade students with limited English proficiency and disabilities according to disability categories. The small numbers result in fluctuations in the percentages of those tested in math and reading, so caution must be observed in interpreting these findings.
Table 11. 2000-2001 MCA Participation for Limited English Proficient Students with Disabilities and All Students with Disabilities by Disability Group, Grade 5
|
|
Disability Group |
Enrolled |
Mathematics Tested |
Reading Tested |
||
|
N |
% |
N |
% |
|||
|
SLEPD |
Speech/Language Impaired |
92 |
84 |
91 |
87 |
95 |
|
Mentally Impaired: Mild-Moderate |
19 |
11 |
58 |
11 |
58 |
|
|
Mentally Impaired: Moderate-Severe |
6 |
0 |
0 |
0 |
0 |
|
|
Physically Impaired |
8 |
7 |
87 |
6 |
75 |
|
|
Deaf-Hard of Hearing |
25 |
17 |
68 |
16 |
64 |
|
|
Visually Impaired |
1 |
1 |
100 |
1 |
100 |
|
|
Specific Learning Disabilities |
223 |
202 |
91 |
199 |
89 |
|
|
Emotional/Behavioral Disorders |
21 |
17 |
81 |
17 |
81 |
|
|
Deaf-Blindness |
0 |
- |
- |
- |
- |
|
|
Other Health Impaired |
12 |
11 |
92 |
11 |
92 |
|
|
Autistic |
3 |
0 |
0 |
0 |
0 |
|
|
Traumatic Brain Injury |
3 |
2 |
67 |
2 |
67 |
|
|
All SD
|
Disability Group |
Enrolled |
Mathematics Tested |
Reading Tested |
||
|
N |
% |
N |
% |
|||
|
Speech Language Impaired |
2191 |
2081 |
95 |
2107 |
96 |
|
|
Mentally Impaired: Mild-Moderate |
547 |
278 |
51 |
277 |
51 |
|
|
Mentally Impaired: Moderate-Severe |
173 |
2 |
1 |
3 |
2 |
|
|
Physically Impaired |
121 |
87 |
72 |
92 |
76 |
|
|
Deaf-Hard of Hearing |
174 |
146 |
84 |
139 |
80 |
|
|
Visually Impaired |
30 |
26 |
87 |
25 |
83 |
|
|
Specific Learning Disabilities |
3877 |
3515 |
91 |
3475 |
90 |
|
|
Emotional/Behavioral Disorders |
1332 |
1146 |
86 |
1148 |
86 |
|
|
Deaf-Blindness |
5 |
3 |
60 |
3 |
60 |
|
|
Other Health Impaired |
732 |
649 |
89 |
637 |
87 |
|
|
Autistic |
207 |
129 |
62 |
135 |
65 |
|
|
Traumatic Brain Injury |
26 |
19 |
73 |
19 |
73 |
|
SLEPD = Students with limited
English proficiency with disabilities; All SD = All students with disabilities
including SLEPD; 0 = No students tested; Dashes = No students were in that
category.
Similar to third grade, the highest numbers of limited English proficient students with disabilities were in the Speech/Language Impaired (N=84) and Specific Learning Disabilities (N=87) categories. Also, there were no limited English proficient students in the Deaf-Blind category. For mathematics and reading, there were comparable percentages of students with limited English proficiency and disabilities participating. For example, the percentage of limited English proficient students with speech or language impairments tested in mathematics was 91%, and in reading 95%. The percentage tested of students with mild to moderate mental impairments was 58% in mathematics and reading. Percentages tested across the All group were also similar by content area. Comparing the All group to students with limited English proficiency also shows similar percentages of students tested by category and by content area.
Fifth grade performance levels for student groups are presented in Table 12. Again, the majority of each student group, except for All students, performed in Level I and Level IIA, below the levels considered to be “on track” for success in the upper grades. Limited English proficient students with disabilities had the highest percentages in Level I for mathematics (65%). The other groups had almost half that percentage of students or less in Level I (11-35%) for mathematics. Looking at percentages “on track” for these groups, limited English proficient students with disabilities had 10% on track for mathematics, in contrast to the other groups that ranged between 31-67% on track for mathematics.
Table 12. 2000-2001 MCA Performance Levels, Grade 5
|
|
Number Tested |
Level I |
Level II a |
Level II b |
Level III |
Level IV |
|||||
|
# |
% |
# |
% |
# |
% |
# |
% |
# |
% |
||
|
Mathematics SLEPD SD SLEP All students1 |
352 3185 7729 62687 |
228 1021 2667 7003 |
65 32 35 11 |
89 1196 2295 13485 |
25 38 30 22 |
25 462 1011 10504 |
7 15 13 17 |
10 448 1415 23452 |
3 14 18 37 |
0 58 341 8243 |
0 2 4 13 |
|
Reading SLEPD SD SLEP All students1 |
350 3196 7710 63126 |
260 1264 2911 7036 |
74 39 38 11 |
56 1006 1774 9550 |
16 3123 15 |
18 357 731 6867 |
5 11 9 11 |
14 492 1689 24474 |
4 15 22 39 |
2 77 605 15199 |
6 2 8 24 |
Key: SLEPD = Students with
limited English proficiency with disabilities; SLEP = Students with limited
English proficiency without disabilities; SD = Students with disabilities
without limited English proficiency.
1All
students in this table refers to the total population of students enrolled in
grade 5 in the state.
For reading, students with disabilities and limited English proficiency also had the highest percentage in Level I (74%). The other groups had 11-39% of their students in Level I. Looking at percentages “on track,” limited English proficient students with disabilities had 15% on track (IIB and above) for reading, slightly higher than 10% for this same group in mathematics. The other groups ranged from 28-74% on track for reading. With the exception of All students with disabilities (SD = 28%), there were slightly higher percentages on track for “reading” than for mathematics overall.
Table 13 shows the mathematics performance of limited English proficient students with disabilities from Hmong, Spanish and Somali speaking backgrounds compared to All students in these language backgrounds. Among students with disabilities (SLEPD), there were fairly high percentages in Level 1 for (63-75%) for mathematics. In contrast, All students in these language groups had 30-54% in Level I for mathematics.
Table 13. 2000-2001 Mathematics Performance Levels by Language, Grade 5
|
|
|
Number Tested |
Level I |
Level II a |
Level II B |
Level III |
Level IV |
|||||
|
# |
% |
# |
% |
# |
% |
# |
% |
# |
% |
|||
|
SLEPD |
Hmong |
158 |
106 |
67 |
43 |
27 |
5 |
3 |
4 |
3 |
0 |
0 |
|
Spanish |
115 |
72 |
63 |
28 |
24 |
9 |
8 |
6 |
5 |
0 |
0 |
|
|
Somali |
8 |
6 |
75 |
2 |
25 |
0 |
0 |
0 |
0 |
0 |
0 |
|
|
All1 |
Hmong |
1807 |
542 |
30 |
693 |
38 |
277 |
15 |
271 |
15 |
24 |
1 |
|
Spanish |
1234 |
444 |
36 |
450 |
36 |
167 |
14 |
154 |
13 |
19 |
1 |
|
|
Somali |
226 |
122 |
54 |
77 |
34 |
11 |
5 |
15 |
7 |
1 |
0 |
|
SLEPD = Students with limited
English proficiency with disabilities.
1All students in this table includes the population of all Hmong,
Spanish, and Somali speaking students regardless of language proficiency.
* Indicates fewer than 10 students tested.
Compared to mathematics, the percentages of students in Level I for reading (see Table 14) was generally higher for both limited English proficient students with disabilities and the All group. For reading, students with disabilities (SLEPD) had 67-79% in Level I, and the All groups had a range of 41-51% in this same level.
Table 14. 2000-2001 Reading Performance Levels by Language, Grade 5
|
|
|
Number Tested |
Level I |
Level II a |
Level II B |
Level III |
Level IV |
|||||
|
# |
% |
# |
% |
# |
% |
# |
% |
# |
% |
|||
|
SLEPD |
Hmong |
156 |
124 |
79 |
22 |
14 |
6 |
4 |
4 |
3 |
0 |
0 |
|
Spanish |
116 |
83 |
72 |
19 |
16 |
7 |
6 |
5 |
4 |
2 |
2 |
|
|
Somali |
9 |
6 |
67 |
3 |
33 |
0 |
0 |
0 |
0 |
0 |
0 |
|
|
All1 |
Hmong |
1807 |
747 |
41 |
609 |
34 |
183 |
10 |
240 |
13 |
28 |
2 |
|
Spanish |
1251 |
514 |
41 |
334 |
27 |
124 |
10 |
233 |
18 |
46 |
4 |
|
|
Somali |
234 |
118 |
51 |
64 |
27 |
22 |
9 |
26 |
11 |
4 |
2 |
|
SLEPD = Students with limited
English proficiency with disabilities.
1All students in this table includes the population of all Hmong,
Spanish, and Somali speaking students regardless of language proficiency.
* Indicates fewer than 10 students tested.
For students above Level IIA, the limited
English proficient students with disabilities groups had 0-13% on track in
mathematics and 0-12% on track in reading. For the All groups these ranges were
12-31% in mathematics and 22-32% in reading. Spanish speaking students with and
without disabilities had a slightly higher percentage “on track” for mathematics
and reading.
The performance of limited English proficient students with disabilities by
category is presented in Table 15. Dashes indicate that there were no students
in a category and a “0” means that there were either no students tested or no
students achieving Levels IIB or above to be ”on track.” Despite relatively low
numbers of students with disabilities and limited English language proficiency,
the highest percentage of students on track for achievement in mathematics and
reading was in the following categories: Speech/ Language Impaired (25-26%),
Deaf Hard of Hearing (12-18%), Other Health Impaired (18% for mathematics), and
Emotional/Behavioral Disorders (12%). However, these percentages are at best
only half the percentage of those on track among All students with disabilities
in these same categories. In comparison, for the All students with disabilities
group, 25% is at the lower end of the performance range, with only one category
below this at 2% (Mentally Impaired: Mild-Moderate).
Table 15. 2000-2001 Performance for Students with Disabilities and Limited English Proficient Students with Disabilities by Disability Group, Grade 5
|
|
Disability Group |
Mathematics “On Track” |
Reading “On Track” |
||||
|
Tested |
N |
% |
Tested |
N |
% |
||
|
SLEPD |
Speech/Language Impaired |
84 |
21 |
25 |
87 |
22 |
26 |
|
Mentally Impaired: Mild-Moderate |
11 |
0 |
0 |
11 |
0 |
0 |
|
|
Mentally Impaired: Moderate-Severe |
0 |
0 |
0 |
0 |
0 |
0 |
|
|
Physically Impaired |
7 |
* |
* |
6 |
0 |
0 |
|
|
Deaf-Hard of Hearing |
17 |
2 |
12 |
16 |
3 |
18 |
|
|
Visually Impaired |
1 |
* |
* |
1 |
* |
* |
|
|
Specific Learning Disabilities |
202 |
8 |
4 |
199 |
6 |
3 |
|
|
Emotional/Behavioral Disorders |
17 |
1 |
6 |
17 |
2 |
12 |
|
|
Deaf-Blindness |
- |
- |
- |
- |
- |
- |
|
|
Other Health Impaired |
11 |
2 |
18 |
11 |
1 |
1 |
|
|
Autistic |
0 |
0 |
0 |
0 |
0 |
0 |
|
|
Traumatic Brain Injury |
2 |
0 |
0 |
2 |
0 |
0 |
|
|
All SD
|
Disability Group |
Mathematics “On Track” |
Reading “On Track” |
||||
|
Tested |
N |
% |
Tested |
N |
% |
||
|
Speech Language Impaired |
2081 |
1239 |
59 |
2107 |
1375 |
65 |
|
|
Mentally Impaired: Mild-Moderate |
278 |
5 |
2 |
277 |
4 |
1 |
|
|
Mentally Impaired: Moderate-Severe |
2 |
* |
* |
3 |
* |
* |
|
|
Physically Impaired |
87 |
30 |
34 |
92 |
39 |
42 |
|
|
Deaf-Hard of Hearing |
146 |
56 |
38 |
139 |
52 |
37 |
|
|
Visually Impaired |
26 |
11 |
42 |
25 |
13 |
52 |
|
|
Specific Learning Disabilities |
3515 |
868 |
25 |
3475 |
847 |
24 |
|
|
Emotional/Behavioral Disorders |
1146 |
360 |
31 |
1148 |
464 |
40 |
|
|
Deaf-Blindness |
3 |
* |
* |
3 |
* |
* |
|
|
Other Health Impaired |
649 |
175 |
27 |
637 |
207 |
32 |
|
|
Autistic |
129 |
52 |
40 |
135 |
53 |
39 |
|
|
Traumatic Brain Injury |
19 |
6 |
31 |
19 |
3 |
16 |
|
SLEPD = Students with limited
English proficiency with disabilities; All SD = All students with disabilities
including students with limited English proficiency with disabilities; 0 = No
students tested; Dashes = No students were in that category; * Indicates fewer
than 10 students tested.
Figures 9 and 10 show the graphed percentages of limited English proficient students with disabilities at each level. In addition, these graphs show the percentage of students not tested, indicated by the bottom level of each category. Categories with fewer than 10 students participating are indicated by an asterisk. These performance data are not graphed to retain confidentiality of students. Other categories without data and without an asterisk indicate there were no students in that category.
Figure 9. 2000-2001 MCA Mathematics Performance for Limited English Proficient Students with Disabilities by Disability, Grade 5

Figure 10. 2000-2001 MCA Reading
Performance for Limited English Students with Disabilities by Disability, Grade
5 These figures give more detail for the levels
achieved by each group. As shown in Table 15, only a few categories of limited
English proficient students with disabilities were on track for reaching content
standards. These figures show that many of the students within the range
considered “on track” are actually in the lowest level of that range, in Level
IIB. Students in some categories performed in the higher Levels. Students in the
Speech/Language Impaired, Deaf-Hard of Hearing, and Emotional/Behavioral
Disorder categories performed at Level III, and a small percentage of students
with Emotional/Behavioral Disorders performed in Level IV for reading.
These figures give more detail for the levels
achieved by each group. As shown in Table 15, only a few categories of limited
English proficient students with disabilities were on track for reaching content
standards. These figures show that many of the students within the range
considered “on track” are actually in the lowest level of that range, in Level
IIB. Students in some categories performed in the higher Levels. Students in the
Speech/Language Impaired, Deaf-Hard of Hearing, and Emotional/Behavioral
Disorder categories performed at Level III, and a small percentage of students
with Emotional/Behavioral Disorders performed in Level IV for reading.
Table 15. 2000-2001 Performance for Students with Disabilities and Limited English Proficient Students with Disabilities by Disability Group, Grade 5
|
|
Disability Group |
Mathematics “On Track” |
Reading “On Track” |
||||
|
Tested |
N |
% |
Tested |
N |
% |
||
|
SLEPD |
Speech/Language Impaired |
84 |
21 |
25 |
87 |
22 |
26 |
|
Mentally Impaired: Mild-Moderate |
11 |
0 |
0 |
11 |
0 |
0 |
|
|
Mentally Impaired: Moderate-Severe |
0 |
0 |
0 |
0 |
0 |
0 |
|
|
Physically Impaired |
7 |
* |
* |
6 |
0 |
0 |
|
|
Deaf-Hard of Hearing |
17 |
2 |
12 |
16 |
3 |
18 |
|
|
Visually Impaired |
1 |
* |
* |
1 |
* |
* |
|
|
Specific Learning Disabilities |
202 |
8 |
4 |
199 |
6 |
3 |
|
|
Emotional/Behavioral Disorders |
17 |
1 |
6 |
17 |
2 |
12 |
|
|
Deaf-Blindness |
- |
- |
- |
- |
- |
- |
|
|
Other Health Impaired |
11 |
2 |
18 |
11 |
1 |
1 |
|
|
Autistic |
0 |
0 |
0 |
0 |
0 |
0 |
|
|
Traumatic Brain Injury |
2 |
0 |
0 |
2 |
0 |
0 |
|
|
All SD
|
Disability Group |
Mathematics “On Track” |
Reading “On Track” |
||||
|
Tested |
N |
% |
Tested |
N |
% |
||
|
Speech Language Impaired |
2081 |
1239 |
59 |
2107 |
1375 |
65 |
|
|
Mentally Impaired: Mild-Moderate |
278 |
5 |
2 |
277 |
4 |
1 |
|
|
Mentally Impaired: Moderate-Severe |
2 |
* |
* |
3 |
* |
* |
|
|
Physically Impaired |
87 |
30 |
34 |
92 |
39 |
42 |
|
|
Deaf-Hard of Hearing |
146 |
56 |
38 |
139 |
52 |
37 |
|
|
Visually Impaired |
26 |
11 |
42 |
25 |
13 |
52 |
|
|
Specific Learning Disabilities |
3515 |
868 |
25 |
3475 |
847 |
24 |
|
|
Emotional/Behavioral Disorders |
1146 |
360 |
31 |
1148 |
464 |
40 |
|
|
Deaf-Blindness |
3 |
* |
* |
3 |
* |
* |
|
|
Other Health Impaired |
649 |
175 |
27 |
637 |
207 |
32 |
|
|
Autistic |
129 |
52 |
40 |
135 |
53 |
39 |
|
|
Traumatic Brain Injury |
19 |
6 |
31 |
19 |
3 |
16 |
|
SLEPD = Students with limited
English proficiency with disabilities; All SD = All students with disabilities
including students with limited English proficiency with disabilities; 0 = No
students tested; Dashes = No students were in that category; * Indicates fewer
than 10 students tested.
Participation in the MCAs by students with limited English proficiency and disabilities, students with limited English proficiency, students with disabilities, and all students for school years 1999-2000 and 2000-2001 is shown in Figure 11. Different pictures of participation across years are seen in the two content areas (e.g., for students with disabilities there was a decrease in mathematics but an increase in reading.) None of the changes in participation is extremely large. (See Table A in Appendix for the data used to create Figure 11.)
Figure 11. Comparison of Percentage Tested Across Groups for 1999-2000 and 2000-2001, Grade 3

Participation by language group across two years (1999-2000 and 2000-2001) is shown in Figure 12. Here again, there appears to be no patterns across languages or by content area. The only indication of any change is for the Somali speaking students with disabilities. However, this change is based on only 7 or 8 students, and thus is not a reliable indication of change in participation. The actual numbers and percentages for 1999-2000 and 2000-2001 are shown in Table B in the Appendix.
Participation rates for 3rd grade limited English proficient students with disabilities are presented in Figure 13 and 14 for specific categories of disabilities. For mathematics (Figure 15), the participation rates were fairly consistent across the three categories: Speech Language Impaired, Specific Learning Disabilities, and Deaf-Hard of Hearing. For reading, the participation rates show slightly larger changes between years, with increases in percent tested (SLI) and decreases (SLD and DHH). (See Table C in the Appendix for the data used to create Figures 15 and 16.)
Figure 12. Percentage of Limited English Proficient Students with Disabilities Tested Across Years by Language Group, Grade 3


Figure 14. 1999-2001 Reading Participation Rates for Limited English Proficient Students with Disabilities, Grade 3

Figures 15 and 16 compare the percentage of students at each performance level for 1999-2000 and 2000-2001 by student group. Only slight differences in performance across years are evident for the limited English proficient students with disabilities. (See Table D in the Appendix for the specific numbers and percentages that correspond with these figures.) The largest percentage of students was in Levels I and IIA, with slightly more students in Level I for reading (77-78%) than for mathematics (59-63%). For mathematics, the percentage of limited English proficient students with disabilities in Level I was almost double the percentage of students in this same level for the separate language and disability status groups. For reading, the limited English proficient students with disabilities did even less well, but there was less contrast because the other groups also did less well in reading across years. (See Table D in Appendix for data used to create Figures 15 and 16.)
Figure 15. 1999-2000 MCA Performance for Math Across Groups, Grade 3

Figure 16. 1999--2001 MCA Performance for Reading Across Groups, Grade 3

Figure 17. 1999-2001 Mathematics Performance for Limited English Proficient Students with Disabilities by Language Group, Grade 3

Figure 18. 1999-2001 Reading Performance for Limited English Proficient Students with Disabilities by Language Group, Grade 3

Figure 18 shows the reading performance levels for the same years. Gains in reading across years were smaller as well for students with disabilities in these language groups, with the percentage of Spanish students “on track” staying about the same and only a slight increase of 4% more Hmong students “on track.” The All groups also made fewer gains in reading, (See Tables F through H in the Appendix for All language groups and groups by language and disability.)
Figures 19 and 20 present the percentages of limited English proficient students with disabilities “on track” for reading and mathematics for the top three categories of disability based on numbers tested for 1999-2000 and 2000-2001. These top three categories were Speech/Language Impaired (SLI), Specific Learning Disabilities (SLD), and Deaf-Hard of Hearing (DHH). As shown here, the most gain for mathematics and reading was seen among limited English proficient students with Speech/Language Impairments. The other two disability categories did not show comparable gains in either content area. (See Table I in Appendix for the data used to create Figures 19 and 20.)
Figure 19. 2000-2001 MCA
Mathematics Performance for Limited English Proficient Students with
Disabilities, Grade 3

Figure 20. 2000-2001 MCA Reading Performance of Limited English Proficient Students with Disabilities, Grade 3
Figure 21 shows the percentages of each
student group taking the mathematics and reading tests for 1999-2000 and
2000-2001. This graph shows that the percentage of students participating in the
mathematics and reading tests across groups was fairly consistent across years.
Although limited English proficient students with disabilities had a slight
increase (3%) in those taking the reading test, the overall participation for
this group is still the lowest of all groups for both content areas, slightly
below that of all students with disabilities. (See Table J in the Appendix.) Figure 21. Participation in
1999-2000 and 2000-2001 Mathematics and Reading MCAs Across Groups, Grade 5 Figure 22 shows the
participation rates
of limited English
proficient students
with disabilities
for Hmong, Spanish,
and Somali students
in 1999-2000 and
2000-2001. This
figure suggests
small increases in
participation for
both Hmong and
Spanish speaking
limited English
proficient students
with disabilities,
but a decrease in
participation for
Somali students with
limited English
proficiency and
disabilities. (Table
K in the Appendix
provides the actual
numbers used to
produce Figure 22.) Figure 22. Limited English
Proficient Students with Disabilities Participation for 1999-2000 and 2000-2001
for Math and Reading by Language Group, Grade 5 Figures 23 and 24 show the
participation rates
of fifth grade
limited English
proficient students
with disabilities in
the three disability
categories with most
students tested. For
mathematics (Figure
23), students with
Speech/Language
Impairments, and
students who were
Deaf-Hard of Hearing
showed a slight
decrease in the
percent tested. For
reading (Figure 24),
students with Speech
Language Impairments
and Specific
Learning
Disabilities showed
slight increases in
percent tested. All
groups shared minor
fluctuations except
perhaps for the
students who were
deaf and hard of
hearing, where a
noticeable drop in
participation seemed
to occur from
1999-2000 to
2000-2001. For
numbers of students
enrolled and tested
in each category for
both years see Table
L in the Appendix. Figure 23. 1999-2001 Mathematics
Participation Rates for Limited English Proficient Students with Disabilities,
Grade 5 Figure
24. 1999-2001
Reading
Participation Rates
for Limited English
Proficient Students
with Disabilities,
Grade 5 Figures 25 and 26 show the percentage of
students in 5th grade at each performance level for 1999-2000 and 2000-2001 by
student group. Only a slight difference in performance across years was evident
for the limited English proficient students with disabilities. (See Table M in
the Appendix for the specific numbers used to create these figures.) Figure 25. 1999-2000 MCA
Performance for Mathematics Across Groups and Years, Grade 5 Figure
26. 1999--2001 MCA
Performance for
Reading Across
Groups and Years,
Grade 5 Figures 27 and 28
present the
mathematics and
reading performance
of Hmong, Spanish,
and Somali speaking
students with
disabilities by
language group. The
most gain was found
for Spanish speaking
students. This group
had an increase of
5% in Levels IIB and
above. (See Tables N
and P in the
Appendix for the
specific data for
All students in
these language
groups and for the
data used to create
Figure 27.) Figure 27. 1999-2001 Mathematics
Performance for Limited English Proficient Students with Disabilities by
Language Group, Grade 5 Figure 28. 1999-2001
Reading Performance
for Limited English
Proficient Students
with Disabilities by
Language Group,
Grade 5 Figure 29. MCA
Mathematics
Performance for
Limited English
Proficient Students
with Disabilities by
Top Three Disability
Categories Across
Years, Grade 5 Figure
30. MCA Reading
Performance for
Limited English
Proficient Students
with Disabilities by
Top Three Disability
Categories Across
Years, Grade 5 Limited English proficient students with
disabilities had the lowest percentage tested of all groups (86-81% tested) in
mathematics and reading. Within the top three language groups (i.e., Hmong,
Somali, and Spanish) participation rates were similar by content area. The
percentage of limited English proficient students with disabilities by
disability category fluctuated due to low enrollments across these categories.
Some categories had noticeably lower percentages tested compared to All students
with disabilities for a particular group (i.e., visually and physically
impaired). Most limited English proficient students with
disabilities performed at Levels I and IIA. Among these students, 15-17% more
students were performing at Level I for reading than for mathematics. This
pattern of apparent difficulty that students were having in reading was also
seen in the data by language groups, for students with and without disabilities.
These students showed only 0-1% of students “on track” for most disability
categories, with the exception of Speech/Language Impaired students who had 23%
“on track” for mathematics and reading. Overall, limited English proficient students
with disabilities had the lowest participation percentage of all groups (85%),
slightly below that of all students with disabilities (86%). As with third
graders, there were generally small percentages of limited English proficient
students with disabilities who participated across disability categories. Yet,
similar categories had higher participation in grade 5 as in grade 3:
Speech/Language Impaired and Specific Learning Disabilities. Fifth grade had
fewer students tested in the Deaf-Hard of Hearing category for both content
areas. As in third grade, most limited English
proficient students with disabilities in fifth grade performed below Level IIB,
with most in Level I. Across disability groups, the highest percentage of
limited English proficient students with disabilities on track for achievement
in mathematics and reading were: Speech/Language Impaired, Deaf Hard of Hearing,
Other Health Impaired, and Emotional/Behavioral Disorders. It is important to
point out that the percentage of these students on track is still only about
half that of students in these categories who are not limited English
proficient. Also, most of these students are still in the lowest level (Level
IIB) within the range considered to be “on track” for achievement in upper
grades. Participation across years showed only
minimal differences. Yet, for third graders, some categories of students by
disability had noticeably lower percentages tested compared to All students with
disabilities for a particular group (i.e., visually and physically impaired). In
5th grade, there were some changes in 5th grade participation by language group
with slight increases in participation across content areas for Hmong and
Spanish speaking students. Also, there was approximately 3% more limited English
proficient students with disabilities who took the reading test in 5th grade in
2000-2001. Performance data across years were also
similar. For 3rd grade, there were only minimal gains made in the percentage of
students with limited English proficiency who were on track for reading across
language groups (0-4%). In 5th grade, small gains were found for Spanish
speaking students with 5% more students “on track” for mathematics and 6% more
“on track” for reading. It appears that the Spanish speaking groups made the
most gains in reading and mathematics overall, and for students with
disabilities within that language group. Reading appears to be more difficult than
mathematics with fewer percentage gains in the “on track” proficiency levels
across years. Also, for students with both disabilities and limited English
proficiency, across years and disability categories, the difference in
percentage of students “on track” is well below those of all students with
disabilities. From the data, it is evident that there are
more students with disabilities and limited English proficiency in Level I for
reading, than for mathematics in both grades across years. This emphasizes the
fact that this group of students apparently needs more help in reading. It is
also interesting to point out that 5th grade students in 2000-2001 had slightly
higher percentages of students “on track” for reading (15-74%) across all groups
(except the SD group) in contrast to mathematics (10-67%). This difference may
be due to changes in content across grades in these subject areas, increased
efforts by teachers in reading skills or other factors. Overall, the difference
is minimal. Third grade student data by language group
show that a high percentage of students in the Hmong, Somali, and Spanish
speaking groups with and without disabilities, were in Level I for reading.
Combined with a low percentage of students “on track” observed across years, we
suggest that reading may be more difficult than mathematics for most of these
students. Although performance in 5th grade was very similar, it appears that
the Spanish speaking groups, with or without disabilities, showed slightly more
improvement in reading and mathematics overall. The reasons for these
differences across language groups may be due to the length of time a student
has been in the U.S., literacy background, the quality of instructional support
in a student’s first language, second language or both, or perhaps other
factors. Performance data for mathematics and reading
by disability was also fairly consistent across years, which means that these
students were generally performing noticeably lower than their English
proficient peers. This also clearly suggests that the needs of students with
disabilities and limited English proficiency could be better met to enable them
to achieve at higher levels. Albus, D., Thurlow, M., Barrera, M., Guven,
K., & Shyyan, V. (2004). 1999-2000 participation and performance of English
language learners with disabilities on Minnesota standards-based assessments
(LEP Projects Report 1). Minneapolis, MN: University of Minnesota, National
Center on Educational Outcomes. Available at:
http://education.umn.edu/nceo/OnlinePubs/LEP1.html Albus, D., Thurlow, M., & Liu, K. (2002).
1999-2000 participation and performance of English language learners reported in
public state documents and web sites (LEP Projects Report 3). Minneapolis, MN:
University of Minnesota, National Center on Educational Outcomes. Available at
http://education.umn.edu/NCEO/OnlinePubs/LEP3.pdf Minnesota Department of Education (2001).
Minnesota Comprehensive Assessments (MCAs): Parent’s Guide to the 3rd and 5th
Grade Test Results.[Brochure]. Available from the Minnesota Department of
Education Web site,
http://education.state.mn.us/stellent/groups/public/documents/translatedcontent/pub_intro_mca_parents.jsp Thurlow, M., & Liu, K. (2001). State and
district assessments as an avenue to equity and excellence for English language
learners with disabilities (LEP Projects Report 2). Minneapolis, MN: University
of Minnesota, National Center on Educational Outcomes. Available at
http://education.umn.edu/NCEO/OnlinePubs/LEP2.html Thurlow, M., Wiley, H. I., & Bielinski,
J. (2003). Going public: What 2000-2001 reports tell us about the performance of
students with disabilities (Technical Report 35). Minneapolis, MN: University of
Minnesota, National Center on Educational Outcomes. Available at
http://education.umn.edu/NCEO/OnlinePubs/Technical35.htm Table A. Grade 3 Participation
Across Groups for Years: 1999-2000 and 2000-2001
Grade 3
Number Enrolled*
Mathematics
Reading
No. Tested
% Tested
No. Tested
% Tested
1999-2000
SLEPD SLEP SD
All students
253
3209
7417
63498
213
2916
6315
59923
84
91
85
94
206
2942
6250
60261
81
92
84
95
2000-2001
SLEPD
SLEP SD
All students
279
3794
7183
63002
239
3467
6177
59695
86
91
86
95
225
3460
5984
59652
81
91
83
95 Key: SLEPD = Students with
limited English proficiency with disabilities; SLEP = Students with limited
English proficiency without disabilities; SD = Students with disabilities
without limited English proficiency. Table B. 2000-2001 MCA
Participation by Language, Grade 3
Number Enrolled
Mathematics
Reading
No. Tested
% Tested
No. Tested
% Tested
1999-2000
SLEPD
Hmong
99
86
87
81
82
Spanish
98
79
81
78
80
Somali
8
8
100
7
87
1999-2000
All Students1
Hmong
1792
1709
95
1722
96
Spanish
1259
1074
85
1076
85
Somali
172
141
82
145
84
2000-2001
SLEPD
Hmong
101
88
87
85
84
Spanish
120
102
85
92
77
Somali
8
7
87
7
87
2000-2001
All Students1
Hmong
1828
1732
95
1733
95
Spanish
1566
1383
88
1355
86
Somali
224
177
79
174
78 SLEPD = Students with limited
English proficiency with disabilities.
Grade 3
Disability Group
Enrolled
Tested in Mathematics
Tested in Reading
N
%
N
%
1999-2000
SLEPD
Speech/Language Impaired
81
76
94
73
90
Deaf-Hard of Hearing
19
16
84
17
89
Specific Learning Disabilities
94
82
87
81
86
2000-2001
SLEPD
Speech/Language Impaired
96
95
99
94
98
Deaf-Hard of Hearing
19
17
89
14
74
Specific Learning Disabilities
97
82
84
74
76 SLEPD = Students
with limited English proficiency with disabilities.
Year and content
Total Tested
Level I
Level II A
Level II B
Level III
Level IV
#
%
#
%
#
%
#
%
#
%
99-00 – Mathematics
SLEPD
SLEP
SD
All students
213
2916
6315
59923
125
933
1955
6284
59
32
31
11
58
1194
2014
14890
27
41
32
25
16
411
924
10949
7
14
14
18
13
347
1186
22428
6
12
19
37
1
31
236
5372
0
1
4
9
99-00 – Read
SLEPD
SLEP
SD
All students
206
2942
6250
60261
161
1639
3074
10733
78
56
49
18
31
864
1380
12430
15
29
22
21
10
250
673
10211
5
8
11
17
4
170
902
19942
2
6
14
33
0
19
221
6945
0
1
4
11
00-01 – Mathematics
SLEPD
SLEP
SD
All students
239
3467
6177
59695
151
892
1757
5704
6326
28
10
54
1382
2051
14903
2340
33
25
11
398
709
7668
5
12
12
13
21
675
1318
23295
9
20
21
39
2
120
342
8125
1
4
6
14
00-01 – Read
SLEPD
SLEP
SD
All students
225
3460
5984
59652
174
1535
2742
9535
77
44
46
16
33
957
1151
10084
15
28
19
17
7
514
775
10814
3
15
13
18
9
392
950
19592
4
11
16
33
2
62
366
9627
1
2
6
16 Key: SLEPD = Students with
limited English proficiency with disabilities; SLEP = Students with limited
English proficiency without disabilities; SD = Students with disabilities
without limited English proficiency. Table E. 1999-2000 MCA
Mathematics for Grade 3, Performance Levels by Language
Number Tested
Level I
Level II
a
Level II
B
Level III
Level IV
#
%
#
%
#
%
#
%
#
%
Hmong
86
53
62
21
24
7
8
3
4
1
1
Spanish
79
49
62
19
23
7
8
3
4
1
1
Somali
8
4
50
4
50
0
0
0
0
0
0
All1
Hmong
1709
541
32
710
41
214
12
222
13
22
1
Spanish
1074
374
35
406
38
163
15
118
11
13
1
Somali
141
59
42
61
43
11
8
10
7
0
0 SLEPD = Students with limited
English proficiency with disabilities.
Number Tested
Level I
Level II
a
Level II
B
Level III
Level IV
#
%
#
%
#
%
#
%
#
%
SLEPD
Hmong
81
65
80
12
15
3
4
1
1
0
0
Spanish
78
63
81
9
11
4
5
2
3
0
0
Somali
7
7
100
0
0
0
0
0
0
0
0
All1
Hmong
1722
1020
59
502
29
121
7
74
4
5
0
Spanish
1076
529
49
314
29
109
10
104
10
20
2
Somali
145
88
61
33
23
11
8
11
8
2
1 SLEPD = Students with limited
English proficiency with disabilities.
Number Tested
Level I
Level II
a
Level II
B
Level III
Level IV
#
%
#
%
#
%
#
%
#
%
SLEPD
Hmong
88
51
58
23
26
4
4
10
11
0
0
Spanish
102
72
71
20
20
6
6
4
4
0
0
Somali
7
5
71
1
14
1
14
0
0
0
0
All1
Hmong
1732
414
24
673
39
220
13
363
21
62
3
Spanish
1383
427
31
575
42
137
10
207
15
37
3
Somali
177
90
51
56
32
11
6
19
11
1
1 SLEPD = Students with limited
English proficiency with disabilities. Table H. 2000-2001 MCA
Reading for Grade 3, Performance Levels by Language
Number Tested
Level I
Level II
a
Level II
B
Level III
Level IV
#
%
#
%
#
%
#
%
#
%
SLEPD
Hmong
85
65
76
13
15
3
4
3
4
1
1
Spanish
92
72
78
15
16
2
2
3
4
0
0
Somali
7
7
100
0
0
0
0
0
0
0
0
All1
Hmong
1733
806
46
492
28
252
14
160
9
23
1
Spanish
1355
623
46
353
26
189
14
154
11
36
3
Somali
174
109
63
31
18
21
12
12
7
1
1 SLEPD = Students with limited
English proficiency with disabilities. Table I. 1999-2000 and
2000-2001 Grade 3 MCA Performance for Students with Disabilities and Limited
English Proficiency
Grade 3
Disability Group
Tested in Math
Percent On Track Mathematics
Tested in Reading
Percent On Track
Reading
N On Track
%
N On Track
%
1999-2000
SLEPD
Speech/Language Impaired
76
9
12
73
3
4
Deaf-Hard of Hearing
16
1
6
17
0
0
Specific Learning Disabilities
82
2
2
81
0
0
2000-2001
SLEPD
Speech/Language Impaired
95
22
23
94
16
23
Deaf-Hard of Hearing
17
1
1
14
0
0
Specific Learning Disabilities
82
5
1
74
0
0 SLEPD = Students with limited
English proficiency with disabilities.
Grade 5
Number Enrolled*
No. Tested
Mathematics
Percent Tested
Mathematics
No. Tested Reading
Percent Tested
Reading
1999-2000
SLEPD
SLEP
SD
all students
316
2735
9152
65696
267
2500
7796
61675
85
91
85
94
259
2510
7779
62202
82
92
85
95
2000-2001
SLEPD
SLEP
SD
all students
413
3439
9002
66560
352
3185
7729
62687
85
93
86
94
350
3196
7710
63126
85
93
86
95 Key: SLEPD = Students with
limited English proficiency with disabilities; SLEP = Students with limited
English proficiency without disabilities; SD = Students with disabilities
without limited English proficiency. Table K. 1999-2000 and
2000-2001 Participation by Language, Grade 5
Number Enrolled
No. Tested Mathematics
Percent Tested
Mathematics
No. Tested Reading
Percent Tested Reading
1999-2000
SLEPD
Hmong
148
121
82
116
78
Spanish
102
82
80
79
77
Somali
6
5
83
6
100
1999-2000
All1
Hmong
1786
1695
95
1695
95
Spanish
1071
953
89
953
89
Somali
219
165
75
165
75
2000-2001
SLEPD
Hmong
181
158
87
156
86
Spanish
138
115
83
116
84
Somali
13
8
61
9
69
2000-2001
All1
Hmong
1857
1807
97
1807
97
Spanish
1421
1234
87
1251
88
Somali
286
226
79
234
82 SLEPD = Students with limited
English proficiency with disabilities.
Grade 5
Disability Group
Enrolled
Tested in Mathematics
N
Percent
N
Percent
1999-2000
SLEPD
Speech/Language Impaired
52
51
98
51
98
Deaf-Hard of Hearing
32
26
81
17
80
Specific Learning Disabilities
178
157
88
81
86
2000-
2001
SLEPD
Speech/Language Impaired
92
84
91
87
95
Deaf-Hard of Hearing
25
17
68
16
64
Specific Learning Disabilities
223
202
91
199
89 SLEPD = Students with limited
English proficiency with disabilities.
Number Tested
Level I
Level II a
Level II b
Level III
Level IV
#
%
#
%
#
%
#
%
#
%
99-00– Mathematics
SLEPD
SLEP
SD
All students
267
2500
7796
61675
197
1024
3036
8338
74
41
39
14
56
948
2377
15302
21
38
31
25
9
269
846
9916
3
31
11
16
4
235
1237
20510
2
9
16
33
1
24
300
7609
0
1
4
12
99-00–Read
SLEPD
SLEP
SD
All students
259
2510
7779
62202
216
1288
3513
9015
83
51
45
15
31
790
1817
11602
12
32
23
19
6
240
816
9383
2
10
11
15
4
173
1278
22292
2
7
16
36
2
19
355
9910
1
1
5
16
00-01–Mathematics
SLEPD
SLEP
SD
All students
352
7729
3185
62687
228
2667
1021
7003
65
35
32
11
89
2295
1196
13485
25
30
38
22
25
1011
462
10504
7
13
15
17
10
1415
448
23452
3
18
14
37
0
341
58
8243
0
4
2
13
00-01
–Read
SLEPD
SLEP
SD
All students
350
7710
3196
63126
260
2911
1264
7036
74
38
39
11
56
1774
1006
9550
16
23
31
15
18
731
357
6867
5
9
11
11
14
1689
492
24474
4
22
15
39
2
605
77
15199
6
8
2
24 Key: SLEPD = Students with
limited English proficiency with disabilities; SLEP = Students with limited
English proficiency without disabilities; SD = Students with disabilities
without limited English proficiency. Table N. 1999-2000 MCA
Mathematics for Grade 5, Performance Levels by Language
Number Tested
Level I
Level II
a
Level II
B
Level III
Level IV
#
%
#
%
#
%
#
%
#
%
SLEPD
Hmong
121
96
79
20
17
4
3
1
1
0
0
Spanish
82
59
72
22
27
1
1
0
0
0
0
Somali
5
5
100
0
0
0
0
0
0
0
0
All1
Hmong
1695
621
37
640
38
193
11
220
13
21
1
Spanish
953
396
42
370
39
90
9
84
9
13
1
Somali
165
117
71
34
21
12
7
2
1
0
0 SLEPD = Students with limited
English proficiency with disabilities.
Number Tested
Level I
Level II
a
Level II
B
Level III
Level IV
#
%
#
%
#
%
#
%
#
%
SLEPD
Hmong
116
106
91
8
7
2
2
0
0
0
0
Spanish
79
63
80
11
14
3
4
2
2
0
0
Somali
6
5
100
0
0
0
0
0
0
0
0
All1
Hmong
1702
862
51
517
30
182
11
130
8
11
1
Spanish
947
422
45
274
29
119
13
111
12
21
2
Somali
170
98
58
49
29
14
8
8
5
1
1 SLEPD = Students with limited
English proficiency with disabilities. Table P. 2000-2001 MCA
Mathematics for Grade 5, Performance Levels by Language
Number Tested
Level I
Level II
a
Level II
B
Level III
Level IV
#
%
#
%
#
%
#
%
#
%
SLEPD
Hmong
158
106
67
43
27
5
3
4
3
0
0
Spanish
115
72
63
28
24
9
8
6
5
0
0
Somali
8
6
75
2
25
0
0
0
0
0
0
All1
Hmong
1807
542
30
693
38
277
15
271
15
24
1
Spanish
1234
444
36
450
37
167
14
154
13
19
1
Somali
226
122
54
77
34
11
5
15
7
1
0 SLEPD = Students with limited
English proficiency with disabilities.
Number Tested
Level I
Level II
a
Level II
B
Level III
Level IV
#
%
#
%
#
%
#
%
#
%
SLEPD
Hmong
156
124
79
22
14
6
4
4
3
0
0
Spanish
116
83
72
19
16
7
6
5
4
2
2
Somali
9
6
67
3
33
0
0
0
0
0
0
All1
Hmong
1807
747
41
609
34
183
10
240
13
28
1
Spanish
1251
514
41
334
27
124
10
233
19
46
4
Somali
234
118
50
64
27
22
9
26
11
4
2
SLEPD = Students with limited English proficiency with disabilities.
Grade 5
Disability Group
Tested in Math
Percent On Track Mathematics
Tested in Reading
Percent On Track
Reading
N On Track
Percent
N On track
Percent
1999-2000
SLEPD
Speech/Language Impaired
51
3
6
73
3
6
Specific Learning Disabilities
157
1
1
81
1
1
Deaf-Hard of Hearing
26
1
4
17
2
8
2000-2001
SLEPD
Speech/Language Impaired
84
21
25
87
22
26
Specific Learning Disabilities
202
8
4
199
6
3
Deaf-Hard of Hearing
17
2
12
16
3
18 SLEPD = Students with limited
English proficiency with disabilities.
Participation, Grade 5


Performance, Grade 5


Figure 28 presents
the reading
performance for this
same group of
students. Most of
these students
(88-100%) were also
below Level IIB. As
for mathematics, the
only gain observed
across years was for
the Spanish group
achieving Levels IIB
and above in reading
(approximately 6%
more). The numbers
of Somali students
tested each year
were quite small, so
the performance
percentages are not
able to be shown.
(See Tables O and Q
in the Appendix for
the data for All
students in these
language groups as
well as the data
used to create
Figure 28.)
Figures 29 and 30
show the performance
of limited English
proficient students
with disabilities by
the top three
disability
categories according
to the number tested
for years 1999-2000
and 2000-2001.
Slight increases are
seen across years
for students with
learning
disabilities and
deaf and hard of
hearing students for
both content areas.
Larger increases
were evident for
students with Speech
and Language
Impairments. (See
Table R in the
Appendix for the
numbers used to
create these
figures.)


Summary
Grade 3 Participation and
Performance, 2000-2001
Grade 5 Participation
and Performance, 2000-2001
Comparison Across Years
Discussion
References
Appendix
1All
students in this table includes the population of all Hmong, Spanish, and Somali
speaking students regardless of language proficiency.
Table C. 1999-2000 and 2000-2001 Grade 3 MCA
Participation for Students with Disabilities and Limited English Proficiency
Table D. Percent of Grade 3 Students in Each
Performance Level in 1999-2000 and 2000-2001
SLEPD
1All students in this table includes the population of all Hmong,
Spanish, and Somali speaking students regardless of language proficiency.
* Indicates fewer than 10 students tested.
Table F. 1999-2000 MCA Reading for Grade 3,
Performance Levels by Language
1All students in this table includes the population of all Hmong,
Spanish, and Somali speaking students regardless of language proficiency.
* Indicates fewer than 10 students tested.
Table G. 2000-2001 MCA Mathematics for Grade 3,
Performance Levels by Language
1All students in this table includes the population of all Hmong,
Spanish, and Somali speaking students regardless of language proficiency.
* Indicates fewer than 10 students tested.
1All students in this table includes the population of all Hmong,
Spanish, and Somali speaking students regardless of language proficiency.
* Indicates fewer than 10 students tested.
Table J. Grade 5 Participation Across Groups for
Years: 1999-2000 and 2000-2001
1All students in this table includes the population of all Hmong,
Spanish, and Somali speaking students regardless of language proficiency.
Table L. 1999-2000 and 2000-2001 Grade 5 MCA
Mathematics Participation for Students with Disabilities and Limited English
Proficiency
Tested in Reading
Table M. Percent of Grade 5 Students in Each
Performance Level in 1999-2000 and 2000-2001
1All students in this table includes the population of all Hmong,
Spanish, and Somali speaking students regardless of language proficiency.
* Indicates fewer than 10 students tested.
Table O. 1999-2000 MCA Reading for Grade 5,
Performance Levels by Language
1All students in this table includes the population of all Hmong,
Spanish, and Somali speaking students regardless of language proficiency.
* Indicates fewer than 10 students tested.
1All students in this table includes the population of all Hmong,
Spanish, and Somali speaking students regardless of language proficiency.
* Indicates fewer than 10 students tested.
Table Q. 2000-2001 MCA Reading for Grade 5,
Performance Levels by Language
1All students in this table includes the population of all Hmong,
Spanish, and Somali speaking students regardless of language proficiency.
* Indicates fewer than 10 students tested.
Table R. 1999-2000 and 2000-2001 Grade 5 MCA
Mathematics Performance for Students with Disabilities and Limited English
Proficiency