Prepared by:
Deb Albus • Martha Thurlow • Manuel Barrera • Kamil Guven • Vitaliy Shyyan
June 2004
Any or all portions of this document may be reproduced and distributed without prior permission, provided the source is cited as:
Albus, D., Thurlow, M., Barrera, M., Guven, K. & Shyyan, V. (2004). 1999-2000 Participation and performance of English language learners with disabilities on Minnesota standards-based assessments (ELLs with Disabilities Report 1). Minneapolis, MN: University of Minnesota, National Center on Educational Outcomes. Retrieved [today's date], from the World Wide Web: http://education.umn.edu/NCEO/OnlinePubs/ELLsDisReport1.html
The No Child Left Behind Act of 2001 has put a spotlight on student groups that previously had not been accounted for in most assessment systems nationwide. This report, focusing on the performance of English language learners (ELLs) with disabilities on Minnesota’s Comprehensive Assessments (MCAs), is part of a larger research project funded by the Office of Special Education Programs (OSEP) designed to focus attention on ELLs with disabilities in both instruction and assessment.
The MCAs are statewide high standards tests in mathematics and reading administered to students in grades 3 and 5. These tests have a primary and secondary purpose. First, they are used for district accountability. Second, they also provide valuable curriculum and instruction information about whether students are on track for mathematics and reading in the higher grades leading to graduation. Because diploma eligibility depends on students successfully meeting the academic standards in these higher grade levels, being able to track progress toward those standards is very important. Thus, preparatory content standards have been developed from kindergarten through grade 8.
The state has used a four level system to track student progress in these skills. The four levels are presented in Table 1. Performing at Levels I and II, described as limited or partial knowledge of skills, is generally considered below proficient. Performing at Levels III and IV is generally considered proficient or above. In practical terms based on previous documentation (Liu & Thurlow, 2000), a student who performs at level III or above is considered on track to reaching the higher academic standards in the upper grade levels.
Table 1. MCA Performance Levels
Level IV |
Students at this level demonstrate evidence of advanced academic performance, knowledge, and skills that exceed the level necessary for satisfactory work in the high standards in the elementary grades. |
|
Level III |
Students at this level demonstrate evidence of solid academic performance and competence in the knowledge and skills necessary for satisfactory work in the high standards in the elementary grades. |
|
Level II |
|
|
Level I |
Students at this level demonstrate evidence of limited knowledge and skills necessary for satisfactory work in the high standards in the elementary grades. |
The purpose of this study was to examine the participation and performance of English language learners with disabilities on the 1999-2000 Minnesota Comprehensive Assessments. For the rest of this report we refer to these students by the term students with limited English proficiency (LEP) who also have disabilities (SLEPD)1. We wanted to do this as a function of language group (Hmong, Somali, and Spanish) and as a function of disability category (the 12 Minnesota categories not including 504 status) in order to better understand whether there might be specific implications of test performance for the instruction of students within these subgroups.
1Students
with limited English proficiency are increasingly referred to as English
language learners or ELLs. We recognize that a number of terms are used in the
field related to learners of English as a new or second language. We have
adopted some of those terms for reference, but have chosen to use language and
acronyms compliant with “person first” protocol and to minimize lengthy terms
where possible. In this document we use the term "students with limited English
proficiency."
The Minnesota Automated Recording Student System (MARSS) is Minnesota’s data management system. Data for this report were provided by the former Minnesota Department of Children, Families, and Learning (CFL), now the Minnesota Department of Education, using this system. Data were analyzed using SPSS after the file was organized and unusable data were excluded. The data file we received from the state was organized in the four level system, even though the state had already begun to convert to a five level system of reporting the data, splitting Level II into IIA and IIB. Due to the changes being made to cut score ranges, we chose to continue using the four level system with the data as presented in the database. Therefore, there may be some variability in our data analysis results compared to reports published elsewhere.
During the process of data analysis, it was found that the total numbers of students marked as tested did not always match the number of students with performance recorded. This anomaly was found due to some students in the 1999-2000 database being given a scale score despite being marked as not taking the test. For example, in the mathematics data for 3rd grade there were 170 students who were marked as a blank or as not taking the test who were also given a scale score. This number for 5th grade mathematics was 118. Likewise, for 3rd grade reading data there were 202 students who were marked as not taking the reading test but who had been given an achievement level, and in 5th grade reading this number was 178. These data records were excluded from the data analysis.
There are several cautions advised to readers of this report. These cautions relate to: reporting by grade, reporting by primary disability, and reporting by language group.
First there are differences in how children are counted. For example, federal requirements base special education counts on age rather than grade level. Counts here may be different from those reported elsewhere for the number of students in a grade for testing. Student mobility is another factor influencing counts in that students present when yearly counts are calculated may not be present at the actual time of testing.
Although counting children by primary disability helps remove double counting errors, information about multiple disabilities is then lost. However, this other information may have an influence on participation and performance for some students. For example, a student’s primary disability for counting purposes may be a sensory impairment, but the student may also have a learning disability for which certain accommodations such as larger print may not be of help. We were not able to control for these types of issues within the scope of this report.
Another form of complexity is the classification of students by language group. Only main language categories are reported, so it was not possible to account for other minority languages or dialects/variants of the reported language groups. Additionally, students’ level of fluency in their native languages was not available in the data provided. These factors may be crucial to interpreting the data, but we were not able to address this within our current analysis or discussion.
Data are reported and analyzed in several ways, including by students with LEP status (SLEP), students with disability status (SD), and the two combined (SLEPD). In certain cases we include information on "all" students, but this is defined in different ways within the data tables.
Where data are reported by All relative to language groups (i.e., Hmong, Spanish, and Somali), it means that all students with those home language codes were included, regardless of limited English proficiency status. Only primary language categories are reported even though there may be other minority languages or dialects/variants also spoken among the reported language groups. Students’ level of fluency in their native languages or knowledge of English was not available in the data provided, so none of this type of information could be analyzed.
Data presented as describing All students
with disabilities, include all students with Individualized Education Programs
(IEPs) regardless of language background. Classification for disability category
was determined by the student’s primary disability. Because information was only
available by primary disability, additional information that may help in the
interpretation of participation and performance for students with multiple
disabilities is not available.
Some special education categories are so small in number that it is impossible to report on them and still maintain the anonymity of individual students. This is especially true when the data for students with disabilities are further analyzed by limited English proficiency status because the numbers become even smaller. Due to these small numbers, we have used an asterisk to mark those performance categories with fewer than 10 students tested. If there were no students tested, these are marked with a “0.” Categories with dashes indicate that there were no students in that category.
Another consideration in interpreting data in this report is that NCLB 2001 legislation requirements were passed after the testing cycle covered in the report. The participation rate requirements were not yet set at the current 95%. Also, Minnesota allowed a 12 month exemption period from testing for new immigrant students in school year 1999-2000.
In viewing the figures and tables in this report, it is important to keep in mind that the numbers and percentages represent a broad set of factors. Only if all the factors were taken into account could we assert the complete accuracy of the test participation and performance data. Still, it is important to examine these early data on the participation and performance of students with disabilities and limited English proficiency on Minnesota’s Comprehensive Assessments because they give initial indications of how many students are participating and how they are performing.
Before looking at performance, it is first important to describe the numbers of students in each group who participated in the testing, and the number of students enrolled.
Table 2 shows that although students with disabilities had more than twice the number of students enrolled and tested than limited English proficient students, the limited English proficient students were more likely to be tested in mathematics (91%) and reading (92%) than those with disabilities (85% and 84% respectively).2 The percentages of students with limited English proficiency tested were only slightly below that for All students (94% mathematics, 95% reading). All students referred to here is the total population of third grade students.
2The No Child Left Behind Act was passed during 2001. It requires that to meet adequate yearly progress, at least 95% of students in a subgroup must participate in statewide tests. The legislation was new at the time of this study.
Table 2. 1999-2000 MCA Participation, Grade 3
|
|
|
Mathematics |
Reading |
||
|
Number Tested |
Percent Tested |
Number Tested |
Percent Tested |
||
|
Grade 3 SLEPD SLEP SD All students1 |
253 3209 7417 63498 |
213 2916 6315 59923 |
84 91 85 94 |
206 2942 6250 60261 |
81 92 84 95 |
Key: SLEPD = Students with
limited English proficiency with disabilities; SLEP = Students with limited
English proficiency without disabilities; SD = Students with disabilities
without limited English proficiency.
1All
Students in this table includes the total population of students enrolled in
grade 3 in the state.
Limited English proficient students with disabilities (SLEPD), were less likely to be tested than the total students with limited English proficiency (SLEP) group by 7-11%. Additionally, the percentages tested across content areas fell slightly below students with disabilities (SD), with 3% fewer participating in reading. This gap, more clearly shown in Figure 1, shows that students with disabilities had slightly lower rates of participation for the reading test, with even lower rates for those students with disabilities who are also limited English proficient (SLEPD).
Figure 1. 1999-2000 MCA Participation, Grade 3
Key: SLEPD = Students with limited English
proficiency with disabilities; SLEP = Students with limited English proficiency
without disabilities; SD = Students with disabilities without limited English
proficiency.
Table 3 shows the participation rates for limited English proficient students with disabilities (SLEPD) by the three largest language groups in Minnesota: Hmong, Spanish, and Somali. These data are compared to those of All students in these language groups regardless of language proficiency status. Overall, percentage rates ranged from 81% to 100% for both groups of students. The 100% participation rate in mathematics for Somali students with disabilities represents a small number (8) of students. For Hmong and Spanish students with and without disabilities, the participation rates across content areas had fairly identical percentages, except for the Hmong speaking students with disabilities, which had about 5% fewer students taking the reading test compared to mathematics.
Table 3. 1999-2000 MCA
Participation by Language, Grade 3
|
|
|
Mathematics |
Reading |
|||
|
Number Tested |
Percent Tested |
Number Tested |
Percent Tested |
|||
|
SLEPD |
Hmong |
99 |
86 |
87 |
81 |
82 |
|
Spanish |
98 |
79 |
81 |
78 |
80 |
|
|
Somali |
8 |
8 |
100 |
7 |
87 |
|
All1
|
Hmong |
1792 |
1709 |
95 |
1722 |
96 |
|
Spanish |
1259 |
1074 |
85 |
1076 |
85 |
|
|
Somali |
172 |
141 |
82 |
145 |
84 |
|
SLEPD = Students with limited
English proficiency with disabilities.
1All students in this table includes the population of all Hmong,
Spanish, and Somali speaking students regardless of language proficiency.
A comparison between All students in these three language groups, and the same students with disabilities, shows more noticeable differences. Between All Hmong and Hmong students with limited English proficiency and disabilities, there was 8% fewer tested in mathematics and 14% fewer tested in reading (see Figure 2).
Figure 2. Percentage Tested by Language Groups, Grade 3
SLEPD = Students
with limited English
proficiency with
disabilities.
1All students in this table includes the population of all Hmong,
Spanish, and Somali
speaking students
regardless of
language
proficiency.
Because the numbers enrolled and tested vary widely between All students with disabilities and students with limited English proficiency and disabilities (see Table 4), there are limitations in what can be said about students in specific disability categories. However, between All students with disabilities and those students with disabilities and limited English proficiency, the percentages were similar with a range of 90-95% percent tested in mathematics and reading for Speech/Language Impaired students and 80-90% for students with Specific Learning Disabilities. There was a slight difference in the Mild to Moderate Mental Impairment category, with 57-62% of the limited English proficient students being tested in mathematics and reading, in comparison to 50-55% of All students with disabilities. Thus, the participation rate was higher. However, there were only 21 students with disabilities and limited English proficiency in this category. Many of the other categories had smaller numbers of students, limiting the ability to make comparisons.
Table 4. 1999-2000 MCA Math
Participation by Disability, Grade 3
|
|
Disability Group |
Enrolled |
Tested in Mathematics |
Tested in Reading |
|||
|
Number |
Percent |
Number |
Percent |
||||
|
SLEPD |
Speech/Language Impaired |
81 |
76 |
94 |
73 |
90 |
|
|
Mentally Impaired: Mild-Moderate |
21 |
13 |
62 |
12 |
57 |
||
|
Mentally Impaired: Moderate-Severe |
1 |
1 |
100 |
1 |
100 |
||
|
Physically Impaired |
7 |
4 |
57 |
4 |
57 |
||
|
Deaf-Hard of Hearing |
19 |
16 |
84 |
17 |
89 |
||
|
Visually Impaired |
2 |
2 |
100 |
2 |
100 |
||
|
Specific Learning Disabilities |
94 |
82 |
87 |
81 |
86 |
||
|
Emotional/Behavioral Disorders |
14 |
10 |
71 |
8 |
57 |
||
|
Deaf-Blindness |
0 |
- |
- |
- |
- |
||
|
Other Health Impaired |
11 |
9 |
82 |
8 |
73 |
||
|
Autistic |
3 |
0 |
0 |
0 |
0 |
||
|
Traumatic Brain Injury |
0 |
- |
- |
- |
- |
||
|
|
|
|
|
|
|||
|
All SD |
|
|
Number |
Percent |
Number |
Percent |
|
|
Speech Language Impaired |
2448 |
2340 |
95 |
2337 |
95 |
||
|
Mentally Impaired: Mild-Moderate |
494 |
271 |
55 |
246 |
50 |
||
|
Mentally Impaired: Moderate-Severe |
164 |
14 |
58 |
12 |
7 |
||
|
Physically Impaired |
147 |
107 |
73 |
108 |
73 |
||
|
Deaf-Hard of Hearing |
130 |
113 |
87 |
113 |
87 |
||
|
Visually Impaired |
29 |
24 |
83 |
25 |
86 |
||
|
Specific Learning Disabilities |
2538 |
2255 |
89 |
2224 |
88 |
||
|
Emotional/Behavioral Disorders |
930 |
818 |
88 |
807 |
87 |
||
|
Deaf-Blindness |
1 |
1 |
100 |
1 |
100 |
||
|
Other Health Impaired |
550 |
457 |
83 |
456 |
83 |
||
|
Autistic |
216 |
118 |
55 |
116 |
54 |
||
|
Traumatic Brain Injury |
23 |
10 |
43 |
11 |
48 |
||
SLEPD = Students with limited English proficiency with disabilities; All SD = All students with disabilities including SLEPD; 0 = No students tested; Dashes = No students were in that category.
In this section, we look at performance data in a manner similar to that used to look at participation data. We start with a broad look at performance data for students across the four primary groups, followed by comparisons of data made across language groups and by specific disability categories. We also look at student performance in relation to the four achievement levels previously described in Table 2.
As shown in Table 5, students with disabilities made up the second highest performing group. This group performed better than students with limited English proficiency, with a higher percentage of students attaining Levels III and IV. The limited English proficient students with disabilities did less well as shown in Figure 3.
Table 5. 1999-2000 MCA Performance Levels, Grade 3
|
|
Number Tested |
Level I |
Level II |
Level III |
Level IV |
||||
|
No. |
No. |
Percent |
No. |
Percent |
No. |
Percent |
|||
|
Grade 3 Mathematics SLEPD SLEP SD All students1 |
213 2916 6315 59923 |
125 933 1955 6284 |
59 32 31 11 |
74 1605 2938 25839 |
35 55 47 43 |
13 347 1186 22428 |
6 12 19 37 |
1 31 236 5372 |
1 1 4 9 |
|
Grade 3 Reading SLEPD SLEP SD All students1 |
206 2942 6250 60261 |
161 1639 3074 10733 |
78 56 49 18 |
41 1114 2053 22641 |
20 38 33 38 |
4 170 902 19942 |
2 6 14 33 |
19 221 6945 |
0 1 4 12 |
Key: SLEPD =
Students with limited English proficiency with disabilities; SLEP = Students
with limited English proficiency without disabilities; SD = Students with
disabilities without limited English proficiency.
1All students in this table includes the total population of students
enrolled in grade 3 in the state.
Figure 3 illustrates that limited English proficient students with disabilities were most likely to score at Levels I and II. Students identified as either limited English proficient or with disabilities fared only slightly better. This pattern was apparent both in the mathematics and reading scores. The combined scores of all students showed that scores were split between those performing at Levels I and II at 55% and those performing at Levels III and IV at 45%. The students with limited English proficiency and disabilities demonstrated the lowest scores by far with most performing at Levels I and II. Ninety-eight percent of these students performed at Levels I and II in reading and 94% at these same levels in mathematics.
Figure 3. 1999-2000 MCA Performance Across Groups, Grade 3
Key: SLEPD = Students with limited English
proficiency with disabilities; SLEP = Students with limited English proficiency
without disabilities; SD = Students with disabilities without limited English
proficiency.
Tables 6 and 7 show performance by language groups overall and for those with disabilities. As is evident in these tables, the performance data by language group for students with limited English proficiency and disabilities continued to show heavy pooling of students in the lowest two levels for both math and reading. Still a higher percentage (81%) of students was concentrated in Level I for reading compared to math, which has performance spread out more evenly across Levels I (62%) and II (33%). The Somali speaking group had fewer than 10 students, so the performance data are marked with an asterisk indicating the need to protect the confidentiality of those students. Only 5-6% of the students with limited English proficiency and disabilities attained Levels III or IV for mathematics, and for reading 1-3% did so.
Table 6. 1999-2000 Mathematics Performance Levels by Language Group, Grade 3
|
Number Tested |
Level I |
Level II |
Level III |
Level IV |
||||||
|
No. |
Percent |
No. |
Percent |
No. |
Percent |
No. |
Percent |
|||
|
SLEPD |
Hmong |
86 |
53 |
62 |
28 |
33 |
5 |
6 |
0 |
0 |
|
Spanish |
79 |
49 |
62 |
26 |
33 |
3 |
4 |
1 |
1 |
|
|
Somali |
8 |
* |
* |
* |
* |
* |
* |
* |
* |
|
|
All1 |
Hmong |
1709 |
541 |
32 |
924 |
54 |
222 |
13 |
22 |
1 |
|
Spanish |
1074 |
374 |
35 |
569 |
53 |
118 |
11 |
13 |
1 |
|
|
Somali |
141 |
59 |
42 |
72 |
51 |
10 |
7 |
0 |
0 |
|
SLEPD = Students with limited
English proficiency with disabilities.
1All students in this table includes the population of Hmong,
Spanish, and Somali speaking students, regardless of language proficiency.
* Indicates fewer than 10 students tested.
Table 7. 1999-2000 Reading Performance Levels by Language Group, Grade 3
|
Number Tested |
Level I |
Level II |
Level III |
Level IV |
||||||
|
No. |
Percent |
No. |
Percent |
No. |
Percent |
No. |
Percent |
|||
|
SLEPD |
Hmong |
81 |
65 |
80 |
15 |
19 |
1 |
1 |
0 |
0 |
|
Spanish |
78 |
63 |
81 |
13 |
17 |
2 |
3 |
0 |
0 |
|
|
Somali |
7 |
* |
* |
* |
* |
* |
* |
* |
* |
|
|
All1 |
Hmong |
1722 |
1020 |
59 |
623 |
36 |
74 |
4 |
5 |
0 |
|
Spanish |
1076 |
529 |
49 |
423 |
39 |
104 |
10 |
20 |
2 |
|
|
Somali |
145 |
88 |
61 |
44 |
30 |
11 |
8 |
2 |
1 |
|
1All students in this
table includes the population of Hmong, Spanish, and Somali speaking students,
regardless of language proficiency.
* Indicates fewer than 10 students tested.
In comparison, the All group for the three language groups showed a similar weighting of students in Levels I and II, though with more spread into Levels III and IV. There was a range of 7–14 % attaining Levels III and IV in mathematics, and from 1-4% attaining Level IV for reading. Looking at Level I percentages across languages, it appears that reading was the more difficult skill area.
Table 8 summarizes the performance of students by disability group with and without limited English proficient status. All groups performed less well in reading than in mathematics. However, the number of limited English proficient students with disabilities showed a very small percentage (4%) as being on track for reading, and that was only in the Speech/Language Impaired category. Within the group of students with both limited English and disabilities, there were a few more categories with percentages of students on track for mathematics: 12% of Speech/Language, 6% of Deaf-Hard of Hearing, 2% of students with Specific Learning Disabilities, and 2% with Emotional/Behavioral Disorders.
Table 8. 1999-2000 MCA
Performance by Disability, Grade 3
|
|
Disability Group |
|
|
||||
|
No. Tested |
No. On Track |
Percent On Track |
No. Tested |
No. On Track |
Percent On Track |
||
|
SLEPD |
Speech/Language Impaired |
76 |
9 |
12 |
73 |
3 |
4 |
|
Mentally Impaired: Mild-Moderate |
13 |
0 |
0 |
12 |
0 |
0 |
|
|
Mentally Impaired: Moderate-Severe |
1 |
* |
* |
1 |
* |
* |
|
|
Physically Impaired |
4 |
* |
* |
4 |
* |
* |
|
|
Deaf-Hard of Hearing |
16 |
1 |
6 |
17 |
0 |
0 |
|
|
Visually Impaired |
2 |
* |
* |
2 |
* |
* |
|
|
Specific Learning Disabilities |
82 |
2 |
2 |
81 |
0 |
0 |
|
|
Emotional/Behavioral Disorders |
10 |
2 |
2 |
8 |
* |
* |
|
|
Deaf-Blindness |
- |
- |
- |
- |
- |
- |
|
|
Other Health Impaired |
9 |
* |
* |
8 |
* |
* |
|
|
Autistic |
0 |
0 |
0 |
0 |
0 |
0 |
|
|
Traumatic Brain Injury |
- |
- |
- |
- |
- |
- |
|
|
|
Disability Group |
Mathematics |
Reading |
||||
|
All SD |
|
No. Tested |
No. on Track |
Percent on track |
No. Tested |
No. on Track |
Percent on Track |
|
Speech language Impaired |
2340 |
1344 |
54 |
2337 |
1317 |
53 |
|
|
Mentally Impaired: Mild-Moderate |
271 |
0 |
0 |
246 |
1 |
0 |
|
|
Mentally Impaired: Moderate-Severe |
14 |
1 |
2 |
12 |
0 |
0 |
|
|
Physically Impaired |
107 |
14 |
13 |
108 |
16 |
15 |
|
|
Deaf-Hard of Hearing |
113 |
28 |
25 |
113 |
18 |
16 |
|
|
Visually Impaired |
24 |
4 |
17 |
25 |
6 |
24 |
|
|
Specific Learning Disabilities |
2255 |
244 |
11 |
2224 |
117 |
52 |
|
|
Emotional/Behavioral Disorders |
818 |
147 |
18 |
807 |
131 |
16 |
|
|
Deaf-Blindness |
1 |
* |
* |
1 |
* |
* |
|
|
Other Health Impaired |
457 |
70 |
15 |
456 |
52 |
11 |
|
|
Autistic |
118 |
23 |
19 |
116 |
15 |
0 |
|
|
Traumatic Brain Injury |
10 |
2 |
20 |
11 |
0 |
0 |
|
SLEPD = Students with limited English proficiency with disabilities; All SD = All students in this table includes all students with disabilities including SLEPD; 0 = No students tested; Dashes = No students were in that category; * Indicates fewer than 10 students tested.
For grade 5 MCA participation, shown in Table 9, students with limited English proficiency (SLEP) had the highest percentage tested after the total population of students with 91% tested in mathematics and 92% tested in reading. Students with disabilities (SD) had slightly lower rates of participation, with 85% tested in mathematics and reading. Limited English proficient students with disabilities (SLEPD) had the same percentage tested as students with disabilities in mathematics (85%), but slightly less (82%) in reading.
Table 9. 1999-2000 MCA Participation, Grade 5
|
|
Number Enrolled |
Mathematics |
Reading |
||
|
No. Tested |
Percent Tested |
No. Tested |
Percent Tested |
||
|
Grade 5 SLEPD SLEP SD All students1 |
316 2735 9152 65696 |
267 2500 7796 61675 |
85 91 85 94 |
259 2510 7779 62202 |
82 92 85 95 |
Key: SLEPD = Students with limited
English proficiency with disabilities; SLEP = Students with limited English
proficiency without disabilities; SD = Students with disabilities without
limited English proficiency.
1All students in this table includes the total population of students
enrolled in grade 5 in the state.
Overall, the participation rates across groups for
grade 5 showed little difference across content areas for each group. As shown
in Figure 4, a slightly smaller percentage of limited English proficient
students with disabilities were tested in reading compared to mathematics.
Figure 4. 1999-2000 MCA Participation Across Groups, Grade 5
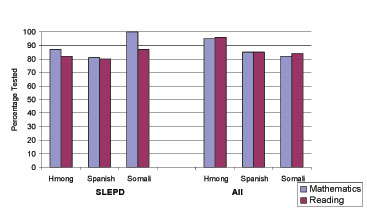
Table 10 shows MCA participation by language group. In the “All students” for each language group, roughly equal percentages were tested in mathematics and reading across language groups, though 3% more Somali speakers were tested in reading than mathematics. For students with limited English proficiency and disabilities (SLEPD), 3-4% more were tested in mathematics than reading for Hmong and Spanish speaking students. Due to the smaller number enrolled and tested for Somali speakers, differences in percentages were not particularly meaningful because they represented only one student.
Table 10. 1999-2000 MCA Participation by Language, Grade 5
|
|
|
Mathematics |
Reading |
|||
|
|
Percent Tested |
No. Tested |
Percent Tested |
|||
|
SLEPD |
Hmong |
148 |
121 |
82 |
116 |
78 |
|
Spanish |
102 |
82 |
80 |
79 |
77 |
|
|
Somali |
6 |
5 |
83 |
6 |
100 |
|
All1 |
Hmong |
1786 |
1695 |
95 |
1702 |
95 |
|
Spanish |
1071 |
953 |
89 |
947 |
88 |
|
|
Somali |
219 |
165 |
75 |
170 |
78 |
|
SLEPD = Students with limited
English proficiency with disabilities.
1The term All in this table refers to the combined population of
Hmong, Spanish and Somali speaking students, regardless of language proficiency.
Figure 5 shows that percentages of students tested in mathematics and reading
were roughly equal across language groups, with a slightly higher percentage
participating in mathematics across Hmong and Spanish groups. Recall that these
percentages are based on small numbers of students, so some caution is needed.
Although the participation numbers were small for limited English proficient
students with disabilities when given by disability category, participation
information was helpful for both interpreting performance and for comparison
with the total group of students with disabilities.
Figure 5. 1999-2000 MCA Participation by Language Group, Grade 5
SLEPD = Students with limited English proficiency
with disabilities.
*The term All in this figure refers to the combined population of Hmong,
Spanish, and Somali speaking students, regardless of language proficiency.
Comparing the two groups in Table 11, we see that percentages tested in mathematics and reading were comparable across groups, with a similar percentage of students in both the "All" and limited English proficient student with disability groups being tested in both content areas in the following categories: Speech/Language Impaired, Mentally Impaired: Mild Moderate, Deaf-Hard of Hearing, Visually Impaired, and students with Emotional/Behavioral Disorders. However, comparing participation across groups showed that a lower percentage of limited English proficient students with disabilities were tested in both reading and mathematics in comparison to All students with disabilities. Other participation percentages for students with limited English proficiency and disabilities varied more widely due to small numbers of students.
Table 11. 1999-2000 MCA Participation by Disability, Grade 5
|
|
Disability Group |
Enrolled |
Tested in Mathematics |
Tested in Reading |
||
|
N |
Percent |
N |
Percent |
|||
|
SLEPD |
Speech/Language Impaired |
52 |
51 |
98 |
51 |
98 |
|
Mentally Impaired: Mild-Moderate |
18 |
9 |
50 |
7 |
39 |
|
|
Mentally Impaired: Moderate-Severe |
4 |
0 |
0 |
0 |
0 |
|
|
Physically Impaired |
6 |
5 |
83 |
5 |
83 |
|
|
Deaf-Hard of Hearing |
32 |
26 |
81 |
26 |
81 |
|
|
Visually Impaired |
2 |
1 |
50 |
1 |
50 |
|
|
Specific Learning Disabilities |
178 |
157 |
88 |
151 |
85 |
|
|
Emotional/Behavioral Disorders |
14 |
10 |
71 |
10 |
71 |
|
|
Deaf-Blindness |
0 |
- |
- |
- |
- |
|
|
Other Health Impaired |
8 |
7 |
88 |
7 |
87 |
|
|
Autistic |
2 |
1 |
50 |
1 |
50 |
|
|
Traumatic Brain Injury |
0 |
- |
- |
- |
- |
|
|
504 Status |
0 |
- |
- |
- |
- |
|
|
|
|
|
|
|
||
|
All SD
|
|
|
N |
Percent |
N |
Percent |
|
Speech/Language Impaired |
2107 |
2017 |
96 |
2015 |
96 |
|
|
Mentally Impaired: Mild-Moderate |
536 |
291 |
54 |
281 |
52 |
|
|
Mentally Impaired: Moderate-Severe |
144 |
8 |
6 |
7 |
5 |
|
|
Physically Impaired |
127 |
93 |
73 |
93 |
73 |
|
|
Deaf-Hard of Hearing |
163 |
144 |
88 |
144 |
88 |
|
|
Visually Impaired |
18 |
15 |
83 |
16 |
89 |
|
|
Specific Learning Disabilities |
4083 |
3585 |
88 |
3561 |
87 |
|
|
Emotional/Behavioral Disorders |
1417 |
1203 |
85 |
1213 |
86 |
|
|
Deaf-Blindness |
4 |
3 |
75 |
2 |
50 |
|
|
Other Health Impaired |
680 |
578 |
85 |
584 |
86 |
|
|
Autistic |
164 |
109 |
67 |
106 |
65 |
|
|
Traumatic Brain Injury |
25 |
17 |
68 |
16 |
64 |
|
|
504 Status |
109 |
98 |
90 |
102 |
94 |
|
SLEPD = Students with limited
English proficiency with disabilities.
All SD = All students with disabilities including SLEPD; 0 = No students tested;
Dashes = No students were in that category; * Indicates fewer than 10 students
tested.
Looking across groups for a general picture
of how each group performed for mathematics and reading, we see some similar
patterns to what we observed in the data for grade 3. In Table 12, for
mathematics, the highest percentage of students was in Level II, except for
students with limited English proficiency and disabilities. For this group, the
majority of students (74%) were in Level I. After All students, the groups with
the most students in Levels III and IV were students with disabilities (20%)
followed by limited English proficient students (10%). Only 2% of limited
English proficient students with disabilities were in these higher levels.
Table 12. 1999-2000 MCA Performance Levels, Grade 5
|
|
Number Tested |
Level I |
Level II |
Level III |
Level IV |
||||
|
No. |
Percent |
No. |
Percent |
No. |
Percent |
No. |
Percent |
||
Grade 5 MathematicsSLEPD SLEP SD All Students1 |
2500 7796 61675 |
197 1024 3036 8338 |
74 41 39 14 |
65 1217 3223 25218 |
24 49 41 41 |
4 235 1237 20510 |
2 9 16 33 |
1 24 300 7609 |
0 1 4 12 |
Grade 5 ReadingSLEPD SLEP SD All Students1 |
259 2510 7779 62202 |
216 1288 3513 9015 |
83 51 45 15 |
37 1030 2633 20985 |
14 41 34 34 |
4 173 1278 22292 |
2 7 16 36 |
2 19 355 9910 |
1 1 5 16 |
Key: SLEPD = Students with limited
English proficiency with disabilities; SLEP = Students with limited English
proficiency without disabilities; SD = Students with disabilities without
limited English proficiency.
1All students in this table includes the total population of students
enrolled in grade 5 in the state.
For reading, performance is similar to grade 3 data, with the highest percentage of each group except for All students performing at Level I. Again too, the limited English proficient students with disabilities had the highest percentage in Level I (83%), which is 9% higher than this group at Level I for mathematics (74%). Only 3% attained Levels III and IV in reading compared to 8% of students with limited English proficiency, 21% of students with disabilities, and 52% of All students. Clearly, students with both limited English proficiency and disabilities as a group are in the most need of help to reach these higher levels of performance in mathematics and reading. A graphical representation of these data is provided in Figure 6.
Figure 6. 1999-2000 MCA Performance Across
Groups, Grade 5
Key: SLEPD = Students with limited English
proficiency with disabilities; SLEP = Students with limited English proficiency
without disabilities; SD = Students with disabilities without limited English
proficiency.
Tables 13 and 14 present the mathematics and reading performance of limited English proficient students with disabilities compared to all students within those language groups regardless of language proficiency status. As in grade 3, there was a smaller number of Somali students identified as having disabilities. Because their number was below 10, their performance is marked with asterisks to indicate the need to protect the privacy of the students who took the tests.
Table 13. 1999-2000 MCA Math Performance Levels by Language, Grade 5
|
Number Tested |
Level I |
Level II |
Level III |
Level IV |
||||||
|
No. |
Percent |
No. |
Percent |
No. |
Percent |
No. |
Percent |
|||
|
SLEPD |
Hmong |
121 |
96 |
79 |
24 |
20 |
1 |
1 |
0 |
0 |
|
Spanish |
82 |
59 |
72 |
23 |
28 |
0 |
0 |
0 |
0 |
|
|
Somali |
5 |
* |
* |
* |
* |
* |
* |
* |
* |
|
|
All1 |
Hmong |
1695 |
621 |
37 |
833 |
49 |
220 |
13 |
21 |
1 |
|
Spanish |
953 |
396 |
42 |
460 |
48 |
84 |
9 |
13 |
1 |
|
|
Somali |
165 |
117 |
71 |
46 |
28 |
2 |
1 |
0 |
0 |
|
SLEPD = Students with limited
English proficiency with disabilities.
1All students in this table
includes the population of Hmong, Spanish, and Somali speaking students
regardless of language proficiency.
* Indicates fewer than 10 students tested.
Table 14. 1999-2000 Reading Performance Levels by Language, Grade 5
|
Number Tested |
Level I |
Level II |
Level III |
Level IV |
||||||
|
No. |
Percent |
No. |
Percent |
No. |
Percent |
No. |
Percent |
|||
|
SLEPD |
Hmong |
116 |
106 |
91 |
10 |
9 |
0 |
0 |
0 |
0 |
|
Spanish |
79 |
63 |
80 |
14 |
18 |
2 |
3 |
0 |
0 |
|
|
Somali |
6 |
* |
* |
* |
* |
* |
* |
* |
* |
|
|
All1 |
Hmong |
1702 |
862 |
51 |
699 |
41 |
130 |
7 |
11 |
1 |
|
Spanish |
947 |
422 |
45 |
393 |
42 |
111 |
12 |
21 |
2 |
|
|
Somali |
170 |
98 |
58 |
63 |
37 |
8 |
5 |
1 |
1 |
|
SLEPD = Students with limited
English proficiency with disabilities.
1All students in this table includes the population of Hmong,
Spanish, and Somali speaking students regardless of language proficiency.
* Indicates fewer than 10 students tested.
In Table 13, the mathematics performance data show 72-79% of limited English proficient students with disabilities in these language groups performing in Level I, with a lower percentage (37-71%) performing at Level I for All students in these language groups. We also note that the All Somali group had a similar percentage performing in Level I for mathematics as the groups with limited English proficiency and disabilities. Only 1% of students with disabilities within these language groups attained Level III or IV, compared to 1-14% of the All group performing in these higher levels. The All Somali group had a lower percentage of students in these higher levels.
For reading, the performance data show even higher percentages in Level I (80-91%) across Hmong and Spanish for students with limited English proficiency and disabilities. Again, only 3% attained Level III or above. This is in contrast to the All groups that had only 45-50% in Level I, and between 6-14% attaining Levels III and above.
Table 15 presents the performance data of fifth grade limited English proficient students with disabilities and all fifth grade students with disabilities. As before, the “on track” category along the top of the table refers to performance at Levels III or IV, levels that had been linked by the state to being on track for achievement in reading and mathematics in later grades.
Table 15. 1999-2000 Performance
by Disability, Grade 5
|
|
Disability Group |
Math |
Reading |
||||
|
No. Tested |
No. on Track |
Percent on Track |
No. Tested |
No. on Track |
Percent on Track |
||
|
SLEPD |
Speech/Language Impaired |
51 |
3 |
6 |
51 |
3 |
6 |
|
Mentally Impaired: Mild-Moderate |
18 |
0 |
0 |
7 |
* |
* |
|
|
Mentally Impaired: Moderate-Severe |
4 |
* |
* |
0 |
0 |
0 |
|
|
Physically Impaired |
6 |
* |
* |
5 |
* |
* |
|
|
Deaf-Hard of Hearing |
32 |
1 |
4 |
26 |
2 |
8 |
|
|
Visually Impaired |
2 |
* |
* |
1 |
* |
* |
|
|
Specific Learning Disabilities |
178 |
1 |
1 |
151 |
1 |
1 |
|
|
Emotional/Behavioral Disorders |
14 |
0 |
0 |
10 |
0 |
0 |
|
|
Deaf-Blindness |
0 |
- |
- |
- |
- |
- |
|
|
Other Health Impaired |
8 |
* |
* |
7 |
* |
* |
|
|
Autistic |
2 |
* |
* |
1 |
* |
* |
|
|
Traumatic Brain Injury |
0 |
- |
- |
- |
- |
- |
|
|
504 Status |
0 |
- |
- |
- |
- |
- |
|
|
All SD
|
Disability Group |
Math |
Reading |
||||
|
No. Tested |
No. on Track |
Percent on Track |
No. Tested |
No. on Track |
Percent on Track |
||
|
Speech/Language Impaired |
2017 |
863 |
43 |
2015 |
926 |
46 |
|
|
Mentally Impaired: Mild-Moderate |
536 |
0 |
0 |
281 |
0 |
0 |
|
|
Mentally Impaired: Moderate-Severe |
144 |
0 |
0 |
7 |
* |
* |
|
|
Physically Impaired |
127 |
15 |
16 |
93 |
24 |
26 |
|
|
Deaf-Hard of Hearing |
163 |
24 |
17 |
144 |
27 |
19 |
|
|
Visually Impaired |
18 |
3 |
20 |
16 |
2 |
13 |
|
|
Specific Learning Disabilities |
4083 |
349 |
10 |
3561 |
285 |
8 |
|
|
Emotional/Behavioral Disorders |
1417 |
199 |
17 |
1213 |
264 |
22 |
|
|
Deaf-Blindness |
4 |
* |
* |
2 |
* |
* |
|
|
Other Health Impaired |
680 |
65 |
11 |
584 |
83 |
14 |
|
|
Autistic |
164 |
23 |
21 |
106 |
27 |
26 |
|
|
Traumatic Brain Injury |
25 |
1 |
6 |
16 |
1 |
6 |
|
|
504 Status |
109 |
24 |
25 |
102 |
37 |
36 |
|
SLEPD = Students with limited
English proficiency with disabilities.
All SD = All students with disabilities including SLEPD; 0 = No students tested;
Dashes = No students were in that category; * Indicates fewer than 10 students
tested.
The performance of limited English proficient students in a disability group was only recorded in Table 15 if there were 10 students or more tested. Where participation fell below 10 students, performance is marked by asterisks.
Although there were relatively high numbers of limited English proficient students with disabilities participating, only 1-6% of these students appeared on track for mathematics, and 1-8% were considered on track for reading across all groups. The three categories with at least one or more students on track were Speech/Language Impaired, Deaf-Hard of Hearing, and Specific Learning Disabilities. In contrast, all Deaf-Hard of Hearing students had 17-19% on track and students with Specific Learning Disabilities had 8-10% on track. However, there were more students (6%) on track in the group of students with limited English proficiency and disabilities in Speech/Language than in the "All" group (0%) for the same category. There does not appear to be a pattern favoring mathematics over reading in the percentages of students on track for either group.
We offer the following conclusions based on our observations of participation and performance of students in the Minnesota Comprehensive Assessments in 1999-2000:
Limited English proficient students with disabilities had only 84% tested for mathematics and 81% for reading. These percentages were 7-11% lower than the total limited English proficient group, but only 1-3% lower than students with disabilities. The participation range for limited English proficient students with disabilities was comparable to the All language group totals participating in mathematics and reading, when the 100% participation rate of the Somali students is discounted because of the small number of students on which it is based. A slight difference found among the three language groups’ data was that larger participation gaps existed between Hmong students with disabilities tested in mathematics (8%) and reading (14%) compared to the All Hmong group. Other language groups did not show this kind of difference. Looking at participation data by disability category, the percentage of limited English proficient students with disabilities tested varied widely, due to the wide range in numbers of students within the categories.
For mathematics, the highest percentage of
students across groups performed at Level II, except for the limited English
proficient students with disabilities. This group had its highest percentage of
students in Level I for both mathematics and reading, and almost all of its
students in the two lowest levels for both content areas.
Data analyzed by language group showed an important finding concerning
disability status and language background. Performance by Hmong, Spanish, and
Somali groups showed that most students, regardless of disability status,
performed at the lowest two levels in both content areas. However, limited
English proficient students with disabilities were more concentrated in Level I
in reading than in mathematics. In mathematics, there was more spread across
levels for "All" students in the three language groups as well for the students
in these language groups with disabilities.
Limited English proficient students with disabilities had the lowest participation of all groups with a range of 82-85% participation across content areas. This was comparable to the range of participation in grade 3. By language groups, the limited English proficient group and students with disabilities group had slightly more students tested in mathematics than reading. By disability group and limited English proficient status, participation was comparable, but small numbers within the categories having limited English proficiency and disabilities limit findings (see Discussion).
As for the third grade performance data, limited English proficient students with disabilities were predominantly in Level 1 for grade 5 mathematics and reading, with slightly more in Level I for reading. Very few limited English proficient students with disabilities were in the two highest levels. This is in contrast to 10% of the students with limited English proficiency and 20% of students with disabilities scoring in these levels.
Looking at data across language groups, similar percentages of limited English proficient students with disabilities were performing in Level I as in grade 3. However, the All Somali group had similar percentages in Level I for mathematics as the Somali students having both limited English proficiency and disabilities.
For mathematics and reading, fewer limited English proficient Hmong, Spanish, and Somali students with disabilities were on track compared to All students in these language groups. Overall, there were slightly more students with limited English proficiency and disabilities on track for mathematics than for reading. Looking at data by disability groups showed that very few students with limited English proficiency and disabilities were on track for mathematics or for reading. Limited English proficient students with Speech/ Language Impairments or who were Deaf or Hard of Hearing had the highest percent on track for mathematics and reading respectively. Similar to other comparisons, the percentages of limited English proficient students with disabilities on track were quite low compared to All students with disabilities. There was only one instance when Limited English proficient students with disabilities had a higher percent on track than the All students with disabilities group, and that was for limited English proficient students with Speech/Language impairments in mathematics and reading.
Participation across grades and groups showed that limited English proficient students were participating at a higher rate than students with disabilities or limited English proficient students with disabilities. However, given that NCLB 2001 legislation requirements were passed after the testing cycle for the data in this report, the 91-92% participation rates for these students were not yet held against the 95% required by the new federal legislation. Further, in school year 1999-2000, Minnesota had allowed a 12 month exemption from testing for new immigrant students. Participation for limited English proficient students with disabilities was lower in comparison, ranging 81-85%. Thought should be given to the ways in which the participation of limited English proficient students with disabilities can be increased, such as offering appropriate testing accommodations for students needing them.
When considering performance data, it is important to consider that an influx of new students enrolled may mean a higher proportion of students in Level I, depending on the English proficiency levels of these new arrivals. Likewise, students who have been in the educational system for more years may no longer have limited English proficient status by the time they reach the higher performance Levels. It should also be noted that a proportion of regular students without disabilities or limited English proficiency also perform at these lower levels.
It is clear from the performance data across grades that limited English proficient students with disabilities are having more difficulty compared to the other groups of students in demonstrating academic achievement, especially in reading. This is important because the percentage of limited English proficient students with disabilities tested in reading is fewer than in mathematics, meaning that there are more students for whom performance in reading is not known. Also, because reading and mathematics materials become progressively more academic into fifth grade and above, it is not unexpected to see more students having difficulty with reading in these grades.
We noted in our analysis across languages that the percentage of the All Somali group did not perform like the All groups of the other two languages. Instead this group had similar percentages in Level I to the Hmong and Spanish students with disabilities. A few possible explanations could be offered. For example, schools may still have been adjusting their instructional strategies to best meet the needs of this population. It also may reflect the fact that these students were relatively newer arrivals to English speaking communities and schools in comparison to the other two language groups in our analysis.
Conclusions from specific disability categories were difficult to reach due to small numbers enrolled and tested. However, the inference can be made that many of these limited English proficient students with disabilities probably did less well than their English proficient counterparts with disabilities in mathematics and reading because this is the general pattern from other performance data presented. For example, these students tended to perform less well in comparisons to overall groups (All, SLEP, SD, SLEPD), and in comparisons across languages (All and SLEPD).
Although the overall percentage of students across language and disability categories falls into Level II, it is clear that the students in most need of help are limited English proficient students with disabilities, regardless of their home language group. Clarification of instructional strategies, along with appropriate accommodations during instruction and assessment to meet their needs, is of the utmost importance.
Liu, K., & Thurlow, M. (2000). Participation and performance of limited English proficient students: Minnesota Comprehensive Assessments in Reading and Math, 1998-99 (Minnesota Report 24). Minneapolis, MN: University of Minnesota, National Center on Educational Outcomes. Available at http://education.umn.edu/nceo/OnlinePubs/MnReport24.html.