Reading, Mathematics, and Science Instructional Strategies for English Language Learners with Disabilities: Insights from Educators Nationwide ELLs with Disabilities Report 19 Manuel Barrera, Vitaliy Shyyan, Kristi K. Liu, Martha L. Thurlow September 2008 All rights reserved. Any or all portions of this document may be reproduced and distributed without prior permission, provided the source is cited as: Barrera, M., Shyyan, V., Liu, K. K., & Thurlow, M. L. (2008). Reading, mathematics, and science instructional strategies for English language learners with disabilities: Insights from educators nationwide (ELLs with Disabilities Report 19). Minneapolis, MN: University of Minnesota, National Center on Educational Outcomes. Overview Introduction The Elementary and Secondary Education Act of 2001—No Child Left Behind (NCLB)—has set a standard of accountability for the education of the broad range of learners in U.S. schools, including English language learners (ELLs) served under Individualized Education Programs (IEPs) in special education. The most modest estimates indicate that 9% of the total ELL population is served in special education programs (Zehler, Hopstock, Fleischman, Pendzick, & Stephenson, 2003). Predictably, academic outcomes for this growing student population have not kept pace (Albus, Thurlow, Barrera, Guven, & Shyyan, 2004; Liu, Barrera, Thurlow, Guven, & Shyyan, 2005; Liu, Thurlow, Barrera, Guven, & Shyyan, 2005). State graduation standards typically are not designed with the additional supports that could guide educators in the use of instructional strategies for the range of diverse learners in schools (Albus, Thurlow, & Clapper, 2007). Current research on instructional practices for ELLs is scarce and often inferential from the practices employed for more general populations of learners (cf. Thurlow, Albus, Shyyan, Liu, & Barrera, 2004). As a result, educational practitioners are likely to generate instructional strategies based on their individual professional experiences, colleagues, and other sources of information including agencies providing technical assistance and professional development. The difficulty here is that teachers may access a wide range of sources with varying degrees of accuracy and relevancy to support the instructional demands of students whose education is hampered by both a lack of fluency in English and disability-related learning problems. In a recent study, Thurlow and colleagues (Thurlow et al., 2004) examined the nature of the teaching methods used by practitioners in a Midwestern state serving ELLs with disabilities. They found that some of the strategies identified for use with ELLs with and without disabilities consisted mainly of more generic teaching principles such as "pre-, during-, and post-reading strategies" (Thurlow et al., 2004, p. 10). Moreover, there seemed to be little consensus about how a "strategy" is defined; hence, some identified strategies consisted of a combination of methods, approaches, and learning activities. In no case did educators seem to have access to methods specifically identified to address the needs of ELLs with disabilities. Of note was that a list of expert-determined methods and strategies identified from a review of research (cf. Gersten & Baker, 2000; Gersten, Baker, & Marks, 1998) on the instruction of ELLs with disabilities (e.g., direct teaching of vocabulary, curriculum-based probes, and graphic organizers) received significantly lower appraisals by classroom practitioners than their own broadly conceptualized versions of strategies. Moreover, the educators involved in the study were a voluntary sample from available schools and school districts at a time when there were few criteria or existing data for how to measure the efficacy of schools for demonstrating improved educational outcomes among struggling learners such as ELLs with disabilities. Hence, the strategies, activities—teaching principles—identified in the Thurlow et al. (2004) study, while an important contribution to current knowledge of teacher practices, could only cautiously be described for use among other practitioners. The primary lessons of our previous work, therefore, were the needs to (a) operationalize more directly the nature of the strategies that teachers employ in service to ELLs with disabilities, (b) provide a broader, preferably more random sample of educators of national scope, and (c) identify, if possible, educators who have, in some way, demonstrated effective practices with clearly discernible results in improving outcomes for ELLs with disabilities. From these experiences, it was clear that the present study should examine current teacher practices within successful school settings. This approach seems necessary given the observed difficulties of current models of "research to practice" where the validated research is minimally used by practitioners, at least directly (Boardman, Arguelles, Vaughn, Hughes, & Klingner, 2005; Landrum, Cook, Tankersley, & Fitzgerald, 2007; cf. National Science Foundation, 2002). In this way, it may be possible to better reconcile current research with established practices and provide a stronger conduit between researchers and practitioners. In this new study, conducted in 2005–06, our standard for determining a successful school setting was to identify schools that had high concentrations of ELLs and that also had reported meeting "adequate yearly progress" under the guidelines of the No Child Left Behind Act (2001). The focus was to identify teacher-initiated instructional strategies currently preferred by practitioners who daily work with ELLs with disabilities. The findings generated in this study could potentially confirm strategies identified in our earlier work (Thurlow et al., 2004) through the perspective of educators who have had observed success in meeting grade-level academic standards and adequate yearly progress demonstrated through statewide academic assessments. Second, new strategies specific to these hypothesized successful settings could be identified, thereby providing a wider range of potential methods. Third, the compiled strategies might provide a way to examine congruities and incongruities between established research and the perceptions of successful practice by those who actually work with these students every day. Finally, the identified strategies might provide a way to operationalize what researchers in this field are finding through their systematic examinations. This study focused on the instructional strategies employed at the middle and junior high school level. Teaching and learning at the middle school level have been found particularly challenging, perhaps because the curriculum places greater cognitive demands on emerging adolescents at a developmental stage when students, especially those who have already been struggling, can be at higher risk for academic failure (Mikow-Porto, Humphries, Egelson, O’Connell, & Teague, 2004). ELLs with disabilities could be at particular risk given the combination of learning challenges they may encounter during the middle school years.
Definitions of Terms We began by defining key terms: "English language learners with disabilities" and "instructional strategy." We employed the following definitions: English language learners with disabilities are students whose primary or native language is not English, who have difficulty in using English (i.e., reading, writing, speaking, and listening), and who have an Individualized Education Program (IEP). The IEP requires a description of the student’s unique educational needs and contains a statement of his or her present level of performance and measurable educational goals and objectives. An instructional strategy is a purposeful activity to engage learners in acquiring new behaviors or knowledge. Such a strategy should have clearly defined steps or a clear description of what the teacher does. Our definition of instructional strategy was based on a review of scholarship and research in the areas of instructional design, instructional methodologies, and English as a second language (ESL) instruction. Given the observed lack of clarity regarding what a strategy constitutes, we thought it important to develop a thorough understanding of this term and arrive at a firm definition that would help readers and practitioners in the field comprehend the nature of our findings. As with the strategy term, there is an ambiguity about the population of students under study given the problems of appropriate identification of English language learners who may also have disabilities (cf. Artiles & Ortiz, 2002; Barrera, 2006; Ortiz, 1997). Thus, because of the potential disagreements about whether ELLs with disabilities are appropriately identified, we thought it necessary to be more precise by describing the population in this study as those English language learners for whom an individualized education program (IEP) had been written for services within special education. Content Focus and Research Question Reading, mathematics, and science are three content areas currently in focus for assessment of children under the provisions of the NCLB. Many states engage in continuous review and update of their reading, mathematics, and science grade-level and graduation standards. Hence, this study examined how teachers provide instruction in these three areas. The following research question served as our focus:
Sampling To build a national sample, we used a stratified random selection in a multi-stage sampling process. At the beginning of the procedure, data from the National Clearinghouse for English Language Acquisition (accessed in 2004) were used to identify the 10 states with the highest and 10 states with the lowest ELL populations. Next, five states were randomly drawn from each pool to identify five states with the highest and five states with the lowest ELL populations where our research was to be conducted. The criterion for determining participation in this study was to identify schools in the target states that had demonstrated "Adequate Yearly Progress" (AYP) under the conditions set in the No Child Left Behind Act, across all learner groups, including students with disabilities and English language learners. We used 2003–2004 middle and junior high school (grades 6–9) data found on state department of education Web sites to select schools making Adequate Yearly Progress that served the largest possible population of ELLs. The size of the general ELL population was chosen as a criterion because schools often do not directly cite the size of the population of ELLs with disabilities. The principals of these schools were contacted first by phone and then with written invitations (usually via electronic mail) to participate in the study. Those schools agreeing to participate were visited by a research team. Our efforts resulted in sending research teams to three schools in the West Region, two schools in the Midwest Region, one school in the Northeast Region, and four schools in the South Region of the country. Figure 1 presents the geographic distribution of states where the study was conducted. Figure 1. Locations of Study Sites
Research Team The research team consisted of seven staff of the National Center on Educational Outcomes. Teams of three researchers traveled to the schools and conducted the MACB sessions with teachers. Three researchers had backgrounds in both research and technical assistance. They were well-versed in ways to incorporate diverse learners in state standards and accountability movements. Five members had experience as educators. Two of those five team members were also university-affiliated teacher educators with expertise in education policy and bilingual special education, respectively. At the data collection sessions, one researcher had specific responsibility for leading the MACB process. A second researcher entered data into a spreadsheet, and a third took notes on the definitions of additional strategies nominated by teachers.
Participants Professional Background and Experience Each MACB session involved a group of teachers chosen with the guidance of the school principal or the principal’s designee. An important component of the MACB process is to ensure that a wide spectrum of viewpoints on the issues examined is included (Vanderwood & Erickson, 1994a, 1994b). Thus, the primary criterion for choosing focus group members was that each had some responsibility in the instruction or related services for ELLs with disabilities. The study sample included 67 educators, primarily females (n = 58; 86.6%), from 10 highly-achieving schools in 10 states around the country. Thirty-five participants were educators from five states with high ELL student populations and 32 educators were from five states with low ELL student populations. Figure 2 illustrates that study participants overall were largely experienced teachers. A majority of the 67 participants (n = 37) had more than 10 years of total teaching experience. An additional 15 teachers had between 6 and 10 years of professional experience. Fewer teachers were comparatively new to the profession, with 13 participants having 1 to 5 years experience and two participants being first-year teachers. Additionally, Figure 2 shows that slightly more than half of the participants (n = 34) had held their current position for 5 or fewer years (n = 24 at 1 to 5 years; n = 10 under 1 year). The remainder (n = 33) had been working in the current positions for 6 or more years (n = 18 at 6 to 10 years; n = 15 at over 10 years). Figure 2. Professional Experience of Participants
As shown in Figure 3, the teachers comprised a broadly representative cross-section of general education (n = 24; 36%), special education (n = 10; 15%), and ESL/Bilingual Education specialists (n = 16; 24%). The remaining educators (n = 17; 25%) either had combined several positions or held administrative positions titles such as Special Education or ESL Directors. Figure 3. Job Title of Participants
Table 1 summarizes information about content areas taught by our research participants. The largest subgroup of study participants taught middle school reading or mathematics (n = 24; 36%), followed by those who taught English Language Arts (n = 16; 24%). Smaller numbers of teachers taught Social Studies (n = 13; 19%), Science (n = 12; 18%), and Writing (n = 7; 10%). In some cases, participants taught more than one content area. Table 1. Content Areas Taught by Educators
More than 1/3 of participants (34%) reported that they served ELLs, students with disabilities, ELLs with disabilities, and general education students in their classes. Fifteen percent of participants worked only with ELLs, and equal percentages (8%) served either ELLs, students with disabilities, and general education students, or just ELLs and general education students. Language Backgrounds of ELLs Served As highlighted by Figure 4, the largest group of study participants served ELLs whose native language was Spanish (n = 27; 40%). However, participants also reported working with students from the following language groups: Native American languages (n = 10; 15%), Russian (n = 10; 15%), Chinese (n = 9; 13%), Ukrainian (n = 9; 13%), Arabic (n = 8; 12%), Vietnamese (n = 7; 10%), Korean (n = 6; 9%), Urdu (n = 6; 9%), French (n = 5; 7%), Portuguese (n = 5; 7%), and Greek (n = 4; 6%). Students from other primary language backgrounds (e.g., Assyrian, Bulgarian, Filipino, Hindi, Hmong, Nepali, Pakistani, or Somali) were reported in less than 5% of the cases. Figure 4. Percent of Participants Serving ELLs of Various Language Backgrounds
Teacher Familiarity with State Standards The demographic survey that teachers completed also generated information about teacher familiarity with grade-level content standards in their home state. While most teachers (79%) indicated at least some degree of familiarity with grade-level content standards for their state, a sizeable group (n = 13; 19%) were not at all familiar with the standards. One educator (2%) indicated that state standards were in the process of changing at the time of the research study.
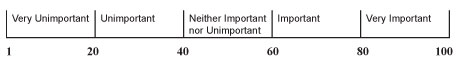
Instruments and Procedures The Multi-Attribute Consensus Building (MACB) methodology (Vanderwood & Erickson, 1994a, 1994b) used in our previous one state study (Thurlow et al., 2004) was also used in this nationwide study. MACB is a quantitative, objective approach for determining a small group’s consensus-derived opinion about the importance of each item in a list. At the beginning of each session, teachers were provided an explanation of the study and asked to complete research consent releases as voluntary participants. Next, they were asked to complete a brief demographic survey, which generated background information for data analysis purposes. The MACB portion of the study contained three distinct parts. First, to provide an overall perspective from participants and as a way to introduce the MACB process, the data-gathering stage of the process opened with a weighting of the relative importance of three content areas in the instruction of English language learners with disabilities: reading, mathematics, and science. The MACB process includes a weighting procedure where participants weight their preferences for the importance of each item in a list on a scale from 1 to 100 (see Figure 5). For purposes of calculation within the weighting process, participants were instructed to weight at least one item at 100 on a hard copy of the research instrument (cf. Vanderwood & Erickson, 1994a; 1994b). Figure 5. MACB Weighting Scale
After writing their responses on paper, participants called out their weightings to a researcher who entered them into a spreadsheet that was projected onto the wall. The spreadsheet tabulated an average weighting for each item so participants could see the items to which the group gave greater importance. These weightings were used to stimulate a facilitator-guided discussion for participants to clarify their decision making on the strategies. After this discussion, each participant had an opportunity to change weightings based on reflection in listening to each other. As a second step, educators were invited to weight a small number of previously generated instructional strategies drawn from the Thurlow et al. (2004) study in order to get them thinking about specific instructional practices in the content classroom. We called these strategies "core strategies." The core strategies primarily consisted of the highest weighted strategies in reading, mathematics, and science instruction from the Thurlow et al. (2004) study. One exception was the inclusion of "curriculum-based probes" otherwise known as curriculum-based assessment or curriculum-based measurement. This strategy is highly recognized in the field of special education (Kavale & Forness, 1999; Reschley, 2006) and identified within the relatively sparse literature on instructional strategies supporting ELLs with disabilities (Gersten et al., 1999). Thus, it was a peculiarly anomalous finding in the Thurlow et al. (2004) study that this strategy received only moderate support from practitioners in that study. Given that the present study involved educators who had clearly demonstrated instructional success with a population that included ELLs with disabilities, we thought it important to include curriculum-based measurements and obtain a "second reading" of this strategy as we sought to confirm the viability of the other core strategies. We note here that we used the term "probe" for both operational clarity among the range of practitioners involved in the study and to avoid the need for over-lengthy explanations regarding the differences between curriculum-based measurement and curriculum-based assessment. Alongside the lists of core strategies was a glossary of core strategy definitions that were written to show how a strategy should be described based on the broad strategy definition employed for this study. Participants were asked to refer to this glossary as often as necessary in discussing and weighting strategies. To help teachers think about strategies that they would use in a grade-level standards-based content classroom, each participant was supplied with a full set of reading, mathematics, and science standards from their home state, to which they could refer as needed. Additionally, sample state standards were provided on content area pages of the study instrument. Third, participants were then asked to generate additional strategies of their own for each content area and provide definitions for them. The participant-generated definitions were transcribed on chart paper so that they could easily be seen during the weighting process. Participants then weighted each of the additional strategies and an overall average weighting was calculated for each strategy to determine which ones educators thought were of greatest importance in standards-based instruction for ELLs with disabilities. The sessions were designed to last no more than two hours from introductions to completion of strategy discussion and weighting. All sessions were digitally recorded and later analyzed for maintaining fidelity to the descriptions of strategies made by participants. Data are reported here in the order in which research participants encountered the study questions. Analysis of results is reported by demographic categories.
Content Area Importance Consistent with the required MACB weighting procedure to assign at least one factor a weighting of 100, all research participants unanimously weighted reading as the highest priority. Mathematics was also weighted as very important but it received a lower average score of 91.9 with a standard deviation of 8.1. The science weightings averaged slightly lower than mathematics but still fell within the "very important" continuum at 80.9 with a standard deviation of 11.4. Figure 6 summarizes the content area importance results as weighted by all educators. Figure 6. Importance of Content Areas
Teacher Weightings of Core Strategies The core strategies from our previous study (Thurlow et al., 2004) and those generated in the present study are fully described in Appendices A–C. At the beginning of the content portion of the focus groups, we provided three core strategies for each content area chosen for their high weightings or, in the case of curriculum-based probes, for their relative importance in special education from the Thurlow et al. (2004) study. The initial three core strategies per content area served as a starting list to facilitate the strategy generation process and thereby supplement our previous analysis with the responses of these participants. In each of the following sections, only the titles of the named strategies are presented in the tables and narrative descriptions. Many, but not all, of the named strategies differed when participants were asked to describe the steps and procedures they used in implementing them. Reading Table 2 shows weightings for the core reading strategies. These and other reading strategies are defined in Appendix A. Most educators agreed on the importance of the "chunking and questioning aloud" and "relating reading to student experiences" strategies. In contrast, the "curriculum-based probe" strategy was weighted lower in its importance, within the "important" area of the scale (60–80) continuum. "Curriculum-based probe" ranged in its weightings from 5 to 100 and produced a relatively high standard deviation of 21.4. Table 2. Core Reading Strategies
Mathematics Table 3 describes the weighting provided by session participants (n = 66; one teacher missed this part of the focus group session due to a pre-scheduled appointment). These strategies and others proposed for mathematics are defined in Appendix B. As noted, the "student-developed glossary" strategy was weighted as important while "daily re-looping of previously learned material" and "teacher think-alouds" strategies were weighted as very important. Table 3. Core Mathematics Strategies
Science The core science strategies from our previous study included "using pictures to demonstrate steps," "pre-reading strategies," and "teacher modeling." Table 4 shows results of participant weightings. These science strategies are defined in Appendix C. All three strategies in Table 4 were weighted as very important by session participants (n = 66). Table 4. Core Science Strategies
Additional Generated Strategies The data tables for the newly generated strategies are further organized to show both frequency of choice by total number and percent of participants and by the number and percent of groups in small and large ELL population states. Only the most frequent newly generated strategies (5 for reading and science, 4 for math) are described here with the full list found in the Appendix. Determination of hierarchy for reporting was based on the total number of participants who weighted the strategies the highest among the total strategies named. Reading Table 5 summarizes the top five additional reading strategies generated by participants beyond the three core strategies provided at the outset of the sessions. These consisted of "using visuals" (generated in three large and two small population states reflecting 48% percent of the total group participants); "teacher pre-reading of text" (generated three times in one large and two small states reflecting 30% of the participants); "repeated student reading of text" (generated in one large state and one small state reflecting 27% of participants); "literature circles" (generated in two large ELL population states reflecting 24% of participants); and "checking background knowledge of students" (generated in one large state and one small state reflecting 19% of participants). Table 5. Top Reading Strategies
*Large = states with large ELL populations; Small = states with small ELL populations.
Mathematics The top four mathematics strategies newly generated by participants are summarized in Table 6. "Using manipulatives" was generated from eight groups across states with large and small ELL populations. "Relating mathematics to real life" was generated from seven groups representing states with large and small ELL populations. "Using visuals" was generated from four groups across states with large and small ELL populations. "Simplifying problems" was named by two groups representing states with small ELL populations only. Table 6. Top Mathematics Strategies
*Large = states with large ELL populations; Small = states with small ELL populations.
Science Table 7 shows the science strategies generated by the session participants. The top five strategies included "hands-on participation" from six groups representing three large and three small ELL population states and 50% of all participants; "graphic organizers" from four groups representing three large ELL population states and one small ELL population state reflecting 39% of participants; "student-made models" from four groups representing three large ELL population states and one small ELL population state reflecting 32% of participants; "vocabulary development" from three groups representing one large ELL population state and three small ELL population states reflecting 26% of participants; and "personal interest research" from one large and one small ELL population state reflecting 21% of participants. The remaining top weighted science strategies were added to the list one time in states with either larger or smaller ELL populations. Table 7. Top Science Strategies
*Large = states with large ELL populations; Small = states with small ELL populations.
Results by Teacher Demographic Variables Additional analyses were conducted on teacher preferences for core strategies and subject areas. These results showed patterns similar to those already reported. A notable detail is the perception about the use of curriculum-based probes. More experienced teachers tended to weight curriculum-based assessments much higher (average of 83—very important) than beginning teachers (average of 58—neither important nor unimportant). Special educators and other specialists or program coordinators tended to consider curriculum-based probes as highly important (average of 83—very important) whereas bilingual/ESL specialists tended to rate them much more moderately (average of 66—low range of important). General education content area teachers tended to weight curriculum-based probes closer to special educators, but demonstrably less so (average of 78—high range of important). This study was conducted to examine the instructional strategies that practitioners have found successful in promoting grade-level standards-based academic achievement among ELLs with disabilities. Findings in this study confirmed results from our previous work, provided additional breadth and depth in understanding the instructional practices of teachers having some measure of success with ELLs with disabilities, and raised more questions needing further research.
Teacher Perspectives on the Importance of Reading, Mathematics, and Science It is important to note that the support for instructional strategies in service to ELLs with disabilities identified through this study occurred in the context of generally high teacher ratings for the content examined. Educators in this study tended to weight all three content areas of reading, mathematics, and science as "very important." Nevertheless, the weighting of science education seemed more variable in states with small ELL populations and among educators with over 10 years of experience. It may be that the importance of science is more distant for educators who were trained in an era when students with special needs did not typically receive science instruction. In addition, some states may still prioritize the teaching of reading and math. The importance of science education is expected to increase in coming years as a result of the proposal to include science achievement in accountability alongside reading and mathematics when NCLB is reauthorized (cf. Commission on No Child Left Behind, 2007). Future work in this area may reveal more consistent perceptions of science education among educators. Review of Teacher Strategies In examining the instructional strategies of teachers in the areas of reading, mathematics, and science education, we conducted two types of analysis: first, we sought to confirm the support for and feasibility of strategies previously identified in earlier research (Thurlow et al., 2004) and from research literature on expert-perceived effective instructional practice (Gersten, Baker, & Marks, 1998)—what we called "core strategies" in this study. Second, we identified locally-determined strategies from the MACB participants. These strategies helped us to determine how specifically these practitioners implemented instruction. Teacher Ratings of Strategies In general, our data showed that educators tended to be neutral or positive about every instructional strategy they weighted. Negative points were expressed only in a few instances and positive support was particularly prominent when educators discussed strategies that they frequently used or that were widely described in research literature, with some notable exceptions. In the cases of overly variable support or obvious disagreement, the discussion that was generated proved insightful. Thus, in addition to numerical weightings, we also collected transcripts of participant discussions to gain better understanding of teachers’ views. We report here some of this illustrative commentary. Commentary on Subject Areas and Related Strategies One reading strategy, "relating reading to student experiences," received significant support from educators across states and also generated commentary within the discussions about mathematics and science. By example, one teacher noted:
In discussions about mathematics and science strategies, repetition and re-teaching ("daily re-looping of previously learned material," "drill and practice," "multiple and varied exposure to the same concept," "multiple ways of teaching," etc.) emerged as a theme in our study. During one group discussion, a math teacher shared the following: "I am available a lot for extra time to re-teach something in a different way that I might not use with all my kids but I would use it for someone who is struggling. But I have to have the time element to do that. But that is one of the strategies that I use is being available for extra time to re-teach…the key here is re-teaching to a smaller group or to an individual." In another session, a science teacher emphasized the importance of consistent teaching so that students are "as close as possible to the same picture in their head no matter what. No matter what their background knowledge is and you just keep going through that according to details…" Another core mathematics strategy, "student-created glossary," received slightly lower weightings from educators representing states with smaller ELL populations. On the other hand, one educator from a larger ELL population state stressed the importance of the appropriate use of this strategy. She explained, "I think a lot of times we say, ‘All right, have your notebook and have your stuff,’ [but] as far as do they refer to it and do they really understand it? Sometimes I don’t think like necessarily student-developed glossary is going to work. It’s important if they actually are using it and keeping track of it and…understanding it and putting things in their own words, but a lot of times it just becomes a place to copy and the teacher checks and says, ‘Ok, you have your glossary.’" Commentary on Curriculum-based Assessment Some instructional strategies received weightings with significant levels of variability. In particular, weighting for "curriculum-based probe" (reading strategy), ranged from 5 to 100. It was weighted as "very important" by special education teachers and "other" educators (administrators and specialists) and by educators with over 10 years of experience, but weighted much lower by ESL and classroom teachers. The following interaction between educators in one of the groups illustrates differing attitudes and opinions about the strategy. One proponent of curriculum-based probes stated, "I think it’s very important that you need to know where the child is at in order to keep going. You cannot keep going unless you know where the child is. So you have to constantly assess, even if it’s informal, it works." Another educator argued:
Finally, a third educator seemed to find consensus on the strategy:
Locally Identified Instructional Strategies In addition to analysis of the core strategies, we asked MACB participants to name and describe instructional strategies that they typically have found successful with ELLs with disabilities. As previously described, these results illustrate the wide variation in the way commonly understood strategies are used within the field. As in our previous study (Thurlow et al., 2004) and despite our efforts to engage study participants in operationalizing the strategies they named, we found that teachers in this study tended to include in their nominations practices that could be more broadly defined as either general principles of good teaching or instructional approaches. When pressed, these practitioners tended to vary in the specific ways they implemented the practices they named. It is, perhaps, more helpful to consider the strategies named in this study as strategy clusters that any particular teacher or group of teachers may employ differentially. In one example, the highest rated science strategy was named "hands-on participation." Although many participants used this term uniformly, their descriptions of what they believed constituted such student participation ranged from designing science experiments, use of science laboratory activities, to demonstrating science knowledge "in practice." From this experience, it seems important to look beyond the "titles" that teachers use in describing their practices and examine the multiple ways teachers have implemented a particular strategy. Thus, we believe our findings have implications for research to practice.
Implications for Research to Practice Findings in this study reinforced and in some ways provided needed elaboration into understanding the difficulties of bridging research with practice. How teachers tended to describe their practices did not coincide well with what research professionals consider appropriate research-based practices. In this sense, our findings appear to confirm previous research-to-practice studies (e.g., Boardman et al., 2005; Landrum et al., 2007). For example, both Boardman and colleagues (2005) and Landrum and colleagues (2007) found that teachers tend to prefer practices supported by their peers more than strategies presented in "research" formats. Our findings show that teachers tend to describe their practices more specific to their individual situations using a diverse array of definitions. At the same time, many of the practices described here resonate with some validated research and contradict others. In one example, the use of physical objects, "manipulatives," in mathematics is a well-established practice (cf. Chomsky, 2003; Marzano, 1998). Much as is reported in research, teachers in our study described a wide array of specific methods in which they used manipulatives in their classrooms. However, none described the sequence of instruction moving from directly physical to more abstract representations often ascribed as most effective for the use of manipulatives (Blynt, 2006; Maccini & Gagnon, 2000). This pattern was a common one among teachers’ descriptions of the strategies they used. Given the observed success of the teachers who participated in this study, our findings seem at least to give pause for reflection about the connection between practices identified by teachers with responsibility for teaching ELLs with disabilities and current practices in reporting empirically-supported educational practice.
Limitations of the Study The limitations of this study include the potentially limited generalizability of locally identified strategies across states and individual focus groups, a rather small sample. Additionally, the incongruity between what participants reported as appropriate strategies and the way similar practices are described by researchers in the field may have reflected a lack of participants’ familiarity with current research. This lack of familiarity may also be explained by the limited degree to which research described as empirically-supported is not often associated with the student population of interest in this study: ELLs with disabilities. Several observers have pointed to the faulty assumption that evidence-based practices are directly supportive to one population if they have been found useful in other populations (Kovaleski, 2007; Vanderwood & Nam, 2007). This particular problem has received some attention with regard to the utility of interventions for ELLs with disabilities even if interventions have been found validated for related populations such as individuals with disabilities (not ELLs) or ELLs (without disabilities) (Barrera, 2006; Klingner, 2007; Klingner, McRay-Sorrells, & Barrera, 2007). Results from this study, through the evidence showing implementation of a variety of strategies validated within broader populations of students but in different forms indicate the need for more in-depth and direct validation research for the instruction of ELLs with disabilities. Finally, some educators were asked to weight instructional strategies outside of the content areas they were assigned to teach. Despite the possibility that many instructional strategies generated in the study may serve multiple content areas, the weightings may have been influenced by lack of familiarity with some of the strategies originally and subsequently named. Future studies should include an assessment of participant perceptions of their familiarity with the strategies discussed.
Future Directions This nationwide study highlighted what educators with a record of success, defined as meeting Adequate Yearly Progress, consider useful instructional strategies for ELLs with disabilities. The variability and difficulty with which participants described specifically what they did when teaching these students coupled with the seeming variance between what is described as successful in published research and how teachers may implement their instruction indicates a need for further research to examine the use of strategies as teachers appear to implement them. Such research would require the following elements inferred by our findings. First, the focus of instruction should be directed toward improving grade-level standards-based academic achievement. These strategies should be identified in specific subject areas such as reading/language arts, mathematics, and integrated or subject-specific science curriculum. Second, there is a continuing need to operationalize instructional strategies identified for research in specific well-described terms for appropriate comparison and evaluation. Finally, because of the observed variability in perspectives regarding the use of progress monitoring such as curriculum-based measurement, attention should be paid to the manner in which effectiveness of strategy implementation is verified through appropriate and validated assessments. This latter point is particularly important in the case of work conducted with ELLs with disabilities given the variability in the available expertise among educators historically involved in their education (Gersten & Wanderwood, 1994; McArdle, Mele-McCarthy, & Leos, 2005). Specifically, ELLs with disabilities require both language learning-based approaches and individualized instructional support. Hence, it seems particularly important to verify how and how well specific strategies for these students are implemented and how well they work to provide viable standards-based outcomes. One important approach is to conduct single-subject research studies that examine both accurately identified and implemented strategies that are coupled with verifiable individual measures of academic progress. The National Center on Educational Outcomes has conducted an initial set of such studies (Barrera, Liu, Thurlow, & Chamberlain, 2006; Barrera, Liu, Thurlow, Shyyan, Yan, & Chamberlain, 2006) stemming from our previous MACB research (Thurlow et al., 2004). These studies and our findings here suggest that future research in this area should include multistate or national single case design studies that would test the effectiveness of the strategies specifically described by teachers in the field. Albus, D., Barrera, M., Thurlow, M., Guven, K., & Shyyan, V. (2004). 2000–2001 Participation and performance of English language learners with disabilities on Minnesota standards-based assessments (ELLs with Disabilities Report 4). Minneapolis, MN: University of Minnesota, National Center on Educational Outcomes. Albus, D., Thurlow, M., & Clapper, A. (2007). Standards-based instructional strategies for English language learners with disabilities (ELLs with Disabilities Report 18). Minneapolis, MN: University of Minnesota, National Center on Educational Outcomes. Artiles, A.J. & Ortiz, A.A. (2002). English language learners with special education needs. McHenry, Illinois: Center for Applied Linguistics and Delta Systems Co. Barrera, M. (2006). Roles of definitional and assessment models in the identification of new or second language learners of English for special education. Journal of Learning Disabilities, 39(2), 142–156. Barrera, M., Liu, K., Thurlow, M., & Chamberlain, S. (2006). Use of chunking and questioning aloud to improve the reading comprehension of English language learners with disabilities (ELLs with Disabilities Report 17). Minneapolis, MN: University of Minnesota, National Center on Educational Outcomes. Barrera, M., Liu, K., Thurlow, M., Shyyan, V., Yan, M., & Chamberlain, S. (2006). Math strategy instruction for students with disabilities who are learning English (ELLs with Disabilities Report 16). Minneapolis, MN: University of Minnesota, National Center on Educational Outcomes. Boardman, A.G., Arguelles, M.E., Vaughn, S., Hughes, M.T., & Klingner, J. (2005). Special education teachers’ views of research-based practices. The Journal of Special Education, 39, 168–180. Blynt, G.D. (2006). Increasing motivation in students with diagnoses of Emotional Disturbance: A study in the use of manipulatives. Dissertation available from Williamsburg, VA: College of William & Mary. Chomksy, P. (2003). Why gizmos work: Empirical evidence for the instructional effectiveness of explore learning’s interactive content. Charlottesville, VA: www.explorelearning.com. Retrieved May 2, 2008, from http://www.explorelearning.com/View/ downloads/WhyGizmosWork.pdf Commission on No Child Left Behind (2007). Beyond NCLB: Fulfilling the promise to our nation’s children. Washington, DC: The Aspen Institute. Gersten, R., & Baker, S. (2000). What we know about effective instructional practices for English-language learners. Exceptional Children, 66(4), 454–470. Gersten, R., Baker, S., & Marks, S.U. (1998). Teaching English-language learners with learning difficulties: Guiding principles and examples from research-based practice. Reston, VA: Council for Exceptional Children. Gersten, R., & Wanderwood, J. (1994). The language minority student and special education: Issues, themes and paradoxes. Exceptional Children, 60(4), 310–322. Kavale, K.A., & Forness, S.R. (1999). Effectiveness of special education. In C. R. Reynolds & T. B. Gutkin (Eds.), The handbook of school psychology (3rd Ed.) (pp. 984–1024). New York: Wiley. Klingner, J.K., McRay-Sorrells, A.M., & Barrera, M. (2007). Three-tiered models with culturally and linguistically diverse students. In D. Haager, S. Vaughn, & J. Klingner (Eds.), Validated reading practices for three tiers of intervention. Baltimore, MD: Brookes. Klingner, J. (2007). Using RTI to address disproportionate representation. Presented at National Response to Intervention Summit, December 6, 2007 (p. 10). Washington, DC: Author. Kovaleski, J.F. (2007). Potential pitfalls of response to intervention. In S.R. Jimerson, M.K. Burns, & A.M. VanDerHeyden (Eds.), The handbook of response to intervention: The science and practice of assessment and intervention. New York, NY: Springer Science+Business Media, LLC. Landrum, T.J., Cook, B.G., Tankersley, M., & Fitzgerald, S. (2007). Teacher perceptions of the useability of intervention information from personal versus data-based sources. Education & Treatment of Children, 30(4), 27–42. Liu, K., Barrera, M., Thurlow, M., Guven, K., & Shyyan, V. (2005). Graduation exam participation and performance (1999-2000) of English language learners with disabilities (ELLs with Disabilities Report 2). Minneapolis, MN: University of Minnesota, National Center on Educational Outcomes. Liu, K., Thurlow, M., Barrera, M., Guven, K., & Shyyan, V. (2005). Graduation exam participation and performance (2000-2001) of English language learners with disabilities (ELLs with Disabilities Report 3). Minneapolis, MN: University of Minnesota, National Center on Educational Outcomes. Maccini, P., & Gagnon, J.C. (2000). Best practices for teaching mathematics to secondary students with special needs. Focus on Exceptional Children. 32(5), 1–21. Marzano, R.J. (1998). A theory-based meta-analysis of research on instruction. Aurora, CO: Mid-continent Research for Education and Learning. McArdle, P., Mele-McCarthy, J., & Leos, K. (2005). English language learners and learning disabilities: Research agenda and implications for practice. Learning Disabilities Research & Practice, 20(1), 68–78. Mikow-Porto, V., Humphries, S., Egelson, P., O’Connell, D., & Teague, J. (2004). English language learners in the Southeast: Research, policy & practice. Greensboro, North Carolina: SERVE. National Science Foundation. (2002). Women, minorities, and persons with disabilities in science and engineering. Arlington, VA; Author. Ortiz, A.A. (1997). Learning disabilities occurring concomitantly with linguistic differences. Journal of Learning Disabilities, 30, 321–332. Reschley, D. (2006). Closing the research to practice gap: Teacher preparation and special education programs. President’s Message—CEC Division for Research Newsletter. Retrieved January 30, 2008, from http://www.cecdr.org/message.cfm Thurlow, M., Albus, D., Shyyan, V., Liu, K., & Barrera, M. (2004). Educator perceptions of instructional strategies for standards-based education of English language learners with disabilities (ELLs with Disabilities Report 7). Minneapolis, MN: University of Minnesota, National Center on Educational Outcomes. Vanderwood, M.L., & Erickson, R. (1994a). Consensus building. Special Services in the Schools, 9 (2), 99–113. Vanderwood, M.L. & Erickson, R. (1994b). Consensus building. Educational Outcomes for Students with Disabilities (James E. Ysseldyke & Martha Thurlow, Eds.) Binghamton, NY: The Haworth Press, Inc. Vanderwood, M.L. & Nam, J.E. (2007). Response to intervention for English language learners: Current development and future directions. In S. R. Jimerson, M. K. Burns, & A. M. VanDerHeyden (Eds.), The handbook of response to intervention: The science and practice of assessment and intervention. New York, NY: Springer Science+Business Media, LLC. Zehler, A., Fleischman, H., Hopstock, P., Pendzick, M., & Stephenson, T. (2003). Descriptive study of services to LEP students and LEP students with disabilities: Findings on special education LEP students (Special Topic Report 4). Washington, DC: Office of English Language Acquisition, U.S. Department of Education. Glossary of All Reading Strategies
Glossary of All Mathematics Strategies
Glossary of All Science Strategies
|
||||||||||||||||||||||||||||||||||||||||||||||||||||||||||||||||||||||||||||||||||||||||||||||||||||||||||||||||||||||||||||||||||||||||||||||||||||||||||||||||||||||||||||||||||||||||||||||||||||||||||||||||||||||||||||||||||||||||||||||||||||||||||||||||||||||||||||||||||||||||||||||||||||||||||||||||||||||||||||||||||||||||||||||||||||||||||||||||||||||||||||||||||||||||||||||||||||||||||||||||||||||||||||||||||||||||||||||||||||||||||||||||||||||||||||||||||||||||||||||||||||||||||||||||||||||||||||||||||||||||||||||||||||||||||||||||||||||||||||||||||||||||||||