
Martha L. Thurlow, Erik D. Larson, Sheryl S. Lazarus, Vitaliy V. Shyyan, and Laurene L. Christensen
September 2017
All rights reserved. Any or all portions of this document may be reproduced and distributed without prior permission, provided the source is cited as:
Thurlow, M. L., Larson, E. D., Lazarus, S. S., Shyyan, V. V., & Christensen, L. L. (2017). Educators’ experiences with and attitudes toward accessibility features and accommodations. Minneapolis, MN: University of Minnesota, Data Informed Accessibility–Making Optimal Needs-based Decisions (DIAMOND).
A new emphasis on developing general assessments that are more accessible for all students than ever before was a priority of the Race-to-the-Top consortia of states, funded to develop new, technology-based assessments of English language arts/reading and mathematics. In response, two funded consortia—the Partnership for Assessment of Readiness for College and Careers (PARCC) and the Smarter Balanced Assessment Consortium (Smarter Balanced)—developed accessibility frameworks that focused on accessibility for all students, not just those with disabilities (PARCC, 2016; Smarter Balanced, 2016).
Both of the general assessment consortia included three tiers of supports for students, though their names for the tiers differed (Shyyan, Thurlow, Larson, Christensen, & Lazarus, 2016). Additional consortia of states, with funding from other sources (Office of Special Education Programs General Supervision Enhancement Grants for the alternate assessments based on alternate achievement standards and Enhanced Assessments Initiative grants for the English language proficiency assessments), generally followed the three-tier approach, again with specific terminology differing by consortium. Several states that did not belong to consortia also adopted a tiered approach to accessibility supports. The National Center on Educational Outcomes (NCEO) (2016) summarized the approaches of the six assessment consortia, as shown in Table 1.
Table 1. Accessibility Frameworks of the Assessment Consortia
| Accessibility Framework | |||
|---|---|---|---|
| Assessment | For All Participating Studentsa |
For Some Students with Educator Input |
For Few Students
with Documented Needs |
| General Assessmentb | |||
| PARCC | Features for All Students |
Accessibility Features Identified in Advance |
Accommodations |
| Smarter Balanced | Universal Tools | Designated Supports | Accommodations |
| ELP Assessmentc | |||
| ELPA21 | Universal Features | Designated Features | Accommodations |
| WIDA | Accessibility Tools | Accommodations | |
| Alternate Assessmentd | |||
| DLM | Supports Provided Within DLM via PNP |
Supports Requiring Additional Tools/ Materials; Supports Provided Outside the DLM Systeme |
|
| NCSC | Optimal Testing Conditions |
Accessibility Features | Test Accommodations |
a “All Participating Students” refers to the group of students for whom the test was designed (e.g., ELP Assessment is for English learners; Alternate Assessment is for students with significant cognitive disabilities).
b General Assessment Consortia: PARCC—Partnership for Assessment of Readiness for College and Careers; Smarter Balanced—Smarter Balanced Assessment Consortium.
c English Language Proficiency (ELP) Assessment Consortia: ELPA21—English Language Proficiency for the 21st Century; WIDA.
d Alternate Assessment based on Alternate Achievement Standards Consortia: DLM—Dynamic Learning Maps; NCSC—National Center and State Collaborative.
e These were placed here because DLM indicates that these supports require prior planning and setup.
Source: NCEO, 2016.
The paradigm shift represented by the adoption of several tiers of supports for assessments was significant. Prior to the new frameworks, assessment policies had typically allowed only for accommodations, and these usually were only for students with disabilities (those with an Individualized Education Program [IEP] or a 504 accommodation plan). In some states, a number of accommodations had also been allowed for English learners (ELs). Considerable research has documented the challenges that teachers and IEP teams have in selecting accommodations for their students (DeStefano, Shriner, & Lloyd, 2001; Ketterlin-Geller, Alonzo, Braun-Monegan, & Tindal, 2007; Langley & Olsen, 2003; Rhode Island Department of Education, 2003; Shriner & DeStefano, 2003). The recent shift to new accessibility frameworks and the opening up of many of the accessibility features to all students, not just those with disabilities or those who are ELs, have made the decision-making process more complicated and required more educators to make decisions about needed accessibility features and accommodations for greater numbers of students.
To evaluate the experiences that teachers and other decision makers were having with accessibility features and accommodations, as well as their attitudes toward them, an online survey was conducted with educators in nine states. These states were part of an Enhanced Assessment Initiative grant project to promote optimal decision making about accessibility features and accommodations. This project, Data Informed Accessibility—Making Optimal Needs-based Decisions (DIAMOND), received funding in 2015 to collect information that would support the creation of professional development modules for individuals making decisions within the new accessibility frameworks. On the advice of the nine project states (Alabama, Connecticut, Maryland, Michigan, Minnesota, Ohio, the U.S. Virgin Islands, West Virginia, and Wisconsin) and the project’s panel of experts, an educator survey was added to the project activities. Its purpose was to obtain a better understanding of the current state of affairs for educators who were being asked to make decisions about accessibility features and accommodations within the new paradigm.
The online educator survey was developed to collect current information from educators on their experiences with accessibility features and accommodations and their attitudes toward them. Three research questions were addressed through the educator survey:
Top of Page | Table of Contents
With input from the DIAMOND project states, project staff developed a survey to be completed by educators about their experiences with and attitudes toward accessibility features and accommodations. All of the questions were then reviewed by the DIAMOND state representatives and experts and revised based on their comments and suggestions. The final survey was administered online through SurveyMonkey. See Appendix A for a copy of the survey. Although the survey used the term “designated features,” this report uses the more widely known term “accessibility features.”
Personnel from state education agencies in each of the project states received an e-mail providing information about the survey and asking for their assistance in disseminating it. They then shared the link with educators in their states using an IRB-approved e-mail message provided by the project. Educators were asked to complete the survey by the end of June 2016.
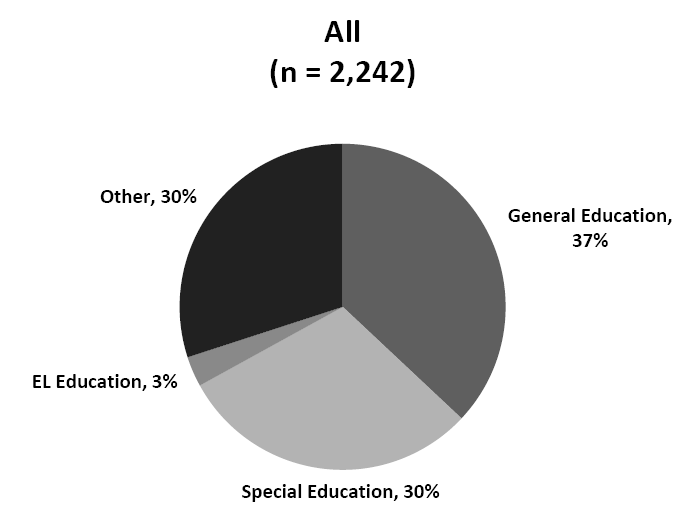
The survey garnered responses from 2,250 participants. None of the questions in the survey had a 100% response rate. The roles of respondents were diverse, with 37% identifying as general education teachers, 30% as special education teachers, and 3% as EL education teachers. Another 30% of participants did not select any of these three professional roles, instead selecting “Other,” which encompassed a wide range of roles (e.g., guidance counselor, school psychologist, or administrator).
Additional information on the educators who responded to the survey is included in Table 2. As evident in the table, most educators, regardless of professional role, had over 10 years of experience and had a master’s degree. More participants worked in elementary schools than in middle and high schools, though working at multiple levels of school was common. General education teachers and other educators were more likely to work in rural areas, special education teachers in suburban areas, and EL education teachers in urban areas. More detailed information on the background of survey respondents is included in Appendix B.
Table 2. Characteristics of Survey Participants
| All | General Education |
Special Education |
EL Education | Other | |
|---|---|---|---|---|---|
| Years of Experience | |||||
| 0-10 | 28% | 30% | 32% | 35% | 19% |
| 11-20 | 38% | 40% | 37% | 34% | 37% |
| 20-30 | 24% | 22% | 21% | 26% | 30% |
| 30+ | 10% | 7% | 10% | 5% | 13% |
| Highest Degree | |||||
| Associate’s | 1% | 1% | 0% | 0% | 1% |
| Bachelor’s | 21% | 31% | 22% | 23% | 7% |
| Master’s | 66% | 61% | 68% | 65% | 70% |
| Ph.D./Ed.D. | 4% | 2% | 2% | 3% | 8% |
| Other | 9% | 6% | 8% | 9% | 14% |
| School Location | |||||
| Rural | 41% | 47% | 34% | 17% | 43% |
| Suburban | 34% | 33% | 42% | 30% | 28% |
| Urban | 22% | 18% | 21% | 50% | 24% |
| Other | 3% | 2% | 3% | 3% | 5% |
| School Level | |||||
| Elementary | 52% | 48% | 50% | 70% | 57% |
| Middle | 34% | 30% | 33% | 39% | 40% |
| High | 32% | 28% | 29% | 31% | 38% |
| Other | 11% | 6% | 8% | 7% | 21% |
Response data collected from SurveyMonkey were aggregated across states. They then were analyzed descriptively to provide a picture of the experiences and attitudes of educators. Descriptive results were compared for general education teachers, special education teachers, EL education teachers, and educators in other professional roles. Because not all educators responded to all questions, the number of responses on which percentages are based is provided for each question. Additionally, because a small number of survey respondents did not select their professional role, the sum of general education teachers, special education teachers, EL education teachers, and other educators who responded to each question is often fewer than the total number of respondents.
Top of Page | Table of Contents
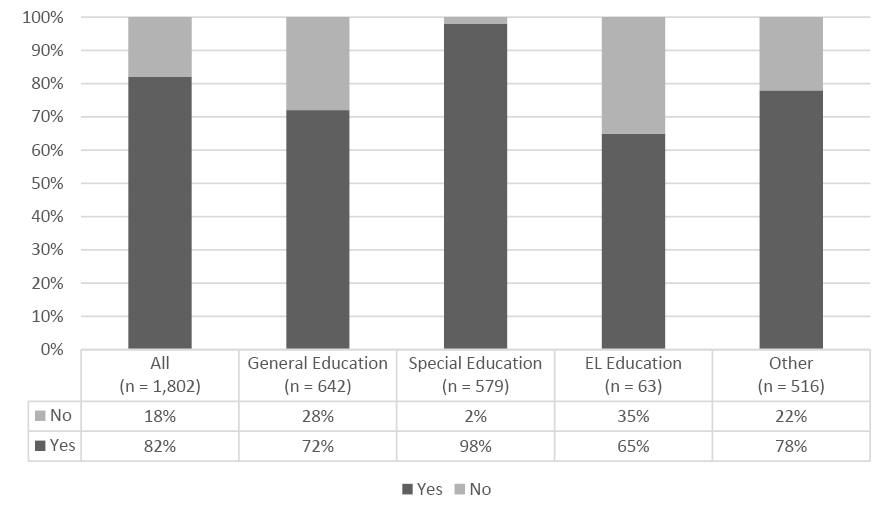
Participation on IEP or 504 teams. Educators were asked several questions about their experiences with accessibility features and accommodations. Overall, most respondents (82%) had been a member of an IEP or 504 team within the past three years (see Figure 1). Special education teachers had the highest rate of participation on IEP or 504 teams (98%), followed by other educators (78%), general education teachers (72%), and EL education teachers (65%).
Figure 1. Membership on an IEP or 504 Team in the Past Three Years
Tracking accommodations and accessibility features. A majority of respondents (74%) indicated that their schools or districts had a way to keep track of accessibility features and accommodations for students without IEPs or 504 plans (see Figure 2). These responses differed by respondent group, with most special education teachers asserting that their schools or districts had a tracking system in place (98%), followed by other educators (78%), general education teachers (72%), and EL education teachers (65%).
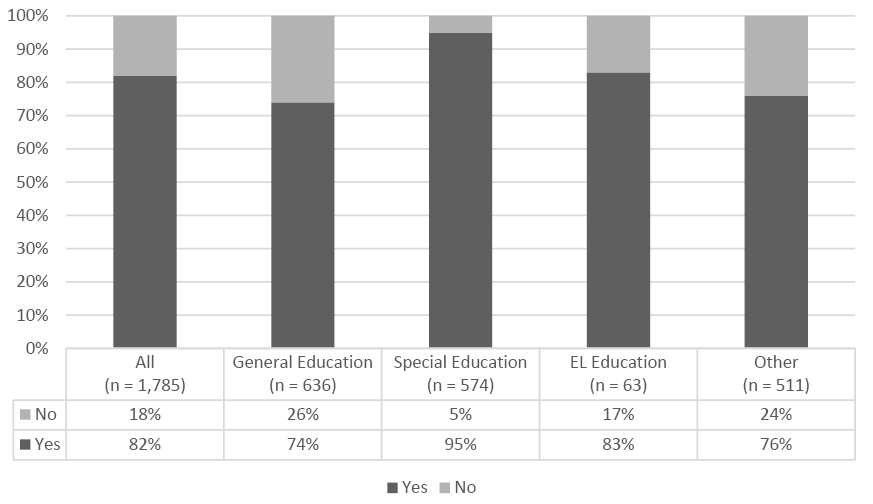
Contributing to decisions about accessibility features and accommodations. Eighty-two percent of respondents reported that they had contributed to making decisions about a student’s accessibility features or accommodations in the past three years (see Figure 3). Special education teachers again had the highest rate of affirmative response (95%), followed by EL education teachers (83%), other educators (76%), and general education teachers (74%).
Figure 2. School or District Has Way to Keep Track of Accessibility Features and Accommodations for Students Without IEPs or 504 Plans
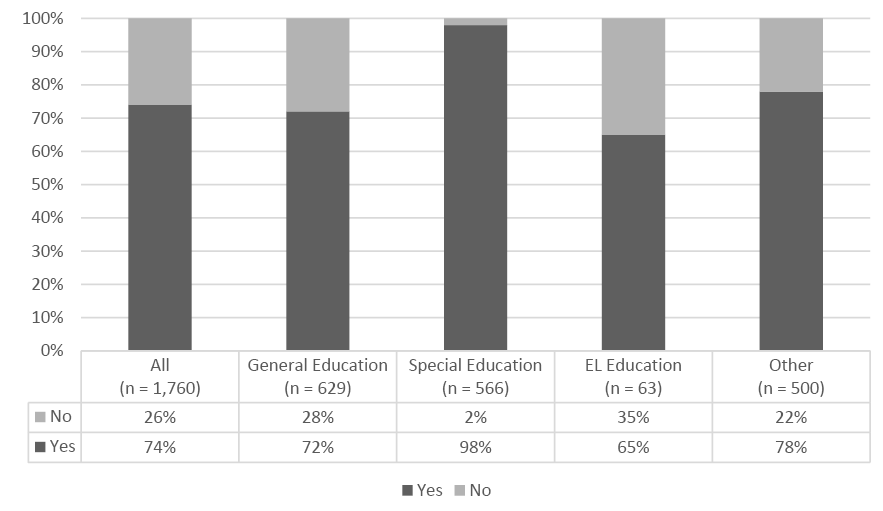
Figure 3. Contributed to Making Decisions About a Student’s Accessibility Features or Accommodations in the Past Three Years
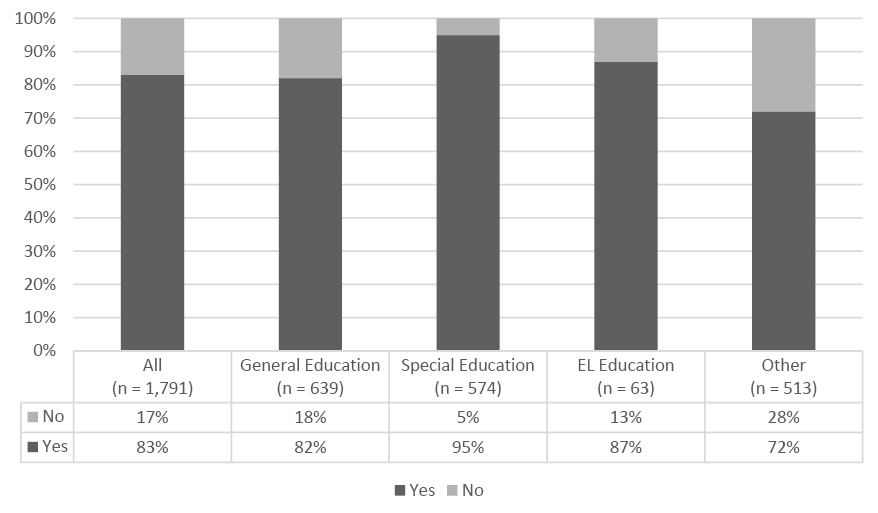
Working with students who use accessibility features or accommodations. Educators’ responses changed only slightly when respondents were asked whether they had worked with students who used accessibility features or accommodations in the past three years: 83% responded Yes (see Figure 4). Special educators responded affirmatively at the highest rate (95%), followed by EL education teachers (87%), general education teachers (82%), and other educators (72%).
Figure 4. Worked With Students Who Used Accessibility Features or Accommodations in the Past Three Years
Role in selecting accessibility features and accommodations. Educators provided open-ended responses to a question about their role in selecting accessibility features and accommodations.
Of the four professional groups surveyed, general education teachers were most likely to collaborate with other educators and parents outside of an IEP team to make decisions about accessibility features and accommodations. They were also most likely to implement accessibility features and accommodations without having a role in the decision-making process.
EL education teachers were more likely than other professional groups to gather information for or make suggestions to an IEP team. EL education teachers also reported that they were the sole decision makers on issues of accessibility and accommodations at a higher rate than any other professional group.
Special education teachers and other educators were more likely than other professional groups to describe their role in selecting accessibility features and accommodations by naming their role as a teacher, case manager, test coordinator, or administrator. Special education teachers and other educators also were most likely to respond to this question by stating that they were members of IEP teams.
Accessibility features and accommodations used in the past three years. Educators were asked to mark all accessibility features and accommodations used by any students with whom they had worked during the past three years. Each of the 32 accessibility features and accommodations listed was available on at least one of the tests developed by the assessment consortia (PARCC, Smarter Balanced, ELPA21, WIDA, DLM, and NCSC).
The 10 most used accessibility features and accommodations, according to the educators responding to the survey, were separate setting (n = 983), extended time (n = 967), human reader (n = 823), student reads test aloud (n = 673), paper-and-pencil test (n = 666), answer masking (n = 661), multiplication table (n = 513), special calculator (n = 479), general masking (n = 478), and scribe (n = 469). Of these 10 most frequently used accessibility features and accommodations, only two were embedded (provided digitally through instructional or assessment technology), while eight were non-embedded (provided non-digitally at the local level).
The list of top 10 accessibility features and accommodations was largely the same for special education teachers, general education teachers, and other educators. Special education teachers had assistive technology in their top 10 (in 10th place), general education teachers had magnification device, test-level zoom, and color contrast in their top 10 (in places 8, 9, and 10), and other educators had special calculator and assistive technology in their top 10 (in places 8 and 10). EL education teachers differed from their special education, general education, and other colleagues in their top 10 most used accessibility features and accommodations. For EL education teachers, the second-most-used tool was native language translation of directions, the fourth was bilingual dictionary, the ninth was unlimited replays of recordings, and the 10th was test-level zoom (see Table 3).
The five least used accessibility features and accommodations were braille writer or notetaker (74 participants), ASL video (91 participants), abacus (92 participants), streamline (97 participants; This accommodation provides a streamlined interface of the test in an alternate, simplified format in which the items are displayed below the stimuli), and human signer (100 participants). Like the most frequently used accessibility features and accommodations, all but two of these were non-embedded.
Table 3. Most Used Accessibility Features and Accommodations
| 1 = Most Used,
10 = 10th Most Used |
All
Respondents (n = 1,151) |
General
Education (n = 367) |
Special
Education (n = 467) |
EL Education
(n = 48) |
Other
(n = 267) |
|---|---|---|---|---|---|
| 1. | Separate Setting | Separate Setting | Separate Setting | Extended Time | Separate Setting |
| 2. | Extended Time | Extended Time | Extended Time | Native Language Translation of directions |
Extended Time |
| 3. | Human Reader | Answer Masking | Human Reader | Separate Setting | Human Reader |
| 4. | Student Reads Test Aloud |
Paper-and- Pencil Test |
Student Reads Test Aloud |
Bilingual Dictionary |
Paper-and- Pencil Test |
| 5. | Paper-and- Pencil Test |
Human Reader | Multiplication Table |
Human Reader | Answer Masking |
| 6. | Answer Masking | Student Reads Test Aloud |
Paper-and- Pencil Test |
Student Reads Test Aloud |
Student Reads Test Aloud |
| 7. | Multiplication Table |
General Masking | Answer Masking | Paper-and- Pencil Test |
Scribe |
| 8. | Special Calculator |
Magnification Device |
Calculator | Answer Masking | Special Calculator |
| 9. | General Masking | Zoom (Test-Level) | Scribe | Unlimited Replays |
General Masking |
| 10. | Scribe | Color Contrast | Assistive Technology |
Zoom (Test- Level) |
Assistive Technology |
Educators responded to four questions about their training on accessibility features and accommodations using a Likert scale: Strongly Agree, Agree, Neutral, Disagree, or Strongly Disagree. They could also choose Not Applicable.
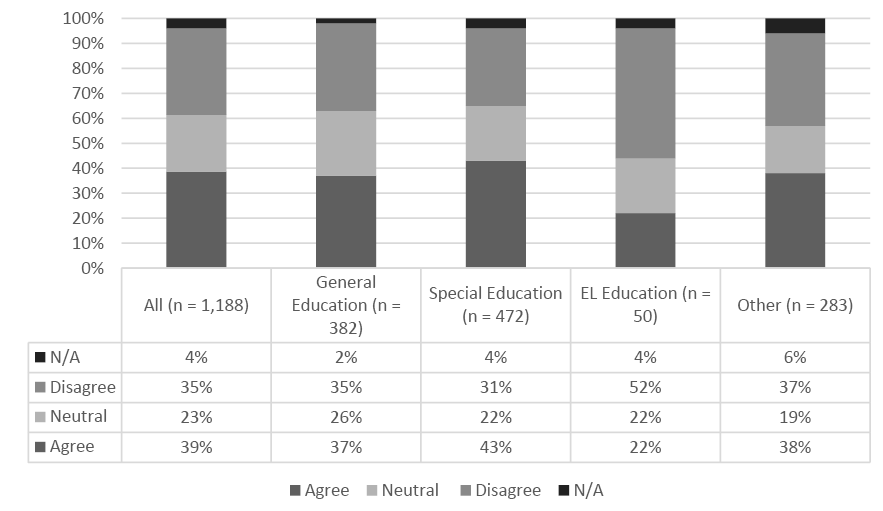
Undergraduate or graduate training. In response to the statement I received helpful training on accessibility features and accommodations during my undergraduate or graduate study, 39% of respondents agreed or strongly agreed, 23% were neutral, and 35% disagreed or strongly disagreed. While responses were largely similar for general education teachers, special education teachers, and other educators, EL education teachers indicated that they were less prepared by their undergraduate or graduate programs. EL education teachers agreed with the statement at a substantially lower rate and disagreed with the statement at a substantially higher rate than participants from other professional roles (see Figure 5).
Figure 5. Received Helpful Training on Accessibility Features and Accommodations During Undergraduate or Graduate Study
In-service professional development. In response to the statement I received helpful professional development on accessibility features and accommodations as a teacher, more participants gave positive responses than negative or neutral responses (see Figure 6). Fifty-two percent agreed or strongly agreed, 23% were neutral, and 24% disagreed or strongly disagreed. EL education teachers agreed with the statement at a lower rate and disagreed with the statement at a higher rate than other participants, but the differences were more moderate than in responses about undergraduate and graduate work.
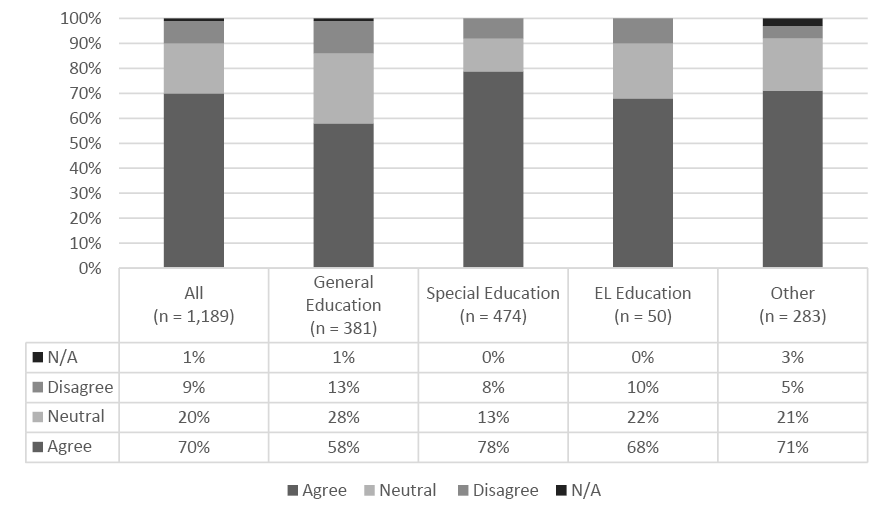
Decision-making confidence. When responding to the statement I feel confident about making accessibility features and accommodation decisions, 70% of respondents agreed or strongly agreed, 20% were neutral, and 9% disagreed or strongly disagreed (see Figure 7). Special education teachers were the most confident about their decision making, followed by other educators, EL education teachers, and general education teachers.
Figure 6. Received Helpful Professional Development on Accessibility Features and Accommodations as a Teacher
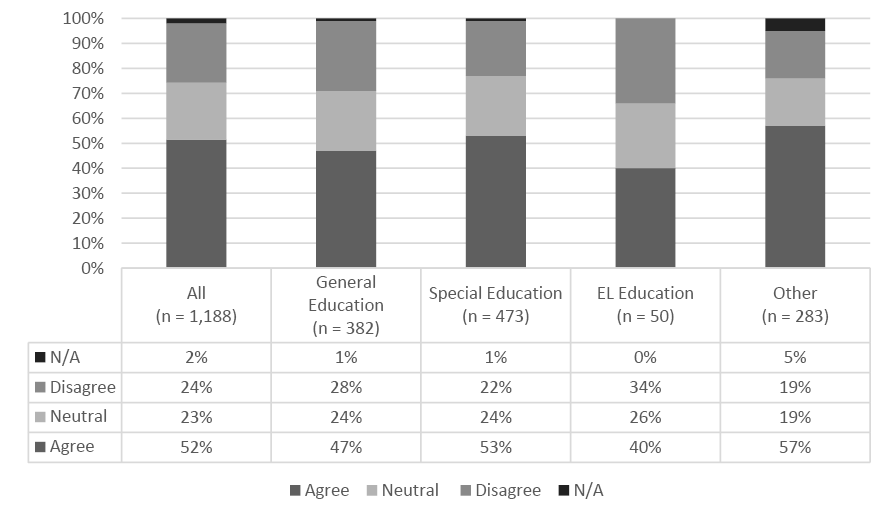
Figure 7. Feel Confident About Making Accessibility and Accommodation Decisions
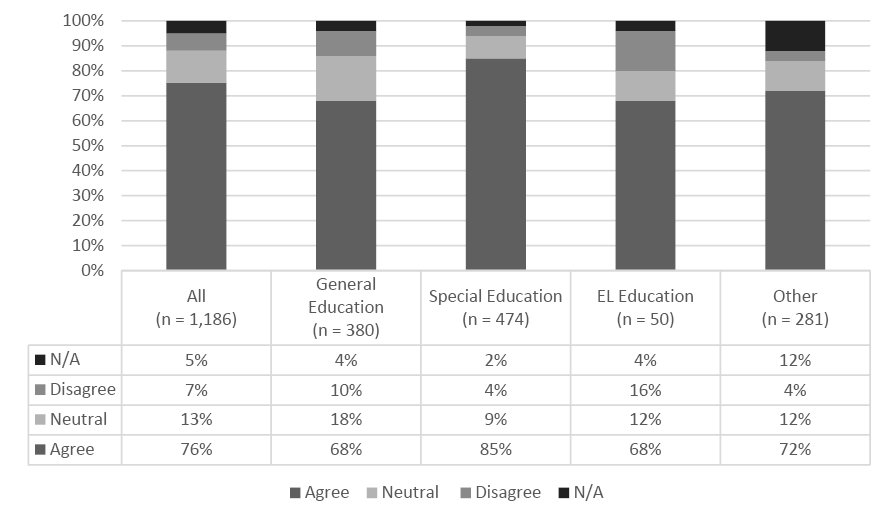
Consistency between instructional and test accessibility features and accommodations. Responses to the statement I regularly have my students use the same accessibility features and accommodations in class that they use on the test were generally positive (see Figure 8). Seventy-six percent agreed or strongly agreed with the statement, 13% were neutral, and 7% disagreed or strongly disagreed. Special education teachers agreed with the statement at the highest rate, followed by other educators, EL education teachers, and general education teachers.
Figure 8. Students Regularly Use the Same Accessibility Features and Accommodations in Class and on Test
Educators participating in the survey read five statements about their attitude toward accessibility features and accommodations. For each one, they indicated their agreement using a Likert scale: Strongly Agree, Agree, Neutral, Disagree, or Strongly Disagree.
Positive impact on student’s education. Most respondents indicated agreement with the statement Accessibility features and accommodations have a positive impact on the education of those who use them (see Figure 9). Eighty-eight percent agreed or strongly agreed, compared to 10% who were neutral and 2% who disagreed or strongly disagreed. Special education teachers and other educators agreed at the highest rate (91%), followed by EL education teachers (88%) and general education teachers (82%).
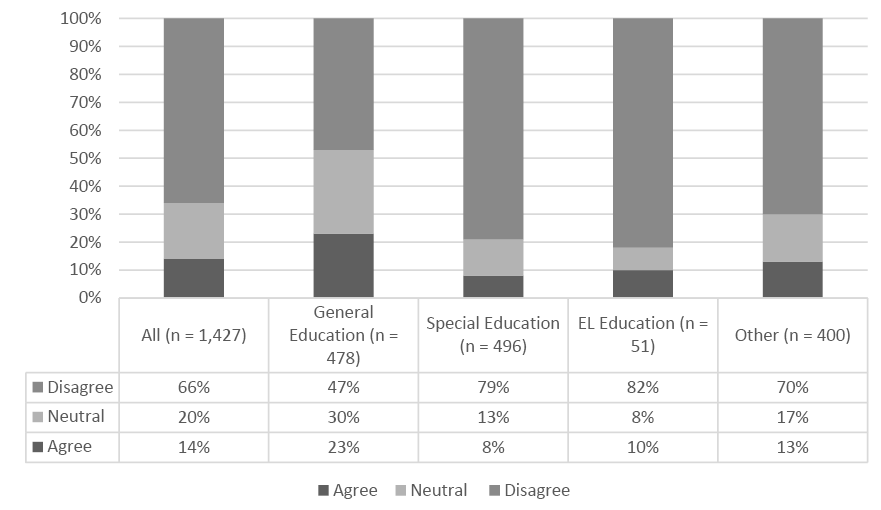
Unfair advantage. Educators gave the statement Accessibility features and accommodations give some students an unfair advantage largely negative responses (see Figure 10). Fourteen percent agreed or strongly agreed, 20% were neutral, and 66% disagreed or strongly disagreed. EL educators disagreed with the statement at the highest rate (82%), followed by special education teachers (79%), other educators (70%), and general education teachers (47%).
Figure 9. Accessibility Features and Accommodations Have a Positive Impact on the Education of Those Who Use Them
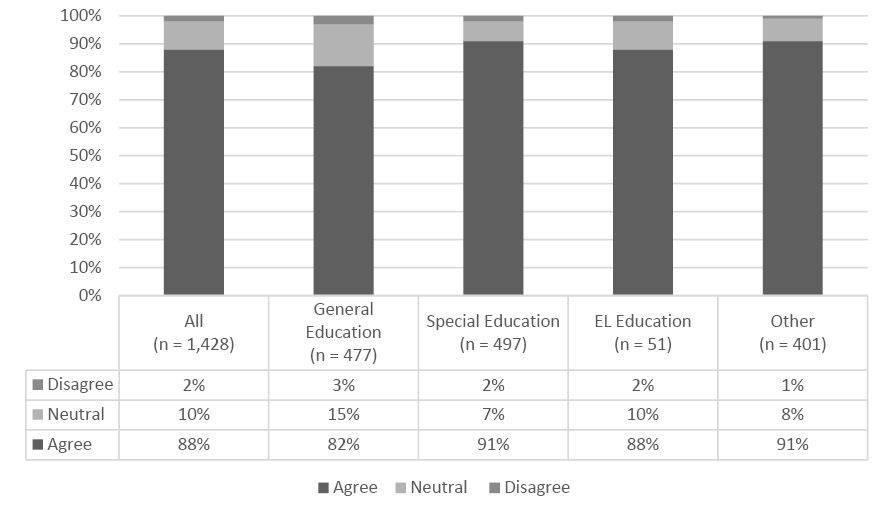
Figure 10. Accessibility Features and Accommodations Give Some Students an Unfair Advantage
Optimal accessibility features and accommodations. In response to the statement Students usually receive the optimal accessibility features and accommodations, 57% agreed or strongly agreed, 28% were neutral, and 16% disagreed or strongly disagreed (see Figure 11). Special education teachers agreed at the highest rate (60%), followed by other educators (56%), general education teachers (55%), and EL educators (51%).
Figure 11. Students Usually Receive the Optimal Accessibility Features and Accommodations

Value of implementation on assessments. A large proportion of respondents gave an affirmative answer to the statement Implementing accessibility features and accommodations on assessments is a worthwhile use of my time, with 84% agreeing or strongly agreeing, 14% neutral, and 3% disagreeing or strongly disagreeing (see Figure 12). The group with the highest rate of agreement was special education teachers (90%), followed by other educators (87%), EL education teachers (84%), and general education teachers (74%).
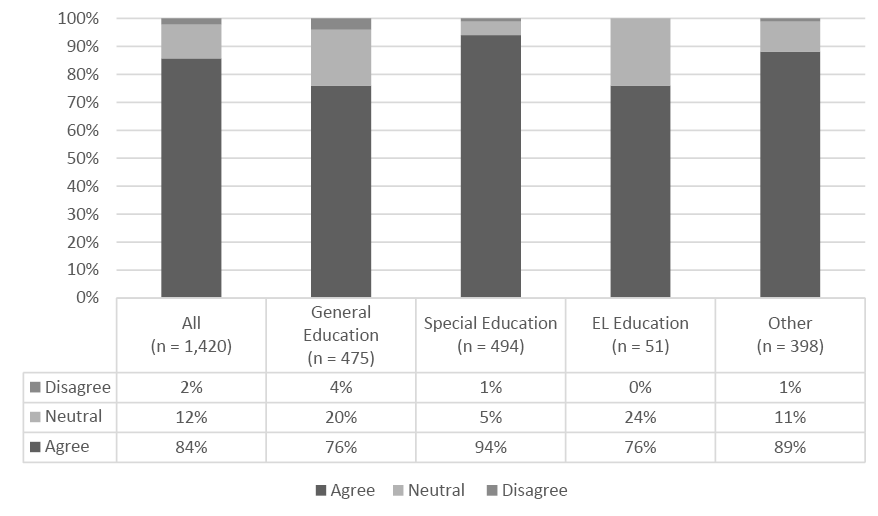
Value of implementation during instruction. Similar responses were given to the statement Implementing accessibility features and accommodations during instruction is a worthwhile use of my time (see Figure 13). Eighty-four percent of respondents agreed or strongly agreed, 12% were neutral, and 2% disagreed or strongly disagreed with the statement. Special education teachers (94%), other educators (89%), and general education teachers (76%) agreed at a slightly higher rate than for the question about assessments, while EL educators had a lower rate of agreement at 76%.
Figure 12. Implementing Accessibility Features and Accommodations on Assessments is a Worthwhile Use of Time
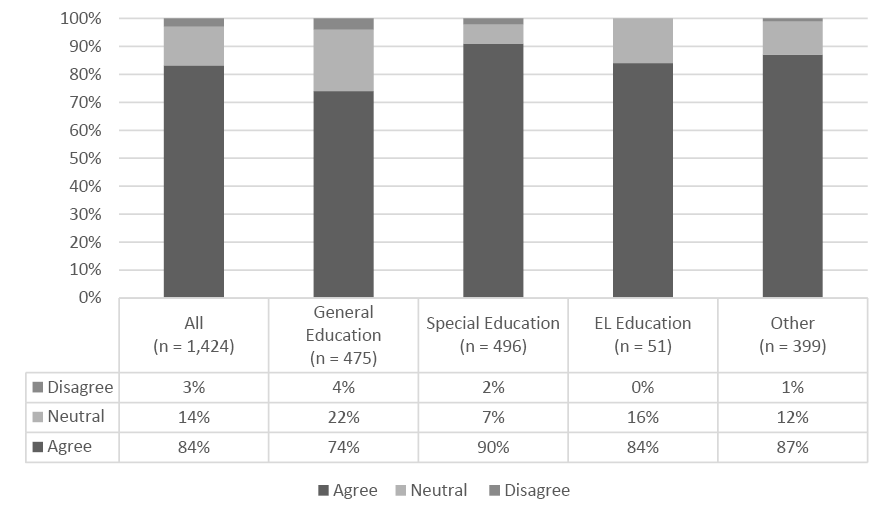
Figure 13. Implementing Accessibility Features and Accommodations During Instruction is a Worthwhile Use of Time
Top of Page | Table of Contents
This study was conducted to document (a) the experiences that teachers and other decision makers are having with accessibility features and accommodations, and (b) their attitudes toward those accessibility features and accommodations. Using an online survey sent to educators in nine states, the study obtained a total of 2,250 responses. Most of the respondents were general educators (37%), followed closely by special educators (30%) and other educators (e.g., administrators) (30%). Only 3% of respondents were EL education teachers.
There were noticeable differences in the responses of special educators and the other professional groups to the survey questions. Special education personnel tended to be more familiar with accessibility features and accommodations, and were more likely to have contributed to decisions about accessibility features and accommodations. They were also more likely than other professional groups to have participated in IEP or 504 team decisions about accessibility features and accommodations.
The most frequently used accessibility features and accommodations noted by EL education teachers were generally different from those noted by special education teachers, general education teachers, and other educators. EL education teachers more often identified several linguistic accessibility features and accommodations, specifically native language translation of directions and bilingual dictionary, whereas these did not appear in the top 10 accessibility features and accommodations of other groups. Across all respondents, the most frequently noted accessibility features and accommodations were separate setting, extended time, human reader, student reads test aloud, paper-and-pencil test, answer masking, multiplication table, special calculator, general masking, and scribe. It is noteworthy that only two of these features or accommodations are provided digitally through instructional or assessment technology.
Only about one-third of respondents indicated that they had been provided helpful training on accessibility features and accommodations during their undergraduate or graduate study. Of EL educators, only around 20% indicated that they had received this training in their undergraduate or graduate study. More educators (over one-half) indicated that they had received in-service professional development on accessibility features and accommodations. Still, EL education teachers were less likely to indicate that this was the case, with 40% indicating that they had received in-service training on the topic.
Despite the apparent lack of training and professional development, over 70% of respondents felt confident about making decisions about accessibility features and accommodations. Even among general education teachers, who had the lowest confidence level overall, 58% felt confident about making these decisions.
The majority of educators, regardless of group, also agreed that accessibility features and accommodations had a positive impact on student’s education. Still, some educators thought that accessibility features and accommodations gave some students an unfair advantage. This perspective was most often given by general education teachers. Despite this concern, all educator groups generally believed that implementing accessibility features and accommodations during assessments and during instruction was a worthwhile use of their time.
The results of the educator survey suggest that there continues to be a need for training and professional development on accessibility features and accommodations. This need for training and professional development may be more pressing for EL education teachers than for other professional groups. Because the Every Student Succeeds Act (ESSA) now stipulates that ELs are eligible for accommodations, EL education teachers need to be informed about all of the accessibility features and accommodations available to their students.
The survey results also point to a need for further investigation of how educators are making their decisions about accessibility features and accommodations and how they are implementing them during instruction. Of particular interest should be the approaches successfully used by general and EL education teachers, two groups of educators who seem to be more challenged by the new accessibility frameworks. Examples of successful practices observed during research can then be integrated into training and professional development opportunities.
Top of Page | Table of Contents
DeStefano, L., Shriner, J. G., & Lloyd, C. A. (2001). Teacher decision making in participation of students with disabilities in large-scale assessment. Exceptional Children, 68(1), 7–22.
Ketterlin-Geller, L. R., Alonzo, J., Braun-Monegan, J., & Tindal, G. (2007). Recommendations for accommodations: Implications of (in)consistency. Remedial and Special Education, 28(4), 194–206.
Langley, J., & Olsen, K. (2003). Training district and state personnel on accommodations: A study of state practices, challenges, and resources. Washington, DC: Council of Chief State School Officers.
NCEO. (2016). Making accessibility decisions for ALL students (NCEO Brief 11). Available at http://www.cehd.umn.edu/NCEO/OnlinePubs/briefs/brief11/NCEOBrief11.pdf
PARCC. (2016, August). PARCC accessibility features and accommodations manual (5th ed.). Available at http://www.parcconline.org/assessments/accessibility/manual
Rhode Island Department of Education. (2003). Rhode Island assessment accommodation study: Research summary. Minneapolis, MN: University of Minnesota, National Center on Educational Outcomes. Retrieved from www.nceo.info/TopicAreas/Accommodations/RhodeIsland/htm
Shriner, J. G., & DeStefano, L. (2003). Participation and accommodation in state assessment: The role of individualized education programs. Exceptional Children, 69(2), 147–161.
Shyyan, V. V., Thurlow, M. L., Larson, E. D., Christensen, L. L., & Lazarus, S. S. (2016). White paper on common accessibility language for states and assessment vendors. Minneapolis, MN: University of Minnesota, Data Informed Accessibility—Making Optimal Needs-based Decisions (DIAMOND).
Smarter Balanced. (2016, July). Usability, accessibility, and accommodations guidelines. Available at http://www.smarterbalanced.org/assessments/accessibility-and-accommodations/
Top of Page | Table of Contents
INTRODUCTION
The Data Informed Accessibility—Making Optimal Needs-based Decisions (DIAMOND) project is a collaboration between nine states and the National Center on Educational Outcomes. The project’s goal is to improve the validity of assessments for students with documented needs by developing guidelines for making informed decisions about accessibility features and accommodations.
By participating in this survey, you will be helping DIAMOND complete the first research activity, which will have a great impact on the rest of the project. The following questions about your professional experiences and opinions about accessibility features and accommodations should take around 30 minutes to complete. We thank you for your participation!
EDUCATOR’S GENERAL EXPERIENCE
1. What is your position at your school?
2. What grade(s) do you teach? Please mark all that apply:
3. What subject(s) do you teach?
4. How many years of teaching experience do you have?
5. What is your highest degree?
CHARACTERISTICS OF YOUR SCHOOL
6. In which state do you teach?
7. Which of the following best describes your school’s location?
8. Which of the following best describes the level of your school? Please mark all that apply:
9. Do you work at a public, private, or charter school?
10. If applicable, what is the approximate size of your school district?
11. What is the approximate size of your school?
12. Approximately how many students at your school are English learners?
13. Approximately how many students at your school receive special education services?
14. Approximately how many students at your school receive free or reduced lunch?
EDUCATOR’S FAMILIARITY WITH ACCESSIBILITY FEATURES AND ACCOMMODATIONS
Many states and consortia use a three-tiered approach to categorize accessibility features and accommodations. The three tiers can have different names, but here we will call them universal features, designated features, and accommodations.
Universal features are accessibility supports that are available to all students as they access instructional or assessment content. They may be either embedded and provided digitally through instructional or assessment technology (e.g., answer choice eliminator) or non-embedded and provided non-digitally at the local level (e.g., scratch paper).
Designated features are accessibility supports that are available for any student for whom the need has been indicated by an educator (or team of educators including the parents/guardians and the student if appropriate) who are familiar with the student’s characteristics and needs. Embedded designated features (e.g., color contrast) are provided digitally through instructional or assessment technology, while non-embedded designated features (e.g., magnification device) are provided locally.
Accommodations are changes in procedures or materials that ensure equitable access to instructional and assessment content and generate valid assessment results for students who need them. Embedded accommodations (e.g., text-to-speech) are provided digitally through instructional or assessment technology, while non-embedded designated features (e.g., scribe) are provided locally. Accommodations are generally available for students for whom there is documentation of need on an Individualized Educational Plan (IEP) or 504 accommodation plan, although some states also offer accommodations for English learners (ELs).
For students with an IEP or 504 Plan, their IEP or 504 team should make decisions about which designated features and accommodations need to be provided. Some states and consortia use a Personal Needs Profile (PNP), an Individual Student Assessment Accessibility Profile (ISAAP), or other similar tools to document which designated features and accommodations each student needs.
15. Have you been a member of an IEP or 504 team in the past three years?
16. Does your school or district have a way to keep track of accessibility features and accommodations for students without IEPs or 504 Plans?
17. Have you contributed to making decisions about a student’s designated features or accommodations in the past three years?
18. Have you worked with students who used designated features or accommodations in the past three years?
ACCESSIBILITY FEATURES AND ACCOMMODATIONS
19. What is your role in selecting the designated features or accommodations?
20. Which designated features and accommodations did the students use on assessments? Please mark all that apply.
Note that there are two columns for you to mark your answer. Mark the column on the left if students use the accommodation or designated feature on standardized state or national tests. Mark the column on the right if the students use the accommodation or designated feature during instructional activities including classroom tests. The descriptions are only for your reference. You do not have to read through all of them.
| Name of Support |
Description | My student uses this support on assessments |
My student uses this support during instruction |
|---|---|---|---|
| Embedded Designated Supports | |||
| Answer masking |
The student is able to block off answer choices. | ||
| Color contrast | The student is able to adjust the text color and screen background color based on the student’s need. |
||
| General masking |
The student is able to block off content that is not of immediate need or that may be distracting. Masking allows students to hide and reveal individual answer options, as well as all navigational buttons and menus. The student is able to focus his/her attention on a specific part of a test item by masking. |
||
| Line reader | The student is able to use this feature as a guide when reading text. |
||
| Print on request/Print on demand |
The student uses paper copies of individual test items. |
||
| Turn off universal features |
This feature allows disabling any universal feature that might interfere with student performance, or be distracting to the student. |
||
| Zoom (test- level) |
The test platform is pre-set to be enlarged for the student before the test begins. |
||
| Non-Embedded Designated Supports | |||
| Bilingual dictionary |
A bilingual/dual language word-to-word dictionary is provided to the student as a language support. |
||
| Color contrast | Test content of online items may be printed with different colors. |
||
| Color overlay | The student is able to overlay a semitransparent color onto paper-based test content. |
||
| Magnification device |
The student adjusts the size of specific areas of the screen (e.g., text, formulas, tables, and graphics) with an assistive technology device. Magnification allows increasing the size to a level not provided for by the zoom universal feature. |
||
| Native language Translation of directions |
Translation of general test directions (not item prompts or questions) is a language support available to students prior to starting the actual test. Test directions can be provided either by being read aloud or signed by a test administrator who is fluent in the language. Translations may be provided by a human or the test platform. |
||
| Noise buffer | The student uses noise buffers to minimize distraction or filter external noise during testing. Any noise buffer must be compatible with the requirements of the test. |
||
| Paper-and- pencil test |
The student takes a paper-and-pencil version of the test. |
||
| Read aloud | The student has test content that is provided by an audio file in a computer-based test, read by a qualified human reader. |
||
| Separate setting | Test location is altered so that the student is tested in a setting different from that made available for most students. |
||
| Student reads test aloud |
The student reads the test content aloud. This feature must be administered in a one-on-one test setting. |
||
| Embedded Accommodations | |||
| American Sign Language (ASL) |
Test content is translated into ASL video. ASL human signer and the signed test content are viewed on the same screen. Students may view portions of the ASL video as often as needed. |
||
| Closed captioning |
Printed text that appears on the computer screen as audio materials are presented. |
||
| Streamline | This accommodation provides a streamlined interface of the test in an alternate, simplified format in which the items are displayed below the stimuli. |
||
| Unlimited re-recordings |
The student is able to rerecord answers in
the speaking domain an unlimited number of times. |
||
| Unlimited replays |
The student is able to replay items in the listening domain an unlimited number of times. |
||
| Non-Embedded Accommodations | |||
| Abacus | This accommodation may be used in place of scratch paper for students who typically use an abacus. |
||
| Assistive technology |
The student is able to use assistive technology, which includes such supports as typing on customized keyboards, assistance with using a mouse, mouth or head stick or other pointing devices, sticky keys, touch screen, and trackball, speech-to-text conversion, or voice recognition. |
||
| Braille | A raised-dot code that individuals read with the fingertips. Graphic material (e.g., maps, charts, graphs, diagrams, and illustrations) is presented in a raised format (paper, thermoform, or refreshable braille). Both contracted and un-contracted braille (English Braille, American Edition) are available; Unified English Braille will be adopted for future assessments. Nemeth code is available for math. |
||
| Large print test booklet |
A large print form of the test that is provided to the student with a visual impairment. |
||
| Multiplication table |
A paper-based single digit (1-9) multiplication table is available to the student. |
||
| Scribe | The student dictates her/his responses to an experienced educator who records verbatim what the student dictates. |
||
| Speech-to- text |
The student uses an assistive technology device to dictate responses or give commands during the test. |
||
21. Please respond to the following items:
| Strongly Agree |
Agree | Neutral | Disagree | Strongly Agree |
N/A | |
|---|---|---|---|---|---|---|
| I received helpful training on accessibility features and accommodations during my undergraduate or graduate study |
||||||
| I received helpful professional development on accessibility features and accommodations as a teacher. |
||||||
| I feel confident about making accessibility feature and accommodations decisions for my students. |
||||||
| I regularly have my students use the same accessibility features and accommodations in class that they use on the test. |
Comments:
EDUCATOR’S ATTITUDE TOWARDS ACCESSIBILITY FEATURES AND ACCOMMODATIONS
22. Please respond to the following items:
| Strongly |
Agree |
Neutral |
Disagree |
Strongly |
|
|---|---|---|---|---|---|
Accessibility features and |
|||||
Accessibility features and |
|||||
Students usually receive |
|||||
Implementing accessibility |
|||||
Implementing accessibility |
Comments:
EDUCATOR’S WILLINGNESS TO PARTICIPATE IN OTHER DIAMOND ACTIVITIES
23. Would you be interested in participating in an online focus group to discuss the benefits and challenges of accessibility features and accommodations?
Participants will receive a gift card to a local store.
Any questions can be directed to [contact information omitted].
24. Would you be interested in being interviewed about your experience with accessibility features and accommodations?
Participants will receive a gift card to a local store.
Any questions can be directed to [contact information omitted].
Top of Page | Table of Contents
GENERAL EXPERIENCE
Current Position. Educators were asked about their position in their school. Thirty-seven percent indicated that they were general education teachers. An additional 30% were special education teachers and 3% were EL education teachers. The remaining 30% selected “Other.” The following professional roles are representative of the participants’ responses:
Figure B-1. What is your position at your school?
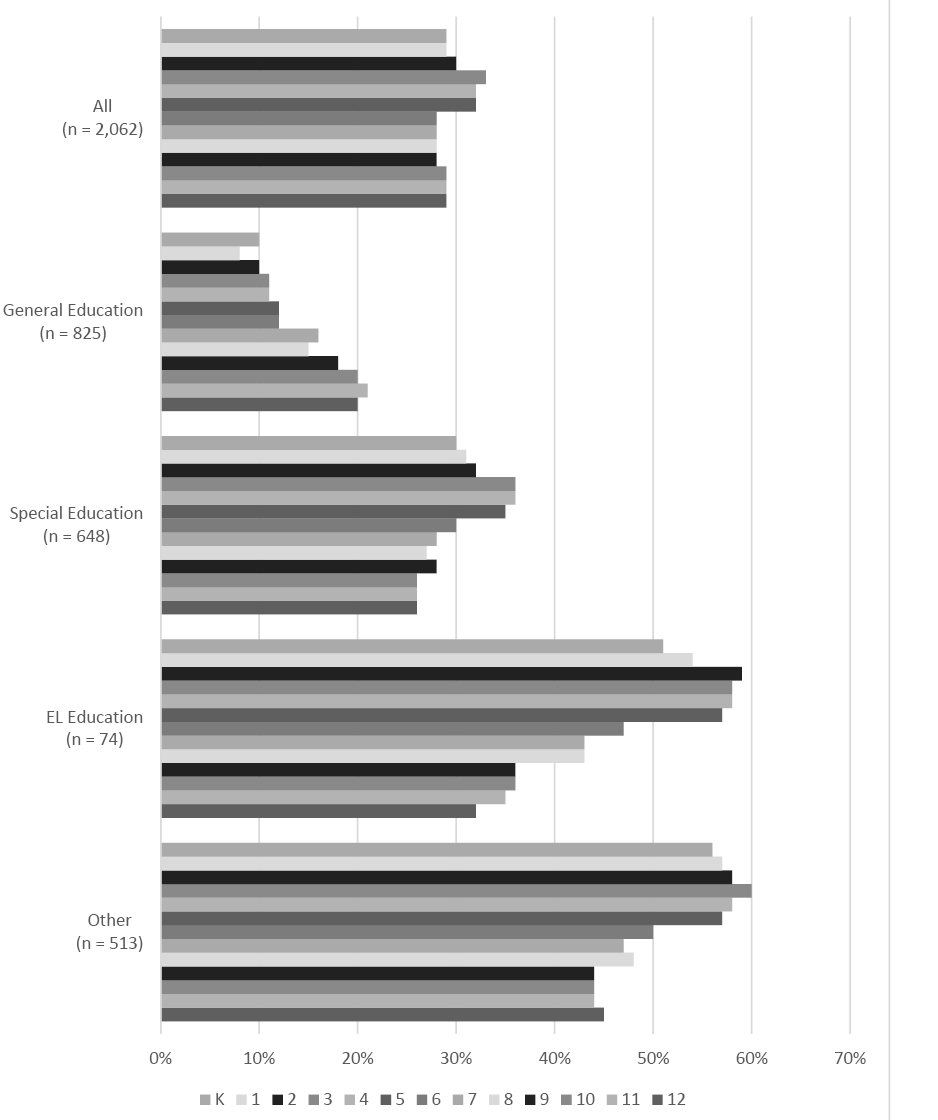
Grades Taught. Survey participants indicated which grades they taught (see Figure B-2). They could select more than one response. The responses were evenly distributed across the 13 grades. All grades were represented, with between 28% and 33% of respondents indicating each grade.
Other educators worked with multiple grades at the highest rate. Between 50% and 60% of other educators worked with each of the grades in elementary school. The percentage of other educators who worked with the grades in middle and high school was lower, between 40% and 50%.
EL education teachers had the next highest rate of teaching multiple grades. Between 50% and 60% taught each of the grades in elementary school, between 40% and 50% taught each of the grades in middle school, and between 30% and 40% taught each of the grades in high school.
Special education teachers were slightly more concentrated in specific grades. Over 30% taught each of the grades in elementary school, and below 30% taught each of the grades in middle and high school.
General education teachers were the most limited to a specific grade. Less than 12% taught each of the grades in elementary school, less than 16% taught each of the grades in middle school, and less than 21% taught each of the grades in high school.
Subjects Taught. Participants also indicated the subjects they teach. The responses generally fell into categories based on respondents’ self-identification as general education, special education, or EL education teachers.
General education teachers in elementary schools reported that they taught all subjects, while general education teachers in middle and high schools taught one or two specific subjects: English language arts, math, science, social studies, or foreign languages.
Special education teachers in elementary and middle schools tended to teach all subjects, while special education teachers at the high school level were more or less evenly divided between those who were generalists and those who were specialists in one or two subjects.
EL education teachers at all levels generally did not mention core academic subjects at all. The majority of elementary, middle, and high school EL education teachers simply wrote that they taught English as a second language or bilingual education.
Those respondents who did not identify as general education, special education, or EL education teachers responded to this question in varied ways. Some responses reflected the identified position of the person, such as administration, counseling, speech and language, or non-core subjects (e.g., art, music, physical education). A limited number of these respondents said that they taught core subjects.
Figure B-2. What grades do you teach?
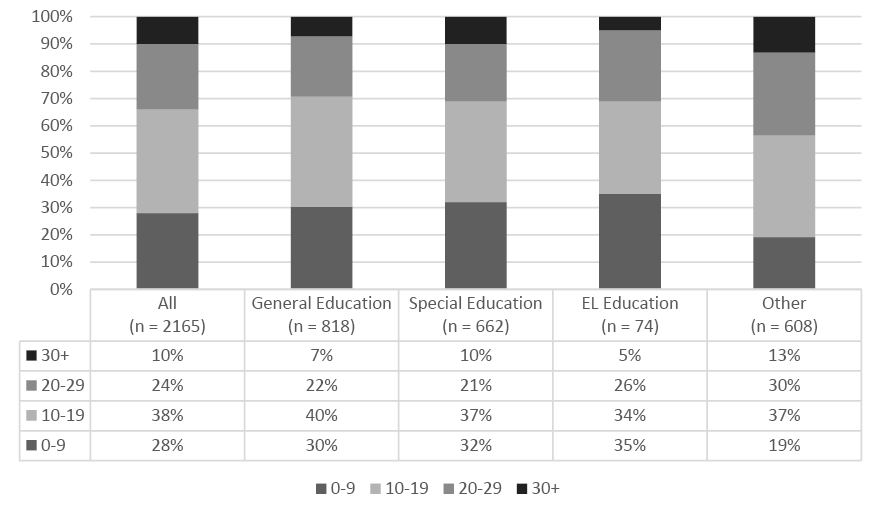
Years of Experience. The survey asked respondents to enter their number of years of teaching experience (see Figure B-3). These responses ranged from 0 to 54 years. Twenty-eight percent had between 0 and 9 years of teaching experience, 38% had 10 to 19 years of teaching experience, 24% had between 20 and 29 years of teaching experience, and 10% had 30 years of experience or more. Responses were largely similar for general education, special education, and EL education teachers, while other educators had the most experience as a group.
Figure B-3. How many years of teaching experience do you have?
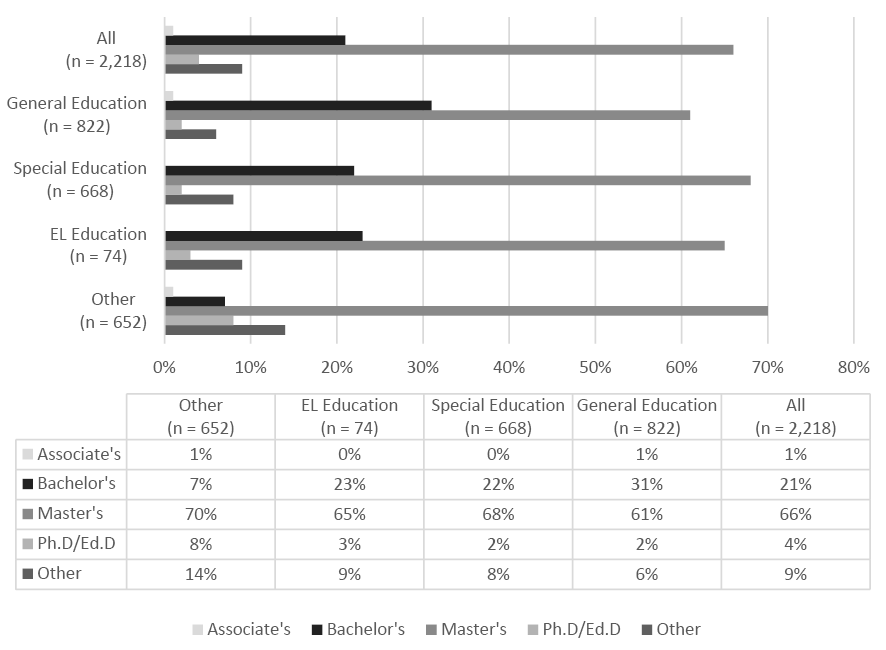
Highest Degree. Survey participants were asked to identify their highest degree (see Figure B-4). Sixty-six percent of respondents had a master’s degree, 21% had a bachelor’s degree, 4% had a doctoral degree, and 1% had an associate’s degree. The most common responses for the 9% of respondents who selected “Other” were education specialist degree and sixth-year degree in special education. Responses were largely similar across professional roles.
Figure B-4. What is your highest degree?
CHARACTERISTICS OF SCHOOL
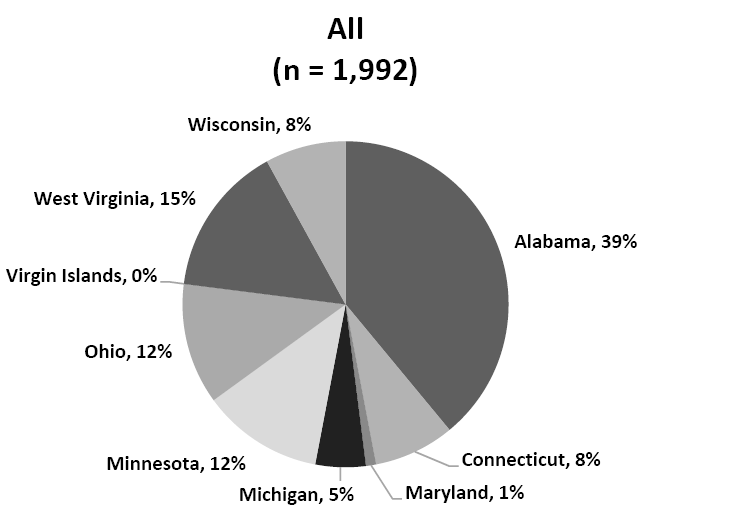
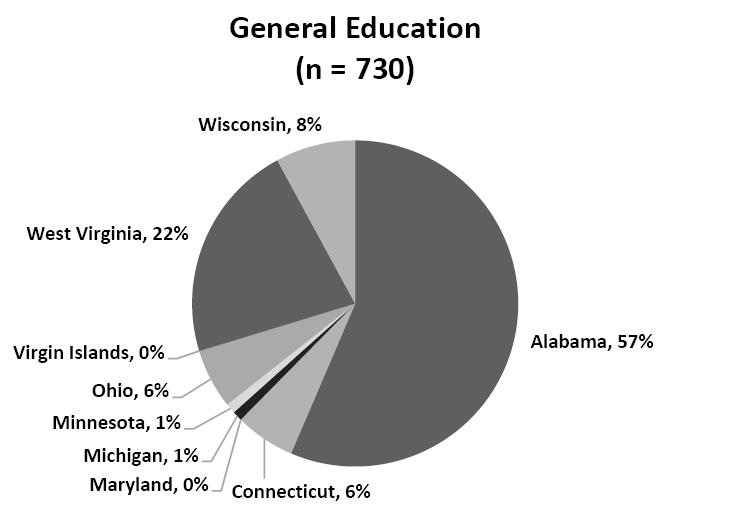
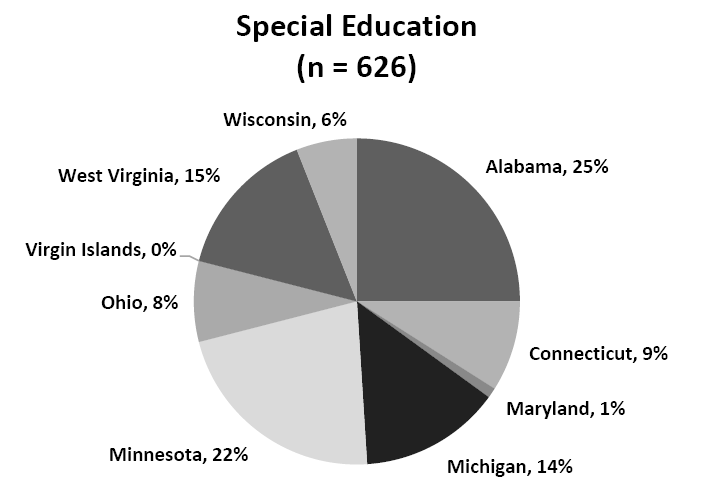
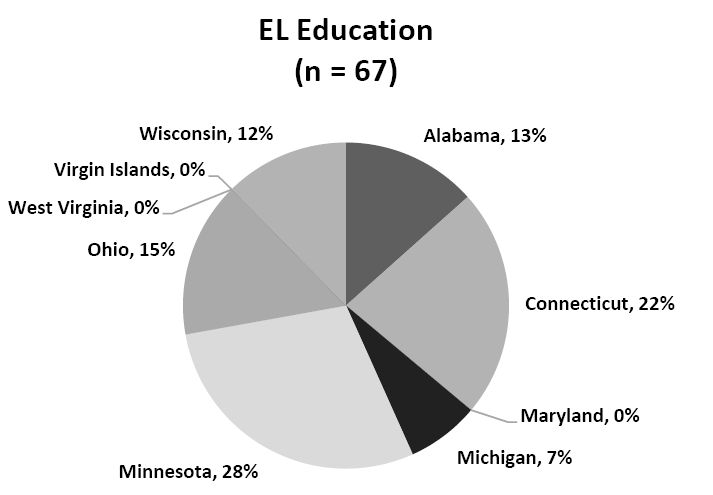
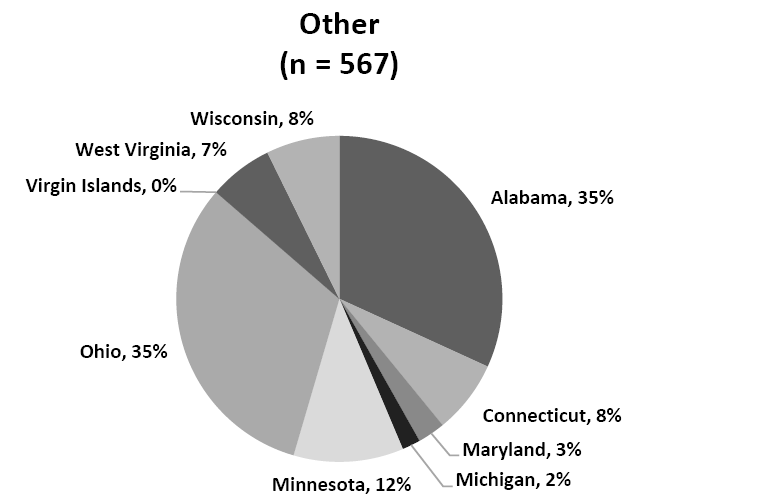
State. Educators from the nine DIAMOND states participated at different rates (see Figure B-5). Alabama educators accounted for almost 39% of all respondents, more than double that of the next highest state. The percentage of respondents from the other states were, in descending order, West Virginia (15%), Ohio (12%), Minnesota (12%), Connecticut (8%), Wisconsin (8%), Michigan (5%), Maryland (1%), and the U.S. Virgin Islands (less than 1%).
The concentration of participants in a few states varied by professional role. Sixty-two percent of special education teachers were concentrated in three states, as were 65% of EL education teachers and 72% of other educators. Eighty-seven percent of general education teachers were concentrated in three states, and 57% taught in just one state, Alabama.
Figure B-5. In which state do you teach?
School Location. Survey participants were asked to describe their school’s location (see Figure B-6). Forty-one percent of respondents worked in rural schools, while 34% worked in suburban schools and 22% worked in urban schools. Those who selected “Other” replied that they were educators for online schools, schools in small towns, or schools that bridge rural and suburban or suburban and urban areas.
General education teachers and other educators were most likely to teach in rural areas. Special education teachers were most likely to teach in suburban areas, while EL education teachers were most likely to teach in urban areas.
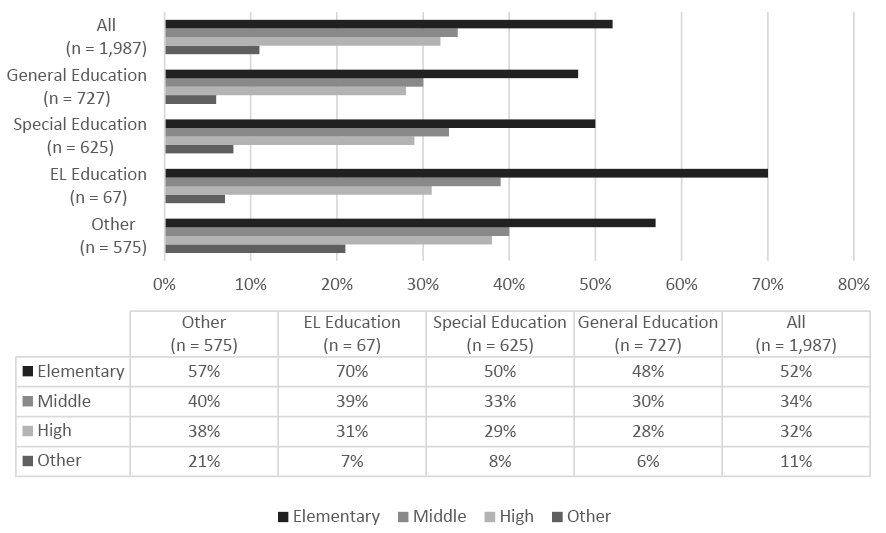
School Level. Survey participants were asked to mark the level of the school or schools were they worked (see Figure B-7). They could choose more than one response. Over half (51%) of respondents taught at the elementary level. Middle school educators accounted for 34% of respondents and high school educators for 32%. The most common responses for those who selected “Other” were working at a school with combined elementary, middle, or high school education or working at the district level.
Largely the same pattern of responses existed for all professional roles, with most educators teaching at the elementary school level, followed by the middle school level and high school level.
Figure B-6. Which of the following best describes your school’s location?
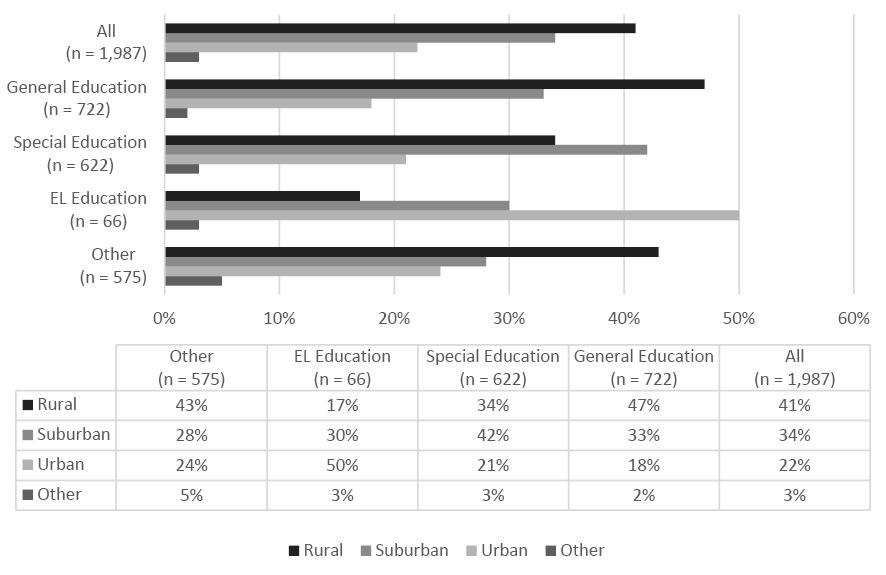
Figure B-7. Which of the following best describes the level of your school?
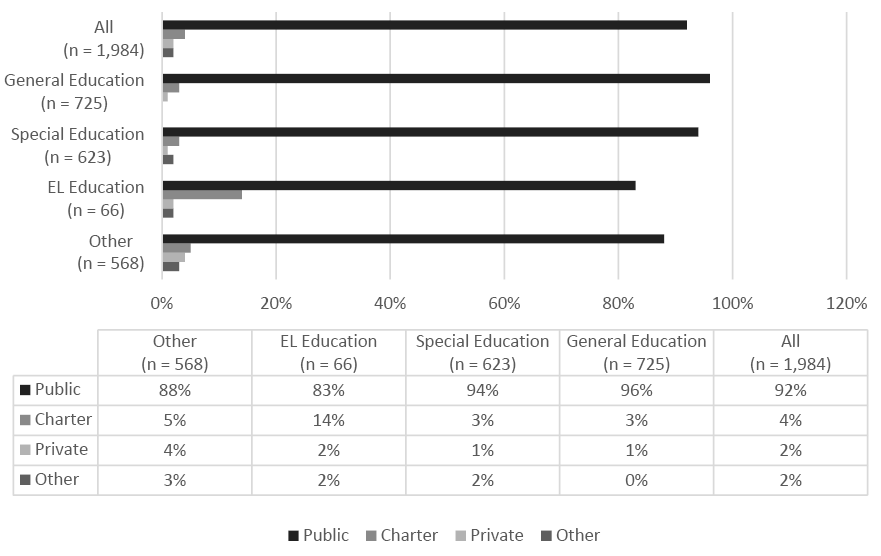
School Type. Survey participants were asked to categorize their school as public, private, or charter (see Figure B-8). The overwhelming majority of respondents worked for public schools (92%), followed by charter schools (4%) and private schools (2%). This pattern held across all professional roles.
Figure B-8. Do you work at a charter, private, or public school?
School District Size. Educators participating in the survey were asked to provide the approximate size of their school district (see Figure B-9). Two percent worked in school districts with less than 250 students, 11% in districts of 250-999, 15% in districts of 1,000-1,999, 26% in districts of 2,000-4,999, 19% in districts of 5,000-9,999, and 27% in districts of 10,000 or more.
Special education teachers, EL education teachers, and other educators were most likely to work in districts of 10,000 students or more, while general education teachers were most likely to work in districts of 2,000 to 4,999 students.
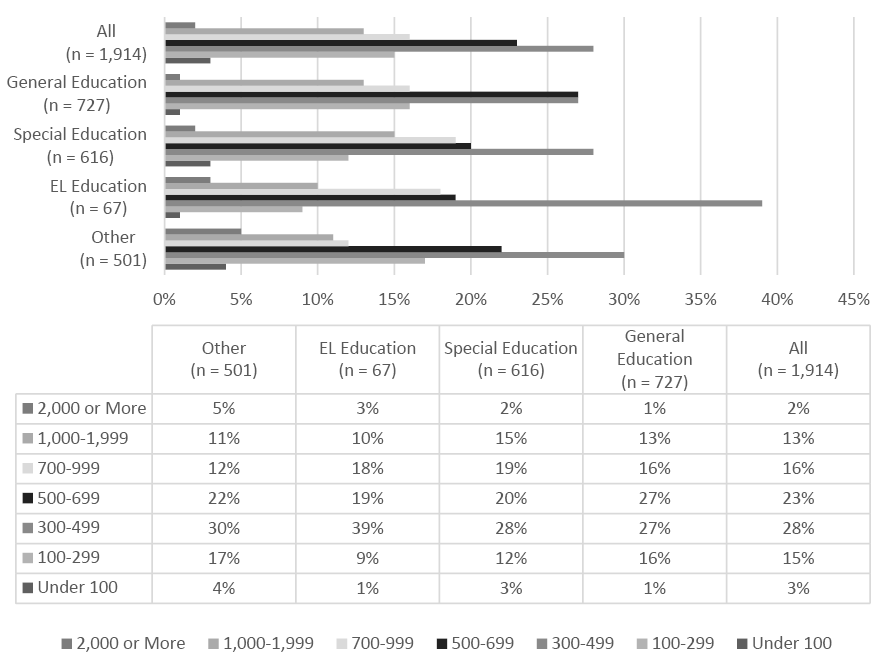
School Size. Educators also responded to a question about the approximate size of their school (see Figure B-10). Three percent worked in schools of under 100 students, 15% in schools of 100-299, 38% in schools of 300-499, 23% in schools of 500-699, 16% in schools of 700-999, 13% in schools of 1,000-1,999, and 2% in schools of over 2,000.
The most common school size for special education teachers, EL education teachers, and other educators was between 300 and 499 students. For general education teachers, there were equal numbers from schools of 300-499 and schools of 500-699.
Figure B-9. What is the approximate size of your district?
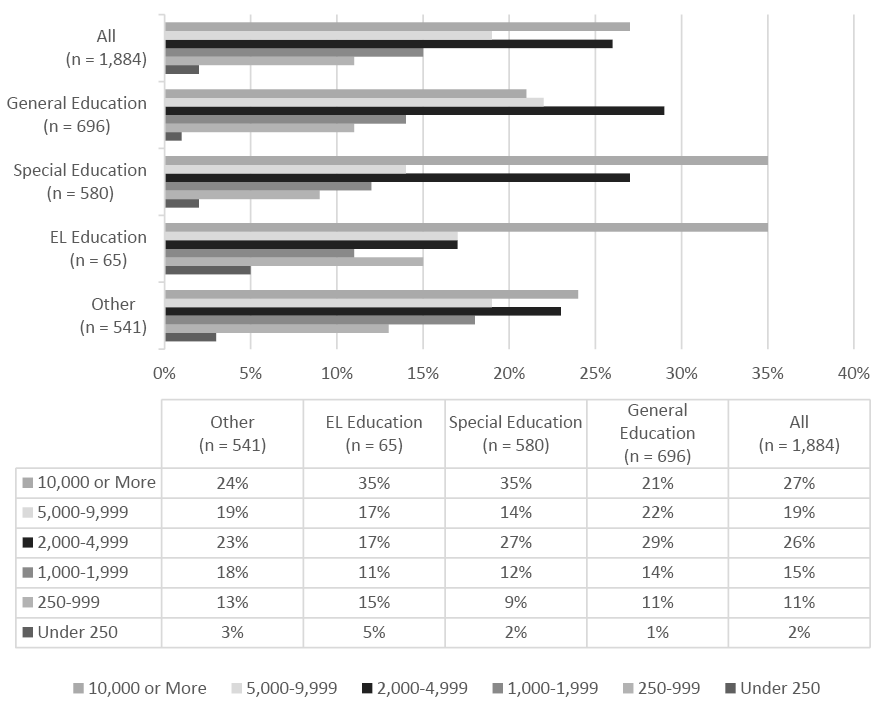
Figure B-10. What is the approximate size of your school?
Percentage of students receiving EL services, special education services, and free and reduced price lunch. Survey participants were asked approximately how many students in their schools were English learners, how many students in their schools received special education services, and how many students received free or reduced price lunch. The responses for all three questions ranged from 0% to 100%.