Published by the National Center on Educational Outcomes
December 2003
Prepared by Sandra Thompson and Martha Thurlow
Any or all portions of this document may be reproduced and distributed without prior permission, provided the source is cited as:
Thompson, S., & Thurlow, M. (2003). 2003 State special education outcomes: Marching on. Minneapolis, MN: University of Minnesota, National Center on Educational Outcomes. Retrieved [today's date], from the World Wide Web: http://education.umn.edu/NCEO/OnlinePubs/2003StateReport.htm./
Table of Contents
The Mission of the National Center on Educational Outcomes
Acknowledgments
State Directors of Special Education
Executive Summary
Overview of 2003 Survey
Consequences
Participation and Performance
Accommodations
Alternate Assessments
Accountability
Emerging Practices
Current and Emerging Issues
Preferred Forms of Technical Assistance
The Mission of the National Center on Educational Outcomes
NCEO is a collaborative effort of the University of Minnesota, the National Association of State Directors of Special Education (NASDSE), and the Council of Chief State School Officers (CCSSO). NCEO provides national leadership in assisting state and local education agencies in their development of policies and practices that encourage and support the participation of students with disabilities in accountability systems and data collection efforts.
NCEO focuses its efforts in the following areas:
Research on the participation and performance of students with disabilities in state and national assessments and other educational reform efforts.
Dissemination and Technical Assistance through publications, presentations, technical assistance, and other networking activities.
Collaboration and Leadership to build on the expertise of others and to develop leaders who can conduct needed research and provide additional technical assistance.
The Center is supported primarily through a Cooperative Agreement (#H326G000001) with the Research to Practice Division, Office of Special Education Programs, U.S. Department of Education. Additional support for targeted projects, including those on limited English proficient students, is provided by other federal and state agencies. The Center is affiliated with the Institute on Community Integration in the College of Education and Human Development, University of Minnesota. Opinions or points of view expressed within this document do not necessarily represent those of the Department of Education or the Offices within it.
National Center on Educational Outcomes
350 Elliott Hall
75 E. River Road
Minneapolis, MN 55455
612/626-1530 • Fax: 612/624-0879 • http://education.umn.edu/NCEO
The University of Minnesota is an equal opportunity educator and employer.
NCEO Staff
Once again, with the collective efforts of state directors of special education, we are able to report on the activities of all 50 states and nine of eleven federally funded entities (unique states). Because of the thoughtful and knowledgeable responses of the directors and their designees who completed this survey, we are able to share new initiatives, trends, accomplishments, and emerging issues during this important period of education reform. The purpose of this report is not to check for compliance with federal mandates nor to judge the progress of any state; it is simply to provide a snapshot of critical information that allows states to move forward. We appreciate the time taken by respondents to gather information from people outside of special education, and we hope that this collaborative effort provided an opportunity to increase awareness within and across state programs and departments.
For their support, special thanks go to:
David Malouf and Lou Danielson, of the Office of Special Education Programs in the U.S. Department of Education;
Eileen Ahearn, of the National Association of State Directors of Special Education;
Michael Moore, online survey designer and communications director for the National Center on Educational Outcomes; and
Jaclyn Roverud and Jason Altman, graduate students who carefully collected and compiled a mountain of survey data.
2003 State Special Education Outcomes was prepared by Sandra Thompson and Martha Thurlow.
State Directors of Special Education
|
ALABAMA ALASKA ARIZONA ARKANSAS CALIFORNIA COLORADO CONNECTICUT DELAWARE FLORIDA GEORGIA HAWAII IDAHO ILLINOIS INDIANA IOWA KANSAS
|
KENTUCKY LOUISIANA MAINE MARYLAND MASSACHUSETTS MICHIGAN MINNESOTA MISSISSIPPI MISSOURI MONTANA NEBRASKA NEVADA NEW HAMPSHIRE NEW JERSEY NEW MEXICO NEW YORK
|
NORTH CAROLINA NORTH DAKOTA OHIO OKLAHOMA OREGON PENNSYLVANIA RHODE ISLAND SOUTH CAROLINA SOUTH DAKOTA TENNESSEE TEXAS UTAH VERMONT VIRGINIA WASHINGTON WEST VIRGINIA
|
WISCONSIN WYOMING AMERICAN SAMOA BUREAU OF INDIAN AFFAIRS DEPARTMENT OF DEFENSE DISTRICT OF COLUMBIA GUAM MARIANA ISLANDS MARSHALL ISLANDS MICRONESIA PALAU PUERTO RICO U.S. VIRGIN ISLANDS These were the state directors of special education in August 2003 when the survey was verified. |
This report summarizes the ninth survey of state directors of special educa-tion by the National Center on Educational Outcomes (NCEO) at the University of Minnesota. Results include all 50 states and nine of the eleven federally funded entities (unique states). The purpose of this report is to provide a snapshot of the new initiatives, trends, accomplishments, and emerging issues during this important period of education reform as states document the academic achievement of students with disabilities.
Most state directors reported that more students with disabilities are accessing state/district academic content standards with increased academic expectations, and more students with disabilities are participating in statewide assessments and included in accountability systems. The majority of directors also reported improved performance by students with disabilities on state assessments. In addition, nearly all state directors reported increased participation of special educators in training on standards and assessment, and nearly three quarters reported increased networking between general and special educators.
Among the major findings of the 2003 survey are the following:
States identify more positive than negative consequences of the participation of students with disabilities in standards, assessments, and accountability.
Most regular states are studying trends in the achievement of students with disabilities, and some states are studying the results of assessments by item.
More than three-quarters of regular and unique states collect data on accommodations used on state assessments.
Three-quarters of the states have one alternate assessment option that addresses the needs of students with significant cognitive disabilities; other states have several alternate assessment options to address the perceived needs of a range of students in addition to those with significant cognitive disabilities.
The most common approach to alternate assessment involves a portfolio assessment focused on grade level or expanded standards with the same achievement level descriptors as the general assessment; the portfolios are scored by teachers who use scoring rubrics to assign scores.
Over 80% of special education directors were involved in their state’s development of the definition of Adequate Yearly Progress (AYP) required for the No Child Left Behind Act.
States are paying increased attention to access to assessments through the use of elements of universal design and accessible computer-based tests.
Though the progress of students with disabilities in this era of standards-based accountability has been noteworthy, states continue to face many challenges in their efforts to increase student achievement and administer assessments that provide valid documentation of this achievement.
This report marks the ninth time over the past twelve years that the
National Center on Educational Outcomes (NCEO) has collected information from state directors of special education about the participation and achievement of students with disabilities during standards-based reform. With the passage of the No Child Left Behind Act of 2001, reform efforts continue to evolve as states become accountable for reaching the goal of academic proficiency for every student.
The 2003 Special Education Outcomes Survey focuses on the implications of educational reform since the 2001 passage of the No Child Left Behind Act and anticipation of the reauthorization of the Individuals with Disabilities Education Act (IDEA). Results are presented in eight sections:
Consequences
Participation and Performance
Accommodations
Alternate Assessments
Accountability
Emerging Practices
Current and Emerging Issues
Preferred Forms of Technical Assistance
Participants in the 2003 survey included state directors of special education from all 50 states and 11 federal jurisdictions that abide by the provisions of IDEA. These jurisdictions are referred to in this report as "unique states." Responses to the survey were gathered online and via fax during the winter and spring of 2003 (February–May). To view the survey instrument, go to http://education.umn.edu/nceo/NCEOSurveys/2003NCEOsurvey.pdf. Surveys were completed by state directors with the assistance of other state officials representing special education, standards, assessment, and accountability.
Once compiled, drafts of tables were sent to state directors for verification in July and August. Overall, responses were obtained from all 50 regular states and from nine unique states.
As you will read throughout this report, although the progress of students with disabilities in this era of standards-based accountability has been noteworthy, states continue to face many challenges in their efforts to increase student achievement and administer assessments that provide valid documentation of this achievement for accountability purposes.
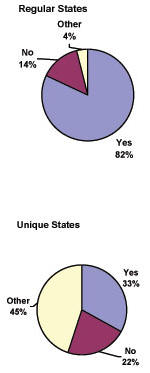
The "bottom line"—the consequences of inclusive assessment and
accountability—continues to be an important topic for states. In the 2003 survey, states were asked to identify the positive and negative consequences of the participation of students with disabilities in state standards, assessment, and accountability systems that they had observed since 2001 when NCEO last asked them this question. In 2003, the states started from a list based on their 2001 responses. Figure 1 lists the percentages of regular and unique states indicating each of the consequences.
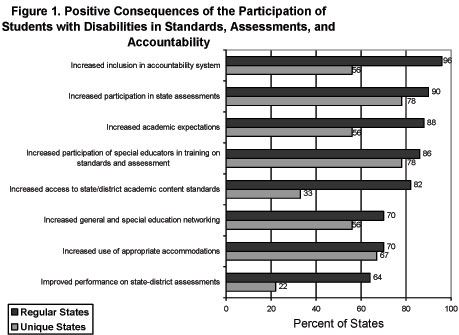
The most often selected positive consequences among the regular states were increased inclusion in the accountability system (96%) and increased participation in state assessments (90%). The most often selected positive consequences among the unique states were increased participation in state assessments (78%) and increased participation of special educators in training on standards and assessment (78%). The least often selected positive consequence was improved performance for both regular states (64%) and unique states (22%). Still, more than half of the regular states selected this as a positive consequence.
In addition to the positive consequences listed in Figure 1, state directors made these comments:
"Perhaps the biggest benefit for children with disabilities has been the focus of general education on improving the quality of education for children with disabilities. As schools make their plans for school improvement, they focus efforts on children with disabilities for the purpose of increasing the number of students scoring at the proficiency level. Because students with disabilities comprise a disproportionate share of students who are not at the proficiency level, they are the direct beneficiaries of district wide efforts to improve student performance."
"Districts and schools are starting to use disaggregated student achievement data to focus on the learning outcomes of students with disabilities."
"Quality of IEPs has improved."
"Improved data based instruction and higher expectations for students with significant cognitive disabilities."
"NCLB has at least made district and school administrators make sure they know every student that is enrolled in their district or building is accounted for so they get credit for every student in the NCLB participation rate and AYP calculations."
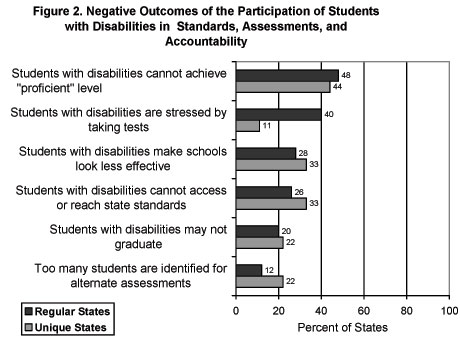
Far fewer state directors selected negative outcomes than positive. The negative outcomes identified are shown in Figure 2. The greatest fear is that students with disabilities will not be able to achieve proficiency on state assessments.
In addition to the negative consequences listed in Figure 2, state directors made these comments:
"Use of accommodations and alternate methods of assistance is labor intensive and more costly."
"Small schools and those that house center-based programs with scores reported to the school of instruction can be negatively impacted by the scores of students with IEPs."
"Immediate referrals to special education when assessment scores are low with the expectation that they are automatically eligible, causing conflicts between general education and special education."
"Resistance to placement of students with disabilities in school buildings when perception is that they will bring down the school’s scores."
"Many teachers of students participating in the alternate assessment don’t like the idea of being held accountable for their students’ performance. They have had a pass on this for too many years and are now very nervous about it."
States are required by IDEA to report the number of students
with
disabilities who participate in state assessments. NCLB requires the reporting
of participation rates by subgroup, including students with disabilities. States
report students who do not participate in state assessments (e.g., absent on
test day, parent refusal, hospitalized) in a variety of ways. As in 2001, eight
regular states gave these students a score of zero or the lowest score in 2003
(see Figure 3); one unique state also used this approach in 2003. There was an
increase from 2001 to 2003 of 7 to 16 regular states that counted students
(e.g., count as participating) even though they received no score. Two unique
states counted these students in 2003.
Most of the states in the "other" category reported that the way students are reported depends on the reason for non-participation. For example, Delaware’s state director wrote, "It depends on the reason why. For example, if a student does not participate because of truancy that student is counted with the lowest score. If there is an acceptable reason, for example hospitalization, the student is granted a special exemption and there is no accountability consequence." Connecticut commented, "Present but no responses counts as participated for NCLB and in calculations of performance as not proficient. Absent students count as non-participants, but do not count in calculations for performance."
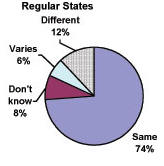
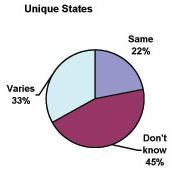
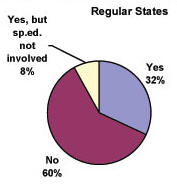
States were beginning to be able to document trends across years in the state assessment performance of students with disabilities (see Figure 4). In 2003, 40 of 50 regular states’ directors of special education (80%) responded that they were able to document trends. Two unique states also reported the ability to document trends across years.
Many states commented on the trends question. Table 1 includes a few examples of states that commented on changes in assessment performance, and states that noted difficulties in reporting trends.
Figure 3. Ways States Count Students Who are Not Assessed
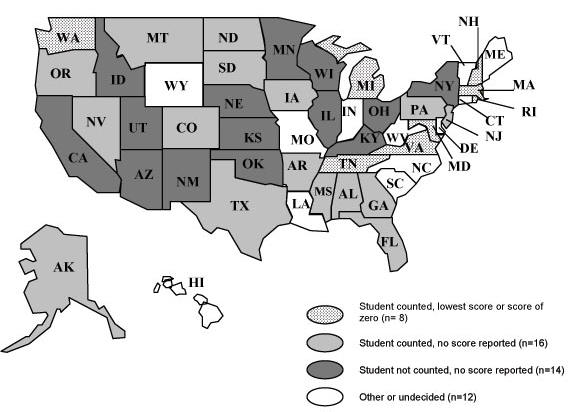
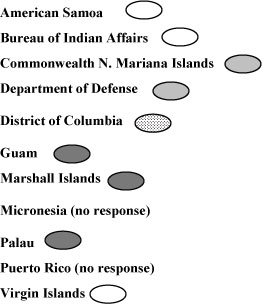
Figure 4. States Able to Document Trends in Assessment Performance of Students with Disabilities
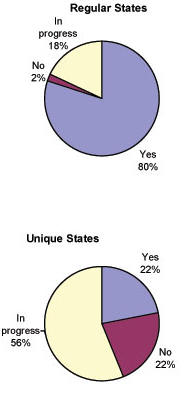
Table 1. Examples of Sates’ Comments on Trends
|
Trends show improved state assessment performance of students with disabilities |
“Trend data from 1998 to 2001 show that students on IEPs made progress each year on the reading and writing tests, and to a lesser extent, math.” “The percentage of students with disabilities scoring at Level 3 and above on the Grade 4 English Language Arts (ELA) examination increased 6.6 percentage points since 1999, from 19.0 percent to 25.6 percent. Greater numbers of students with disabilities are tested on each examination compared to the previous year. The number of students with disabilities tested has tripled and quadrupled since 1997. Increasing numbers of students with disabilities have also achieved passing scores each year.” “Over a three year period there has been improvement in the assessment scores of students in grades 3, 4, 5, 7, and 8. Reading scores have improved significantly for grades K-3.” “We are seeing small but steady increases in participation rates and performance.” |
|
Trends show unchanged or lower state assessment performance of students with disabilities |
“Results from the 2002 assessment administration indicated that progress of students on IEPs in different grade levels and content areas either remained unchanged or slightly declined. These findings were comparable to overall state results.” “Over a three year period the scores are flat in grades 6 and 9. Scores are slightly down in grades 10 and 11.” |
|
Changes in state assessments have made trends difficult to report |
“The state changed its standards based assessment this year so this will be the first year of reportable data.” “Our state assessment system has changed so a trend is not possible until 3 years have passed. The year 2003 is the first year our new statewide assessment system will be able to produce data for analysis.” “Spring 2002 administration was the first year in which all data on special education students was integrated (both regular and alternate assessment data). “We will be changing assessments next year.” |
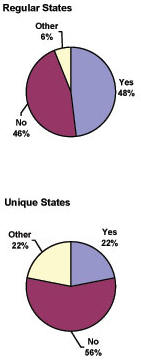
Eighty-four percent of the regular states and 78% of the unique states reported that they collected data on the accommodations that students use on state assessments (see Figure 5). The specific information that is coded by states appears in Table 2. Increasing numbers of states code accommodations information from students’ IEPs onto test forms and then verify that information at testing. Three unique states have also initiated this process.
Figure 5. States Reporting Data on Assessment Accommodations Use
Note: None of the unique states reported collecting data on accommodations use.
Table 2. State Documentation of Assessment Accommodations Use
|
State |
Test form codes “standard” or “nonstandard” accommodations |
Test form codes some or all accommodations |
IEP information coded on test form and verified during testing |
No accommodations data collected at state level |
|
Alabama |
■ |
|
|
|
|
Alaska |
|
■ |
|
|
|
Arkansas |
|
■ |
■ |
|
|
Arizona |
|
|
|
■ |
|
California |
|
■ |
|
|
|
Colorado |
■ |
|
|
|
|
Connecticut |
|
■ |
|
|
|
Delaware |
|
■ |
|
|
|
Florida |
|
■ |
|
|
|
Georgia |
■ |
|
|
|
|
Hawaii |
■ |
|
|
|
|
Idaho |
|
|
|
■ |
|
Illinois |
|
■ |
|
|
|
Iowa |
|
■ |
|
|
|
Indiana |
|
■ |
|
|
|
Kansas |
|
■ |
■ |
|
|
Kentucky |
|
■ |
■ |
|
|
Louisiana |
|
■ |
■ |
|
|
Maine |
|
■ |
■ |
|
|
Maryland |
|
■ |
|
|
|
Massachusetts |
■ |
■ |
|
|
|
Michigan |
■ |
|
|
|
|
Minnesota |
|
|
■ |
|
|
Mississippi |
|
■ |
|
|
|
Missouri |
|
■ |
|
|
|
Montana |
■ |
|
|
|
|
Nebraska |
|
|
|
■ |
|
Nevada |
■ |
|
|
|
|
New Hampshire |
■ |
|
|
|
|
New Jersey |
|
■ |
|
|
|
New Mexico |
■ |
|
|
|
|
New York |
|
■ |
|
|
|
North Carolina |
|
■ |
|
|
|
North Dakota |
■ |
|
■ |
|
|
Ohio |
|
|
|
■ |
|
Oklahoma |
|
|
|
■ |
|
Oregon |
■ |
|
|
|
|
Pennsylvania |
|
■ |
|
|
|
Rhode Island |
|
■ |
|
|
|
South Carolina |
|
|
■ |
|
|
South Dakota |
■ |
|
|
|
|
Tennessee |
|
|
■ |
|
|
Texas |
|
|
|
■ |
|
Utah |
|
■ |
|
|
|
Vermont |
■ |
|
■ |
|
|
Virginia |
|
■ |
■ |
|
|
Washington |
|
|
■ |
|
|
West Virginia |
■ |
|
|
|
|
Wisconsin |
|
|
|
■ |
|
Wyoming |
|
■ |
|
|
|
Total Regular States |
15 |
25 |
12 |
7 |
|
|
|
|
|
|
|
American Samoa |
|
|
■ |
|
|
Bureau of Indian Affairs |
|
■ |
■ |
|
|
Department of Defense |
|
■ |
|
|
|
District of Columbia |
|
|
■ |
|
|
Guam |
|
■ |
|
|
|
Mariana Islands |
|
|
■ |
|
|
Marshall Islands |
|
■ |
|
|
|
Micronesia* |
|
|
|
|
|
Palau |
|
■ |
|
|
|
Puerto Rico* |
|
|
|
|
|
U.S. Virgin Islands |
|
■ |
|
|
|
Total Unique States |
0 |
6 |
4 |
0 |
* No Response
Alternate assessments, those assessments described in IDEA 97 as assessments for students unable to participate in regular state or district-wide assessments, have evolved a great deal since NCEO began tracking them in 1997, even though states were first required to implement them in 2000.
Most states (33 regular states and 5 unique states) offer a single type of alternate assessment for students with the most significant disabilities who are unable to participate in general state assessments even with accommodations. However, eight states offer two alternate assessment options and three states offer three or more options tied to their alternate assessment. Table 3 describes the alternate assessments in states with multiple options. As is evident in the table, these options tend to reflect the needs of a range of students in addition to those with significant cognitive disabilities.
The remainder of this section on alternate assessments focuses on the assessments states have designed for the very small number of students with the most significant cognitive disabilities.
Table 3. States with Multiple Alternate Assessment Options
Alternate Assessment Approach
Alternate assessments were developed and implemented first in the regular states. In 2003, most of the regular states used a portfolio or body of evidence approach in their alternate assessments for students with significant cognitive disabilities. Still, the number of states using a portfolio or body of evidence approach decreased from 28 states in 2000 to 24 states in 2001 to 23 states in 2003 (see Table 4). The number of states using a rating scale or checklist increased from 4 states to 15 states during the same time frame. Three of the regular states were revising their alternate assessment system in 2003.
Four of the five unique states with alternate assessments in place in 2003 used a portfolio or body of evidence approach. The other used an IEP analysis approach. States listed under "other" allow local selection of an alternate assessment approach or require a performance assessment.
Table 4. Alternate Assessment Approaches 2000-2003
The variability within each category of approach is considerable. In 2003, of the states using portfolio (body of evidence) assessments, 9 states used a standardized set of performance events, tasks, or skills. Six of the 15 regular states using a rating scale of performance on a standardized set of events, tasks, or skills required the submission of a body of evidence. Similarly, half of the regular states that used an analysis of progress on IEP goals required the submission of a body of evidence.
Alternate Assessment Content
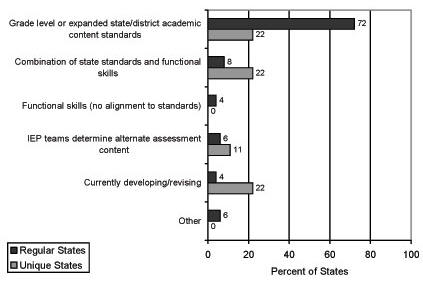
Eighty percent of the regular states aligned their alternate assessments with state academic content standards in 2003 (see Figure 6), either through grade-level or expanded standards or through a combination of these and functional skills. Only two states (4 percent) continued to conduct alternate assessments that were not aligned to state standards, and three states (6 percent) allowed IEP teams to select the content used on their alternate assessment.
Five of the nine unique states that responded to the survey had alternate assessments in place. Two of the unique states’ alternate assessments (22 percent) were aligned to standards, two contained a combination of state standards and functional skills, and one unique state allowed IEP teams to determine content.
Figure 6. Types of Alternate Assessment Content
Alternate Assessment Achievement Level Descriptors
Nearly two thirds of regular states and one third of unique states used the same achievement level descriptors for their alternate assessments as they did for their general state assessments in 2003 (see Table 5). This is up considerably from 2001 for regular states, where historical data are available.
Table 6 shows examples of achievement level descriptors in states that used different descriptors for their alternate assessment from what they used for the general assessment.
|
Inconclusive, exploring, emerging, developing, novice |
|
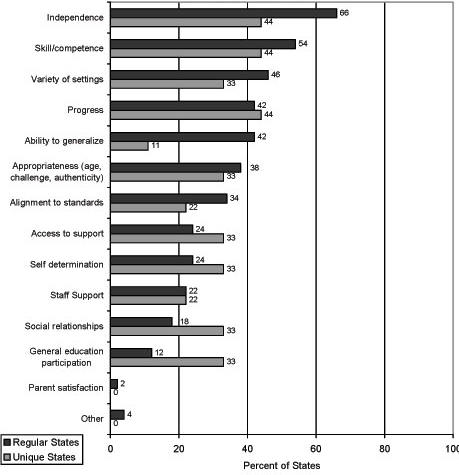
Most regular states (40) place their scoring criteria for the alternate assessment within some type of rubric. States that do not use a rubric assign points on a rating scale (8 states), score number of items correct (5 states), or score reading rate or accuracy (2 states). Scoring criteria can be a direct measure of student achievement (student criteria); they may reflect necessary system conditions essential for student success (system criteria); or they can be a combination of student achievement seen within the context of system-provided supports (combination).
As shown in Figure 7, there is great variation in the scoring criteria of states. This variation is also evident among unique states. The largest number of states score a student’s level of assistance needed to complete a task (or independence) and the second largest number score a student’s competence in completing a task.
For NCEO’s in-depth analysis of the scoring criteria in five states, see Measuring Academic Achievement of Students with Significant Cognitive Disabilities: Building Understanding of Alternate Assessment Scoring Criteria (Synthesis Report 50), http://education.umn.edu/NCEO/OnlinePubs/Synthesis50.html.
Figure 7. Alternate Assessment Scoring Criteria (for states using rubrics)
Most regular and unique states had their alternate assessments scored by teachers (see Figure 8). In the regular states, this was often completed by teachers from other districts rather than the students’ teachers. Other frequent scorers included the test development contractor and the state education agency.
Figure 8. Alternate Assessment Scorers
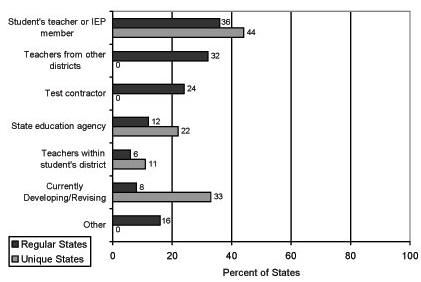
Several states described their alternate assessment scoring process. The examples in Table 7 show the diversity in the complexity of this process across the country. This diversity is also reflected in the scoring processes used in the unique states.
Table 7. Examples of Alternate Assessment Scoring Process
|
State |
Scored by teachers in the same or different district as student |
|
Delaware |
Trained teachers are the primary scorers who meet over a two week period to review portfolios and submit scores to the University contractor who issues score reports and submits data to the state. |
|
Kentucky |
Each student portfolio is scored three times by individual teachers at regional scoring sessions. Teachers do not score their own portfolios, nor do they score those from their own school. The first 2 scores are compared and areas of discrepancy resolved by the 3rd score. All teachers who assist students in completing alternate portfolios are required to score, affording those teachers the opportunity to examine multitudes of student work and programmatic approaches. |
|
Maine |
Student work is submitted to the contractor for logistics. Portfolios are then sent to a scoring site where educators receive training before scoring student work. Portfolios are returned to the contractor for data collection and writing of parent/school/district and state reports |
|
Oklahoma |
Portfolios are submitted to the State Department of Education. Teachers apply to be scorers. Teams of four teachers score each portfolio using four point rubrics. Overall score is based on each piece of evidence, support for each piece of evidence, two authentic performance tasks and supports, and a portfolio content score. |
|
Tennessee |
Each portfolio is scored 3 times by trained teachers (other than the submitting teacher), and the middle score is submitted online to the state. These scores are submitted to the Division of Evaluation & Assessment for aggregating and disaggregating as appropriate with other students' scores in that district. A random sampling (about 10%) of those portfolios are selected and scored by a statewide team for verification. |
|
State |
Scored by a student’s special education teacher and IEP team members |
|
Colorado |
Once the teacher has completed administration, all materials are returned to the test publisher. The receiving department checks materials for completeness and score sheets are sent to the Data Entry department for analysis. The company then provides a total composite score and assigns the appropriate performance category (used for state, district, and building reports). Student and building reports also include sub scores that provide a total score for the Indicators categorized under a sub concept (e.g., gaining meaning from text within the reading assessment). |
|
Idaho |
All eligible students are rated by the teacher on the same items in reading, math, and language art extended standards, using a rubric. Data sources are required to support the rating, such as work samples, video clips, etc. A random sample of students is rated by a second person. 80% reliability must exist between the first and second rater in order for the results to be considered valid. |
|
Louisiana |
Teacher observation of student's performance on identified skills is scored on a six point rubric and sent to the test company contractor. |
|
Nebraska |
Individual scoring sheets are sent in by the LEAs to the state for reporting purposes. These results are aggregated and reported to the public through our State of the Schools Report |
|
South Dakota |
The person who collects the evidence of student learning (could be sp. ed. teacher, general ed. teacher, parent, related service provider, etc.) rates the student in the fall and spring. Those scores are transferred onto a reporting form that is sent to the state by May 1 of each year. |
|
Wyoming |
IEP Team meets and reviews assessment data (body of evidence) and scores using state rubric. Proficiency levels are recorded on forms and sent to contractor for tabulation and reporting. |
|
State |
Scored by test development contractor |
|
Arkansas |
Student work is submitted to test company for scoring and reporting. |
|
Illinois |
(1) Work submitted to test contractor; (2) Portfolio scored; (3) Reports generated but portfolios not returned. |
|
Kansas |
Three adults (respondents) who have worked with the student during the current school year and have submitted evidence (student work) into the evidence file are interviewed about the work. The examiner (interviewer) is responsible for confirming and recording an accurate rating of that work based on the respondents' information. The examiner records the rating on an answer sheet and it is sent to the test coordinator for scoring. |
Alternate Assessment Standard Setting
A standard-setting process defines what scores mean. Usually this involves identifying "cut scores" that separate different levels of achievement. Methods for developing this process for alternate assessments differ across states and, as shown in Figure 9, about half of the regular states and one-fourth of the unique states used a standard-setting process for their alternate assessments in 2003.
Figure 9. States with a Standard-setting Process for Alternate Assessments
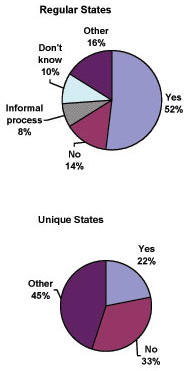
Table 8 describes the most commonly used standard-setting processes for alternate assessments and lists the states that use them. As is evident in the table, most states used a reasoned judgment standard-setting approach in 2003. A few states selected more than one technique, and one unique state responded that standard-setting is done, but did not select a technique.
Table 8. Standard-setting Techniques that States Apply to Alternate Assessments
|
Technique |
Description* |
States that Apply this Technique to Alternate Assessments |
|
Reasoned Judgment |
A score scale (e.g., 32 points) is divided into a desired number of categories (e.g., 4) in some way (equally, larger in the middle, etc.); the categories are determined by a group of experts, policymakers, or others. |
Alaska Department of Defense |
|
Bookmarking or Item Mapping |
Standard-setters mark the spot in a specially constructed test booklet (arranged in order of item difficulty) where a desired percentage of minimally proficient (or advanced) students would pass the item; or, standard-setters mark where the difference in performance of the proficient and advanced student on an exercise is a desired minimum percentage of students. |
Alabama |
|
Contrasting Groups |
Teachers separate students into groups based on their observations of the students in the classroom; the scores of the students are then calculated to determine where scores will be categorized in the future. |
Arkansas |
|
Body of Work |
Reviewers examine all of the data for a student and use this information to place the student in one of the overall performance levels. Standard setters are given a set of papers that demonstrate the complete range of possible scores from low to high. |
Arkansas Department of Defense |
|
Judgmental Policy Capturing |
Reviewers determine which of the various components of an overall assessment are more important than others so that components or types of evidence are weighted. |
Kansas |
*Descriptions from: Roeber, E. (2002). Setting Standards on Alternate Assessments (Synthesis Report 42). Minneapolis, MN: University of Minnesota, National Center on Educational Outcomes (http://education.umn.edu/NCEO/OnlinePubs/Synthesis42.html).
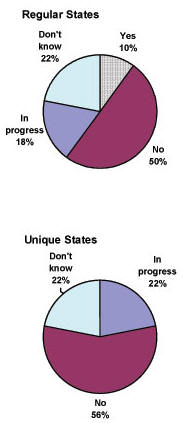
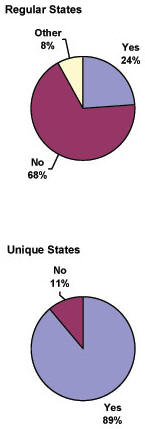
Each state defined Adequate Yearly Progress (AYP) to meet the requirements of the No Child Left Behind Act. Over 80% of the state directors of special education in the regular states, but only about 30% in the unique states, responded that they were involved in their states’ development of this definition (see Figure 10). One state director commented that special education representatives were included on an internal AYP workgroup to provide direction to the state-level AYP committee. Another commented that state special education personnel were involved in the process of setting cut scores and performance descriptors for determining AYP for the statewide general assessment. One state director said that special education personnel were informed, but not involved.
Figure 10. States with Special Education Personnel Involvement in Development of AYP Definition
Most regular states’ AYP formulas (74%) used the same cell sizes for students with disabilities as for the general student population (see Figure 11). Six state directors responded that the minimum cell size for students with disabilities is larger than that of the general population. For example, Wisconsin set the minimum for students with disabilities at 50, with all other subgroups set at 40. Colorado used a minimum N of 16 for the purposes of reporting and an N of 30 for accountability, but the N is the same for students with disabilities and the general student population.
Most state directors from unique states do not know whether the subgroup size for AYP was the same for students with disabilities and other students. Some of the unique states had not defined AYP at the time the survey was conducted.
Figure 11. States with Same AYP Cell Size for Disability Subgroup
Item Analysis
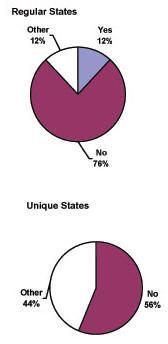
Only five states indicated that they analyzed their assessment results by item for students with disabilities during 2003 (see Figure 12). These states were Alaska, Kansas, Missouri, North Carolina, and Pennsylvania. A few states indicated that they planned to conduct item analyses in the future. These states included five regular states (Colorado, Delaware, Maine, South Carolina, Tennessee) and two unique states (Marshall Islands, Virgin Islands). Nearly one fourth of state directors in both the regular and unique states responded that they did not know whether results were analyzed by item for students with disabilities, perhaps reflecting a need for increased data discussions between state assessment and special education departments.
One state director commented that the test vendor is required to research the impact of specific accommodations to determine whether they invalidate the test. In another state, items are subject to a complete analysis to detect bias and differential functioning. Items that are flagged as problematic do not appear on operational tests and are either removed from the item pool or revised and field tested again. None of the unique states currently analyze results by item; however, Marshall Islands and Virgin Islands are planning to do this in the future.
Figure 12. States that Analyze Assessment Results by Item for Students with Disabilities
Universally Designed Assessments
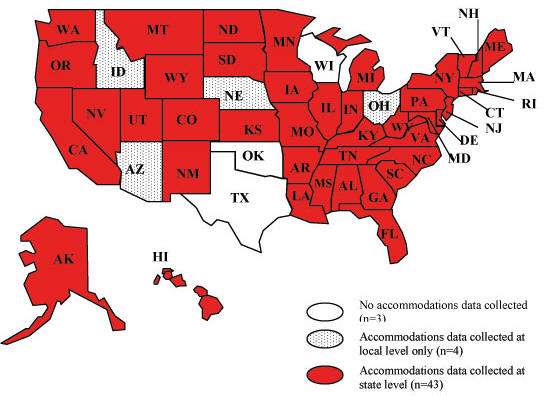
The term "universally designed assessments" refers to assessments that are designed and developed from the beginning to be accessible and valid for the widest possible range of students who have access to standards-based instruction, including students with disabilities and students with limited English proficiency. States are using several approaches to achieve universally designed assessments, including training item reviewers and establishing requirements for test contractors. For example, universal design is addressed in Missouri’s assessment contract and is a focus of its new grade level assessments. For more information about universally designed assessments, see NCEO’s Web site: http://education.umn.edu/nceo/TopicAreas/UnivDesign/UnivDesign_topic.htm.
Most of the regular states indicated that they used some approach to universally designed assessments, primarily having a disability representative on the assessment bias review committee (see Table 9). None of the special education personnel in the unique states were aware of the development of universal design approaches for their state assessments.
Table 9. Assessment Development Areas Using Universal Design
The 22 regular states reported including a variety of disability representatives on their assessment bias or sensitivity review committees. These representatives are shown in Table 10.
Computer-based State Assessments
About 20 states were in the process of developing computer-based assessments during 2003. All but four of these states included special education personnel in the development process (see Figure 13). None of the unique states were developing computer-based assessments.
Figure 13. Percent of States Developing Computer-based State Assessments
Note: No unique states indicated that they were developing computer-based state assessments.
Kentucky initiated the Web-based delivery of the Kentucky Core Content Assessment in an accessible format in spring of 2003 (see Figure 14 for a description of CATS Online). There are many important considerations in developing accessible computer-based tests for students with disabilities. Virginia’s development of a computer-based assessment system included a subcontract to examine disability-related issues. Colorado commented on a critical issue faced by states as they consider developing computer-based assessments: "Many districts in the rural areas of Colorado do not have the equipment to conduct computer-based assessments. Given the budgetary concerns of the state at this time, computer-based assessments are not an option." For more information on this emerging priority, see NCEO’s report: Using Computer-based Tests with Students with Disabilities (http://education.umn.edu/nceo/OnlinePubs/Synthesis45.html).
Figure 14. Kentucky’s CATS Online (Commonwealth Accountability Testing System)
Approximately 200 students with disabilities took Kentucky’s statewide assessment (CATS) online for the first time in the spring of 2003. Eligibility for the computerized assessment requires: (1) student’s IEP or 504 plan requires use of a reader as an instructional and assessment accommodation; (2) student is using text or screen reader technology as a primary means of accessing printed material in the classroom on a routine basis; (3) student must have accessed and used the CATS Online Practice Area sufficiently for familiarity with site navigation and use of a text or screen reader for computerized reading of the online assessment. For more information about this assessment, see: http://www.kentuckyschools.net/KDE/Administrative+Resources/Testing+and+Reporting+/District+Support/CATS+Online+Assessment.
Several current and emerging issues were targeted in the 2003 survey. These included whether states (1) had graduation assessments, (2) had grade promotion assessments, (3) kept track of referrals to special education, (4) were using out-of-level tests, or (5) faced legal challenges to assessment or accountability systems. The states indicating that they were using each of these approaches in 2003, or faced legal challenges, are shown in Table 11.
Table 11. Issues Addressed by States
|
State |
High Stakes Graduation Assessment |
Assessment Results Used for Grade Promotion |
State has Data on Special Education Referrals |
Out-of-Level or Levels Testing Options |
Legal Challenges |
|
|
Alabama |
■ |
|
■ |
|
|
|
|
Alaska |
■ |
|
|
|
|
|
|
Arkansas |
|
|
|
|
|
|
|
Arizona |
|
|
|
■ |
|
|
|
California |
■ |
|
|
■ |
■ |
|
|
Colorado |
|
|
|
|
|
|
|
Connecticut |
|
|
|
■ |
|
|
|
Delaware |
■ |
■ |
|
|
|
|
|
Florida |
■ |
■ |
|
|
|
|
|
Georgia |
■ |
|
|
|
|
|
|
Hawaii |
|
|
|
■ |
|
|
|
Idaho |
|
|
|
■ |
|
|
|
Illinois |
|
|
■ |
|
|
|
|
Iowa |
|
|
■ |
■ |
|
|
|
Indiana |
■ |
|
|
|
■ |
|
|
Kansas |
|
|
|
■ |
|
|
|
Kentucky |
|
|
|
|
|
|
|
Louisiana |
■ |
■ |
■ |
■ |
■ |
|
|
Maine |
|
|
|
|
|
|
|
Maryland |
■ |
|
|
|
|
|
|
Massachusetts |
■ |
|
|
|
■ |
|
|
Michigan |
|
|
■ |
|
|
|
|
Minnesota |
■ |
|
■ |
|
|
|
|
Mississippi |
■ |
|
|
■ |
|
|
|
Missouri |
|
|
|
|
|
|
|
Montana |
|
|
|
|
|
|
|
Nebraska |
|
|
|
■ |
|
|
|
Nevada |
■ |
|
■ |
|
■ |
|
|
New Hampshire |
|
|
|
|
|
|
|
New Jersey |
■ |
■ |
■ |
|
|
|
|
New Mexico |
■ |
|
|
|
|
|
|
New York |
■ |
|
|
|
■ |
|
|
North Carolina |
■ |
■ |
|
■ |
|
|
|
North Dakota |
|
|
|
|
|
|
|
Ohio |
■ |
|
|
|
|
|
|
Oklahoma |
|
|
|
|
|
|
|
Oregon |
|
|
|
|
■ |
|
|
Pennsylvania |
|
|
|
|
|
|
|
Rhode Island |
|
|
|
|
|
|
|
South Carolina |
■ |
|
|
■ |
|
|
|
South Dakota |
|
|
|
|
|
|
|
Tennessee |
■ |
|
|
■ |
|
|
|
Texas |
■ |
■ |
■ |
■ |
|
|
|
Utah |
■ |
|
|
■ |
|
|
|
Vermont |
|
|
|
■ |
|
|
|
Virginia |
|
|
|
|
|
|
|
Washington |
■ |
|
■ |
|
|
|
|
West Virginia |
|
|
|
■ |
|
|
|
Wisconsin |
|
|
■ |
|
|
|
|
Wyoming |
|
|
■ |
|
|
|
|
Total Regular States |
23 |
6 |
12 |
17 |
7 |
|
|
|
|
|||||
|
American Samoa |
■ |
|
■ |
|
|
|
|
Bureau of Indian Affairs |
|
|
|
|
|
|
|
Department of Defense |
|
|
■ |
|
|
|
|
District of Columbia |
|
|
■ |
|
|
|
|
Guam |
|
|
■ |
|
|
|
|
Mariana Islands |
■ |
|
■ |
■ |
|
|
|
Marshall Islands |
|
|
■ |
|
|
|
|
Micronesia* |
|
|
|
|
|
|
|
Palau |
|
|
■ |
|
|
|
|
Puerto Rico* |
|
|
|
|
|
|
|
U.S. Virgin Islands |
|
|
■ |
|
|
|
|
Total Unique States |
2 |
0 |
8 |
1 |
0 |
|
* No Response
High Stakes Graduation Assessments
Twenty-four states had an assessment that determined or will determine whether students earn a standard high school diploma (see Figure 15). In addition, three states are working on implementing a high school graduation assessment. Two unique states have a graduation assessment in place.
Figure 15. States with Graduation Assessments
For the states with an assessment used to determine whether a student received a standard high school diploma, passing the assessment in the same way as all other students was the only option available to students with disabilities in seven regular states and two unique states (see Table 12). Seven states allowed students with disabilities to earn a standard diploma without passing the graduation assessment. A few states had a juried or performance assessment or an appeals process in place as an alternative to passing the paper and pencil assessment.
Table 12. Ways to Earn a Standard Diploma in States with Graduation Assessments
|
|
|
Assessment Results Used for Grade Promotion
Thirty-eight regular states and five unique states do not use assessment results to determine whether students are promoted to the next grade (see Figure 16). Six states do use assessment results for grade promotion. For example, Florida uses a third grade reading test for promotion to fourth grade, with consideration of good cause exemptions. Louisiana administers high stakes tests in English Language Arts to 4th and 8th graders; these must be passed for a student who participates in the general assessment to be promoted.
Figure 16. States that Use Assessment Results for Grade Promotion
Referrals for Special Education Services
During 2003, 12 regular states and 8 unique states collected information at the state level on the number of referrals for special education services (see Figure 17). Several states reported that this information was collected at the district level. For example, Michigan commented, "We have a state-provided information system that districts may use. In this system there is a field to collect referral dates, including date of referral and date of consent. The system is not required by the state but is offered as a convenience to the local and intermediate districts for documenting compliance information."
Six regular states and seven unique states commented on the changes in the number of students referred for special education services. Across the 13 states, 6 reported an increase in referrals, 2 reported a decrease in referrals, 3 reported no change, and 2 reported variable changes (ups and downs). Only one state reported specific numbers: The District of Columbia reported that in "2000-01 the average monthly referrals for special education services were 218.83. In 2001-02 the average monthly referrals dropped to 192.67. As of May, the 2002-03 average monthly referrals were 224.22 (this average will adjust down somewhat over the summer)."
Figure 17. States with Special Education Referral Information
Legal Challenges
Seven state directors reported legal challenges to their assessment or accountability systems, specifically with respect to the participation or performance of students with disabilities (see Figure 18). Four states commented that these challenges were related to the use of assessment accommodations, and three were about high stakes promotion and graduation policies. None of these legal challenges occurred in unique states.
Figure 18. States with Legal Challenges to the Assessment Participation or Performance of Students with Disabilities
Note: No unique states reported legal challenges to the state assessment related to the participation or performance of students with disabilities.
Gap Issues
For many years there have been concerns about whether there are students for whom neither the general state assessment nor the alternate assessment is appropriate. Questions have been raised about whether the problem was with the student or the assessment (see Gray Areas of Assessment Systems http://education.umn.edu/NCEO/OnlinePubs/Synthesis32.html).
When state directors were asked whether their assessment system was appropriately including all of their students, 22 regular states and 2 unique states indicated that their current assessment system was appropriate for all students. For example, Alaska’s director wrote, "We have a continuum of assessments that at present seem to serve our purpose." Montana’s director wrote, "We believe that our current state assessment system is appropriate for all students. No exceptions."
However, 20 regular states did not agree, and another 8 did not respond or indicated that they were unable to tell at this time (see Table 13). Fourteen regular states described students achieving below grade level as those for whom the assessment system may be inappropriate. Colorado wrote, "The educational community has reported that there are students on IEPs for whom the general assessment (CSAP) is too difficult and the alternate (CSAPA) is inappropriate.
However, it is unclear as to which students fit this description and whether this view is based on expected versus actual student performance."
Four regular states and four unique states described students difficult to assess as those with the most severe cognitive disabilities. For example, Texas wrote, "Schools report being most challenged in finding and devising appropriate alternate assessment content and strategies for certain students in nursing care with degenerative neurological conditions, those in near coma states, and those with multiple sensory and physical disabilities who are functioning at very early pre-academic levels of development that are not easy to align to the state’s designated curriculum and state assessment content."
Table 13. States with Students for Whom "Gap Issues" Exist*
|
Students “In the Gap” Between General and Alternate Assessments |
Number of Regular States |
Number of Unique States |
|
Students achieving below grade level |
14 |
0 |
|
Students with the most significant cognitive disabilities |
4 |
4 |
|
English language learners |
1 |
1 |
|
Students in custody of the state |
1 |
0 |
|
Total |
20 |
5 |
|
Unable to tell at this time or no response |
8 |
2 |
*22 regular states and 2 unique states are not included in this table because they indicated that the assessment system is appropriate for all students.
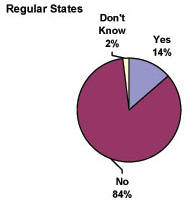
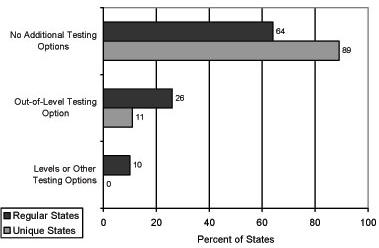
Out-of-Level or Levels Testing Options
The percentage of states that reported offering out-of-level, levels, or other below-grade testing options in 2003 was 36% of regular states overall, with 13 regular states using out-of-level testing, and 5 regular states using levels testing (see Figure 19). One unique state also used out-of-level testing.
State directors expressed concern about using below grade testing options. One director stated: "It was anticipated that out-of-level testing would be used for both diagnostic and instructional purposes. Unfortunately, test results did not produce information that teachers felt was useful." This director added that out-of-level testing will be eliminated from next year’s assessment options for students with disabilities. Four states indicated that out-of-level testing or levels testing was being phased out as a testing option in the state, and one additional state indicated that it would possibly be eliminated.
Figure 19. Out-of-Level or Levels Testing Options
Emerging Issues
Each time NCEO surveys states, it asks about emerging issues. The most common issue was general concern about meeting the requirements of the No Child Left Behind Act and the inclusion of students with disabilities in measures of AYP (Adequate Yearly Progress). Other issues identified by at least four states (see Table 14) include: alternate assessment participation and scoring; graduation and dropout rates of students with disabilities; IEP team decision making and knowledge of state standards; use of accommodations, universally designed assessments, and computer-based assessments; and "gap" issues.
Issues identified by fewer than four states include: added burden for special educators, lack of instructional strategies to increase achievement, revisions in state standards, state level unique student identifiers, and amount of testing time.
Table 14. Emerging Issues
|
Theme |
Examples of State Comments |
|
Meeting the requirements of the No Child Left Behind Act (NCLB) (10 states) |
· Although most school level administrators and practitioners are in agreement with the spirit of the law, they are also concerned with the impact of the NCLB regulations. · How to meet the requirements of NCLB and state assessment and still preserve the integrity and validity of our current state assessment system. · Difficult to implement the requirements of NCLB as they relate to attaining proficient level on grade level assessments for students with disabilities taking the regular statewide assessment |
|
Alternate assessment participation and scoring (8 states) |
· Strengthening the alternate assessment process, particularly for students with low incidence disabilities and providing guidelines regarding interpreting results for state reporting system. · Growing numbers of students recommended for participation in the alternate assessments · Alternate Assessment continues to be a challenge. School staff believe that we need to focus on functional curriculum rather than standards-based instruction. |
|
Graduation and dropout rates of students with disabilities (6 states) |
· This is the first year for "high stakes" on graduation. We do not yet know if the high stakes will impact our dropout rate or will result in less positive outcomes for students with disabilities. · At this time, there is no other alternative diploma other than the Special Education Diploma or a Certificate of Attendance. There are many bright students with disabilities who will not be able to continue with their education due to not getting a regular diploma. · Concerns related to students with disabilities who may not become proficient on grade level state standards or may not be able to earn credits for graduation. |
|
IEP team decision making and knowledge of state standards (5 states) |
· Getting the special education teachers and administrators familiar with the Curriculum Framework and that it is for ALL students, not just general education students. · Still a real issue with training teachers and IEP Teams how to determine appropriate instructional and assessment accommodations. · Getting IEP Teams to understand how to provide true access to the general education curriculum. |
|
Use of accommodations, universally designed assessments, and computer-based assessments (5 states) |
· Universal design as it applies to test development. · Accommodations guidance and need to revisit/review more frequently. · The introduction of the computerized assessment that is being designed now will require staff development. |
|
Gap issues (4 states) |
· Assessing students who are not appropriate to participate in the regular assessments or the alternate. · Concern for students who are not appropriate for alternate but cannot meet state standardsparticularly in light of NCLB. |
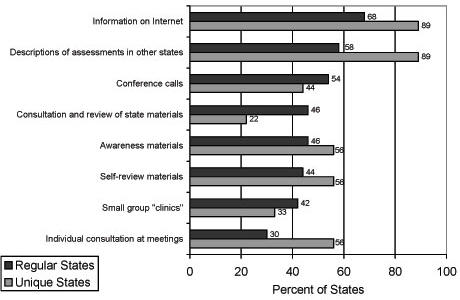
Technical assistance preferences of states are shown in Figure 20. The most highly preferred form of technical assistance in 2003 was information via the Internet. Conference calls also were an important form of technical assistance. Nearly all of the unique states selected descriptions of assessment practices in other states and information available via the Internet.
Figure 20. Preferred Forms of Technical Assistance