Prepared by:
Sandra Thompson • Martha L. Thurlow
June 2001
Any or all portions of this document may be reproduced and distributed without prior permission, provided the source is cited as:
Thompson, S., & Thurlow, M. (2001). 2001 State special education outcomes: A report on state activities at the beginning of a new decade. Minneapolis, MN: University of Minnesota, National Center on Educational Outcomes. Retrieved [today's date], from the World Wide Web: http://cehd.umn.edu/NCEO/OnlinePubs/2001StateReport.html
NCEO is a collaborative effort of the University of Minnesota, theNational Association of State Directors of Special Education (NASDSE), and the Council of Chief State School Officers (CCSSO). NCEO provides national leadership in assisting state and local education agencies in their development of policies and practices that encourage and support the participation of students with disabilities in accountability systems and data collection efforts.
NCEO focuses its efforts in the following areas:
Research on the participation and performance of students with disabilities in state and national assessments and other educational reform efforts.
Dissemination and Technical Assistance through publications, presentations, technical assistance, and other networking activities.
Collaboration and Leadership to build on the expertise of others and to develop leaders who can conduct needed research and provide additional technical assistance.
The Center is supported primarily through a Cooperative Agreement (#H326G000001) with the Research to Practice Division, Office of Special Education Programs, U.S. Department of Education. Additional support for targeted projects, including those on limited English proficient students, is provided by other federal and state agencies. The Center is affiliated with the Institute on Community Integration in the College of Education and Human Development, University of Minnesota. Opinions or points of view expressed within this document do not necessarily represent those of the Department of Education or the Offices within it.
The University of Minnesota is an equal opportunity educator and employer.
A comprehensive report that contains information from all 50 states is only possible through the collective efforts of every state director and staff. Thanks to the thoughtful responses of the directors and their designees who completed this survey, we are able to share trends, accomplishments, and frustrations. We appreciate the willingness of many of the respondents to share their progress honestly, knowing that we are all learning as we go and that progress is sometimes painfully slow and tedious. The purpose of this report is not to check for compliance with federal mandates nor to point fingers at states that have had a difficult time moving their systems forward; it is simply to capture where states are now and to provide information to help states view their own progress in light of other states.
State agency personnel are often barraged by requests for information. With the value of each director’s time in mind, we designed a survey that would capture information not requested by other groups, a survey that could be completed online in a minimal amount of time. We appreciate the time taken by respondents to talk to people outside of special education, and we hope that this collaborative effort increased awareness within and across state programs and departments.
For their support, special thanks go to:
David Malouf and Lou Danielson, of the Office of Special Education Programs in the U.S. Department of Education;
Eileen Ahearn, of the National Association of State Directors of Special Education; and
Michael Moore, online survey designer and communications director for the National Center on Educational Outcomes.
2001 State Special Education Outcomes was prepared by Sandra Thompson and Martha Thurlow, with support from research assistant Chris Boys.
| ALABAMA Mabrey Whetstone |
KENTUCKY Mike Armstrong |
NORTH CAROLINA Lowell Harris |
WISCONSIN Stephanie Petska |
| ALASKA Greg Maloney |
LOUISIANA Virginia Beridon |
NORTH DAKOTA Robert Rutten |
WYOMING Rebecca Walk |
| ARIZONA Lynn Busenbark |
MAINE David Stockford |
OHIO John Herner |
AMERICAN SAMOA Jane French |
| ARKANSAS Marcia Harding |
MARYLAND Carol Ann Baglin |
OKLAHOMA Darla Griffin |
BUREAU OF INDIAN AFFAIRS Angelita Felix |
| CALIFORNIA Alice Parker |
MASSACHUSETTS Marcia Mittnacht |
OREGON Steve Johnson |
DEPARTMENT OF DEFENSE Lorrie Sebestyen (acting) |
| COLORADO Lorrie Harkness |
MICHIGAN Jacquelyn Thompson |
PENNSYLVANIA Fran Warkowski |
DISTRICT OF COLUMBIA Ann Gay |
| CONNECTICUT George Dowaliby |
MINNESOTA Norena Hale |
RHODE ISLAND Thomas Dipaola |
GUAM Vince Leon Guerrero |
| DELAWARE Martha Brooks |
MISSISSIPPI Ed Kelly |
SOUTH CAROLINA Susan Durant |
MARIANA ISLANDS Suzanne Lizama (acting) |
| FLORIDA Shan Goff |
MISSOURI Melodie Friedebach |
SOUTH DAKOTA Deborah Barnett |
MARSHALL ISLANDS Kanchi Hosia |
| GEORGIA Philip Pickens |
MONTANA Robert Runkel |
TENNESSEE Joseph Fisher |
MICRONESIA Makir Keller |
| HAWAII Debra Farmer |
NEBRASKA Gary Sherman |
TEXAS Eugene Lenz |
PALAU Evans Imetengel |
| IDAHO Jana Jones |
NEVADA Gloria Dopf |
UTAH Mae Taylor |
PUERTO RICO Maria Teresa Morales |
| ILLINOIS Gordon Riffel |
NEW HAMPSHIRE Debra Grabill |
VERMONT |
U.S. VIRGIN ISLANDS Belinda West-O’Neal |
| INDIANA Robert Marra |
NEW JERSEY Barbara Gantwerk |
VIRGINIA Doug Cox |
|
| IOWA Brenda Oas |
NEW MEXICO Robert Pasternack |
WASHINGTON Douglas Gill |
|
| KANSAS Alexa Pochowski |
NEW YORK Lawrence Gloeckler |
WEST VIRGINIA Dee Bodkins |
These were the state directors of special education in April 2001 when the survey was conducted.
This report summarizes the eighth survey of state directors of special education by the National Center on Educational Outcomes (NCEO) at the University of Minnesota. Results include all 50 states and the Bureau of Indian Affairs, American Samoa, and Palau. The purpose of this report is to capture the state of the nation as states build the participation and performance of students with disabilities in state and district standards, assessments, and accountability systems, and to provide information to help states view their own progress
State directors report increased participation rates of students with disabilities in state assessments, and in many cases, improvement in performance as well. This first year of alternate assessment implementation has been challenging, but most states now have systems in place and are grappling with how to include the results in their accountability systems in ways that show the progress of every student toward state and district standards.
Among the more striking findings are the following:
More states listed positive consequences of inclusive standards, assessments, and accountability than listed negative consequences.
More than half of the states reported increases in participation rates.
In two-thirds of the states, directors reported stable or increased performance levels of students with disabilities on state tests.
Nearly 60% of states keep track of the use of accommodations, and half of these reported increased use of accommodations.
Most states are using a portfolio or body of evidence approach for their alternate assessments.
While students may use accommodations whether or not they are approved, nearly half of the states do not report the scores of students who use non-approved accommodations.
Twenty-five states include alternate assessment participants in all components of their accountability systems.
A positive theme throughout this report is that the benefits of inclusive assessment and accountability systems are beginning to outweigh the challenges, and many states are taking positive approaches as they face the challenges ahead.
This report marks the eighth time over the past ten years that the National Center on Educational Outcomes has collected information from state directors of special education about the participation of students with disabilities in education reform. Reform efforts continue to evolve at a rapid pace. The purpose of this report is to capture the progress of states as they move toward assessment and accountability systems that include every student.
It is clear from the results of this survey that states are working hard to increase accountability for all students. As described in many NCEO publications and elsewhere, there are several important reasons why all students need to be included in assessment and accountability systems—to:
The 2001 Special Education Outcomes Survey focuses on the implications of educational reform within the context of the 1997 reauthorization of the Individuals with Disabilities Education Act
• Consequences of Inclusive Standards, Assessments, and Accountability
• Assessment Participation and Performance
• Assessment Accommodations
• Alternate Assessments
• Reporting
• Accountability
• Current Issues
• Emerging Issues
Participants in the 2001 survey included state directors of special education from all 50 states and 11 federal jurisdictions that abide by the provisions of IDEA (referred to in this report as “unique states”). Responses to the survey were gathered online and via fax. To view the survey instrument, go to http://cehd.umn.edu/NCEO/NCEOSurveys/SpEdDirectors_Survey.htm. Some state directors designated other state officials to complete the survey, and multiple respondents, including state assessment and accountability personnel, completed some surveys.
Once compiled, drafts of tables were sent to state directors for verification. Overall, responses were obtained from all 50 states and from the Bureau of Indian Affairs, American Samoa, and Palau.
As you will read in this report, state directors are reporting increased participation rates of students with disabilities in state assessments, and in many cases, improvement in performance as well. This first year of alternate assessment implementation has been challenging, but most states now have their systems in place and are grappling with how to include the results in their accountability systems in ways that show the progress of every student toward state and district standards. A positive theme throughout this report is that the benefits of inclusive assessment and accountability systems are beginning to outweigh the barriers, and many states are taking positive approaches as they face the challenges ahead.
| Eleven Unique States |
| American Samoa Bureau of Indian Affairs (BIA) Department of Defense District of Columbia Guam Mariana Islands Marshall Islands Micronesia Palau Puerto Rico U.S. Virgin Islands |
“So, how’s it going there then?” – a phrase often heard in the Midwest – reflects the importance of the bottom line. The “bottom line” for inclusive assessment and accountability is whether the time and effort (the costs) are worth the benefits. We asked respondents to think about inclusive standards, assessment, and accountability as a whole, and to evaluate the bottom line.
The states gave very positive responses when asked to describe consequences that had been observed or heard about as a result of the participation of students with disabilities in state standards, assessments, and accountability systems. As one director stated, “The benefits seem to outweigh the negative consequences.” Figure 1 lists positive consequences identified by 40 states. The unique states did not list any consequences.
Figure 1. Positive Consequences of the Participation of Students with Disabilities in Standards, Assessments, and Accountability
In addition to those listed in Figure 1, at least two states identified each of these positive consequences:
Accommodations for students receiving special education services have allowed these students to pursue a regular high school diploma.
Higher level of awareness of parents about standards and assessments has emerged, as well as increased expectations for students.
Increased use of accommodations, including assistive technology, has
occurred.
Teacher attention to student achievement of skills included on assessments has grown.
District awareness of educational issues facing students with disabilities has increased.
State and district test scores did not drop significantly with the inclusion of students with disabilities.
Greater effort is being made to include special education personnel in staff development that addresses instruction toward standards.
States also recognize that there have been some challenges and negative
consequences as students with disabilities are included in standards,
assessments, and accountability systems. Figure 2 lists the primary negative
consequences described by state directors in 30 states.
Figure 2. Negative Consequences of the Participation of Students with Disabilities in Standards, Assessments, and Accountability Systems
Additional negative consequences, each identified by at least two states include:
Teachers, administrators, and parents are frustrated because they do not fully understand the system.
Some students with IEPs may always perform at the “unsatisfactory” level; other measures will be needed to determine student growth.
There are still students not being adequately addressed.
Misleading reports of student progress.
Both the participation of students with disabilities in assessments and their performance are important indicators of the progress states are making. State by state responses on changes in participation and performance are provided in Appendix A.
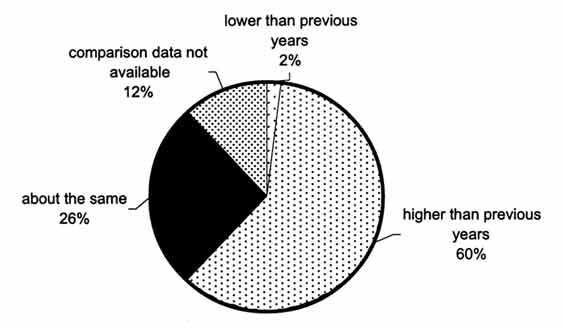
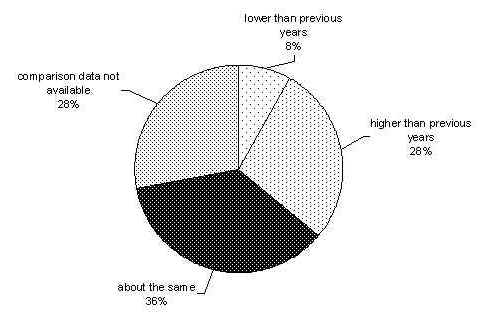
Over half of the regular states reported an increase in the test
participation rates of students with disabilities on their state assessments
(see Figure 3). Several directors attribute this increase to alternate
assessment participation by students who have been excluded in the past. An
additional 26% of the directors said that the test participation rates had
remained about the same, and only one state reported a decrease in
participation rates. The remaining six states were not able to make a
comparison across years. Four of these states said that their assessment
system was so new that comparison data were not yet available. In addition,
one unique state reported an increase in participation rates and two
reported that this information is not yet available.
Figure 3. Change in Participation Levels of Students with Disabilities on State Assessments
All students are included in state assessments in Alaska, Arkansas,
Connecticut, Delaware, Florida, Illinois, Montana, Nebraska, New Jersey, New
Mexico, Rhode Island, and Vermont (see Figure 4). The remaining states allow
assessment exclusion for a variety of reasons, including parent refusal,
medically fragile, emotional distress, homebound, hospitalized, limited
English proficient, and absent on test days (see Table 1).
Table 1. Reasons Allwed by State Policy for Students to be Excused
from Assessment Participation
State |
Parent Refusal |
Medically Fragile |
Emotional Distress |
Homebound |
Hospitalized |
Limited English Proficient |
Absent on Test Days |
Other |
Alabama |
|
|
|
|
|
X |
|
|
Arizona |
|
|
|
|
|
|
X |
|
California |
X |
|
|
|
|
|
|
|
Colorado |
X |
|
|
|
|
X |
|
X |
Georgia |
X |
|
|
|
|
|
|
|
Hawaii |
X |
X |
X |
X |
X |
X |
|
|
Idaho |
|
|
X |
|
|
|
|
X |
Iowa |
|
|
|
|
|
|
|
X |
Indiana |
|
|
|
|
|
X |
|
|
Kansas |
|
X |
|
|
|
|
|
|
Kentucky |
|
|
|
|
|
|
|
X |
Louisiana |
|
X |
|
|
X |
X |
X |
|
Maine |
X |
X |
X |
|
X |
|
|
|
Maryland |
|
|
X |
X |
X |
|
|
X |
Massachusetts |
|
|
|
|
|
X |
X |
|
Michigan |
X |
|
|
|
|
X |
|
|
Minnesota |
X |
X |
X |
X |
X |
X |
|
|
Mississippi |
X |
|
|
|
|
X |
|
|
Missouri |
|
|
|
|
|
X |
|
|
Nevada |
|
|
|
|
|
|
X |
|
New Hampshire |
|
|
|
|
|
X |
X |
|
New York |
|
|
|
|
|
|
|
X |
North Carolina |
|
|
|
|
|
|
X |
|
North Dakota |
X |
|
|
|
|
X |
X |
|
Ohio |
|
|
|
|
|
|
|
X |
Oklahoma |
|
|
|
|
|
X |
X |
|
Oregon |
X |
|
|
|
|
|
|
|
Pennsylvania |
|
|
|
|
|
|
|
X |
South Carolina |
|
|
|
|
|
|
|
X |
South Dakota |
|
|
|
|
|
|
|
X |
Tennessee |
|
X |
|
|
|
|
|
|
Texas |
|
|
|
|
|
|
|
X |
Utah |
|
X |
X |
X |
X |
X |
X |
|
Vermont |
|
|
|
|
|
|
|
X |
Virginia |
|
|
|
|
|
X |
|
|
Washington |
X |
|
|
|
|
|
|
|
West Virginia |
|
|
|
X |
X |
X |
|
|
Wisconsin |
|
X |
|
|
|
|
|
|
Wyoming |
|
X |
|
X |
X |
X |
|
|
Unique States |
|
|
|
|
|
|
|
|
American Samoa |
|
|
|
|
|
|
|
X |
Bureau of Indian Affairs |
X |
|
|
|
|
|
X |
X |
Department of Defense* |
|
|
|
|
|
|
|
|
District of Columbia* |
|
|
|
|
|
|
|
|
Guam* |
|
|
|
|
|
|
|
|
Mariana Islands* |
|
|
|
|
|
|
|
|
Marshall Islands* |
|
|
|
|
|
|
|
|
Micronesia* |
|
|
|
|
|
|
|
|
Palau |
|
|
|
|
|
|
|
X |
Puerto Rico* |
|
|
|
|
|
|
|
|
U.S. Virgin Islands* |
|
|
|
|
|
|
|
|
Totals |
12 |
9 |
6 |
6 |
8 |
17 |
10 |
15 |
*No Response
Figure 4. States with No Students Excused from Assessment Participation
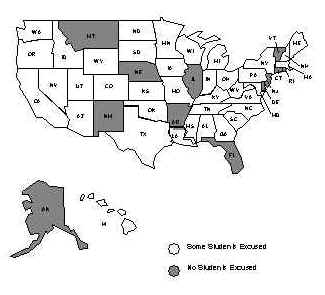
The most frequent reasons allowed for exclusion are having limited English proficiency and parent refusal. “Other” includes seven states that allow exclusion for any reason deemed appropriate by a student’s IEP team. One director commented that “in theory” no one is excused, but “in reality” there are students who are absent and do not make up the tests.
Test performance levels of students with disabilities on state assessments have increased in over one fourth of the regular states (see Figure 5). One state director commented that, using data over time, the state found that students with IEPs showed improvement in all content areas assessed. Another director was surprised to find that in third grade testing, students with disabilities performed as well or better than general education students in some jurisdictions. About one third of the state directors report stable performance levels. Four states reported that the performance level of students with disabilities on state assessments has decreased, and two of these states attribute the change to greater participation of lower performing students. Fourteen states are not able to compare performance levels across years, either because data are available for only one year, or because performance data of students with disabilities have not yet been disaggregated. None of the unique states is able to report performance trends.
Figure 5. Change in Performance Levels of Students with Disabilities on State Assessments
Accommodations provide students access to assessments. As more students are included in assessments, states often become interested in identifying how many students are using accommodations. State by state responses to questions about changes in use of accommodations, students eligible for accommodations, and data collection procedures are provided in Appendix B.
Nearly sixty percent of the regular states keep track of the use of accommodations during state assessments—about half of these report an increase in use and the other half report stable use (see Figure 6). Two directors attribute growth in use to increased awareness and understanding by parents and educators. One unique state reported an increase, also due to increased awareness; two unique states do not keep track of accommodations use.
Figure 6. Change in Accommodations Use by Students with Disabilities on State Assessments
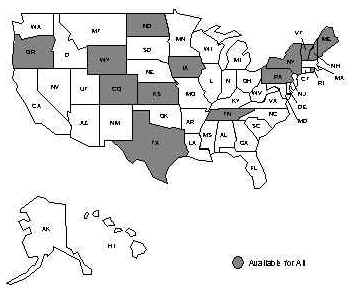
There are 14 states in which assessment accommodations are available for any student with a need regardless of whether the student has an IEP or a 504 plan (see Figure 7). For example, Colorado provides assessment accommodations for any child as long as the accommodations are provided during instruction at least three months prior to the assessment. Some states, however, may allow only a subset of accommodations for students without disabilities.
All states, including the three unique states that responded to the survey, reported that students receiving special education services are eligible for assessment accommodations. All but two states also reported that students with 504 Accommodation Plans are eligible for assessment accommodations.
Figure 7. States with Assessment Accommodations Available for All Students
Over two thirds of regular states (35 states) reported that accommodations are recorded either on the test itself or on a form completed at the time of testing. Some states document the type of accommodation a student uses. For example, Massachusetts has its most commonly used accommodations number-coded on the test form with a code for “other.” Other states (usually those using norm-referenced tests) record whether an accommodation is considered standard or non-standard by the test publisher, but do not record the specific accommodation used.
Six states code accommodation use directly from a student’s IEP to the test form. For example, in Delaware a paper form is completed at a student’s IEP meeting that indicates all of the accommodations the student will have when tested. Data from this form are then entered electronically into the state database and used to place special test orders (e.g., large print), and to make sure students receive the accommodations they need on test day (e.g., extended time). None of the respondents from the unique states record test accommodation use.
Beginning in 1997, NCEO maintained an online alternate assessment survey. States were able to check at any time what other states were doing and were able to frequently update their own information. As states moved into the July 1, 2000 implementation phase, NCEO phased out its ongoing alternate assessment survey, and moved questions on alternate assessment into this survey of states. The information in this report is the third written summary of the status of states as they move from initial implementation to the use of alternate assessment results. State by state information is provided in Appendix C.
While NCEO did not ask directly whether states had alternate assessments, the composite information on stakeholders, standards assessed, performance measures and descriptors, and scoring procedures suggest that nearly all states are working on some aspect of their alternate assessments.
Every state involved some type of stakeholder group
in the development of their alternate assessments. All
stakeholder groups included state and local special
education personnel (see Table 2). In addition, most
states included state and local assessment directors and
coordinators, local school administrators, related
service personnel, and general educators. Nearly all
states also included parents and advocates, and a few
included students and adults with disabilities. Other
stakeholders included university personnel, test
developers, and a variety of additional technical
assistance providers.
Table 2. Stakeholders Involved in the Development of State Alternate Assessments
|
Regular States |
Unique States* |
State special education personnel |
50 |
1 |
Local special educators |
50 |
1 |
State assessment personnel |
49 |
1 |
Parents |
44 |
0 |
Local school administrators |
44 |
0 |
Local related service personnel |
41 |
0 |
Local assessment coordinators |
39 |
1 |
Advocates |
34 |
0 |
Local general educators |
31 |
0 |
Adults with disabilities |
8 |
0 |
Students |
6 |
0 |
Other |
8 |
3 |
*3 unique states responded
Nearly all state alternate assessments assess the same standards as general assessments either by expanding state standards, linking a set of functional skills back to standards, or assessing standards plus an additional set of functional skills. Georgia, Mississippi, Nebraska, and Ohio assess functional skills only, with no link to state standards. Iowa links the alternate assessment to local standards. Texas and Wisconsin allow IEP teams to determine what their individualized alternate assessments will assess. Of the unique state respondents, American Samoa links functional skills to standards, while Palau and the Bureau of Indian Affairs are uncertain, either because no decision has been made or an alternate assessment has not been administered.
Table 3 shows how the alignment of alternate assessments with
standards has evolved since 1999. Several states that in 1999
indicated they were developing alternate assessments based on a
special education curriculum no longer give that response.
Instead, they have moved to responses indicating some connection
between the alternate assessment and state standards.
Table 3. Standards Addressed by Alternate Assessments: Change Over Time
Year |
State Standards (May be Expanded) |
Functional Skills Linked Back to State Standards |
State Standards Plus FunctionalSkills |
Functional Skills Only, No Link to State Standards |
Other or Uncertain |
1999* |
19 (38%) |
--- |
1 ( 2%) |
16 (32%) |
24 (48%) |
2000** |
28 (56%) |
3 ( 6%) |
7 (14%) |
9 (18%) |
3 ( 6%) |
2001*** |
19 (38%) |
15 (30%) |
9 (18%) |
4 ( 8%) |
3 ( 6%) |
Note: Entries are number and percentage
of states.
*Data are from Thompson, S., Erickson, R., Thurlow, M.,
Ysseldyke, J., & Callender, S. (1999).
Status of the states in the development of alternate
assessments (Synthesis Report 31). Minneapolis:
University of Minnesota, National Center on Educational
Outcomes.
** Data are from Thompson, S., & Thurlow, M. (2000). State alternate assessments: Status as IDEA
alternate assessment requirements take effect (Synthesis
Report 35). Minneapolis: University of Minnesota, National
Center on Educational Outcomes.
*** All numbers and percentages are based on 50 states.
State approaches to collecting alternate assessment data
continue to reflect a variety of methods (see Table 4).
Approaches have evolved as alternate assessments have been
piloted and refined. In 2001, nearly half of the states
indicated that they use some type of portfolio or body of
evidence, nine states have selected a checklist or rating
scale approach, and three states use an analysis of IEP
goals. In addition, some states have selected specific
performance-based assessments, a combination of approaches,
or they do not use any particular approach, allowing IEP
teams to determine how they will collect data on individual
students. Among the respondents from unique states, American
Samoa uses a checklist, while Palau and the Bureau of Indian
Affairs are uncertain, either because no decision has been
made or an alternate assessment has not been administered.
Table 4. Alternate Assessment Approaches in 2000 and 2001
Year |
Portfolio/Body of Evidence |
Checklist |
IEP Analysis |
Other |
State Has Not Decided |
2000* |
28 (56%) |
4 ( 8%) |
5 (10%) |
6 (12%) |
7 (14%) |
2001** |
24 (48%) |
9 (18%) |
3 ( 6%) |
12 (24%) |
2 ( 4%) |
Note: Entries are number and percentage of
states.
* Data are from Thompson, S., & Thurlow, M. (2000). State alternate assessments: Status as IDEA
alternate assessment requirements take effect (Synthesis Report 35).
Minneapolis: University of Minnesota, National Center on Educational
Outcomes.
** All numbers and percentages are based on 50 states.
States have developed a variety of performance measures to use in reporting the performance of alternate assessment participants as a group. Some are measures of student performance, while others are measures of system performance (see Figure 8). State responses here do not tell us whether they use a single performance descriptor or “score” that combines many measures holistically, or whether they score each dimension and then combine all of the scores to determine a student’s level of performance.
Figure 8. Alternate Assessment Student and System Performance Measures
*Unique states are not reflected in this figure
All states use some measure of student performance for their alternate assessments, with about 80% measuring level of skill or competence. Nearly half of the states measure degree of progress in addition to or instead of skill/competence. Additional measures used by several states include level of independence and ability to generalize. “Other” includes three states that allow IEP teams to determine performance measures. American Samoa, a unique state, measures skill and level of independence.
About 20 states measure levels of staff support, variety of instructional settings, and appropriateness (defined as age appropriate and challenging for students). Twelve states measure participation in general education settings, and nine states measure parent satisfaction. Eight states do not measure system performance as part of their alternate assessment.
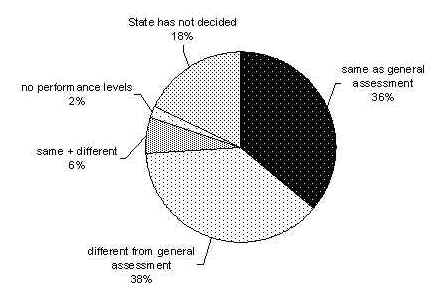
About a third of the states have chosen the same performance descriptors for their alternate assessment as for the general assessment; more have different performance indicators for their alternate and general assessments (see Figure 9). Three states use the same performance descriptors plus different ones. Wisconsin scores all alternate assessment participants as “prerequisite.” Nine states and all three unique state respondents have not yet decided on performance descriptors.
Figure 9. Alternate Assessment Performance Descriptors
Most states have teachers scoring the alternate assessments of their own students (see Figure 10). Teachers from other districts, sometimes in collaboration or with direction from test companies, score alternate assessments in about a quarter of the states. Relatively few states have other teachers from a student’s district or the state agency score alternate assessments. A variety of other scorers (e.g., IEP teams) are used in 10 states. Six states and all three unique state respondents have not decided how they will score their alternate assessments.
Figure 10. Alternate Assessment Scorers
States indicated whether they report the assessment scores of students who take tests in various ways—with approved accommodations, non-approved accommodations (sometimes called modifications or non-standard administrations), alternate assessments, and out-of-level tests—and whether students who were not assessed are included in reports (see Table 5). State by state responses are provided in Appendix D.
Table 5. Reporting Alternatives
| Score Reported | Score Not Reported | Other | Not Decided | |||||
|---|---|---|---|---|---|---|---|---|
| Regular States | Unique States | Regular States | Unique States | Regular States | Unique States | Regular States | Unique States | |
| Approved Accommodations |
49 (98%) |
2 | 0 | 0 | 0 | 0 | 1 ( 2%) |
1 |
| Non-approved Accommodations |
27 (54%) |
2 |
7 (14%) |
0 |
14 (28%) |
0 | 2 ( 4%) |
1 |
| Alternate Assessments |
27 (54%) |
1 | 3 ( 6%) |
0 | 4 ( 8%) |
0 |
16 (32%) |
2 |
| Out-of-Level Tests |
13 (26%) |
1 | 2 ( 4%) |
0 |
33* (66%) |
1 | 2 ( 4%) |
1 |
| Not Tested |
8** (16%) |
0 |
28 (56%) |
2 |
9*** (18%) |
0 | 5 (10%) |
1 |
*These states do not administer out-of-level tests
** Untested students given score of “1” or “0”
*** All students are tested
Almost all states report students using approved accommodations, but just over half report the scores of students who use non-approved accommodations. About the same number of states report scores of alternate assessment participants; however, about one third of states have not yet made a decision about how to report these scores. Of the 17 states that use out-of-level tests, 13 report the scores of students who take tests designed for students at a lower grade level. Some states give a score of “1” or “0” to students who are not tested (e.g., students who are absent on test days are counted and given the lowest possible score). Of the unique state respondents, Palau reported that they are still working on reporting decisions, American Samoa reports scores in most areas, and the Bureau of Indian Affairs reports scores on BIA funded schools in a variety of formats.
Most states aggregate the scores of assessment participants using
accommodations they view as not changing the test (i.e., approved
accommodations) with those of all other assessment participants (see Table 6).
Only half of the states that report the scores of students using non-approved
accommodations aggregate those scores; other states report scores of these
students separately or at the lowest score level. Of the states that have
scoring systems in place for alternate assessments, most report scores
separately from those of general assessment participants. States reporting
scores of out-of-level test participants are split in their decisions to
aggregate or report scores separately. Unique states show reporting decisions
similar to those of other states.
Table 6. How Scores are Reported
| Score Aggregated with All | Separate Score Report | Given Lowest Score and Aggregated | Given Score of Zero and Aggregated | |||||
|---|---|---|---|---|---|---|---|---|
| Regular States | Unique States | Regular States | Unique States | Regular States | Unique States | Regular States | Unique States | |
| Approved Accommodations (n = 49) |
47 (96%) |
1 |
2 ( 4%) |
1 | 0 | 0 | 0 | 0 |
| Non-approved Accommodations (n = 27) |
13 (48%) |
1 |
12 (44%) |
1 |
2 ( 7%) |
0 |
1 ( 4%) |
0 |
| Alternate Assessments (n = 27) |
10 (37%) |
0 |
20 (74%) |
1 | 0 | 0 | 0 | 0 |
| Out-of-Level Tests (n = 13) |
8 (62%) |
1 |
6 (46%) |
0 | 1 ( 8%) |
0 | 0 | 0 |
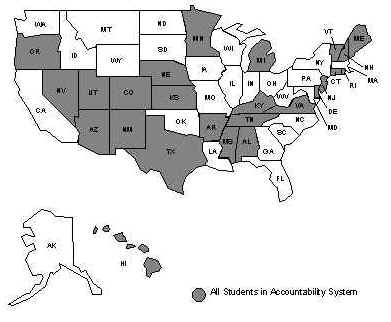
Nearly all states have accountability systems that include assessment performance. According to state directors, between one third and two thirds of the states also include dropout rates, attendance, suspension rates, and graduation rates (see Appendix E). While states may include students with disabilities who participate in general assessments (with accommodations as needed), they do not necessarily include them in other components (for example, alternate assessment participants are less likely to be included in measures of graduation rates than are other students with disabilities). In 25 states, all students with disabilities—including alternate assessment participants—are included in all components of the accountability system (see Figure 11).
Figure 11. States in Which All Students with Disabilities are Included in All Components of the Accountability System
Assessment performance of alternate assessment participants is included as a component of the accountability systems in just over half of the states (58%). Fifteen states have not made a decision about how to include alternate assessment participants in their accountability systems (see Table 7).
Table 7. Components of State Accountability Systems
State |
Total Number of Components |
Number that Include Students with Disabilities |
Number that Include Alternate Assessment Participants |
Alabama |
1 |
1 |
1 |
Alaska |
4 |
4 |
1 |
Arizona |
2 |
2 |
2 |
Arkansas |
5 |
5 |
5 |
California |
3 |
Undecided |
Undecided |
Colorado |
5 |
5 |
5 |
Connecticut |
4 |
4 |
4 |
Delaware |
1 |
1 |
1 |
Florida |
5 |
5 |
4 |
Georgia |
2 |
Undecided |
Undecided |
Hawaii |
5 |
5 |
5 |
Idaho |
5 |
4 |
4 |
Illinois |
3 |
3 |
Undecided |
Indiana |
3 |
3 |
Undecided |
Iowa |
3 |
4 |
4 |
Kansas |
5 |
5 |
5 |
Kentucky |
4 |
4 |
4 |
Louisiana |
4 |
4 |
2 |
Maine |
1 |
1 |
1 |
Maryland |
5 |
5 |
1 |
Massachusetts |
1 |
2 |
Undecided |
Michigan |
1 |
1 |
1 |
Minnesota |
4 |
4 |
4 |
Mississippi |
1 |
1 |
1 |
Missouri |
4 |
4 |
Undecided |
Montana |
4 |
Undecided |
Undecided |
North Carolina |
3 |
3 |
2 |
North Dakota |
4 |
1 |
Undecided |
Nebraska |
5 |
5 |
5 |
Nevada |
5 |
5 |
5 |
New Hampshire |
1 |
1 |
1 |
New Jersey |
5 |
5 |
5 |
New Mexico |
4 |
4 |
4 |
New York |
2 |
2 |
Undecided |
Ohio |
5 |
5 |
Undecided |
Oklahoma |
Undecided |
Undecided |
Undecided |
Oregon |
4 |
4 |
4 |
Pennsylvania |
2 |
2 |
Undecided |
Rhode Island |
1 |
1 |
1 |
South Carolina |
5 |
1 |
1 |
South Dakota |
Undecided |
Undecided |
Undecided |
Tennessee |
1 |
1 |
1 |
Texas |
5 |
5 |
5 |
Utah |
1 |
1 |
1 |
Virginia |
1 |
1 |
1 |
Vermont |
2 |
2 |
2 |
Washington |
Undecided |
Undecided |
Undecided |
West Virginia |
4 |
4 |
3 |
Wisconsin |
5 |
4 |
4 |
Wyoming |
Undecided |
Undecided |
Undecided |
|
|||
American Samoa |
Undecided |
Undecided |
Undecided |
Bureau of Indian Affairs |
5 |
5 |
Undecided |
Department of Defense* |
|
|
|
District of Columbia* |
|
|
|
Guam* |
|
|
|
Mariana Islands* |
|
|
|
Marshall Islands* |
|
|
|
Micronesia* |
|
|
|
Palau |
Undecided |
Undecided |
Undecided |
Puerto Rico* |
|
|
|
U.S. Virgin Islands* |
|
|
|
Bold states
include all students with
disabilities in all components of a
state’s accountability system.
* No Response
As students with disabilities are
included in assessment and
accountability systems, a variety of
issues emerge. Some of these have
been recorded in past reports (such
as out-of-level testing) while
others are new (such as assessing
students with disabilities who have
limited English proficiency). State
by state responses on the issues are
provided in Appendix F.
The number of states using
out-of-level tests as an assessment
participation option has increased
again (see Table 8). Only one of the
five states that used out-of-level
testing in 1997 no longer allows it
(Kansas). Similarly, just one of the
ten states that used out-of-level
testing in 1999 no longer allows it
(Montana). None of the unique states
reported using out-of-level testing.
Table 8. States Using Out-Of-Level Tests – Change from 1997 to 2001
| 1997* | 1999** | 2001 |
|
1. Alabama 2. Connecticut 3. Georgia 4. Kansas 5. Louisiana |
1. Arizona 2. California 3. Connecticut 4. Georgia 5. Louisiana 6. Mississippi 7. Montana 8. South Carolina 9. Vermont 10. West Virginia |
1.
Alabama 2. Arizona 3. California 4. Connecticut 5. Delaware 6. Georgia 7. Hawaii 8. Iowa 9. Louisiana 10. Mississippi 11. North Dakota 12. Oregon 13. South Carolina 14. Texas 15. Utah 16. Vermont 17. West Virginia |
*Data are from
Thurlow, M., Seyfarth, A., Scott, &
Ysseldyke, J. (1997). State assessment policies on participation
and accommodations for students with
disabilities: 1997 update
(Synthesis Report 29). Minneapolis:
University of Minnesota, National
Center on Educational Outcomes.
**Data are from Thurlow, M., House,
A., Boys, C. Scott, D, & Ysseldyke,
J. (2000). State participation and accommodation
policies for students with
disabilities: 1999 update.
(Synthesis Report 33). Minneapolis:
University of Minnesota, National
Center on Educational Outcomes.
There are increasing numbers of students who are at risk in our educational system primarily because they have not yet gained proficiency in the English language, and a certain percentage of these students can be expected to experience disabilities and receive special education services. Approximately one-third of the states disaggregate either or both participation and performance data for limited English proficient students with disabilities (see Table 9). While most states do not disaggregate data for these students, several states indicated that they could if needed, or that they will be able to do so in the future.
Table 9. States that Disaggregate Assessment Data for LEP Students with Disabilities
Participation Data Only |
Performance Data Only |
Participation and Performance Data |
No Disaggregation |
|
Arizona |
Montana |
California |
Alaska Alabama Arkansas Delaware Iowa Idaho Illinois Indiana Kansas Louisiana Maryland Michigan Minnesota |
Missouri |
| 4 states (8%) | 4 states (8%) | 10 states (20%) | 26 states (52%) | |
Unique States |
||||
|
|
Palau |
American Samoa |
|
Note: No information or no response from
Hawaii, Mississippi, North Dakota, Ohio, Rhode Island, Washington,
Department of Defense, District of Columbia, Guam, Mariana Islands,
Marshall Islands, Micronesia, Puerto Rico, U.S. Virgin Islands.
The diploma options that are available to students with disabilities continues to be an issue with which states are struggling, especially as more and more states initiate high stakes testing. Forty-two states offer a state level diploma for successful school completion (see Table 10), whereas approximately 25 states offer a regular diploma to alternate assessment participants. Many states also offer a certificate of completion, attendance, or achievement; some states offer more than one of these options but only eight states have special education diplomas. Nearly all of these options are available for alternate assessment participants within states that offer them. Some states identified other options such as a vocational diploma and advanced studies diploma. Eight states are still deciding what type of exit document to award alternate assessment participants. None of the unique states reported offering a regular diploma to alternate assessment participants.
Table 10. Diploma Options Across States
| Exit Documents | Available in State | Available to Alternate Assessment Participants |
||
|---|---|---|---|---|
|
Regular |
Unique |
Regular |
Unique |
Regular Diploma |
42 (84%)* |
1 |
26 (52%) |
0 |
Special Education Diploma |
8 (16%) |
0 |
8 (16%) |
0 |
Certificate of Completion |
20 (40%) |
1 |
17 (34%) |
1 |
Certificate of Attendance |
11 (22%) |
1 |
12 (24%) |
1 |
Certificate of Achievement |
4 (8%) |
0 |
3 (6%) |
0 |
Other |
11 (22%) |
1 |
7 (14%) |
0 |
Undecided |
1 (2%) |
0 |
8 (16%) |
1 |
* Remaining states have local
diplomas or are revising their diploma options.
Getting information about standards and assessments to IEP teams is another challenge for states. Nearly every state director reported that information is sent to local special education directors who then pass it on to IEP team members (see Figure 12). In addition, almost half of the states send information directly to IEP team members. Most states also offer workshops and other training sessions and provide information about standards and assessment on the Internet. The unique states reported similar dissemination strategies.
Figure 12. How IEP Teams Learn about Standards and Assessments
When asked how content standards are addressed on IEPs in each state, over half of the state directors responded that IEP goals are aligned or referenced to state standards (see Figure 13). In some states, such as Alaska, Kentucky, and Montana, IEP teams are encouraged to use performance standards as a basis for creating IEP goals and objectives. Other states require IEP goals to address state standards (e.g., Arizona, Idaho, Kansas, New Mexico). Some of these requirements are addressed in policy and others, such as Illinois, address the requirements in law as follows:
A statement of measurable annual goals that reflect consideration of the State Goals for Learning and the Illinois Learning Standards…as well as benchmarks or short-term objectives…related to: Meeting the child’s needs that result from the child’s disability, to enable the child to be involved in and progress in the general curriculum.
Figure 13. How Standards are Addressed on IEPs
Ten state directors responded that addressing standards on IEPs is a local decision. Two state IEPs address standards for alternate assessment participants only. Another two states address standards only through the assessment decisions on their IEPs. One state attaches a checklist addressing standards to each student’s IEP. The unique states are just beginning work in this area.
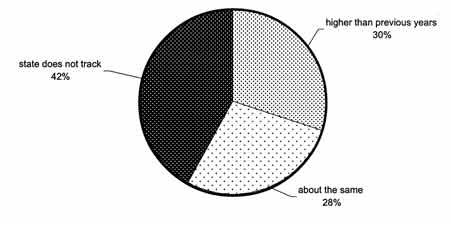
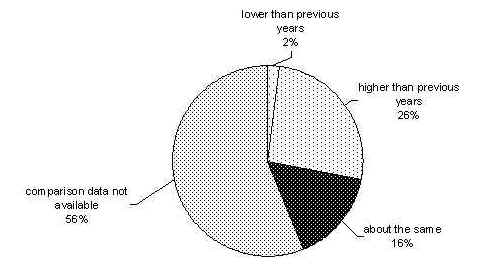
Anticipated increases in the number of referrals for special education services are an issue especially in states with high stakes assessments. Of the 22 states that track referral rates, 9 reported referral rates to be about the same or lower than in previous years, and 13 states reported an increase (see Figure 14). One unique state reported a lower referral rate and another reported that rates stayed about the same.
Figure 14. Change in Referral Rates
Many challenges remain for states as they continue to include students with disabilities in state assessments. State directors identify a wide range of emerging issues and challenges (see Figure 15). The most frequently mentioned are inclusive reporting, inclusive accountability, and the gray areas of assessment (referring to the inability of assessments to include all students appropriately). “Other” includes system stakes, participation decisions, and professional development.
Figure 15. Emerging Issues
State Assessment Participation and Performance Summary Table
State |
Change in Participation Rates |
Change in Performance Levels |
Alabama |
Higher |
Data Forthcoming |
Alaska |
Data Forthcoming |
Data Forthcoming |
Arizona |
Higher |
Same |
Arkansas |
Higher |
Data Forthcoming |
California |
Higher |
Higher |
Colorado |
Same |
Higher |
Connecticut |
Higher |
Same |
Delaware |
Data Forthcoming |
Higher |
Florida |
Higher |
Same |
Georgia |
Higher |
Same |
Hawaii |
Higher |
Data Forthcoming |
Idaho |
Higher |
Higher |
Illinois |
Same |
Same |
Indiana |
Higher |
Same |
Iowa |
Higher |
Same |
Kansas |
Higher |
Data Forthcoming |
Kentucky |
Same |
Same |
Louisiana |
Higher |
Higher |
Maine |
Higher |
Lower |
Maryland |
Same |
Same |
Massachusetts |
Same |
Same |
Michigan |
Data Forthcoming |
Higher |
Minnesota |
Same |
Same |
Mississippi |
Same |
Data Forthcoming |
Missouri |
Data Forthcoming |
Higher |
Montana |
Data Forthcoming |
Data Forthcoming |
Nebraska |
Data Forthcoming |
Data Forthcoming |
Nevada |
Higher |
Same |
New Hampshire |
Higher |
Data Forthcoming |
New Jersey |
Higher |
Lower |
New Mexico |
Higher |
Lower |
New York |
Higher |
Data Forthcoming |
North Carolina |
Higher |
Higher |
North Dakota |
Same |
Same |
Ohio |
Higher |
Data Forthcoming |
Oklahoma |
Higher |
Same |
Oregon |
Higher |
Same |
Pennsylvania |
Higher |
Lower |
Rhode Island |
Higher |
Same |
South Carolina |
Higher |
Data Forthcoming |
South Dakota |
Same |
Higher |
Tennessee |
Higher |
Data Forthcoming |
Texas |
Same |
Higher |
Utah |
Higher |
Higher |
Vermont |
Same |
Same |
Virginia |
Same |
Higher |
Washington |
Lower |
Higher |
West Virginia |
Higher |
Higher |
Wisconsin |
Higher |
Higher |
Wyoming |
Same |
Same |
Unique States |
|
|
American Samoa |
Data Forthcoming |
Data Forthcoming |
Bureau of Indian Affairs |
Higher |
Data Forthcoming |
Department of Defense |
No Response |
No Response |
District of Columbia |
No Response |
No Response |
Guam |
No Response |
No Response |
Mariana Islands |
No Response |
No Response |
Marshall Islands |
No Response |
No Response |
Micronesia |
No Response |
No Response |
Palau |
Data Forthcoming |
Data Forthcoming |
Puerto Rico |
No Response |
No Response |
U.S. Virgin Islands |
No Response |
No Response |
Key: No Response = State did not respond to the question; Data Forthcoming = State does not have results available (i.e., first year of test, testing not complete, results not compiled at time of survey, etc).
Accommodations Summary Table
State |
Change in Accommodation Use |
How State Collects Information on Accommodations Used |
Students Eligible forAccommodations |
Alabama |
No Record |
No Record |
IEP, 504, LEP |
Alaska |
Higher |
Form Indicates All |
IEP, 504, LEP |
Arizona |
No Record |
No Record |
IEP, 504, LEP |
Arkansas |
No Record |
Form Indicates All |
IEP, 504, LEP |
California |
No Record |
Form Indicates All |
IEP, 504 |
Colorado |
Higher |
Form Indicates One |
Any Student with Need |
Connecticut |
No Record |
Form Indicates All |
IEP, 504, LEP |
Delaware |
No Record |
IEP Info. Coded on Test |
IEP, 504, LEP |
Florida |
Same |
Form Indicates All |
IEP, 504, LEP |
Georgia |
No Record |
Form Indicates One |
IEP, 504, LEP |
Hawaii |
Higher |
Form Indicates All |
IEP, 504 |
Idaho |
Same |
No Record |
IEP, 504 |
Illinois |
No Record |
No Record |
IEP, 504 |
Indiana |
Higher |
Form Indicates All |
IEP, 504, LEP |
Iowa |
No Record |
No Record |
Any Student with Need |
Kansas |
Higher |
Form Indicates One |
Any Student with Need |
Kentucky |
Same |
Form Indicates All |
IEP, 504, LEP |
Louisiana |
Same |
Form Indicates All |
IEP, 504, LEP |
Maine |
Same |
IEP Info. Coded on Test |
Any Student with Need |
Maryland |
Higher |
Form Indicates All |
IEP, 504, LEP |
Massachusetts |
Higher |
Form Indicates All |
IEP, 504, LEP |
Michigan |
No Record |
Form Indicates One |
IEP, 504, LEP |
Minnesota |
Higher |
No Record |
IEP, 504, LEP |
Mississippi |
No Record |
No Record |
IEP |
Missouri |
Same |
Form Indicates All |
IEP, 504, LEP |
Montana |
No Record |
No Record |
IEP, 504, LEP |
Nebraska |
No Record |
No Record |
IEP, 504, LEP |
Nevada |
Higher |
No Record |
IEP, 504, LEP |
New Hampshire |
Same |
Form Indicates All |
Any Student with Need |
New Jersey |
Higher |
IEP Info. Coded on Test |
IEP, 504, LEP |
New Mexico |
No Record |
Form Indicates All |
IEP |
New York |
Higher |
Form Indicates All |
Any Student with Need |
North Carolina |
Higher |
IEP Info. Coded on Test |
IEP, 504, LEP |
North Dakota |
Higher |
IEP Info. Coded on Test |
Any Student with Need |
Ohio |
Same |
IEP Info. Coded on Test |
IEP, 504 |
Oklahoma |
No Record |
No Record |
IEP, 504, LEP |
Oregon |
No Record |
No Record |
Any Student with Need |
Pennsylvania |
Same |
Form Indicates All |
Any Student with Need |
Rhode Island |
Same |
Form Indicates All |
Any Student with Need |
South Carolina |
No Record |
No Record |
IEP, 504 |
South Dakota |
Same |
Form Indicates One |
IEP, 504 |
Tennessee |
Higher |
Form Indicates All |
Any Student with Need |
Texas |
No Record |
Form Indicates All |
Any Student with Need |
Utah |
No Record |
No Record |
IEP, 504, LEP |
Vermont |
Same |
Form Indicates All |
Any Student with Need |
Virginia |
No Record |
Form Indicates All |
IEP, 504, LEP |
Washington |
Same |
Form Indicates All |
IEP, 504, LEP |
West Virginia |
Higher |
Form Indicates One |
IEP, 504 |
Wisconsin |
No Record |
No Record |
IEP, 504, LEP |
Wyoming |
Same |
Form Indicates All |
Any Student with Need |
Unique States |
|
|
|
American Samoa |
Higher |
No Record |
IEP |
Bureau of Indian Affairs |
No Record |
No Record |
IEP, 504 |
Department of Defense |
No Response |
No Response |
No Response |
District of Columbia |
No Response |
No Response |
No Response |
Guam |
No Response |
No Response |
No Response |
Mariana Islands |
No Response |
No Response |
No Response |
Marshall Islands |
No Response |
No Response |
No Response |
Micronesia |
No Response |
No Response |
No Response |
Palau |
No Record |
IEP Info. Coded on Test |
IEP |
Puerto Rico |
No Response |
No Response |
No Response |
U.S. Virgin Islands |
No Response |
No Response |
No Response |
Key: No Record = State does not collect the information; No Response = State did not respond to the question
Alternate Assessment Summary Table
> State |
Standards |
Approach |
Student Performance Measures |
System Performance Measures |
Scorers |
Performance Descriptors |
Alabama |
Skills Linked |
Checklist |
a, b, c, d |
None |
a, b, e |
No Decision |
Alaska |
Standards + Skills |
Evidence |
a, b, c, d |
a, b, c, d, e |
a, b, c, d, Other |
Same |
Arizona |
State Standards |
Combination |
a, c, d |
No Decision |
No Decision |
Different |
Arkansas |
State Standards |
Evidence |
a, c |
b, c |
c |
Different |
California |
Skills Linked |
Combination |
a, b, c |
b, c, d |
a |
Different |
Colorado |
State Standards |
Performance |
a, c |
a, b, c, e |
a, e |
Different |
Connecticut |
Skills Linked |
Checklist |
a, c, d |
None |
e |
Same/Different |
Delaware |
Standards + Skills |
Evidence |
a, b, c, d |
a, b, c, d, e |
b, c, d |
Same |
Florida |
Skills Linked |
Combination |
a, c, d |
a,b,c |
a |
No Decision |
Georgia |
Skills Only |
IEP Analysis |
a, b, c, d, e |
No Response |
a |
Different |
Hawaii |
State Standards |
Evidence |
a |
a, b, c, e |
a |
Different |
Idaho |
State Standards |
Combination |
a |
None |
a, Other |
Different |
Illinois |
State Standards |
Evidence |
b |
a, b |
e |
No Decision |
Indiana |
Standards + Skills |
Evidence |
a, b, c |
Other |
a |
Different |
Iowa |
LEA Standards |
Evidence |
a, b |
Other |
Other |
Different |
Kansas |
Standards + Skills |
Evidence |
a, b, c |
a, b, c, d |
e |
Same |
Kentucky |
State Standards |
Evidence |
a, b, c, d |
a, b, c, d, e |
a, c, e |
Same |
Louisiana |
Standards + Skills |
Performance |
a, c, d |
None |
a, b, e |
Different |
Maine |
State Standards |
Evidence |
a |
a, b, c |
c |
Same |
Maryland |
Skills Linked |
Combination |
a, b, c |
a, b, c, d, e |
a, b, c |
Different |
Massachusetts |
Skills Linked |
Evidence |
a, c, d, e |
Other |
c |
Same/Different |
Michigan |
State Standards |
Performance |
a, c |
No Response |
Other |
No Decision |
Minnesota |
Standards + Skills |
Checklist |
a, b, c, d |
a, b, c, d, e |
a |
Different |
Mississippi |
Skills Only |
Checklist |
b |
No Decision |
b |
Same |
Missouri |
State Standards |
Evidence |
b, c, d |
b |
c |
No Decision |
Montana |
State Standards |
Checklist |
a |
a |
a, Other |
Same |
Nebraska |
Skills Only |
Checklist |
a, b, c, d, e |
a. b. c |
a |
Same |
Nevada |
Standards + Skills |
Checklist |
a, c, d |
Other |
a |
Different |
New Hampshire |
State Standards |
Evidence |
a, b, c |
a, b, c, e |
c |
Same |
New Jersey |
State Standards |
Evidence |
e |
No Decision |
c |
Different |
New Mexico |
Skills Linked |
Checklist |
a, c |
None |
e |
Same |
New York |
State Standards |
No Decision |
a, b, c, d |
a, b |
No Decision |
Same |
North Carolina |
Skills Linked |
Evidence |
a, b |
e |
e |
Same |
North Dakota |
Standards + Skills |
Evidence |
a, b, c |
None |
No Decision |
No Decision |
Ohio |
Skills Only |
IEP Analysis |
b |
a, b, c, d, e |
Other |
Different |
Oklahoma |
Standards + Skills |
Evidence |
a, c, d |
a, b, c, e |
c |
Same |
Oregon |
State Standards |
Combination |
e |
b, c |
a, Other |
Same |
Pennsylvania |
State Standards |
Performance |
a, c |
c |
c, d, e |
Same/Different |
Rhode Island |
State Standards |
Evidence |
a, c |
a, c |
c |
Same |
South Carolina |
Skills Linked |
Evidence |
a |
Other |
b |
Different |
South Dakota |
Skills Linked |
Checklist |
a, b |
Other |
a, Other |
Different |
Tennessee |
Skills Linked |
Evidence |
c |
a, b, c, d, e |
b, d |
Same |
Texas |
IEP Decision |
Combination |
e |
Other |
e |
No Decision |
Utah |
Skills Linked |
IEP Analysis |
b |
Other |
a, d |
Same |
Vermont |
Skills Linked |
Evidence |
a, b |
Other |
No Decision |
Same |
Virginia |
Skills Linked |
Evidence |
a, c, d |
No Response |
e |
No Decision |
Washington |
State Standards |
No Decision |
a, b |
a |
No Decision |
No Decision |
West Virginia |
State Standards |
Evidence |
a, c, d |
None |
a, Other |
Different |
Wisconsin |
IEP Decision |
Combination |
e |
No Response |
a |
No Levels |
Wyoming |
State Standards |
Evidence |
a, c |
None |
a, Other |
Different |
Unique States |
|
|||||
American Samoa |
Skills Linked |
Checklist |
a, c |
None |
No Decision |
No Decision |
Bureau of Indian Affairs |
No Decision |
No Decision |
No Decision |
No Decision |
No Decision |
No Decision |
Department of Defense |
No Response |
No Response |
No Response |
No Response |
No Response |
No Response |
District of Columbia |
No Response |
No Response |
No Response |
No Response |
No Response |
No Response |
Guam |
No Response |
No Response |
No Response |
No Response |
No Response |
No Response |
Mariana Islands |
No Response |
No Response |
No Response |
No Response |
No Response |
No Response |
Marshall Islands |
No Response |
No Response |
No Response |
No Response |
No Response |
No Response |
Micronesia |
No Response |
No Response |
No Response |
No Response |
No Response |
No Response |
Palau |
No Decision |
No Decision |
No Decision |
None |
No Decision |
No Decision |
Puerto Rico |
No Response |
No Response |
No Response |
No Response |
No Response |
No Response |
U.S. Virgin Islands |
No Response |
No Response |
No Response |
No Response |
No Response |
No Response |
Key: No Decision = State has not made a decision; No Response = State did not respond to the question.
Standard: State Standards = State standards (may be expanded); Standards + Skills = State standards plus functional skills; Skills linked = Functional skills linked back to state standards; Skills only= Functional skills only, no link to state standards; IEP Decision = Decision about standards is up to IEP team.
Approach: Evidence = Body of Evidence/Portfolio; Checklist = Checklist/Rating Scale; Combination = Combination of strategies listed; Performance = Specific performance assessment; IEP Analysis = Analysis of IEP goals.
Student Performance Measures: a=skill/competence level; b=degree of progress; c=level of competence; d=ability to generalize; e=other; None = No system performance measures.
System Performance Measures: a=staff support; b=variety of settings; c=appropriateness (age appropriate, challenging, authentic); d=parent satisfaction; e=participation in general education.
Scorers: a = student’s teacher; b = teachers in district; c = teachers from other districts; d = state agency; e = test contractor.
Reporting Summary Table
State |
Approved Accommodations |
Non-approved Accommodations |
Out-of-Level Testing |
Alternate Assessment |
No Participation |
Alabama |
No Decision |
Separate |
Separate |
Separate |
Not Counted |
Alaska |
Aggregated |
Separate |
None |
Separate |
Other |
Arizona |
Aggregated |
Separate |
Separate |
Separate |
Not Counted |
Arkansas |
Separate |
Aggregated |
None |
Separate |
No Decision |
California |
Aggregated |
Counted |
Counted |
No Decision |
Not Counted |
Colorado |
Aggregated |
Other |
None |
Separate |
Counted |
Connecticut |
Aggregated |
No Decision |
Separate |
Counted |
Not Counted |
Delaware |
Aggregated |
Separate |
Counted |
Separate |
Score Zero |
Florida |
Separate |
Other |
None |
No Decision |
Not Counted |
Georgia |
Aggregated, Separate |
Aggregated, Separate, Counted |
Aggregated |
Separate |
Other |
Hawaii |
Aggregated |
Aggregated |
Aggregated |
No Decision |
Not Counted |
Idaho |
Aggregated |
Aggregated |
None |
Other |
Not Counted |
Illinois |
Aggregated |
Aggregated |
None |
Separate |
Not Counted |
Indiana |
Aggregated, Separate |
Lowest Score |
None |
No Decision |
Other |
Iowa |
Aggregated |
Not Counted |
Aggregated |
Separate |
Other |
Kansas |
Aggregated |
Separate |
None |
Other |
Not Counted |
Kentucky |
Aggregated |
Other |
None |
Aggregated |
Lowest Score |
Louisiana |
Aggregated |
Aggregated, Separate |
Separate |
Separate |
Counted |
Maine |
Aggregated |
Other |
None |
Aggregated |
Not Counted |
Maryland |
Other |
Other |
None |
No Decision |
Other |
Massachusetts |
Aggregated |
Aggregated |
None |
Aggregated |
Lowest Score |
Michigan |
Aggregated |
No Decision |
None |
Other |
No Decision |
Minnesota |
Aggregated |
Other |
None |
Separate |
Not Counted |
Mississippi |
Aggregated |
Not Counted |
No Decision |
No Decision |
No Decision |
Missouri |
Aggregated |
Aggregated |
None |
No Decision |
Other |
Montana |
Aggregated |
Separate |
None |
No Decision |
Not Counted |
Nebraska |
Aggregated |
Aggregated |
None |
Counted |
No Decision |
Nevada |
Aggregated |
Separate |
None |
Separate |
Not Counted |
New Hampshire |
Aggregated |
Lowest Score |
None |
Both |
Score Zero |
New Jersey |
Aggregated |
Other |
None |
No Decision |
Other |
New Mexico |
Aggregated, Separate |
Other |
None |
Separate |
Other |
New York |
Aggregated |
Aggregated |
None |
No Decision |
Score Zero |
North Carolina |
Aggregated |
Not Counted |
None |
Separate |
Other |
North Dakota |
Aggregated |
Aggregated |
Aggregated |
No Decision |
Not Counted |
Ohio |
Aggregated |
Counted |
None |
No Decision |
No Decision |
Oklahoma |
Aggregated, Separate |
Other |
None |
No Decision |
Counted |
Oregon |
Aggregated |
Separate |
Aggregated |
Separate |
Not Counted |
Pennsylvania |
Aggregated |
Other |
None |
No Decision |
Not Counted |
Rhode Island |
Aggregated |
Aggregated |
None |
Both |
Counted |
South Carolina |
Aggregated |
Separate |
Aggregated |
Separate |
Score Zero |
South Dakota |
Aggregated |
Separate |
None |
Aggregated |
Not Counted |
Tennessee |
Aggregated |
Other |
None |
Both |
Not Counted |
Texas |
Aggregated |
Other |
Aggregated |
No Decision |
Counted |
Utah |
Aggregated |
Separate |
Separate |
Aggregated |
Not Counted |
Vermont |
Aggregated |
Separate |
Separate |
Separate |
Score Zero |
Virginia |
Aggregated |
Aggregated |
None |
Aggregated |
Not Counted |
Washington |
Aggregated |
Counted |
None |
Counted |
Counted |
West Virginia |
Aggregated |
Other |
None |
No Decision |
Not Counted |
Wisconsin |
Aggregated |
Other |
None |
Other |
Counted |
Wyoming |
Aggregated |
Score Zero |
None |
Aggregated |
Score Zero |
Unique States |
|
|
|
|
|
American Samoa |
Separate |
Separate |
None |
Separate |
Not Counted |
Bureau of Indian Affairs |
Aggregated, Separate |
Aggregated, Separate |
None |
No Decision |
Not Counted |
Department of Defense |
No Response |
No Response |
No Response |
No Response |
No Response |
District of Columbia |
No Response |
No Response |
No Response |
No Response |
No Response |
Guam |
No Response |
No Response |
No Response |
No Response |
No Response |
Mariana Islands |
No Response |
No Response |
No Response |
No Response |
No Response |
Marshall Islands |
No Response |
No Response |
No Response |
No Response |
No Response |
Micronesia |
No Response |
No Response |
No Response |
No Response |
No Response |
Palau |
No Decision |
No Decision |
No Decision |
No Decision |
No Decision |
Puerto Rico |
No Response |
No Response |
No Response |
No Response |
No Response |
U.S. Virgin Islands |
No Response |
No Response |
No Response |
No Response |
No Response |
Key: No Decision = State has not made a decision; No Response = State did not respond to the question;
Aggregated = Student counted as assessment participant, and actual score is aggregated with scores of all other assessment participants; Separate = Student counted as assessment participant, but actual score is reported separately; Lowest Score = Student counted as assessment participant, and given lowest score, Score Zero = Student counted as assessment participant, and given score of zero; Counted = Student counted as assessment participant, and no score is given; Not Counted = Student not counted as assessment participant, and no score is given; None = This type of assessment is not administered.
Accountability Summary Table
State |
Assessment Performance |
Attendance |
Drop-Out Rates |
Suspension Rates |
Graduation Rates |
No Decision |
Other |
Alabama |
a |
|
|
|
|
|
b c |
Alaska |
a b c |
a b |
a b |
|
a b |
|
|
Arizona |
a b c |
|
a b c |
|
|
|
|
Arkansas |
a b c |
a b c |
a b c |
a b c |
a b c |
|
|
California |
a |
|
a |
|
a |
b c |
|
Colorado |
a b c |
a b c |
a b c |
a b c |
a b c |
|
c |
Connecticut |
a b c |
|
a b c |
a b c |
a b c |
|
|
Delaware |
a b c |
|
|
|
|
|
|
Florida |
a b |
|
a b c |
a b c |
a b c |
c |
a b c |
Georgia |
a |
|
|
|
a |
a b c |
|
Hawaii |
a b c |
a b c |
a b c |
a b c |
a b c |
|
|
Idaho |
a b |
a |
a b c |
a b c |
a b c |
|
c |
Illinois |
a b |
a b |
a b |
|
|
c |
|
Indiana |
a b |
a b |
|
|
a b |
c |
|
Iowa |
a b c |
|
a b c |
b c |
a b c |
|
|
Kansas |
a b c |
a b c |
a b c |
a b c |
a b c |
|
|
Kentucky |
a b c |
a b c |
a b c |
|
|
|
a b c |
Louisiana |
a b |
a b c |
a b c |
|
a b |
c |
|
Maine |
a b c |
|
|
|
|
|
|
Maryland |
a b |
a b |
a b |
a b |
a b |
|
c |
Massachusetts |
a b |
|
|
|
|
c |
b |
Michigan |
a b c |
|
|
|
|
a b c |
|
Minnesota |
a b c |
|
a b c |
a b c |
a b c |
|
|
Mississippi |
a b c |
|
|
|
|
|
|
Missouri |
a b |
a b |
a b |
|
a b |
c |
|
Montana |
a |
|
a |
|
a |
b c |
a |
Nebraska |
a b c |
a b c |
a b c |
a b c |
a b c |
|
|
Nevada |
a b c |
a b c |
a b c |
a b c |
a b c |
|
|
New Hampshire |
a b c |
|
|
|
|
|
|
New Jersey |
a b c |
a b c |
a b c |
a b c |
a b c |
|
|
New Mexico |
a b c |
a b c |
a b c |
|
|
|
a b c |
New York |
a b |
|
a b |
|
|
c |
|
North Carolina |
a b c |
|
a b c |
|
|
|
a b |
North Dakota |
a b |
a |
a |
|
a |
c |
|
Ohio |
a b |
a b |
a b |
a b |
a b |
c |
|
Oklahoma |
|
|
|
|
|
a b c |
|
Oregon |
a b c |
|
a b c |
a b c |
a b c |
|
|
Pennsylvania |
a b |
a b |
|
|
|
c |
|
Rhode Island |
a b c |
|
a |
a |
a |
a b c |
|
South Carolina |
a b c |
a |
a |
a |
a |
|
|
South Dakota |
|
|
|
|
|
a b c |
|
Tennessee |
a b c |
|
|
|
|
a b c |
|
Texas |
a b c |
a b c |
a b c |
a b c |
a b c |
|
|
Utah |
a b c |
|
|
|
|
|
|
Vermont |
a b c |
|
a b c |
|
|
|
|
Virginia |
a b c |
|
|
|
|
|
|
Washington |
|
|
|
|
|
a b c |
|
West Virginia |
a b c |
a |
a b c |
a b c |
a b c |
|
|
Wisconsin |
a b |
a b c |
a b c |
|
a b c |
|
|
Wyoming |
|
|
|
|
|
a b c |
|
Unique States |
|
|
|
|
|
|
|
American Samoa |
No Decision |
No Decision |
No Decision |
No Decision |
No Decision |
No Decision |
No Decision |
Bureau of Indian Affairs |
a, b |
a, b |
a, b |
a, b |
a, b |
a, b |
a, b |
Department of Defense |
No Response |
No Response |
No Response |
No Response |
No Response |
No Response |
No Response |
District of Columbia |
No Response |
No Response |
No Response |
No Response |
No Response |
No Response |
No Response |
Guam |
No Response |
No Response |
No Response |
No Response |
No Response |
No Response |
No Response |
Mariana Islands |
No Response |
No Response |
No Response |
No Response |
No Response |
No Response |
No Response |
Marshall Islands |
No Response |
No Response |
No Response |
No Response |
No Response |
No Response |
No Response |
Micronesia |
No Response |
No Response |
No Response |
No Response |
No Response |
No Response |
No Response |
Palau |
No Decision |
No Decision |
No Decision |
No Decision |
No Decision |
No Decision |
No Decision |
Puerto Rico |
No Response |
No Response |
No Response |
No Response |
No Response |
No Response |
No Response |
U.S. Virgin Islands |
No Response |
No Response |
No Response |
No Response |
No Response |
No Response |
No Response |
Key: No Decision = State has not made a decision; No Response = State did not respond to the question;
a = Component of our state accountability system; b = Component that includes students with disabilities who participate in general assessments (with accommodations as needed), c = Component that includes students with disabilities who participate in alternate assessments.
Current Issues Summary Table
State |
Out-of-Level Testing Option |
LEP Students with Disabilities |
Alternate Assessment Diploma Options |
IEP Team Information |
Special Ed. Referral Rates |
Alabama |
Yes |
Unknown |
a, b, c |
a, b, c, d |
Unknown |
Alaska |
No |
Unknown |
d |
a, b, c, d |
Unknown |
Arizona |
Yes | Participation |
a, c |
b, c, d |
Unknown |
Arkansas |
No |
Unknown |
a, c |
b, c, d |
Unknown |
California |
Yes | Both |
c |
b |
Same |
Colorado |
No | Both |
a, c, d |
a, b, c, d |
Unknown |
Connecticut |
Yes | Participation |
a, c, d |
b, c, d |
Lower |
Delaware |
Yes | Unknown |
c |
a, b, c, d, |
Same |
Florida |
No | Both |
b |
b, c |
Unknown |
Georgia |
Yes | Participation |
b |
b, c |
Unknown |
Hawaii |
Yes | Unknown |
No Decision |
a, b, c, d |
Higher |
Idaho |
No | Unknown |
a |
b, c, d |
Higher |
Illinois |
No | Unknown |
a, b, c, d |
a, b, c, d |
Unknown |
Indiana |
No | Unknown |
c, d |
b, c, d |
Higher |
Iowa |
Yes | Unknown |
No Response |
Other |
Unknown |
Kansas |
No | Unknown |
a |
b, c, d |
Same |
Kentucky |
No | Both |
a, c |
b, c, d |
Unknown |
Louisiana |
Yes | Unknown |
e |
b, c |
Unknown |
Maine |
No | Both |
No Response |
b, c, d |
Higher |
Maryland |
No | Unknown |
c |
a, b, c, d |
Higher |
Massachusetts |
No | Unknown |
a |
a, b, d, c |
Unknown |
Michigan |
No | Unknown |
Unknown |
b, c, d |
Higher |
Minnesota |
No | Unknown |
a |
a, b, c, d |
Unknown |
Mississippi |
Yes | Unknown |
c |
a, b, c, d |
No response |
Missouri |
No | Unknown |
a, d |
a, b, c, d |
Unknown |
Montana |
No | Performance |
a |
b, c, d |
Unknown |
Nebraska |
No | Participation |
No Response |
a, b, c, d |
Unknown |
Nevada |
No | Unknown |
b, d |
a, b, c, d |
No response |
New Hampshire |
No | Performance |
Other |
a, b, c |
Same |
New Jersey |
No | Both |
a |
a, b, c, d |
Higher |
New Mexico |
No | Unknown |
a |
b, c, d |
Unknown |
New York |
No | Unknown |
a, b |
a, b, c, d |
Higher |
North Carolina |
No | Unknown |
Other |
b, c, d |
Higher |
North Dakota |
Yes | Unknown Response |
a, c, d, e |
a, b, c, d |
Unknown |
Ohio |
No | Unknown |
No Response |
a, b, c, d |
Same |
Oklahoma |
No | Unknown |
a |
b, c |
Unknown |
Oregon |
Yes | Unknown |
a, c, d, e |
a, b, c, d |
Higher |
Pennsylvania |
No | Unknown |
a |
b, c, d |
Unknown |
Rhode Island |
No | Unknown |
a, c, d |
a, b, c, d |
Unknown |
South Carolina |
Yes | Unknown |
d |
a, b, c, d |
Unknown |
South Dakota |
No | Unknown |
c, d |
b, c, d |
Unknown |
Tennessee |
No | Both |
b |
a, b, c, d |
Unknown |
Texas |
Yes | Both |
a |
a, b, c, d |
Same |
Utah |
Yes | Performance |
a, c, d |
b, c, d |
Unknown |
Vermont |
Yes | Both |
a |
b, c, d |
Same |
Virginia |
No | Performance |
b |
b |
Unknown |
Washington |
No | Unknown |
No Decision |
b, c |
Same |
West Virginia |
Yes | Unknown |
Other |
b, c, d |
Unknown |
Wisconsin |
No | Unknown |
Other |
b, c, d |
Higher |
Wyoming |
No | Unknown |
a |
b, c, d |
Higher |
Unique States |
|
|
|
|
|
American Samoa |
No |
Unknown |
d |
a, c |
Same |
Bureau of Indian Affairs |
No |
Unknown |
No Decision |
b, d |
Unknown |
Department of Defense |
No Response |
No Response |
No Response |
No Response |
No Response |
District of Columbia |
No Response |
No Response |
No Response |
No Response |
No Response |
Guam |
No Response |
No Response |
No Response |
No Response |
No Response |
Mariana Islands |
No Response |
No Response |
No Response |
No Response |
No Response |
Marshall Islands |
No Response |
No Response |
No Response |
No Response |
No Response |
Micronesia |
No Response |
No Response |
No Response |
No Response |
No Response |
Palau |
No |
Both |
c |
c |
Lower |
Puerto Rico |
No Response |
No Response |
No Response |
No Response |
No Response |
U.S. Virgin Islands |
No Response |
No Response |
No Response |
No Response |
No Response |
Key: No Decision = State has not made a decision; No Response = State did not respond to the question; Unknown = This information is unavailable.
Out-of-Level Testing Option: Yes = State has out-of-level testing option; No = State does not have out-of-level testing option.
LEP Students with Disabilities: Participation = State disaggregates participation data for LEP students with disabilities; Performance = State disaggregates performance data for LEP students with disabilities; Both = State disaggregates both participation and performance data for LEP students with disabilities.
Alt. Assess. Diploma Options: a =regular diploma; b =special education diploma; c =certificate of completion;d =certificate of attendance; e =certificate of achievement; f =vocational diploma.
IEP Team Information: a =Information sent to IEP team members; b =Information sent to local directors of special education who pass it on to IEP team members; c =Workshops/training sessions; d =Information available on Internet.