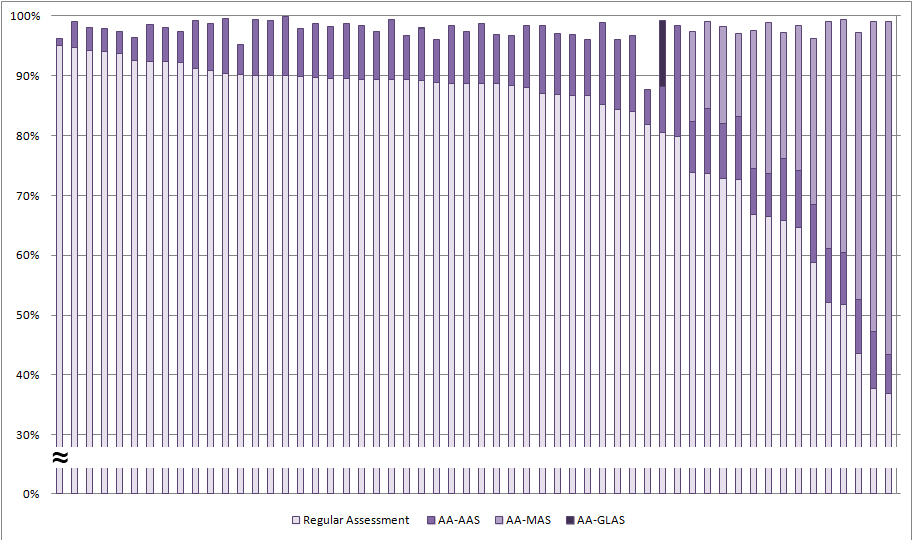
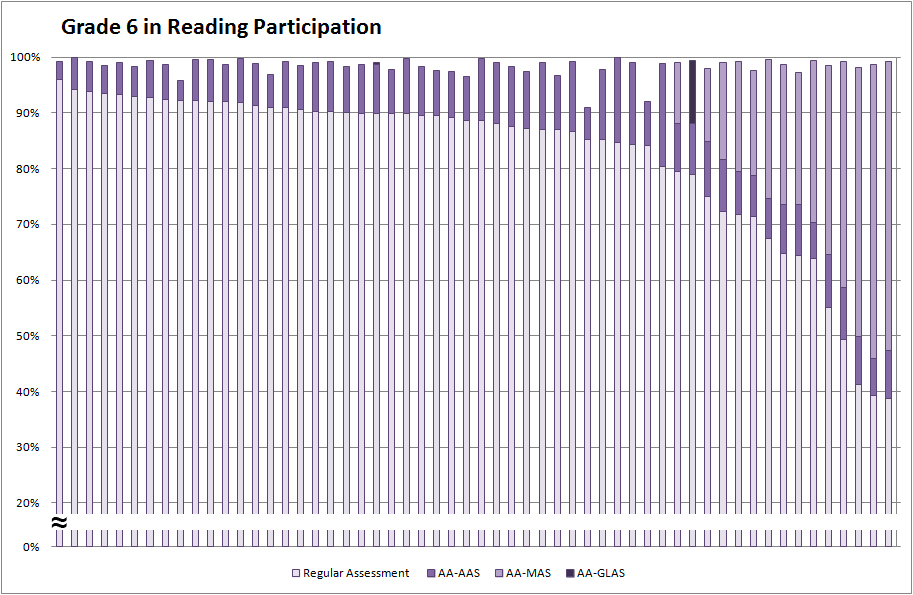
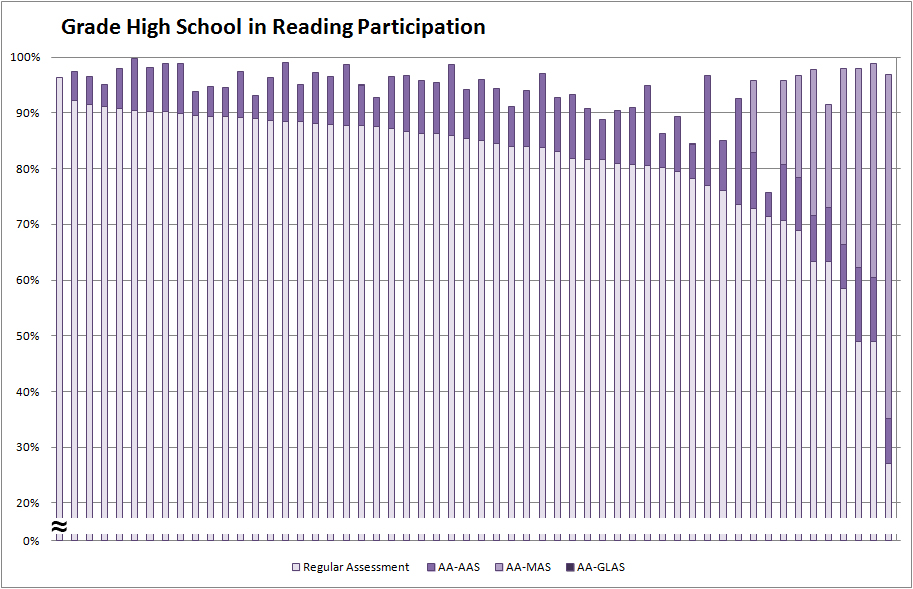
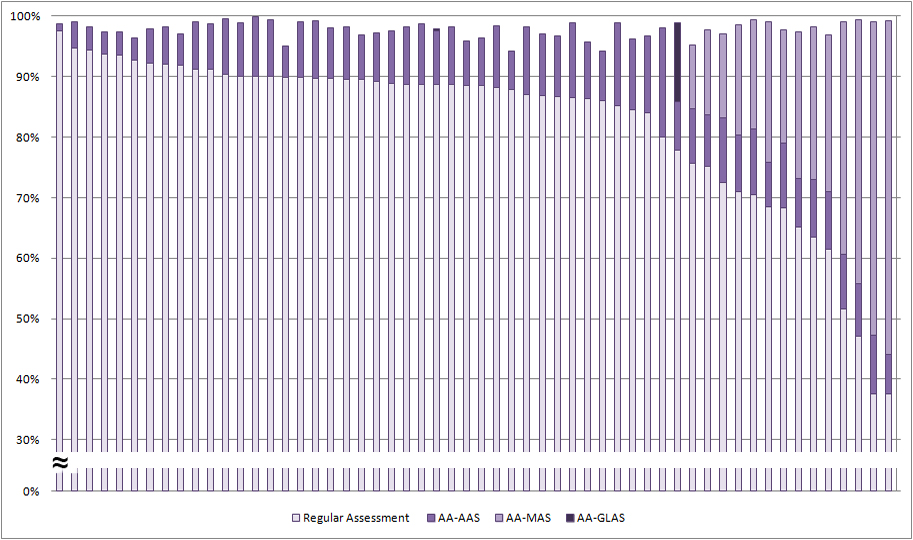
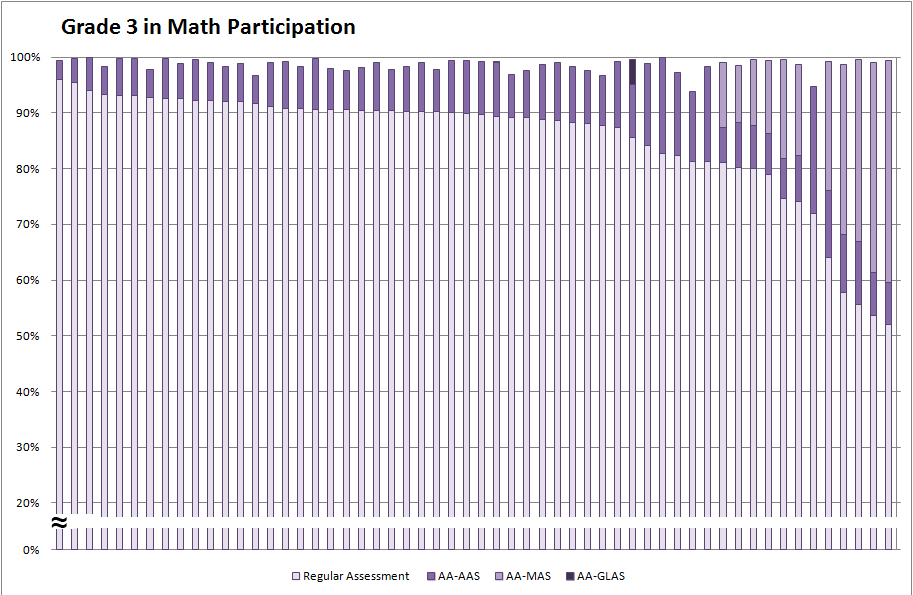
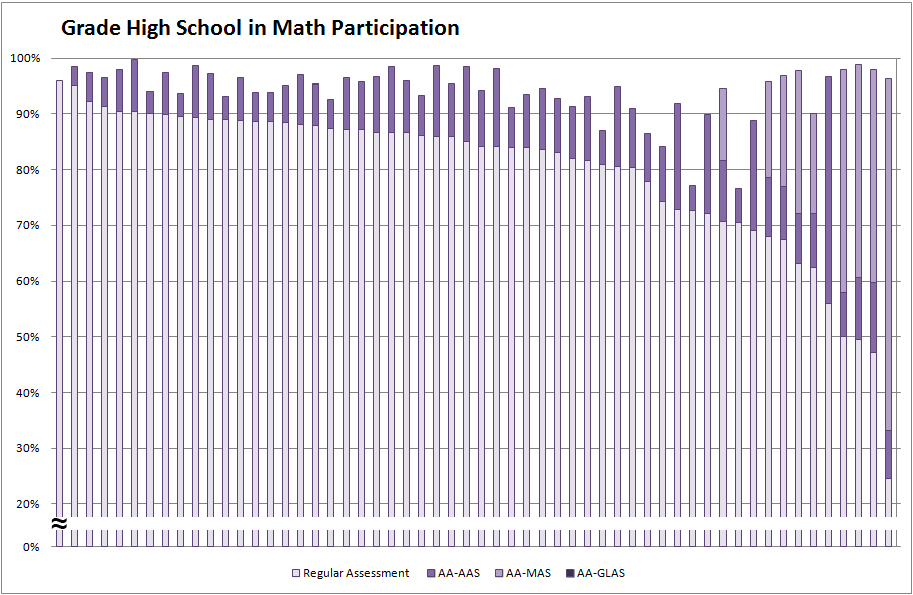
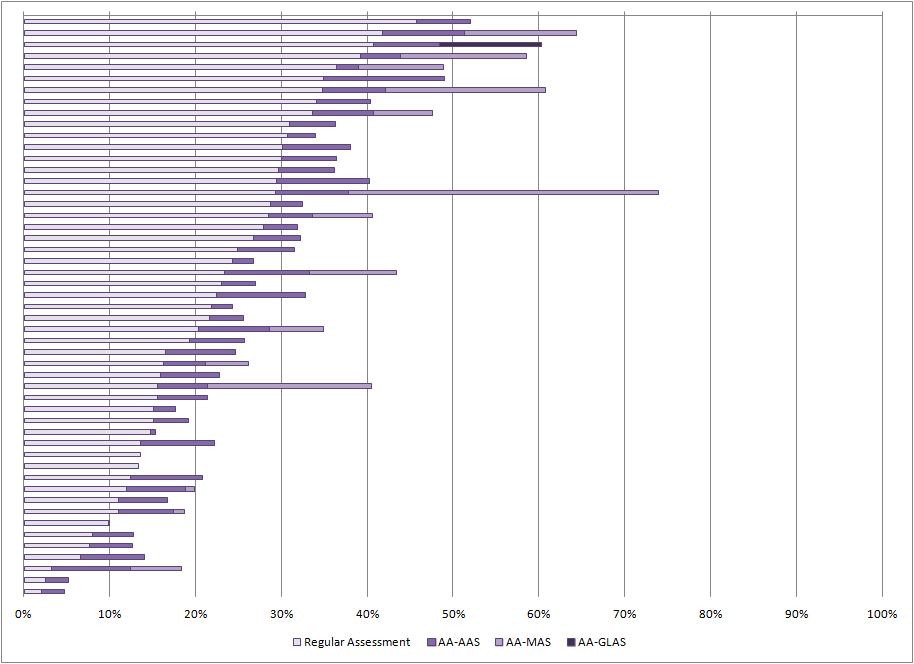
2010-2011 APR Snapshot #4:State Assessment Participation and Performance of Students Receiving Special Education ServicesMiong Vang • Martha Thurlow March 2013 All rights reserved. Any or all portions of this document may be reproduced and distributed without prior permission, provided the source is cited as: Vang, M., & Thurlow, M. (2013). 2010-2011 APR snapshot #4: State assessment participation and performance of students receiving special education services. Minneapolis, MN: University of Minnesota, National Center on Educational Outcomes. Table of ContentsBackgroundThis brief provides a snapshot of the participation and performance of students receiving special education services in statewide assessments used for Elementary and Secondary Education Act (ESEA) accountability. Using federally submitted data from the 2010-2011 school year, we present information on participation and performance in reading and mathematics statewide assessments administered to grade 8 students. Links to figures displaying statewide assessment data for other grades are provided in this report following Figures 1, 2, 3, and 4. Data tables for all grade levels are available from NCEO at www.nceo.info/APRsnapshot/data. Data for the unique states are not shown in the figures of this report but are available at www.nceo.info/APRsnapshot/data. Throughout this report, we use the term “students with disabilities” to refer to students receiving special education services. Thus, students on 504 plans are not included in these analyses. Top of page | Table of Contents FindingsParticipation in ReadingOverall participation of students with disabilities in statewide grade 8
reading assessments in all states is presented in Figure 1. Students with
disabilities may participate in the regular assessment or in assessments
designated for students receiving special education services only, which
include the alternate assessment based on alternate achievement standards
(AA-AAS), the alternate assessment based on modified achievement standards
(AA-MAS), and the alternate assessment based on grade-level achievement
standards (AA-GLAS). Total participation rates of students with disabilities
were typically 95% or higher across all states, with the average
participation rate being 97.8%. The percentages of students with
disabilities participating in other statewide assessments varied
dramatically, resulting in different rates of participation in the regular
assessment. Figure 1. Participation Rates for Eighth Grade Students with Disabilities on Reading Assessments
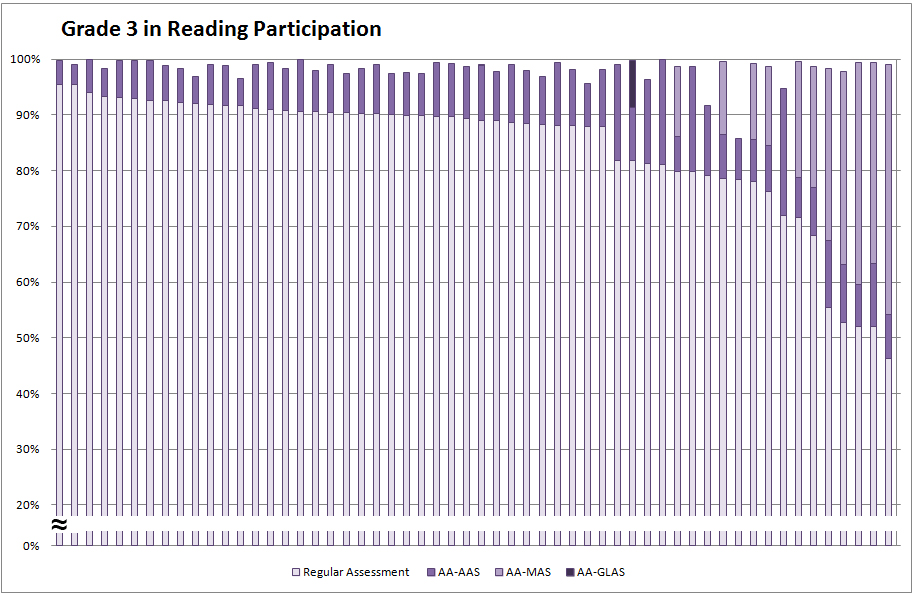
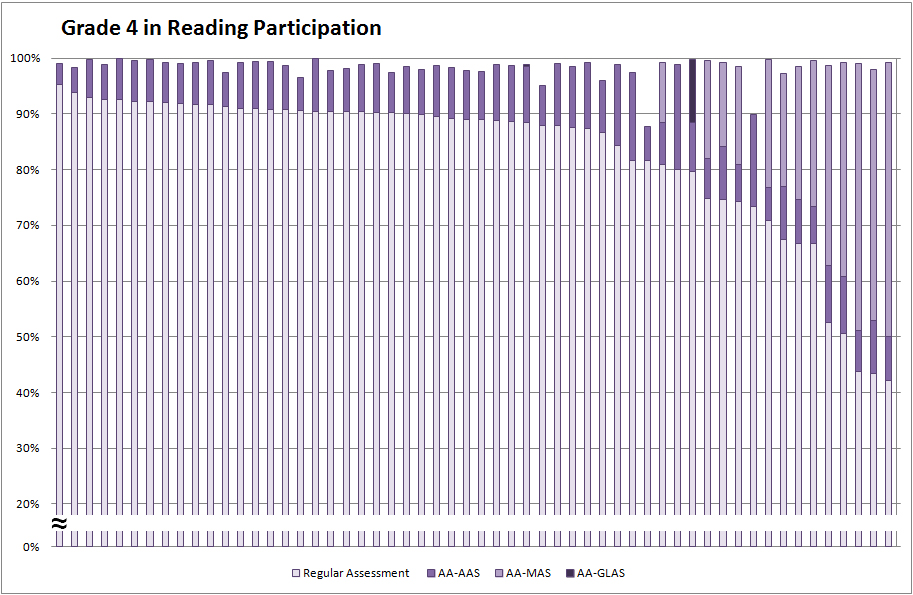
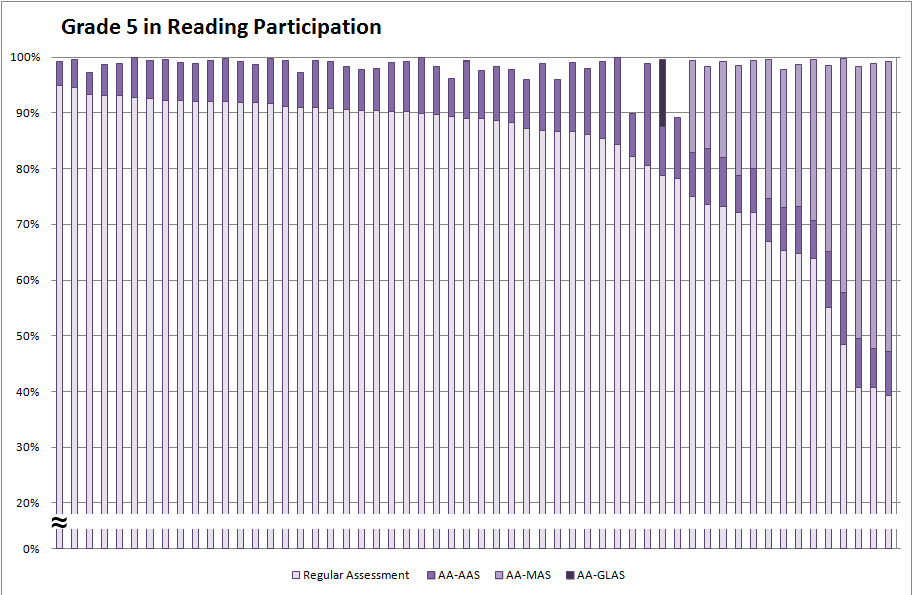
Click the above images to enlarge Reading graphs for Grades 3-7 and High School.
|

 |
 |
 |
 |
 |
 |
|
Grade 3 |
Grade 4 |
Grade 5 |
Grade 6 |
Grade 7 |
Grade HS |
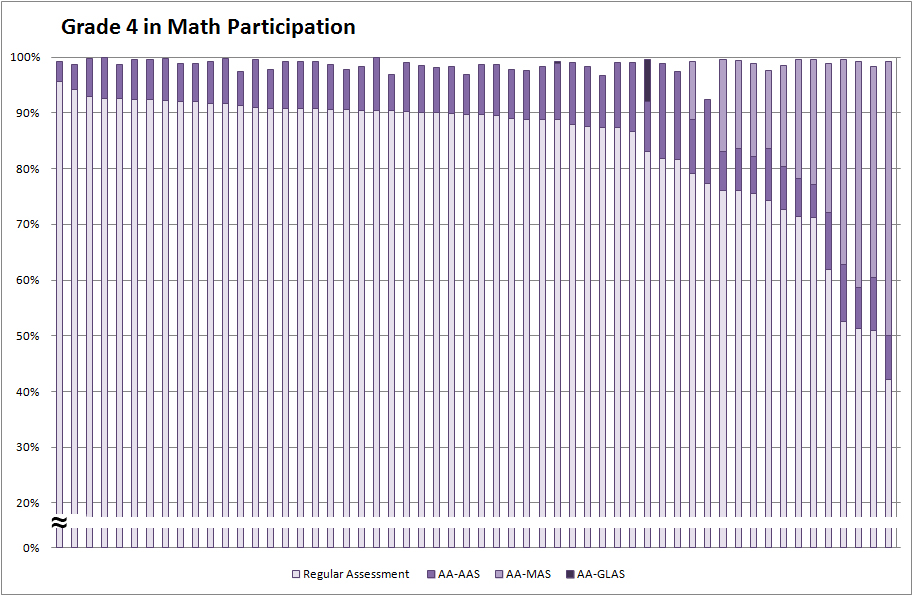
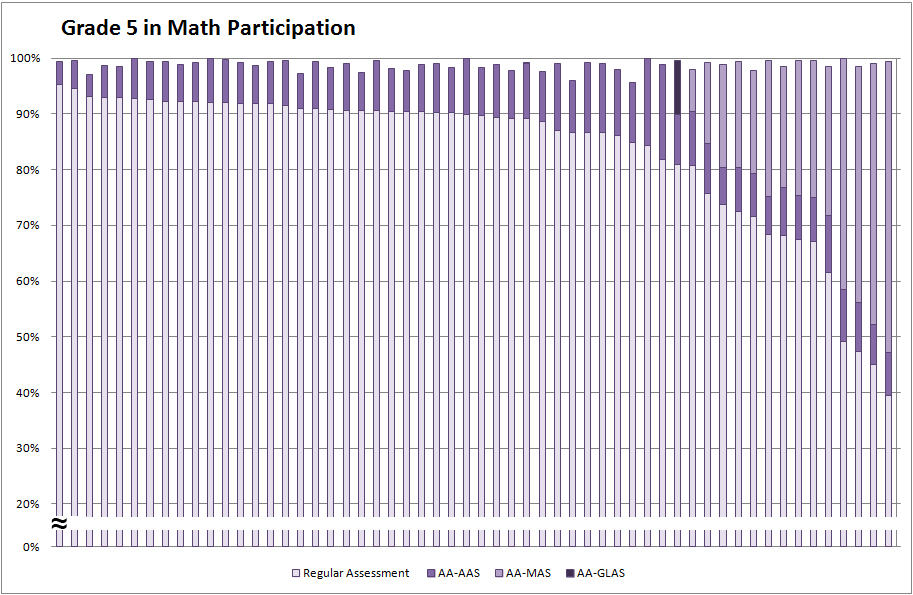
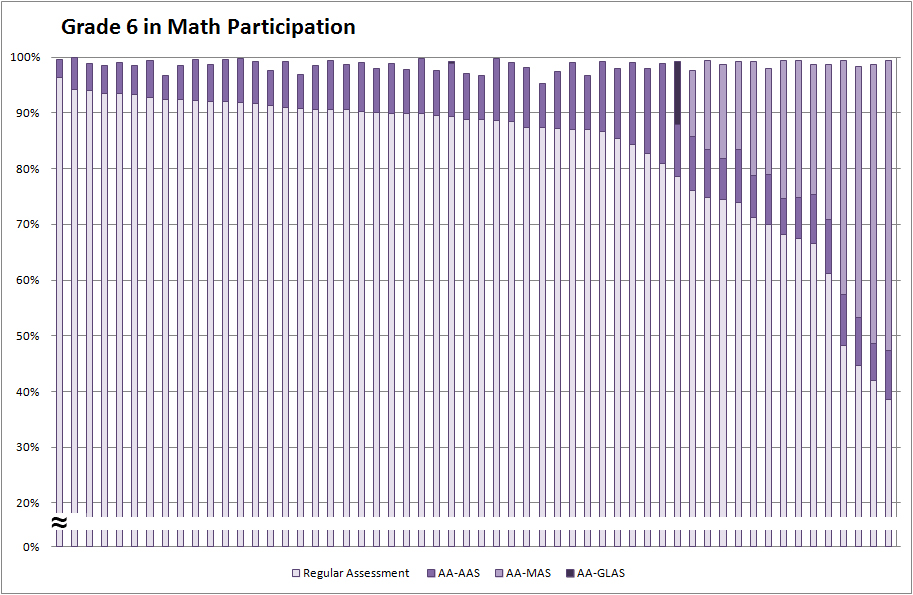
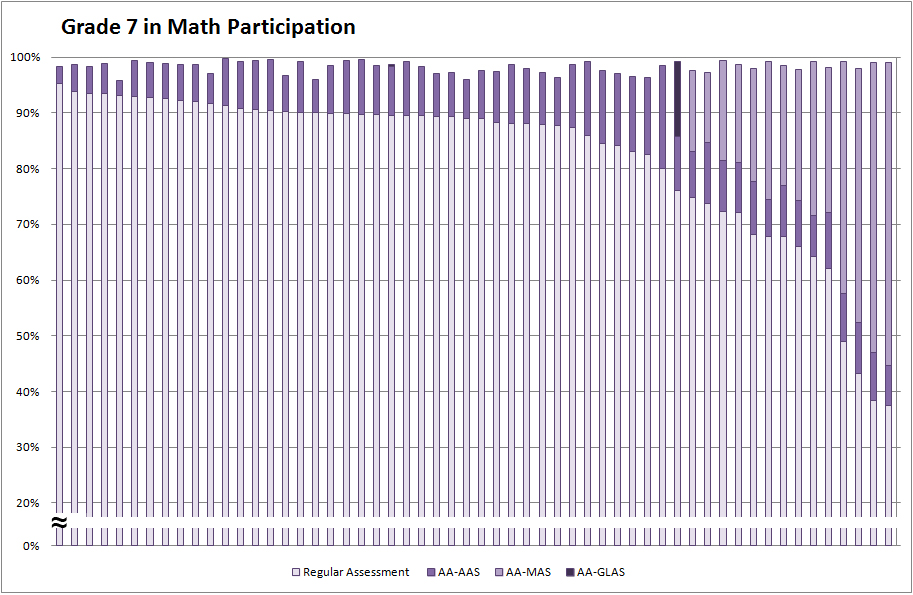
Click the above images to enlarge Math graphs for Grades 3-8 and High School.
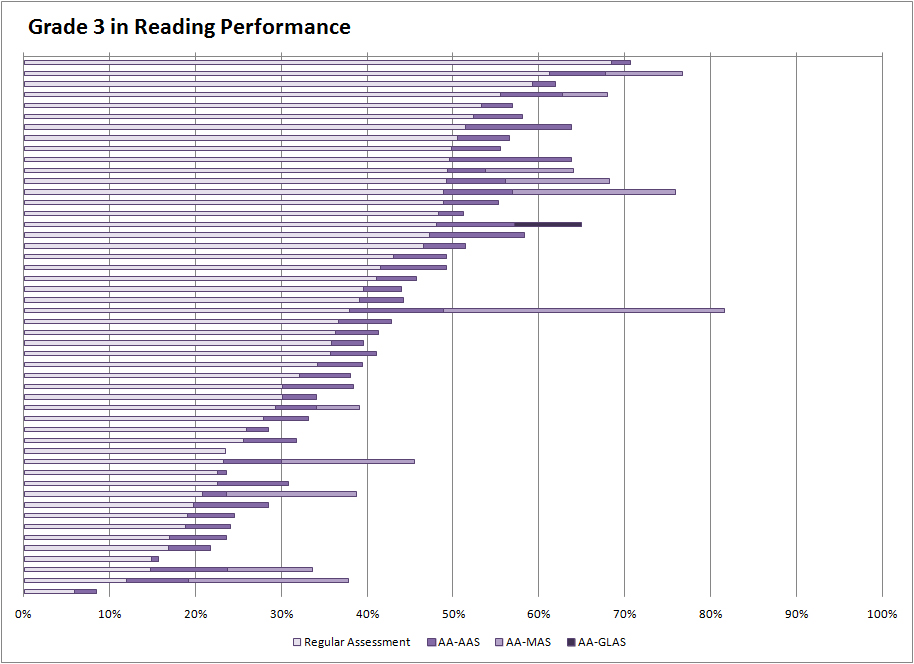
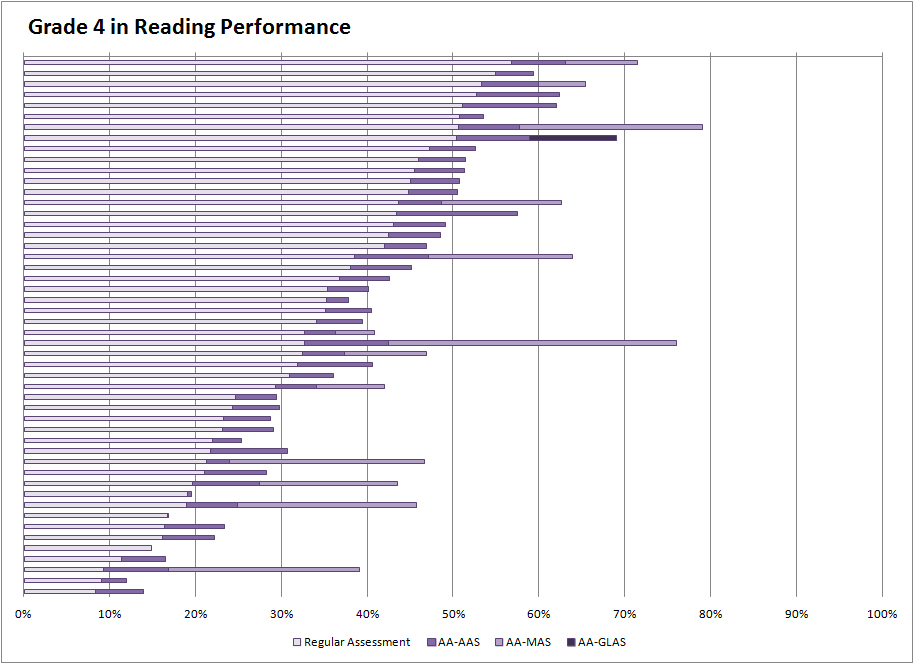
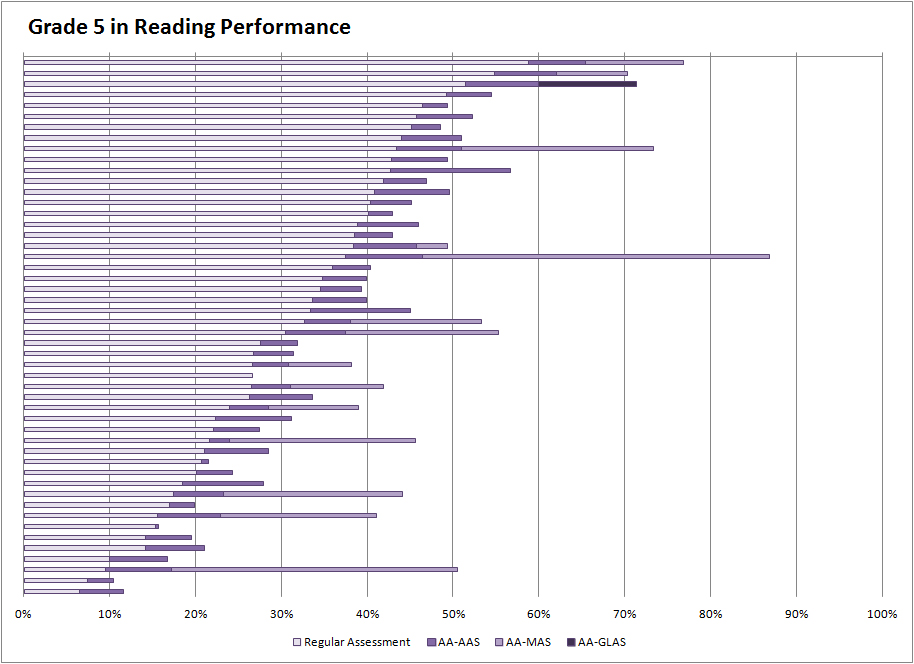
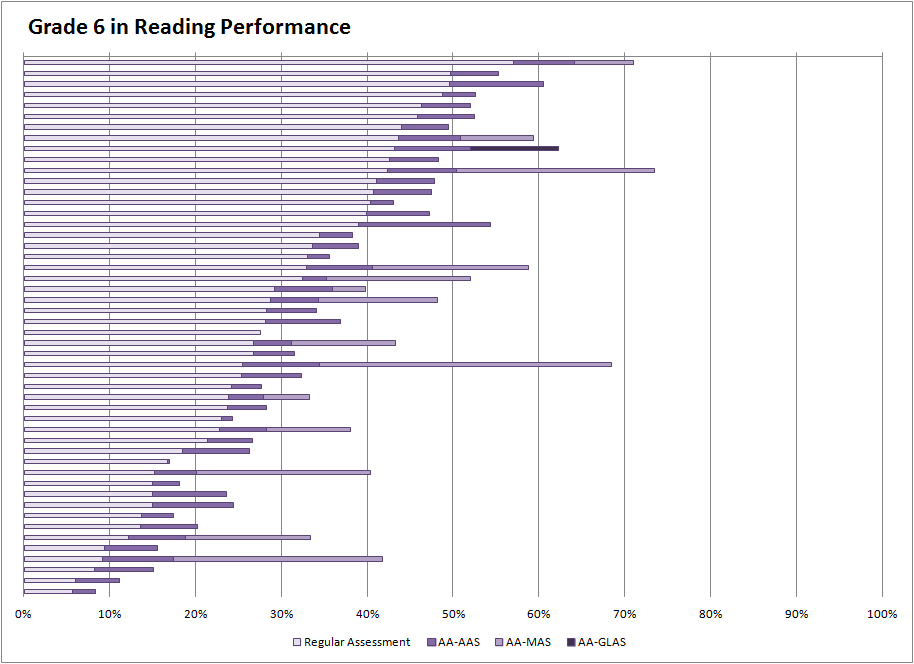
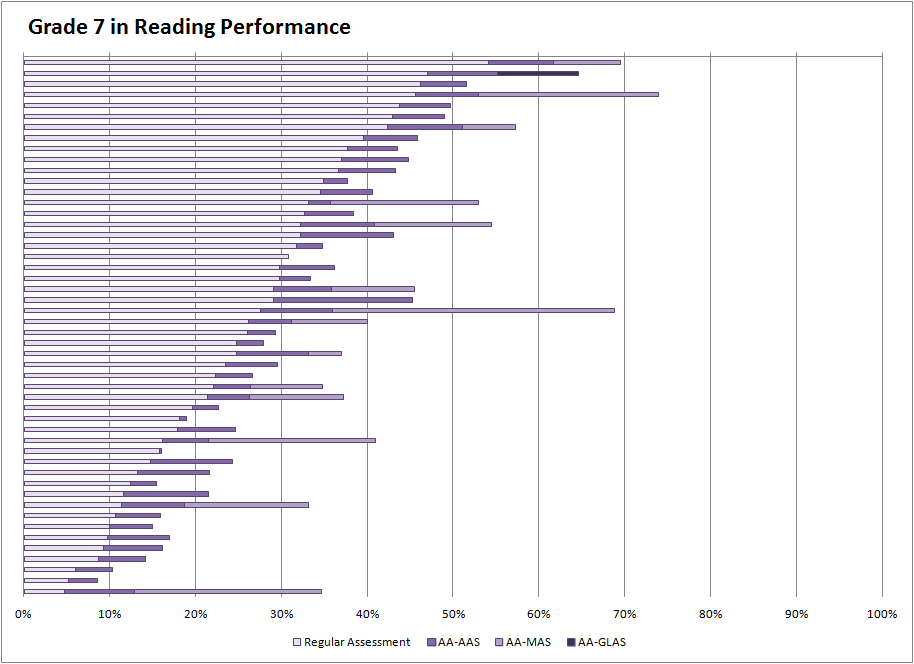
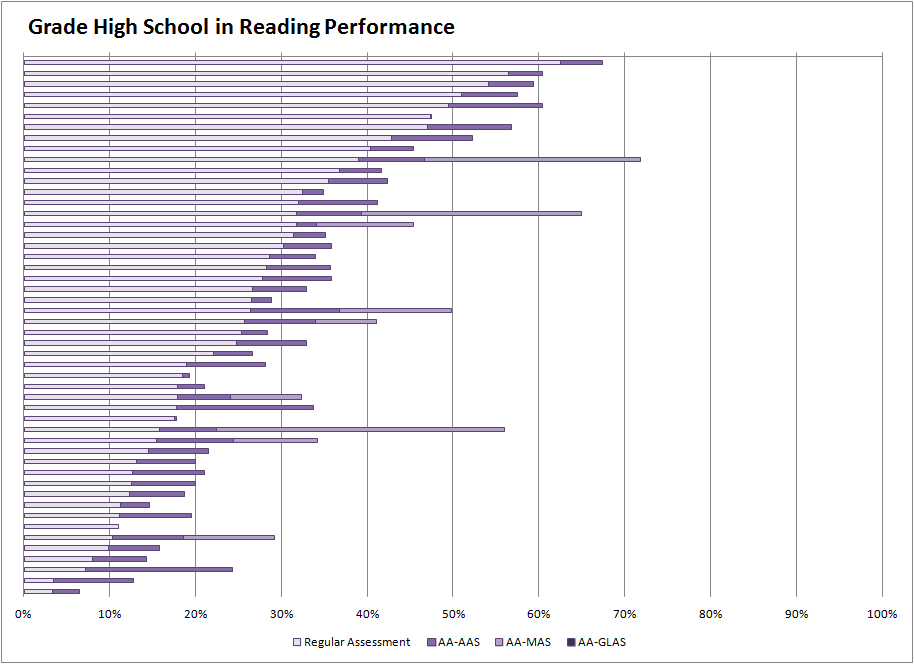
Proficiency in Reading
The percentage of students with disabilities who scored at a proficient or above level was much more variable than participation rates across the 50 states. Proficiency rates for students with disabilities in grade 8 in 2010-2011 ranged from 15.0% to 78.1% (see Figure 3, with states ordered according to the percentage proficient or above on the regular assessment). The average grade 8 proficiency rate across all reading assessments was 38.1%.
Twenty states reported total proficiency
rates of more than 40% and thirteen
states reported total proficiency rates
of more than 50%. Nine of these states
reported proficient scores for either an
AA-MAS or AA-GLAS.
For students with disabilities
participating in the AA-AAS, between
0.0% and 16.1% were proficient on the
AA-AAS across the 50 states (based on
the all special education students, not
just those participating in the AA-AAS).
The average percentage of students with
disabilities who were proficient or
above was 6.0%.
For students with disabilities
participating in the AA-MAS (in those
states that offered this assessment),
between 4.7% and 36.0% (based on all
students receiving special education
services) were proficient. The average
proficiency rate for students with
disabilities in these states was 15.1%.
For students with disabilities
participating in the AA-GLAS (in those
states that offered this assessment),
the average percentage of students
proficient and above (based on all
students receiving special education
services) was 4.8%. One state had a
proficiency rate of 0.0%, while the
other had a proficiency rate of 9.7%.
Proficiency rates in unique states that
reported assessment data varied from
0.6% to 23.7% overall (see data
available at
www.nceo.info/APRsnapshot/data).
Rates for the AA-AAS ranged from 0.0% to
6.7%. There were no unique states that
reported data for the AA-GLAS or the
AA-MAS assessments. Proficiency on a
regular assessment made up the bulk of
the overall proficiency rate for
students with disabilities in the unique
states. States reported a range of 0.6%
to 22.5% proficiency on the regular
assessment.
Figure 3. Performance Trends for Eighth
Grade Students with Disabilities on Reading
Assessments
 |
 |
 |
 |
 |
 |
|
Grade 3 |
Grade 4 |
Grade 5 |
Grade 6 |
Grade 7 |
Grade HS |
Click the above images to enlarge Reading graphs for Grades 3-7 and High School.
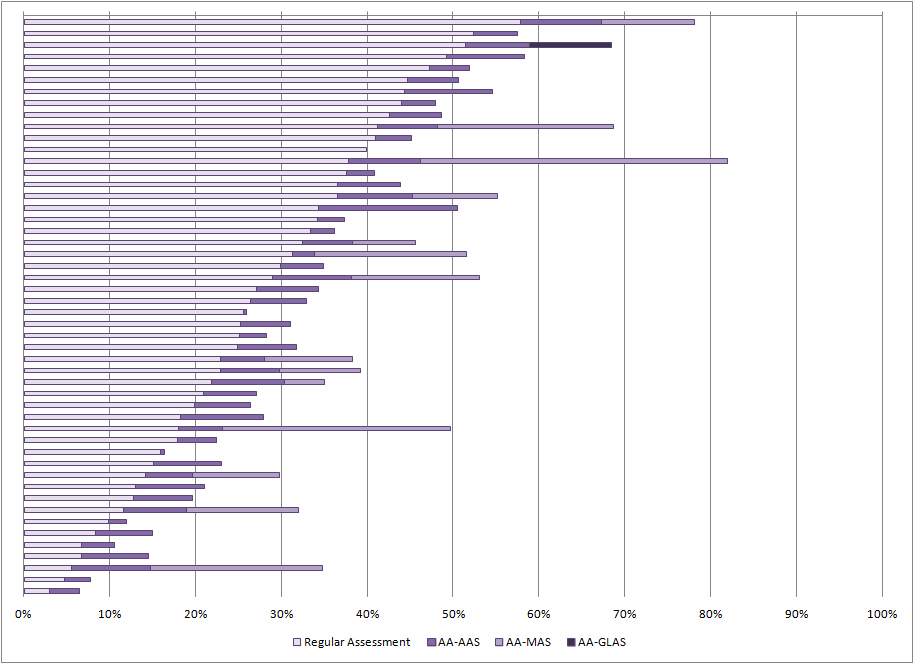
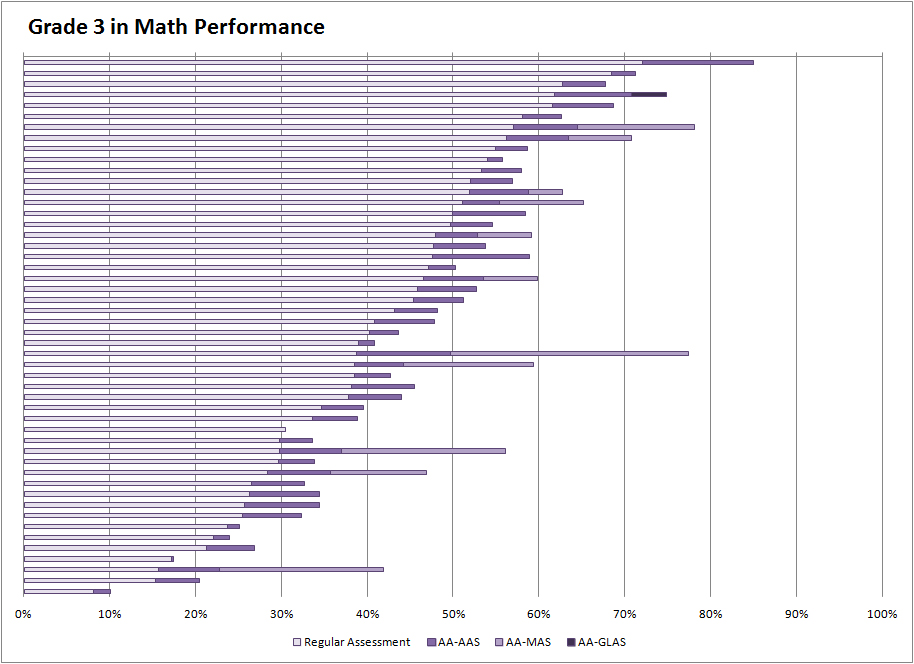
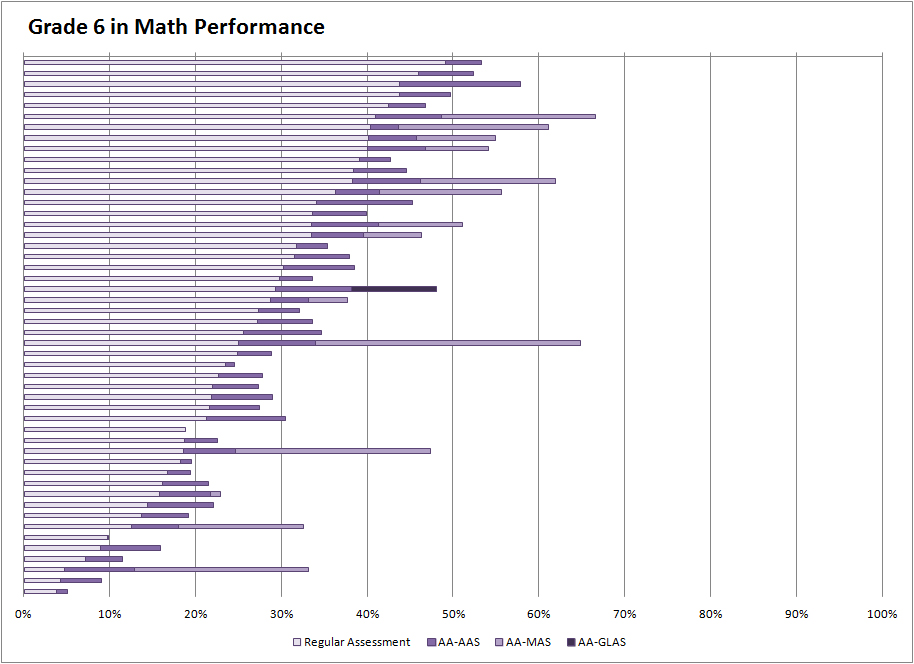
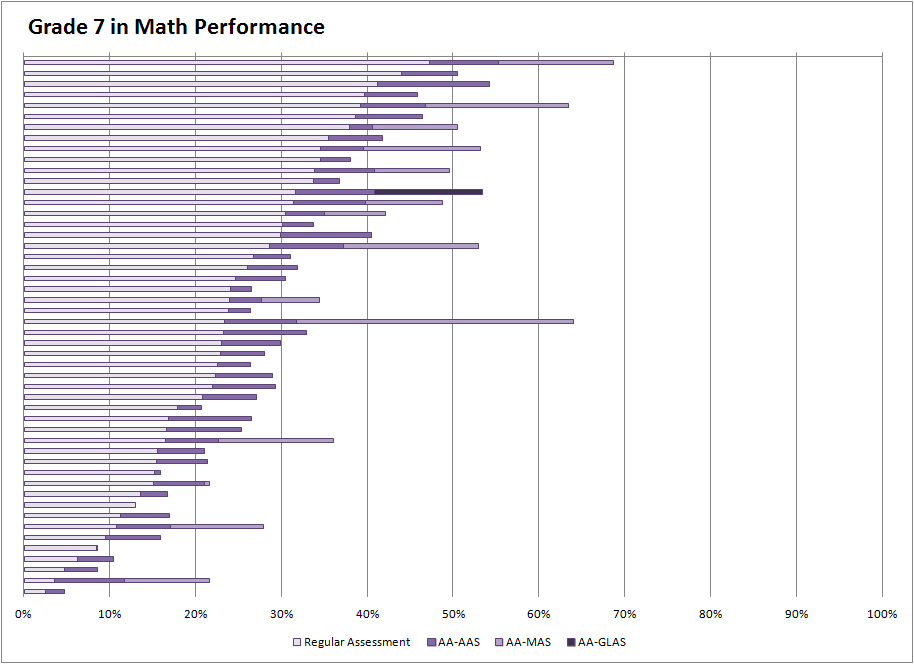
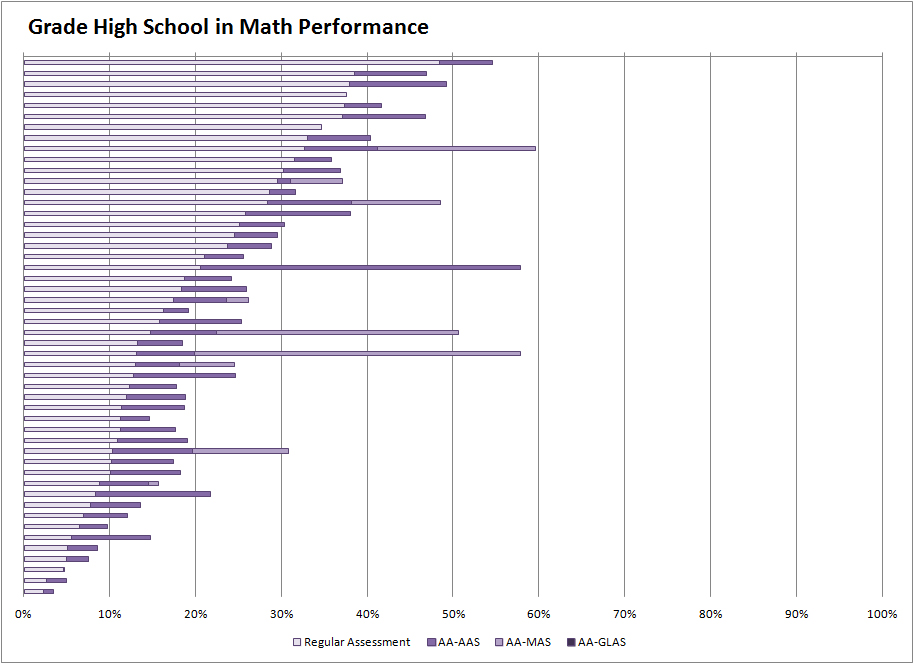
Proficiency in Mathematics
The percentage of students with
disabilities who scored at a proficient
or above level in mathematics was more
variable than participation rates for
mathematics. Proficiency rates for
mathematics were generally lower than
proficiency rates for reading. Figure 4
shows these rates for the 50 states,
ordered by the percentage of students
with disabilities proficient and above
on the regular assessment. Proficiency
rates ranged from 2.0% to 45.7%, with
the average across all states being
22.0%. Fourteen states reported total
proficiency rates of more than 40% and
six states reported total proficiency
rates of more than 50 percent. Ten of
these states had reported proficient
scores for either an AA-MAS or an
AA-GLAS.
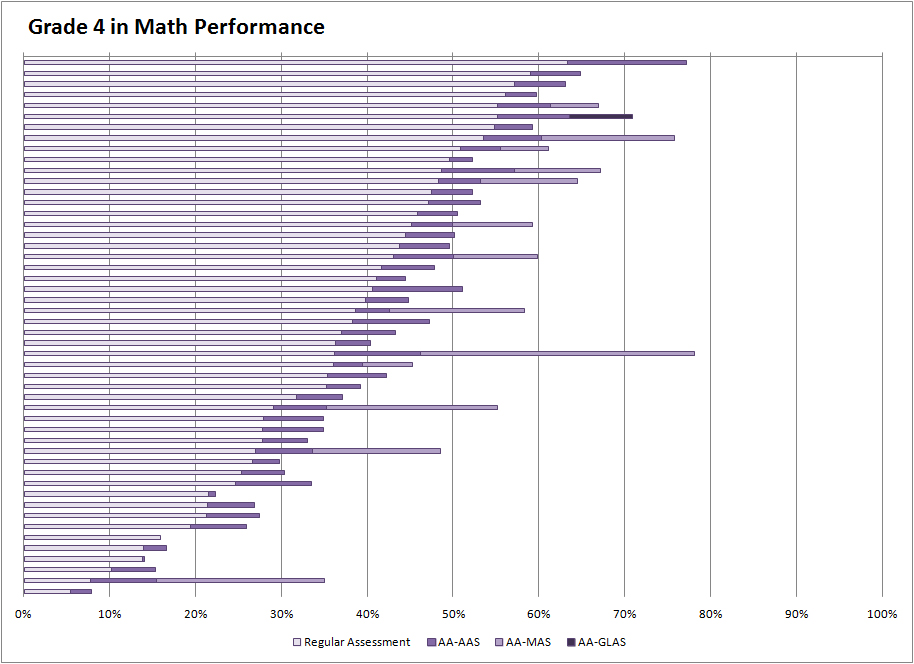
For students with disabilities
participating in the AA-AAS, between
0.0% and 14.1% were proficient or above
(based on all students receiving special
education services, not just those
participating in the AA-AAS). The
average percentage of students
proficient and above was 5.9%.
For students with disabilities
participating in the AA-MAS across the
50 states (in those states that offered
this assessment), between 1.0% and 36.1%
(based on all students receiving special
education services) were proficient. The
average student proficiency rate on this
assessment was 11.1%.
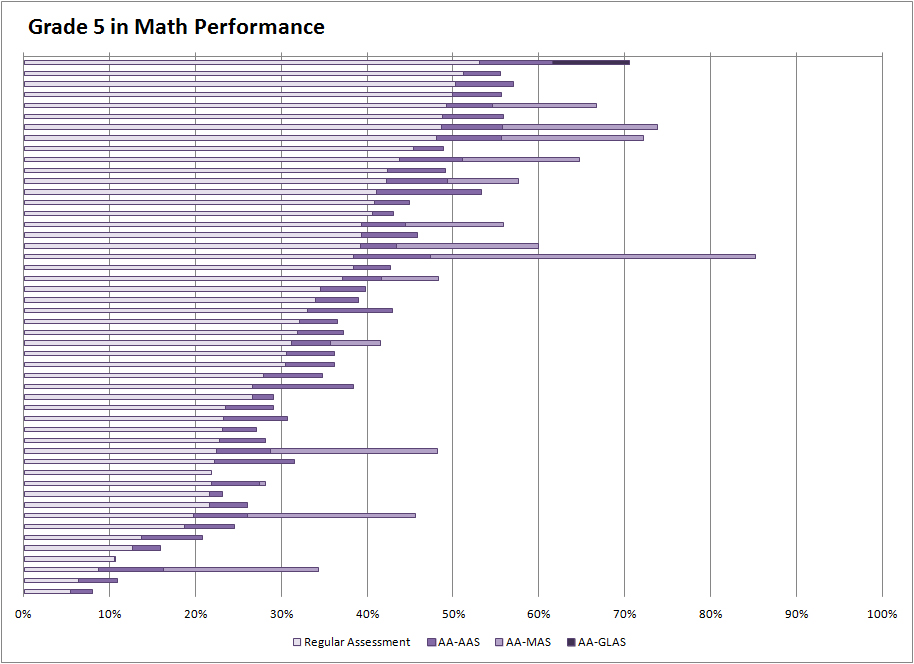
For students with disabilities
participating in the AA-GLAS (in states
that offered this assessment), the
average percentage of students
proficient and above was 5.9% (based on
all students receiving special education
services). One state had a proficiency
rate of 0.0% and the other a proficiency
rate of 9.7%.
Proficiency rates in unique states that
reported assessment data varied from
0.0% to 27.7% overall (see data
available at
www.nceo.info/APRsnapshot/data).
Rates for the AA-AAS ranged from 0.0% to
8.5%. There were no unique states that
reported data for the AA-GLAS or the
AA-MAS assessments. Proficiency on a
regular assessment made up the bulk of
the overall proficiency rate for
students with disabilities in the unique
states. States reported a range of 4.1%
to 19.2% proficiency on the regular
assessment.
Figure 4. Performance Trends for Eighth Grade Students with Disabilities on Mathematics Assessments
 |
 |
 |
 |
 |
 |
|
Grade 3 |
Grade 4 |
Grade 5 |
Grade 6 |
Grade 7 |
Grade HS |
Click the above images to enlarge Math graphs for Grades 3-7 and High School.
Top of page | Table of Contents
Conclusions
The data presented in this report
represent a snapshot of the
participation and performance of
students receiving special education
services on their states' reading and
math assessments. Variability identified
in participation and performance rates
reflects the differences in the state
assessment systems themselves, including
where the proficient cuts were set and
whether alternate assessment options
such as the AA-MAS and AA-GLAS were
available for special education
students.
It is also evident that special
education students generally are showing
higher rates of proficiency on state
reading assessment as compared to state
mathematics assessments. This finding is
similar to previous analyses of state
data (Altman, Rogers, Bremer, & Thurlow,
2010; Altman, Vang, & Thurlow, 2012;
Chudowsky, Chudowsky, & Kober, 2009); and
data from the National Assessment of
Educational Progress (NAEP) (Dee &
Jacob, 2009).
It is also apparent from this snapshot
of the participation and performance of
students with disabilities that
examining their performance levels is
more complicated than it is for students
not receiving special education
services. Students with disabilities are
proficient in varying rates across the
different assessments offered within
states. As one isolates the regular
assessment, it becomes apparent that the
scores on this assessment are likely a
major reason for that discrepancy
(whereas performance on alternate
assessments may be steadier between
content areas).
Top of page | Table of Contents
Resources
Altman, J., Rogers, C., Bremer, C., &
Thurlow, M. (2010). States
challenged to meet special education
targets for assessment indicator
(Technical Report 55). Minneapolis,
MN: University of Minnesota, National
Center on Educational Outcomes.
Altman, J., Vang, M., & Thurlow, M.
(2012). 2008-2009 APR snapshot #1:
State assessment participation and
performance of special education
students. Minneapolis, MN:
University of Minnesota, National Center
on Educational Outcomes.
Chudowsky N., Chudowsky V., & Kober, N.
(2009) State test score trends
through 2007-08, part 4: Has progress
been made in raising achievement for
students with disabilities?
Washington D. C.: Center on Education
Policy.
Dee, T., & Jacob, B. (2009). The
impact of No Child Left Behind on
student achievement (NBER Working Paper
No. 15531). Cambridge, MA: National
Bureau of Economic Research (see
www.nber.org/papers/W15531/a>).