Yi-Chen Wu and Martha Thurlow
July, 2019
All rights reserved. Any or all portions of this document may be reproduced and distributed without prior permission, provided the source is cited as:
Wu, Y.-C. & Thurlow, M. L. (2019). 2016-2017 APR snapshot #21: AA-AAS participation and performance. Minneapolis, MN: University of Minnesota, National Center on Educational Outcomes.
An Alternate Assessment based on Alternate Achievement Standards (AA-AAS) has been developed by each state to measure the academic achievement of students with significant cognitive disabilities. This brief summarizes AA-AAS data used for Elementary and Secondary Education Act (ESEA) accountability. Using federally submitted data from the 2016-2017 school year, we present information on the number of students participating in the AA-AAS and the performance of those students.
AA-AAS participation and performance data for 47 states are reported in this brief; three states’ data were not available for this analysis because data were not reported. Participation and performance data for grade 8 (or grades 4 and 8) are presented in this report; figures displaying data for other grades are provided in this report following each figure. Data tables for all grades are available at nceo.info/Resources/publications/APRsnapshot/data.
Calculations for this brief used only data available through state-submitted Annual Performance Reports (APRs). Two types of participation rates and one proficiency rate were calculated for this brief. One of the participation rates used the number of enrolled students with disabilities as the denominator, and the other one used the number of total tested students as the denominator. The denominator for the proficiency rate was the number of students with disabilities who participated in the AA-AAS. The number of enrolled students was calculated by adding together the number of students with disabilities participating in each of a state’s assessments, plus any students with medical exemptions and any students who did not participate in an assessment. Typically, the state assessments included the regular assessment and the alternate assessment based on alternate achievement standards (AA-AAS). In some states other assessments were also available, most notably an alternate assessment based on grade-level achievement standards (AA-GLAS). The number of enrolled students with disabilities was calculated separately for reading and mathematics assessments for each grade.
Throughout this report, we use the term “students with disabilities” to refer to students receiving special education services. Thus, students on 504 accommodation plans are not included in these analyses.
Top of page | Table of Contents
Forty-six states reported data on reading AA-AAS participation and proficiency and 47 states reported data on both reading and math AA-AAS. The regular assessment data from one of these states were suppressed due to data quality issues for both participation and performance data and the performance data from another state were suppressed due to the small cell size; participation data were available for these states. Thus, participation rates based on students with disabilities was available for 49 states.
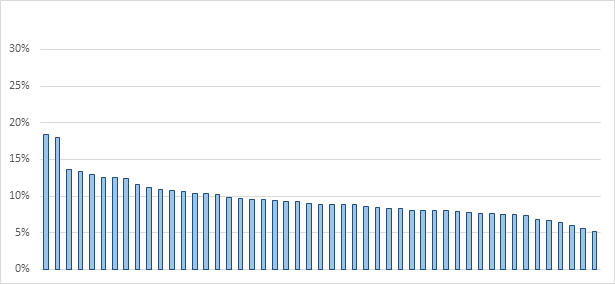
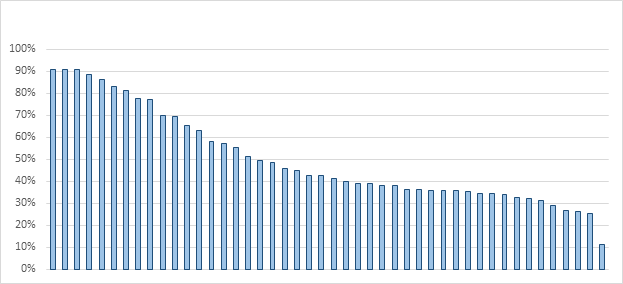
Overall statewide participation in the grade 8 reading AA-AAS, based on the number of students with disabilities, in 49 regular states is presented in Figure 1. For the majority of states (n = 33), less than 10% of all students with disabilities took the AA-AAS in 2016-2017. Similar participation rates existed for grade 8 mathematics AA-AAS (n = 32).
Figure 1. Participation Rates for Grade 8 Reading AA-AAS (Based on Students with Disabilities) in Regular States
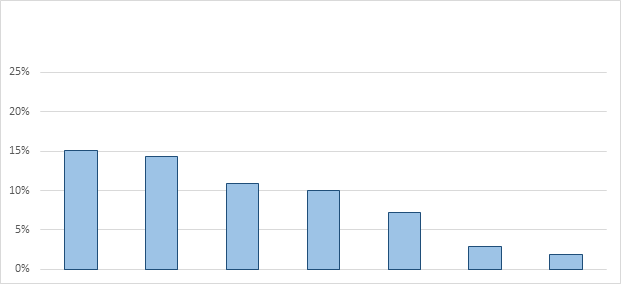
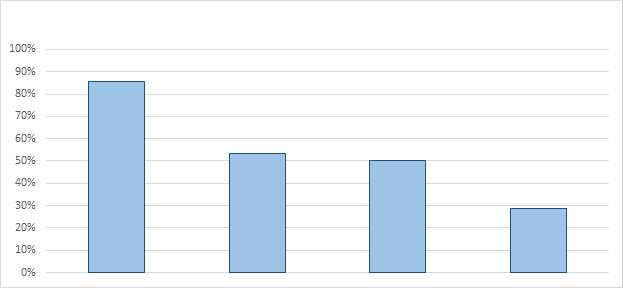
Participation rates in unique states that reported data greater than zero for both Grade 8 regular reading assessments and reading AA-AAS (n = 7) are presented in Figure 2. The participation rates varied from 1.8% to 15.1% of students with disabilities. Data for the unique states are available at nceo.info/Resources/publications/APRsnapshot/data.
Figure 2. Participation Rates for Grade 8 Reading AA-AAS (Based on Students with Disabilities) in Unique States
Regular States Grades 3 - 7 and High School Reading. Click the images to enlarge.
Grade 3 |
Grade 4 |
Grade 5 |
Grade 6 |
Grade 7 |
Grade HS |
Regular States Grades 3 - High School Mathematics. Click images to enlarge.
Grade 3 |
Grade 4 |
Grade 5 |
Grade 6 |
Grade 7 |
Grade 8 |
Grade HS |
Unique States: Grades 3 - 7 and High School Reading. Click the images to enlarge.
Grade 3 |
Grade 4 |
Grade 5 |
Grade 6 |
Grade 7 |
Grade HS |
Unique States: Grades 3 - High School Mathematics. Click images to enlarge.
Grade 3 |
Grade 4 |
Grade 5 |
Grade 6 |
Grade 7 |
Grade 8 |
Grade HS |
States varied in their rates of students receiving special education services, from 8.7% to 17.5% of the total student population, so it is important to look at participation rates based on the total student population as well. (Percentage of students with disabilities is based on the students between ages 6-21; https://www2.ed.gov/programs/osepidea/618-data/static-tables/2016-2017/part-b/child-count-and-educational-environment/1617-bchildcountandedenvironment-8.xlsx.) To be consistent with federal requirements for calculating participation in the AA-AAS, the analysis was based on the number of test takers with valid scores (total tested) at each grade level; these numbers were obtained from the U.S. Department of Education.
The rates of total tested students participating in the AA-AAS for the grade 8 reading AA-AAS in 49 regular states are presented in Figure 3. States typically assessed less than 2 percent of their total tested student population (which included both students with disabilities and students without disabilities) using the reading AA-AAS; only about one-sixth of states (n = 8) were below 1 percent. Similar participation rates existed for grade 8 mathematics AA-AAS when viewed in terms of the total tested student population; one out of every seven states (n = 7) was below 1 percent.
Figure 3. Participation Rates for Grade 8 Reading AA-AAS (Based on Total Tested Grade 8 Students) in Regular States
Participation rates in unique states (n = 7) reporting greater than zero students participating in both the grade 8 regular reading assessment and reading AA-AAS are presented in Figure 4. The denominators are the number of test takers with valid scores. These unique states reported participation rates ranging from as low as 0.9% to as high as 16.7%. Data for the unique states are included in data tables available at nceo.info/Resources/publications/APRsnapshot/data.
Figure 4. Participation Rates for Grade 8 Reading AA-AAS (Based on Total Tested Grade 8 Students) in Unique States
Grades 3 - 7 and High School Reading. Click the images to enlarge.
Grade 3 |
Grade 4 |
Grade 5 |
Grade 6 |
Grade 7 |
Grade HS |
Grades 3 - High School Mathematics. Click images to enlarge.
Grade 3 |
Grade 4 |
Grade 5 |
Grade 6 |
Grade 7 |
Grade 8 |
Grade HS |
Unique States: Grades 3 - 7 and High School Reading. Click the images to enlarge.
Grade 3 |
Grade 4 |
Grade 5 |
Grade 6 |
Grade 7 |
Grade HS |
Unique States: Grades 3 - High School Mathematics. Click images to enlarge.
Grade 3 |
Grade 4 |
Grade 5 |
Grade 6 |
Grade 7 |
Grade 8 |
Grade HS |
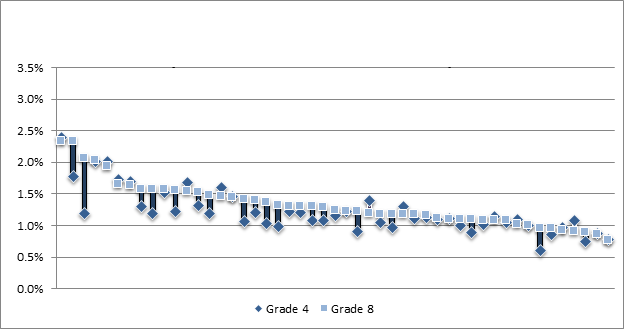
Figure 5 shows reading AA-AAS participation rates (based on the total tested population of all students) for grade 4 and grade 8 in regular states. Across these states, an average of 1.2 percent of the total population of students participated in the AA-AAS at grade 4 and 1.3 percent at grade 8. Differences between the two grades did not show any consistent trends. The majority of states (n = 16) reported higher rates in grade 4 than in grade 8. More than half of the states (n = 33) reported higher rates in grade 8 than in grade 4.
Figure 5. Participation Rates for Reading AA-AAS (Based on Total Tested Students) in Grades 4 and 8 in Regular States
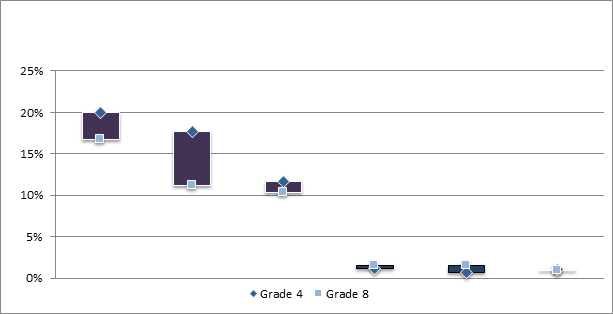
Six unique states reported more than zero students with disabilities participating in both the regular reading assessment and the reading AA-AAS at grades 4 and 8. The majority of unique states (n = 4) showed a slightly higher participation rate (based on the total tested population) in grade 4 than in grade 8. The other two unique states reported higher participation rates in grade 8 than in grade 4.
Figure 6. Participation Rates for Reading AA-AAS (Based on Total Tested Students) in Grades 4 and 8 in Unique States
Grades 4 & 8 vs. High School Reading. Click the images to enlarge.
| Grade 4 vs HS | Grade 8 vs HS |
Grades 4 vs. 8 4 &8 vs. High School Math. Click images to enlarge.
| Grade 4 vs 8 | Grade 4 vs HS | Grade 8 vs HS |
Unique States: Grades 4 & 8 vs. High School Reading. Click the images to enlarge.
| Grade 4 vs HS | Grade 8 vs HS |
Unique States: Grades 4 vs. 8, 4 &8 vs. High School Math. Click images to enlarge.
| Grade 4 vs 8 | Grade 4 vs HS | Grade 8 vs HS |
The 1% cap on participation in the AA-AAS required by the Every Student Succeeds Act (ESSA) is to be calculated by content across all tested grades. (ESSA indicates that the calculation is based on the number of total tested students.) In this analysis, we examine not only the total participation rate across grade levels, but also the contribution of each grade to the total participation rate based on all test takers.
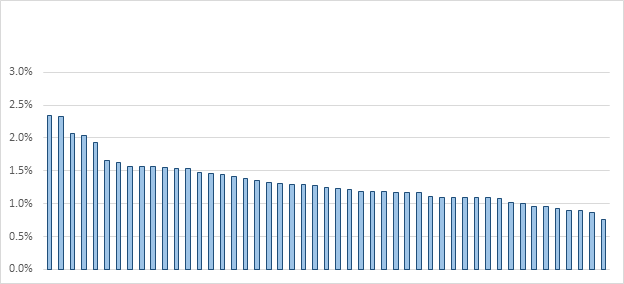
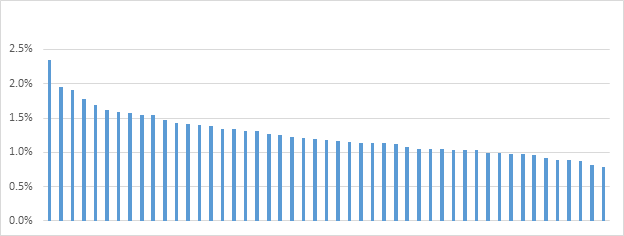
AA-AAS data from 48 regular states are included in this analysis of participation rates in the reading AA-AAS at grades 3-8 and high school. Two states’ data were excluded: one state’s data were suppressed due to data quality issues; the other state’s data were excluded because the state received a waiver to not report regular assessment data at the high school level. Figure 7 shows the participation rates of students participating in the reading AA-AAS in the regular states. Only ten states reported a participation rate that was less than 1%. The average rate across the states was 1.2%, with a range of 0.8% to 2.3%. Similar participation rates existed for mathematics AA-AAS (see Figure 8).
Figure 7. Overall Participation Rates for Reading AA-AAS Across All Grade Levels (Based on Total Tested Students)
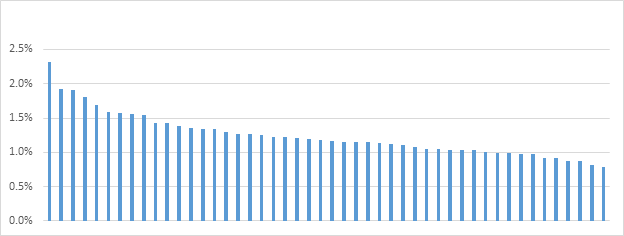
Figure 8. Overall Participation Rates for Math AA-AAS Across All Grade Levels (Based on Total Tested Students)
AA-AAS data from 46 regular states are included in this analysis of proficiency for reading and 47 states for math assessments at grade 8. Data from four states were not included because data were suppressed either because of data quality issues or small cell sizes.
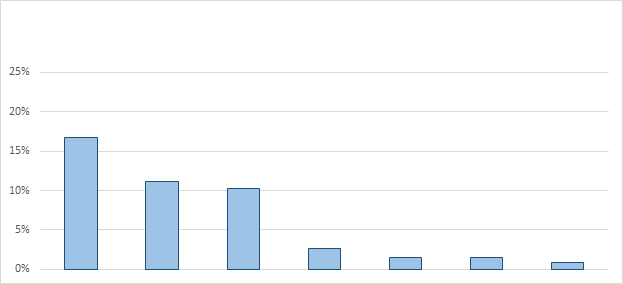
Figure 9 shows the rates of students participating in the reading AA-AAS who were proficient or above in grade 8 in the regular states. The denominator is the number of students who participated in the AA-AAS and the numerator is the number of students who participated in the AA-AAS and scored at or above proficient. Proficiency rates ranged from 11.4% to 91.1% of students participating in the AA-AAS. In three states, more than 90% of the students participating in the AA-AAS were proficient or above. In five states, less than 30% of students who participated in the AA-AAS were considered proficient.
The range of percentages of grade 8 students who were proficient or above on the mathematics AA-AAS was from 2.0% to 91.5%, with 20 states showing less than 30% of students participating in math AA-AAS considered proficient. Proficiency data for regular states are available at nceo.info/Resources/publications/APRsnapshot/data.
Figure 9. Proficiency Rates for Grade 8 Reading AA-AAS in Regular States
Rates of students proficient or above on the reading AA-AAS in unique states for grade 8 are presented in Figure 10. Four of the unique states reported proficiency rates for students in grade 8 for reading and five unique states reported proficiency rates in math. In reading, rates of students with disabilities proficient or above varied from 28.6% to 85.7%, while the rates of students proficient or above in math varied from 23.8% to 85.7%. Proficiency data for the unique states are available at nceo.info/Resources/publications/APRsnapshot/data.
Figure 10. Proficiency Rates for Grade 8 Reading AA-AAS in Unique States
Grades 3 - 7 and High School Reading. Click the images to enlarge.
| Grade 3 | Grade 4 | Grade 5 | Grade 6 | Grade 7 | Grade HS |
Grades 3 - High School Math. Click images to enlarge.
| Grade 3 | Grade 4 | Grade 5 | Grade 6 | Grade 7 | Grade 8 | Grade HS |
Unique States Grades 3 – 5, 7, 8, and High School Reading. Click the images to enlarge.
| Grade 3 | Grade 4 | Grade 5 | Grade 6 | Grade 7 | Grade HS |
Unique States: Grades 3 - High School Math. Click images to enlarge.
| Grade 3 | Grade 4 | Grade 5 | Grade 6 | Grade 7 | Grade 8 | Grade HS |
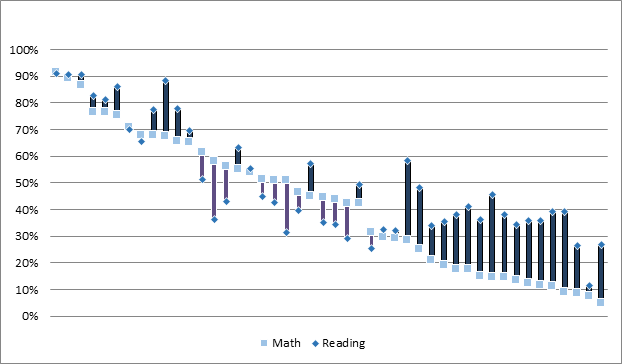
Figure 11 provides a comparison of the percentage of students proficient on the AA-AAS in grade 8 for reading and mathematics in regular states. This figure shows states ordered by proficiency rates for math AA-AAS from high to low. Forty-six states reported proficiency data for both reading and math assessments. A majority of states (n = 32) reported higher proficiency rates for the reading AA-AAS compared to the math AA-AAS; 14 states had higher rates of proficiency on the math AA-AAS.
Figure 11. Proficiency Rates for Grade 8 Reading and Math AA-AAS in Regular States
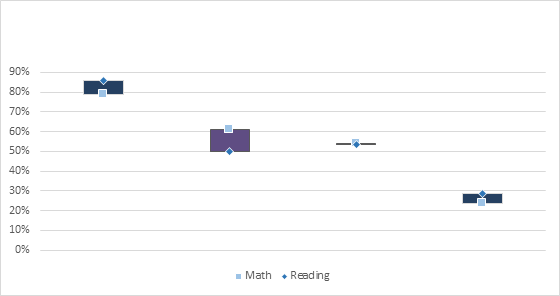
A comparison of the percentage of students proficient on the AA-AAS in grade 8 in unique states for reading and mathematics is shown in Figure 12. Four of 10 unique states reported proficiency rates for both reading and math in grade 8. Two unique states showed a higher proficiency rate for reading compared to math and two others showed a higher proficiency rate for math compared to reading; the fourth unique state had approximately the same rates for reading and math.
Figure 12. Proficiency Rates for Grade 8 Reading and Math AA-AAS in Unique States
Grades 3 - 7 and High School. Click the images to enlarge.
| Grade 3 | Grade 4 | Grade 5 | Grade 6 | Grade 7 | Grade HS |
Unique states: Grades 3 - 7 and High School. Click the images to enlarge.
| Grade 3 | Grade 4 | Grade 5 | Grade 6 | Grade 7 | Grade HS |
Top of page | Table of Contents
The data presented in this report represent a snapshot of the participation and performance of students with disabilities who participate in the Alternate Assessment based on Alternate Achievement Standards (AA-AAS). To some extent, variability in the participation and performance rates reflects the differences in the states’ AA-AAS themselves, including where the proficient cuts were set.
The participation rates described in this report are provided in two ways: (1) based on the total number of students with disabilities in a grade for each content area; and (2) based on the total tested population in a grade for each content area. Participation rates under each approach were fairly consistent across states. Participation rates for the AA-AAS tend to be higher than one percent of the total tested population of students (or about 10 percent of all students with disabilities).
Proficiency rates were extremely variable across states, with most states having quite high rates of students in the AA-AAS deemed proficient or above. Still, the rates do not appear to be influenced by the percentage of students participating in the AA-AAS. Proficiency rates were slightly higher for reading compared to mathematics.
According to the U.S. Department of Education (Quenemoen & Thurlow, 2007), holding students who participate in the AA-AAS to high expectations greatly increases the learning opportunities provided to those students (see also Quenemoen & Thurlow, 2019; Thurlow & Quenemoen, 2019). It is important to keep these expectations in mind when examining proficiency rates of students with significant cognitive disabilities compared to proficiency rates of students with disabilities on the regular assessment (see Thurlow & Wu, 2016, 2018; Wu & Thurlow, 2017).
Top of page | Table of Contents
Kearns, J. F., Towles-Reeves, E, Kleinert, H. L, Kleinert, J. O., & Thomas, M. K. (2011). Characteristics of and implications for students participating in alternate assessments based on alternate achievement standards. Journal of Special Education, 45(1), 3-14.
Quenemoen, R. (2008). A brief history of alternate assessments based on alternate achievement standards (Synthesis Report 68). Minneapolis, MN: University of Minnesota, National Center on Educational Outcomes.
Quenemoen, R., & Thurlow, M. (2007). Learning opportunities for your child through alternate assessments. Washington, DC: U.S. Department of Education, Office of Special Education and Rehabilitative Services.
Quenemoen, R. F., & Thurlow, M. L. (2019). Students with disabilities in educational policy, practice, and professional judgment: What should we expect? (NCEO Report 413). Minneapolis, MN: University of Minnesota, National Center on Educational Outcomes.
Thurlow, M. L., & Quenemoen, R. F. (2019). Revising expectations for students with disabilities (NCEO Brief 17). Minneapolis, MN: University of Minnesota, National Center on Educational Outcomes.
Thurlow, M., & Y.-C. Wu (2016). 2013-2014. APR snapshot #12: State assessment participation and performance of students receiving special education services. Minneapolis, MN: University of Minnesota, National Center on Educational Outcomes.
Y.-C. Wu, & Thurlow, M. (2017). 2014-2015. APR snapshot #15: State assessment participation and performance of students receiving special education services. Minneapolis, MN: University of Minnesota, National Center on Educational Outcomes.
Thurlow, M., & Y.-C. Wu (2018). 2015-2016. APR snapshot #18: State assessment participation and performance of students receiving special education services. Minneapolis, MN: University of Minnesota, National Center on Educational Outcomes.
Thurlow, M. L., Wu, Y., Quenemoen, R. F., & Towles, E. (2016). Characteristics of students with significant cognitive disabilities (NCSC Brief #8). Minneapolis, MN: University of Minnesota, National Center and State Collaborative.
Wu, Y.-C., Thurlow, M. L., Albus, D. A., & Liu, K. (2019). Percent of Students with Disabilities by Disability Category for 2005-06 to 2016-17 (Data Analytics #8). Minneapolis MN: University of Minnesota, National Center on Educational Outcomes.