2013-2014 APR Snapshot #11:
Yi-Chen Wu and Martha Thurlow May 2016 All rights reserved. Any or all portions of this document may be reproduced and distributed without prior permission, provided the source is cited as: Wu, Y. C., & Thurlow, M. (2016). 2013-2014 APR snapshot #11: Assessment accommodations use by students receiving special education services. Minneapolis, MN: University of Minnesota, National Center on Educational Outcomes. Table of Contents
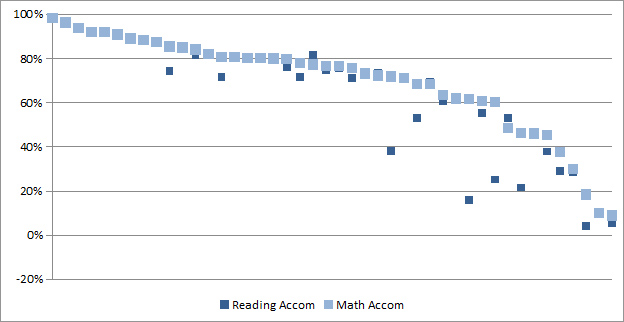
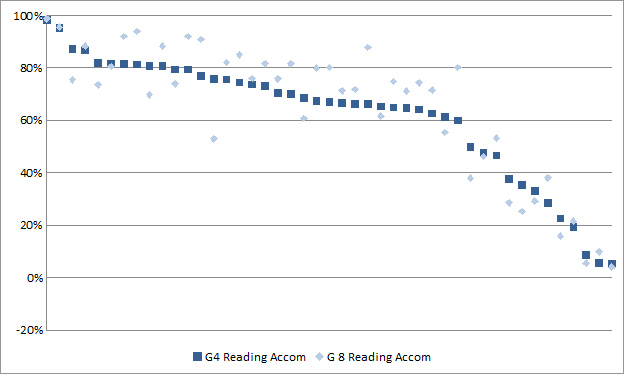
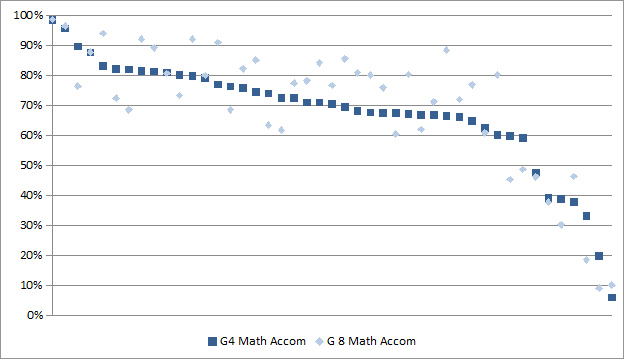
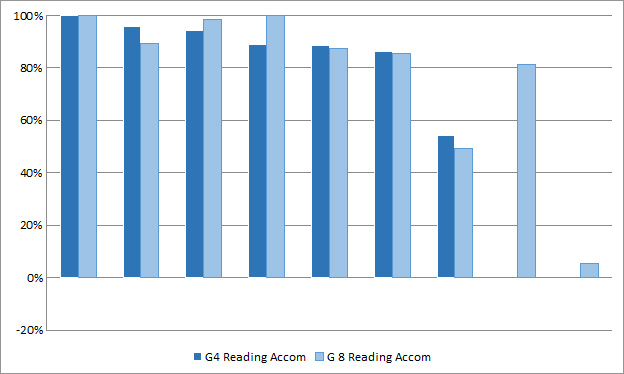
BackgroundAssessment accommodations are changes in testing materials or procedures that allow students to show their knowledge and skills rather than the effects of their disabilities. This brief provides information on the number of students with disabilities using accommodations and the performance of these students on the general statewide assessment used for Elementary and Secondary Education Act (ESEA) accountability. Using federally submitted data from the 2013-2014 school year, we present information on accommodations for reading and mathematics statewide assessments administered to grade 8 students (and grade 4 to show a comparison to grade 8 data). States provided both field test data and non-field test data. Rates of students using accommodation presented in this brief were calculated using only non-field test data. Figures displaying statewide accommodations data for other grades are provided in this report via links following each figure. Data tables for all grade levels are available from NCEO at https://nceo.info/Resources/publications/APRsnapshot/data. Throughout this report, we use the term "students with disabilities" to refer to students receiving special education services. Thus, students on 504 accommodation plans are not included in these analyses. Top of page | Table of Contents FindingsAccommodations Use for Reading and Mathematics AssessmentFigure 1 shows the percentage of students with disabilities in regular states using accommodations during statewide reading and mathematics assessments in grade 8. The states are ordered from those that have the highest percentages of students using accommodations for the regular mathematics assessment to those that have the lowest percentages of students using accommodations for this assessment. The figure indicates visible differences between the percentage of students with disabilities using accommodations for mathematics and reading assessments were evident in at least 10 states. Twelve states reported a difference in accommodation rates between content areas of more than 5 percentage points, and in all cases smaller percentages of students with disabilities used accommodations in reading than in math assessments. The figure also shows that in 15 states, more than 80 percent of students with disabilities used accommodations during both the statewide reading and mathematics assessments; in 4 states, 25 percent or fewer students used accommodations during testing in both reading and math (see data available at https://nceo.info/Resources/publications/APRsnapshot/data). The percentages of students with disabilities using accommodations in math was likely to be equal to or higher than the percentage of students using accommodations in reading assessments across all the grades. Figure 1. Percentage of Grade 8 Students with Disabilities Using Accommodations in 2013-2014 Reading and Mathematics Assessments in Regular States
Grade 3-7 and High School. Click the below images to enlarge.
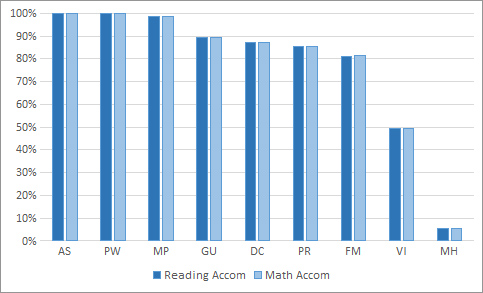
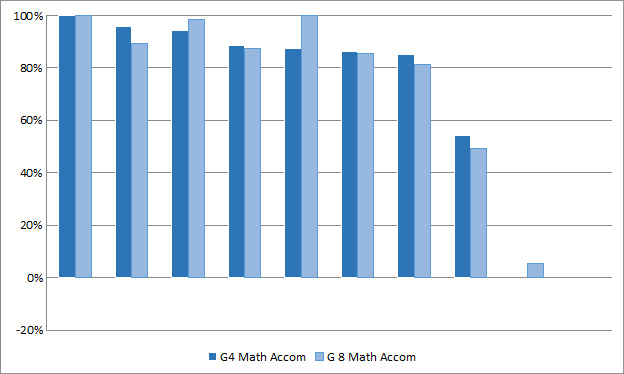
Figure 2 shows the percentage of students with disabilities in the unique states using accommodations during statewide reading and mathematics assessments in grade 8. Differences between reading and mathematics accommodations among the unique states that reported data in grade 8 (n = 9) was less than 0.2 percentage points. Six of these states showed no difference between the percentages of students receiving accommodations for reading and for mathematics assessments. Seven unique states had more than 80 percent of students using accommodations for both reading and mathematics. Two unique states reported that 100% of students with disabilities used accommodations for both reading and mathematics assessments (see data tables available at www.nceo.info/APRsnapshot/data). Figure 2. Percentage of Grade 8 Students with Disabilities Using Accommodations in 2013-2014 Reading and Mathematics Assessments in Unique States
Grade 3-7 and High School. Click the below images to enlarge.
|
 |
 |
 |
 |
 |
 |
Grade 3 |
Grade 4 |
Grade 5 |
Grade 6 |
Grade 7 |
Grade HS |
Grades 3 - High School Math. Click the below images to enlarge.
 |
 |
 |
 |
 |
 |
 |
Grade 3 |
Grade 4 |
Grade 5 |
Grade 6 |
Grade 7 |
Grade 8 |
Grade HS |
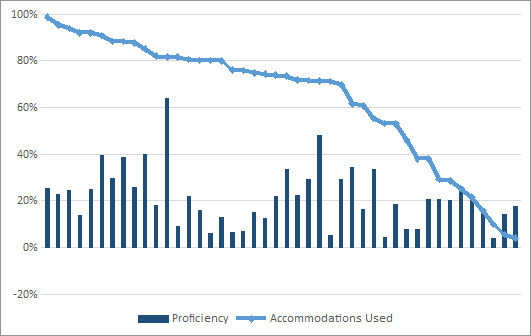
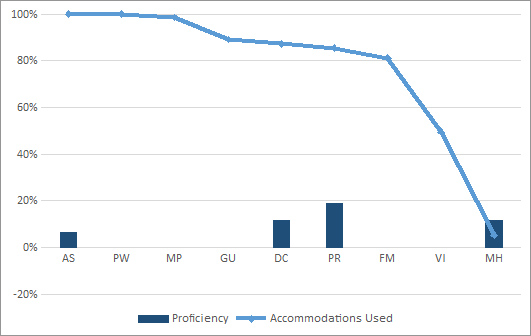
The same finding of no apparent relationship was true in unique states (see Figure 8). State data for unique states (n = 9) are available in data tables available at https://nceo.info/Resources/publications/APRsnapshot/data. The proficiency rates in unique state regular reading assessment for 8th graders ranged from as low as 6.6 percent to as high as 18.7 percent while accommodation rates varied. For example, the unique state with the lowest reading proficiency rate did not have the highest rate of students with disabilities using accommodations on regular reading assessments across grade levels.
Figure 8. Percentage of Grade 8 Students with Disabilities Scoring Proficient or Above and Percentage of Grade 8 Students with Disabilities Using Accommodations in 2013-2014 Reading Regular Assessments in Unique States
Grade 3 - 7 and High School Reading. Click the below images to enlarge.
 |
 |
 |
 |
 |
 |
Grade 3 |
Grade 4 |
Grade 5 |
Grade 6 |
Grade 7 |
Grade HS |
Grades 3 - High School Math. Click the below images to enlarge.
 |
 |
 |
 |
 |
 |
 |
Grade 3 |
Grade 4 |
Grade 5 |
Grade 6 |
Grade 7 |
Grade 8 |
Grade HS |
Top of page | Table of Contents
Conclusions
The information presented in this report summarizes the accommodations data submitted by states to the U.S. Department of Education for the year 2013-2014. Considerable variability among states was evident in the percentage of students with disabilities using accommodations on the grade 8 reading and mathematics statewide assessments. Further, in many states more students with disabilities received accommodations for the mathematics assessment than received them for the reading assessment. Also evident were differences in many states between the percentages of students using accommodations in grade 8 compared to grade 4, with a slight trend toward a higher percentage of students with disabilities using accommodations at the grade 8 level. Finally, there appeared to be no relation between the percentage of students with disabilities using accommodations and the percentage proficient on the grade 8 regular reading assessment.
Top of page | Table of Contents
Resources
Lazarus, S. S., Thurlow, M. L., Lail, K. E., & Christensen, L. (2009). A longitudinal analysis of state accommodations policies: Twelve years of change, 1993-2005. Journal of Special Education, 43(2), 67-80.
Rogers, C. M., Lazarus, S. S., & Thurlow, M. L. (2016). A summary of the research on the effects of test accommodations: 2013-2014 (NCEO Report 402). Minneapolis, MN: University of Minnesota, National Center on Educational Outcomes.
Thurlow, M., & Vang, M. (2013). 2010-2011 APR snapshot #5: Assessment accommodations use by students receiving special education services. Minneapolis, MN: University of Minnesota, National Center on Educational Outcomes.
Vang, M., & Thurlow, M. (2015). 2011-2012 APR snapshot #8: Assessment accommodations use by students receiving special education services. Minneapolis, MN: University of Minnesota, National Center on Educational Outcomes.
Vang, M., Thurlow, M., & Altman, J. (2012). 2008-2009 APR snapshot #2: Assessment accommodations use by special education students. Minneapolis, MN: University of Minnesota, National Center on Educational Outcomes.